Lifestyle Intervention in Pregnant Women With Obesity Impacts Cord Blood DNA Methylation, Which Associates With Body Composition in the Offspring
←
→
Page content transcription
If your browser does not render page correctly, please read the page content below
854                                                                                                                          Diabetes Volume 70, April 2021

                  Lifestyle Intervention in Pregnant Women With Obesity
                  Impacts Cord Blood DNA Methylation, Which Associates
                  With Body Composition in the Offspring
                  Josefine Jönsson,1 Kristina M. Renault,2,3 Sonia García-Calzón,1,4 Alexander Perfilyev,1
                  Angela C. Estampador,5 Kirsten Nørgaard,6 Mads Vendelbo Lind,7 Allan Vaag,6 Line Hjort,8
                  Kim F. Michaelsen,7 Emma Malchau Carlsen,7,9 Paul W. Franks,5 and Charlotte Ling1
                  Diabetes 2021;70:854–866 | https://doi.org/10.2337/db20-0487

                  Maternal obesity may lead to epigenetic alterations in the                         mediates the effect of the lifestyle intervention on lean
                  offspring and might thereby contribute to disease later in                         mass in the offspring (FDR
diabetes.diabetesjournals.org Jönsson and Associates 855
As gestational weight gain (GWG) affects the health of advice and measuring weight. Participants in both PA 1 D
the mother and offspring, the Institute of Medicine rec- and PA were encouraged to obtain 11,000 steps daily. We
ommends women with prepregnancy BMI .30 kg/m2 to based our physical activity recommendation on our pre-
limit their GWG to 5–9 kg (1). We have reported that GWG vious study of step counts among pregnant women and
can be reduced by lifestyle interventions (9) and was added 50% to increase physical activity (21). If this was not
positively associated with fat mass in infants born to achievable, they were asked to set their own goal.
mothers with obesity (10,11) and with carbohydrate intake Due to participants having miscarriages, withdrawing
in late pregnancy (12). Subsequently, lifestyle interven- from the study, and moving from the region, 389 women
tions might improve the cardiometabolic profile of preg- completed the study (Fig. 1). Maternal age, prepregnancy
nant mothers with obesity and their offspring. BMI, maternal educational level, and previous childbirths
Epigenetic alterations, such as DNA methylation, may (parity) were recorded at enrollment (weeks 11–14). Smok-
occur following intrauterine perturbations caused by obe- ing during pregnancy was acquired through medical
sity and excess GWG (13,14). DNA methylation regulates records, GWG was determined by subtracting self-reported
gene expression, X-chromosome inactivation, imprinting, prepregnancy weight with weight measured during weeks
and cell differentiation (13). Intrauterine epigenetic alter- 36 and 37, and energy intake was attained from self-
ations may therefore affect future health outcomes in the administered validated Food Frequency Questionnaires at
offspring (15). For example, early maternal exposures such weeks 11–14 and 36–38. Detailed information on enroll-
as gestational diabetes, pregestational obesity, and famine ment, conduction of the trial, and clinical measurements is
were linked to dysregulated gene function in early life by reported elsewhere (9,12).
altered DNA methylation (16–19), and dietary interven- DXA scans were performed within 48 h of birth to
tions during pregnancy impact the offspring epigenome assess offspring body composition. Offspring measure-
(20). However, to our knowledge, it remains unknown ments of interest for this study were: lean mass at birth
whether interventions in pregnant women with obesity and growth, in which BMI z scores at birth and at 9, 18,
affect the epigenetic pattern in cord blood and whether and 36 months of age were used (Fig. 1). Data collection
this is associated with body composition and growth in and body composition assessment in the offspring are
their offspring. further described (10,22).
Our aim was to investigate whether a lifestyle interven- Cord blood was collected from the umbilical vein of the
tion including physical activity with and without advice on clamped umbilical cord at birth. Samples were immediately
a low-energy Mediterranean-style diet in pregnant women frozen (280°C) and stored in a biobank at Copenhagen
with obesity from the Treatment of Obese Pregnant women University Hospital Hvidovre. Whole-cord blood samples
(TOP)-study (9) is associated with DNA methylation alter- were available for 232 participants (Fig. 1).
ations in offspring cord blood. We then tested whether
specific epigenetic marks in cord blood are associated with DNA Methylation Analyses
body composition in the offspring at birth and growth Cord blood DNA was extracted using the QIAamp 96 DNA
during the first 3 years of life. Blood Kit. DNA concentration and purity were determined
using NanoDrop (NanoDrop Technologies, Inc.). Eight
RESEARCH DESIGN AND METHODS samples had DNA concentrations that were too low. Bi-
Design and Clinical Data of the TOP-Study sulfite conversion was performed using the EZ-96 DNA
The TOP-study was approved by the Ethics Committee for methylation kit (Zymo Research Corporation, Irvine, CA),
the Capital Region of Denmark (January 2009, H-D-2008– according to the manufacturer’s instructions. Six samples
119; Hillerød, Denmark) and registered at ClinicalTrials.gov failed bisulfite conversion. DNA methylation was measured
(NCT01345149). Before enrollment, written informed con- using Illumina Infinium HumanMethylation450 BeadChips
sent was obtained from all participants. (Illumina, San Diego, CA), covering 485,577 sites (23).
The TOP-study is a randomized controlled trial of 425 Illumina iScan was used to image the Infinium Human-
pregnant women with obesity including two lifestyle in- Methylation450K BeadChips. Three samples were removed
tervention groups—physical activity assessed with pedom- due to missing data regarding GWG (a covariate in the
eter and dietary advice (PA 1 D) and physical activity methylation model). Preprocessing was performed using R
assessed with pedometer (PA)—and a control arm receiv- (24) (version 3.5.1), lumi (25), and methylumi (26) packages
ing standard of care (C) (Fig. 1). The primary end point was from Bioconductor. b-Values were calculated as b 5 in-
to assess the impact of these lifestyle interventions on tensity of the Methylated allele (M)/(intensity of the Un-
GWG (9). All participants, including control subjects, had methylated allele [U] 1 intensity of the Methylated allele
a consultation with a dietitian who recommended a low- [M] 1 100). A total of 1,739 probes with mean detection P
energy and low-fat Mediterranean-style diet of 1,200– value .0.01, 64 rs probes, 3,089 ch-probes targeting non-
1,675 kcal, based on Danish national recommendations, CpG sites, 80 Y-chromosome probes, 26,772 cross-reactive
and they were encouraged to limit GWG to #5 kg. Par- probes, and 436 polymorphic probes with a minor allele
ticipants in PA 1 D had regular contact/visits (every frequency .0.1 were filtered out (27). Methylation data
2 weeks) with an experienced dietitian giving dietary were obtained for 453,397 probes. For further analyses,856 Lifestyle Alters DNA Methylation in Cord Blood Diabetes Volume 70, April 2021
Figure 1—Flow diagram. QC, quality control.
M-values were used, calculated following the formula M 5 needed 230 participants. Based on this power calculation,
log2(b/[12b]) (28). Background correction and quantile the fact that GWG, the primary end point of the TOP-
normalization were performed. Beta-Mixture Quantile nor- study, did not differ between the two lifestyle intervention
malization method (29) was applied. ComBat was applied to groups and the modest number of samples with cord blood
correct for batch effects (30,31). Principal component anal- in each lifestyle intervention group, we decided to combine
ysis (PCA) before and after applying ComBat ensures that the two lifestyle intervention groups. We subsequently
between-array batch effects were removed. Seven partici- investigated the impact of PA 1 D together with PA
pants were further excluded, as these samples clustered to (lifestyle intervention group, n 5 135) versus C (control
the wrong sex in the PCA. Overall, DNA methylation data group, n 5 73) on all investigated parameters (Fig. 1).
were available for 208 participants (Fig. 1 and Table 1). To test if cord blood DNA methylation is associated
Additional gene annotation was performed using hg38, with lifestyle intervention assignment, a linear regression
GENCODE version 22. model adjusted for maternal age (years), prepregnancy
BMI (kilograms per meter squared), GWG (kilograms),
Statistical Analyses gestational age (GA; weeks), and offspring sex was run.
We performed a power calculation using R package pwrE- Adjustment for cell composition was done using the ref-
WAS (https://bioconductor.org/packages/devel/bioc/ erence-free method from Houseman et al. (32). We also
html/pwrEWAS.html). To find 10% difference in methyl- used the reference-based method to adjust for cell com-
ation between two groups (ratio 1:2) with 75% power, we position (33). We additionally performed linear regressiondiabetes.diabetesjournals.org Jönsson and Associates 857
Table 1—Parental and offspring baseline characteristics according to the lifestyle intervention and control groups for subjects
with available cord blood of the TOP-study
Lifestyle intervention Control P value
Maternal characteristics n 5 135 n 5 73
Maternal age at enrollment (years)* 30.90 (4.30) 31.40 (4.74) 0.440
Prepregnancy BMI (kg/m2)* 34.19 (4.00) 34.36 (3.98) 0.763
Maternal educational level, n (%)† 0.970
Grammar school 10 years 15 (11.1) 6 (8.2)
Secondary school 12 years 16 (11.9) 9 (12.3)
Vocational training school 13 (9.6) 6 (8.2)
Further education 1–2 years 26 (19.3) 12 (16.4)
Tertiary education 3–4 years (Bachelor level) 46 (34.1) 29 (39.7)
Advanced education (postgraduate) 18 (13.3) 10 (13.7)
NA 1 (0.7) 1 (1.4)
Smoking during pregnancy (yes/no), n (%)† 10 (7.4) 3 (4.1) 0.524
Parity (single/multi), n (%)† 75 (55.6) 39 (53.4) 0.882
Energy intake at enrollment, weeks 11–14 (kJ)‡§ 8,019 (2,784) 7,540 (3,246) 0.829
Paternal characteristics n 5 115 n 5 65
BMI (kg/m2) at enrollment, weeks 11–14* 27.39 (4.51) 27.01 (4.52) 0.585
Offspring characteristics n 5 135 n 5 73
Sex, n (%)† 0.862
Male 69 (51.1) 39 (53.4)
Female 66 (48.9) 34 (46.6)
GA (weeks)* 40.17 (1.23) 40.01 (1.31) 0.393
Weight (g), birth* 3,724 (482) 3,677 (513) 0.515
Weight (kg), 9 months*‖ 9.61 (1.03) 9.38 (1.15) 0.299
Weight (kg), 18 months*¶ 11.86 (11.83) 11.26 (10.27) 0.014
Weight (kg), 36 months*# 15.30 (18.64) 14.71 (12.97) 0.141
Length (cm), birth*** 52.50 (2.17) 52.48 (2.24) 0.958
Length (cm), 9 months*‖ 73.14 (2.32) 72.99 (1.97) 0.740
Length (cm), 18 months*†† 82.75 (2.87) 82.55 (2.48) 0.724
Height (cm), 36 months*‡‡ 96.42 (4.21) 95.95 (3.07) 0.599
Breastfeeding, exclusively (weeks)*§§ 10.98 (9.41) 8.38 (10.07) 0.163
Breastfeeding, partially (weeks)*§§ 16.30 (11.05) 14.88 (10.71) 0.501
NA, not available. *Mean (SD), two-sided Student t test. †Frequencies, x2 test. ‡Median (interquartile range), two-sided Mann-Whitney U
test. §Lifestyle intervention, n 5 133; control, n 5 68. ‖Lifestyle intervention, n 5 60; control, n 5 39. ¶Lifestyle intervention, n 5 58;
control, n 5 36. #Lifestyle intervention, n 5 51; control, n 5 29. **Lifestyle intervention, n 5 129; control, n 5 71. ††Lifestyle intervention,
n 5 57; control, n 5 36. ‡‡Lifestyle intervention, n 5 51; control, n 5 28. §§Lifestyle intervention, n 5 77; control, n 5 42.
including the same variables as above and calculated models (LMMs) for repeated measurements were performed
principal components (PCs) of the residuals from this with random intercepts and different fixed slopes of BMI z
model. The top five PCs were then used as covariates to scores for lifestyle intervention and control groups. BMI z
correct for possible inflation, technical variation, and cell scores, which are weight relative to height and adjusted for
type composition. age and sex of the child, were calculated according to the
Linear regression was used to assess whether cord blood World Health Organization using the anthro package in R
DNA methylation (at sites significantly different between (https://CRAN.R-project.org/package5anthro). Variables
lifestyle intervention and control groups) is associated with P , 0.25 in univariate analyses were incorporated in
with lean mass at birth. Variables with a P , 0.25 in final models (34). Models were adjusted for maternal ed-
univariate analyses were incorporated in the final regres- ucation level, maternal smoking during pregnancy, GA, and
sion models (34), which included the following covariates: parity, as well as factors with a likely biological impact on
maternal smoking during pregnancy, GA, and offspring sex methylation (GWG, prepregnancy BMI, breastfeeding ex-
as well as factors with putative biological impact on DNA clusively and partially [weeks], and offspring age at mea-
methylation (GWG and prepregnancy BMI). In this linear surement). Association signals for specific methylation sites
regression model, lean mass was the dependent variable were considered significant (P , 0.05) if the direction of
and DNA methylation of respective site was the indepen- effect in the LMMs was consistent with at least three of the
dent variable. four time points in regular linear regression models.
To assess if methylation in cord blood (at sites signif- Spearman correlations between CRP levels in pregnant
icantly different between the lifestyle intervention and mothers and cord blood DNA methylation of significant
control groups) is associated with growth in the offspring sites were performed. Grubbs test was used to detect
(at birth and at 9, 18, and 36 months of age), linear mixed outliers.858 Lifestyle Alters DNA Methylation in Cord Blood Diabetes Volume 70, April 2021
Table 2—Estimated differences from linear regression models in offspring lean mass and BMI z scores and their associated
95% CIs when comparing lifestyle intervention (n 5 92) vs. control (n 5 47) groups for subjects with available cord blood of the
TOP-study
Phenotype Estimated difference (95% CI) P value
Lean mass (g), birth 126.55 (24.52; 257.62)* 0.058*
Lean mass (%), birth 1.36 (20.05; 2.77)* 0.059*
Abd. lean mass (g), birth 59.09 (10.53; 107.65)* 0.017*
Abd. lean mass (%), birth 0.88 (0.24; 1.53)* 0.008*
Fat mass (g), birth 51.26 (219.93; 122.44)* 0.157*
Fat mass (%), birth 1.35 (20.06; 2.76)* 0.061*
Abd. fat mass (g), birth 6.88 (23.51; 17.26)* 0.192*
Abd. fat mass (%), birth 0.49 (20.58; 1.57)* 0.365*
BMI z score, birth 1
0.15 (20.14; 0.43)† 0.352†
BMI z score, 9 months2 0.31 (20.14; 0.76)‡ 0.315‡
BMI z score, 18 months 3
0.54 (0.14; 0.93)§ 0.006§
BMI z score, 36 months4 0.30 (20.13; 0.74)§ 0.169§
1
Lifestyle intervention, n 5 129; control, n 5 71. Lifestyle intervention, n 5 60; control, n 5 39. Lifestyle intervention, n 5 57;control, n 5
2 3
36. 4Lifestyle intervention, n 5 51; control, n 5 28. *Adjusted for maternal education level, maternal smoking during pregnancy (yes/no),
GWG (in kilograms), prepregnancy BMI, parity (single/multi), GA (in weeks), and offspring sex. †Adjusted for maternal education level,
maternal smoking during pregnancy (yes/no), GWG (in kilograms), prepregnancy BMI, parity (single/multi), and GA (in weeks). ‡Adjusted
for maternal education level, maternal smoking during pregnancy (yes/no), GWG (in kilograms), prepregnancy BMI, parity (single/multi),
GA (in weeks), breastfeeding partially and exclusively, and BMI z score at birth. §Adjusted for maternal education level, maternal smoking
during pregnancy (yes/no), GWG (in kilograms), prepregnancy BMI, parity (single/multi), breastfeeding partially and exclusively, and BMI z
score at birth.
Statistical analyses were performed using the software mass are part of a pathway through which the lifestyle
R (24) (version 3.6.1) and RStudio (https://www.rstudio intervention exerts its effects on lean mass. The effect is
.com). Data are presented as mean 6 SD, unless stated estimated for each association between treatment and
otherwise. Normalized methylation b-values were used for outcome in participants with different methylation levels.
Spearman correlations and the analyses related to offspring DNA methylation of each respective site was designated as
body composition. Unless stated otherwise, models were the mediator and lean mass as outcome. The models were
corrected for multiple testing using false discovery rate adjusted for GWG, maternal BMI, GA, and offspring sex.
(FDR) analysis (Benjamini-Hochberg) in which FDR ,5%
DNA Methylation in Muscle and Adipose Tissue
(q , 0.05) was considered significant. Bonferroni multiple-
comparison post hoc correction was also used when testing Sites showing differential cord blood methylation from the
if cord blood DNA methylation is associated with the lifestyle intervention versus control group were also in-
lifestyle intervention, adjusting the linear model for mater- vestigated in blood, muscle, and adipose tissue from
nal age, prepregnancy BMI, GWG, GA, and offspring sex. participants in the Monozygotic Twin cohort. Infinium
DNA methylation data from blood, adipose tissue, and
Gene Ontology Analysis muscle of the Monozygotic Twin cohort have been pub-
To analyze possible biological functions of differential DNA lished (39,40). We used Spearman correlations to test
methylation found in cord blood, we performed gene ontol- whether methylation in blood correlates with methylation
ogy (GO) mapping using Generic GO Term Mapper (35) and in muscle or adipose tissue for sites showing differential
GO analysis using the gometh function in the missMethyl DNA methylation in cord blood from the TOP-study.
package (36). For GO mapping, we used Process Ontology in
Homo sapiens, GOA slim, the list of the annotated genes, and Data and Resource Availability
P , 0.01. For GO analysis, we entered a list of the signif- DNA methylation data from cord blood of the TOP-study
icantly associated methylation sites and removed redundant (accession number LUDC2020.08.14) are deposited in the
GO terms using REViGO (37). We allowed for 50% similarity Lund University Diabetes Centre repository (https://www.ludc.
between different GO terms, using Homo sapiens database lu.se/resources/repository) and are available upon request.
and SimRel as the semantic similarity measure.
RESULTS
Causal Mediation Analysis Impact of a Lifestyle Intervention During Pregnancy on
We performed a nonparametric causal mediation analysis, DNA Methylation in Cord Blood
using the mediation R package and default settings (38), to To assess if a lifestyle intervention in pregnant mothers
investigate whether DNA methylation of any of the identified with obesity had an effect on the methylome in cord blood,
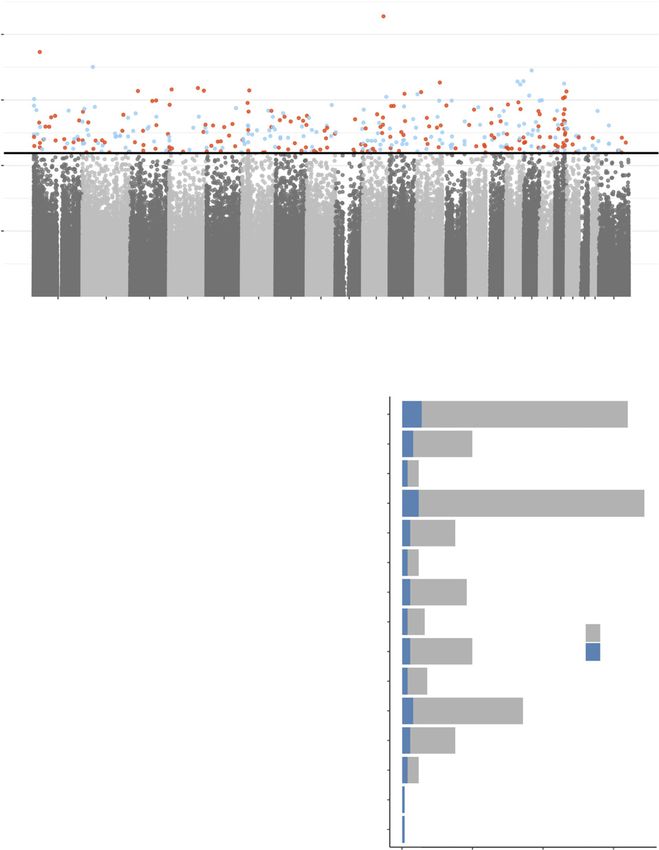
25 sites in cord blood found to be associated with lean we analyzed DNA methylation in participants of the TOP-diabetes.diabetesjournals.org Jönsson and Associates 859 Figure 2—A: A Manhattan plot, representing the distribution of methylation sites across the genome, for the association between lifestyle intervention and offspring cord blood DNA methylation, after adjustment for covariates and cell composition adjustment. The black line shows the FDR threshold for multiple testing. Methylation sites that surpassed the FDR threshold (P , 4.17 3 1025) are highlighted in color (red is hypermethylated and blue is hypomethylated sites in the lifestyle intervention group vs. the control group). B: Pathways from GO analysis after removal of redundant GO terms using REViGO (P , 0.05). The gray bars indicate the total number of genes in the pathway; the blue bars indicate the number of differently methylated (DM) genes in lifestyle intervention vs. control subjects. Data from A are also presented in Supplementary Table 1, and data from B are also presented in Supplementary Table 3. study. Baseline characteristics of pregnant women with daily step counts were 8,623 6 2,615 for participants obesity included in the lifestyle intervention and control in the lifestyle intervention. As wearing the pedometer was groups of the TOP-study, paternal BMI, as well as for their part of the lifestyle intervention, no step counts were offspring at birth, are shown in Table 1. At enrollment, available for control subjects. Offspring were similar re- there was no difference in energy intake between the garding weight, length, and GA at birth and there were no lifestyle intervention and control group (Table 1). Mothers detectable differences between the groups regarding in the lifestyle intervention group had a trend toward breastfeeding (Table 1) or BMI z scores at birth or 9 or lower energy intake versus control subjects at weeks 36–38 36 months of age (Table 2). supporting good adherence to the dietary intervention We next examined if cord blood DNA methylation at (Supplementary Fig. 1). During week 17 of pregnancy, individual sites differed between lifestyle intervention and
860   Lifestyle Alters DNA Methylation in Cord Blood                                         Diabetes Volume 70, April 2021

control groups. DNA methylation at 379 sites (q , 0.05),       (Supplementary Table 4). Moreover, we found that meth-
as seen in Fig. 2A representing the distribution of meth-      ylation at 56 of the 110 mQTLs are associated with type
ylation sites across the genome, annotated to 370 unique       2 diabetes, obesity, maternal stress, and sperm viability in
genes, was different between the lifestyle intervention and    previous epigenome-wide association studies (https://bigd
control groups when adjustment for cell composition was        .big.ac.cn/ewas/datahub/index) (Supplementary Table 7).
done using the Houseman reference-free method (32) and            We then tested if SNPs that map to any of the 370 genes
Benjamini-Hochberg FDR analysis was used to correct for        included in Supplementary Table 1 have been associated
multiple testing (Supplementary Table 1). Three of these       with birth weight, childhood obesity, obesity, adiposity, or
sites were significant based on Bonferroni correction.          type 2 diabetes in published GWAS (41). Sixteen genes
None of these 379 significant sites had been associated         annotated to 15 sites (Supplementary Table 8) were linked
with DNA methylation signatures related to cell compo-         to SNPs associated with these traits in GWAS: 3 SNPs were
sition in cord blood, and methylation of 376 of the            associated with adiposity (MAP2K5, MEIS1, and IPO9)
379 sites was nominally associated with the lifestyle in-      (42,43) (downloaded 19 December 2019), 4 with obesity
tervention when adjustment for cell composition was done       (MAP2K5, PCDH9, SCNN1A, and TCF4) (EFO_0001073,
using the reference-based method with P 5 5.12 3 1027–         downloaded 19 December 2019), 4 genes (ACSL1, HMGA2,
3 3 1022 (33) (Supplementary Table 1). Moreover, meth-         RPSAP52, and SLC9B2) have SNPs associated with type
ylation of 377 out of 379 sites was nominally associated       2 diabetes (EFO_0001360, downloaded 19 December
with the lifestyle intervention after adjusting for the first   2019), and 7 genes (TENM4, HMGA2, MAP3K10, RB1,
top five PCs of the residuals, P 5 3.08 3 1029–4.7 3 1022       KLHL29, LRIG1, and PMFBP1) have SNPs associated with
(Supplementary Table 1). All of these 377 sites had            birth weight (EFO_0004344, downloaded 23 June 2020)
FDR ,5% when we performed post hoc Benjamini-Hochberg          (41). None of the discovered genes have SNPs associated
FDR analysis on 379 sites. The lifestyle intervention was      with childhood obesity (41,44) (downloaded 22 June
associated with methylation of these sites also when           2020). None of these 15 sites were among the 3 significant
adjusting for fewer covariates and when adjusting for          sites based on Bonferroni correction.
smoking (P , 0.05) (Supplementary Table 1), suggesting            We further examined if our 379 sites were overrepre-
that these covariates did not substantially influence the       sented within other epigenetic marks such as histone
association. Moreover, since GWG has been associated           modifications representing active (H3K4me1 and
with DNA methylation in cord blood (14), we tested if          H3K27ac) or inactive (H3K27me3) chromatin. We inter-
GWG was associated with methylation of the 379 sites.          sected the position of 379 sites with chromatin immuno-
However, no methylation sites were associated with GWG         precipitation sequencing data of histone modifications in
(q , 0.05). We also performed a model in which we              blood mononuclear cells from the Roadmap Epigenomics
adjusted for maternal age, maternal BMI, smoking, and          Consortium (45). A permutation distribution test using
GA as well as offspring sex, and then methylation of           10,000 permutations showed more significant methyla-
377 out of 379 sites was associated with the lifestyle         tion sites overlapping with H3K4me1 (P 5 0.030) but not
intervention, with P 5 1.3 3 1028–2.4 3 1024 (Supple-          H3K27me3 (P 5 0.356) and H3K27ac (P 5 0.535),
mentary Table 1).                                              compared with what would have been expected by chance
    To understand the biological role of the 370 genes, we     if all sites on the array were analyzed, indicating an
used GO Term Mapper and found that ;60% of the genes           enrichment of enhancer elements in sites differentially
with differently methylated sites are involved in metabolic    methylated in the lifestyle intervention.
processes (Supplementary Table 2). Moreover, performing           We have previously shown that CRP levels were lower in
GO and REViGO analyses, we found 15 biological processes       pregnant mothers in lifestyle intervention versus control
(P , 0.01). These include response to fatty acids, adipose     subjects (46). Therefore, we tested whether CRP levels in
tissue development, and negative regulation of insulin         pregnant mothers correlated with cord blood methylation
secretion involved in cellular response to glucose stimulus    of our 379 sites. CRP levels correlated with methylation of
(35,37) (Fig. 2B and Supplementary Table 3).                   two sites: cg17389519, which is annotated to PTF1A
    Using the methylation quantitative trait loci (mQTL)       encoding a transcription factor involved in pancreas and
database (https://mqtldb.org), we found that cord blood        neural tissue development (47), and cg27394563, anno-
methylation of 110 out of our 379 sites has been associ-       tated to SART3 (Supplementary Fig. 2A and B).
ated with single nucleotide polymorphisms (SNPs),
so-called mQTLs (Supplementary Table 4). These include         Impact of a Lifestyle Intervention During Pregnancy on
cg21753618, which is among the three sites significant          Offspring Lean Mass
based on Bonferroni correction. Several of these sites also    We proceeded to study the body composition of the off-
appear as mQTLs in peripheral blood in children and their      spring (Tables 1 and 2). Offspring to mothers included in
mothers during childhood, adolescence, pregnancy, and          the lifestyle intervention group were born with 59 g (95%
middle age (Supplementary Tables 5 and 6). Among these         CI 11; 108) (P 5 0.017) and 0.88 percentage points (95%
mQTLs, 18 SNPs were associated with disease traits in          CI 0.24; 1.53) (P 5 0.008) more abdominal lean mass
the genome-wide association studies (GWAS) catalog             versus control subjects (Fig. 3 and Table 2). We also
diabetes.diabetesjournals.org Jönsson and Associates 861
and harboring a SNP associated with obesity (EFO_0001073,
downloaded 19 December 2019) in GWAS (41) (Supple-
mentary Table 8).
Causal Mediation Analysis
We next used a causal mediation analysis (38) to investi-
gate whether DNA methylation of any of the 25 sites in
cord blood found to be associated with lean mass are part
of a pathway through which the lifestyle intervention
Figure 3—Boxplots are showing abdominal lean mass (g) (A) and exerts its effects on offspring lean mass. The mediation
abdominal lean mass (%) (B) in the lifestyle intervention and control analysis breaks down the total effect of treatment (lifestyle
groups at birth in median (interquartile range). The P values are intervention) on outcome (lean mass) into two parts: first,
based on linear regression models adjusted for maternal education
level, maternal smoking during pregnancy (yes/no), GWG (kg), pre- the indirect effect acting via the mediator of interest (DNA
pregnancy BMI (kg/m2), parity (single/multi), GA (weeks), and off- methylation) and second, the direct effect acting directly
spring sex. Data are also presented in Table 2. or via a mediator other than what is under study. The
analyses showed that 1) the lifestyle intervention has an
overall effect of b 5 1.35 (95% CI 20.092; 2.741) on lean
observed a trend that offspring of mothers included in the mass, 2) that effect may operate via an indirect path
lifestyle intervention group were born with 127 g (95% (indirect effect), possibly through methylation, with a sig-
CI 25; 258) (P 5 0.058) and 1.36 percentage points (95% nificant average causal mediator effect for 17 methylation
CI 20.05; 2.77) (P 5 0.059) more lean mass versus control sites (q , 0.05) (Table 3), and 3) consequently, the total
subjects (Table 2). At birth, the offspring were similar in effect of the lifestyle intervention on lean mass, 32.0–
size (Tables 1 and 2), indicating that it is the body 61.8%, is suggested to act via these 17 methylation sites.
composition that differs between the groups. We found According to these results, we may call methylation of
that offspring of both groups were similar in size at 9 and these sites partial mediators.
36 months of age; however, at 18 months, children from
Cross-Tissue Methylation of Sites Associated With
the lifestyle intervention group were larger in size (Tables
Lean Mass or Growth
1 and 2).
We finally examined whether DNA methylation in blood of
Associations Between DNA Methylation in Cord Blood the 46 unique sites (one methylation site, cg11594420,
and Offspring Lean Mass and Growth overlap) associated with lean mass or growth in the off-
Offspring in the lifestyle intervention group had more lean spring mirrors the methylation pattern in two other
mass at birth and differential cord blood methylation at tissues of importance for obesity and type 2 diabetes:
379 sites versus control subjects (Table 2 and Supplemen- skeletal muscle and adipose tissue. We used available
tary Table 1); thus, we further tested whether there were methylation array data from blood, muscle, and adipose
associations between methylation of these 379 sites and tissue taken from the same individuals (39,40) (Supple-
lean mass (percentage) at birth in the offspring. Cord blood mentary Table 11). Among these sites, the methylation
methylation of 25 sites was associated with lean mass (q , pattern in blood correlated positively with methylation of
0.05) (Supplementary Table 9). For the majority of these four sites in adipose tissue and two sites in muscle (P ,
sites (80%), cord blood methylation levels were higher in 0.05) (Supplementary Table 12). Five correlations were
the lifestyle intervention group and positively associated nominal and one significant after FDR. These findings
with greater lean mass. suggest that methylation of a few sites may have a bi-
We proceeded to assess whether cord blood methylation ological role in tissues of relevance for obesity and type
of the 379 sites was associated with growth over time in 2 diabetes.
the offspring using LMMs and BMI z scores at birth and 9,
18, and 36 months of age. We found that methylation of DISCUSSION
22 sites was associated with BMI z scores (P , 0.05). Next, This is, to our knowledge, the first genome-wide epigenetic
we performed linear regression models to test if methyl- analysis in cord blood of pregnant women with obesity
ation at the 379 sites was associated with BMI z scores at randomized to a lifestyle intervention including physical
each time point. The direction of effects for the LMMs was activity, with or without a hypocaloric Mediterranean-style
consistent with that for the linear regression models at all diet, versus control subjects receiving standard of care.
time points but for two sites; for these two sites, the There are four key findings: first, DNA methylation at
direction altered at one time point (Supplementary Table individual sites in cord blood differed between lifestyle
10). Included within the genes annotated to the 22 sites intervention and control subjects. These sites were anno-
are ACSL1, which is involved in fatty acid b-oxidation and tated to genes overrepresented in relevant GO terms (e.g.,
harboring a SNP associated with type 2 diabetes, and TCF4, response to fatty acids and adipose tissue development).
encoding a transcription factor involved in Wnt signaling Second, we found that genes linked to SNPs associated862 Table 3—Causal mediation analysis on the significant associations between the lifestyle intervention and lean mass–related methylation (CpG) sites as mediators and lean mass (%) as outcome (ACME q value
diabetes.diabetesjournals.org                                                                       Jönsson and Associates      863

with birth weight, obesity, adiposity, and type 2 diabetes            Finally, we found that blood-based methylation of sites
by GWAS have been also annotated to sites that have                associated with lean mass or growth in the offspring
altered DNA methylation in our study. Additionally, SNPs           mirrors methylation patterns in muscle and adipose tissue,
previously associated with DNA methylation in cord blood           tissues of importance for metabolic disease (39,40). These
of our identified sites were linked to disease traits in the        include sites annotated to TCF4 and SYT9 encoding tran-
GWAS catalog. Third, offspring to mothers included in the          scription factor 4 and synaptotagmin 9, respectively,
lifestyle intervention were born with more lean mass.              which have been implicated in diabetes-related traits
Finally, methylation at 17 sites partially mediates the effect     (53,54). Although these results are based on nominally
of the lifestyle intervention on lean mass in the offspring.       significant P values, they give a possible indication that
Together, these data provide evidence that the presented           methylation of some identified sites may also have a bi-
lifestyle intervention altered the epigenome of genes linked       ological role in tissues of importance for obesity and type
to metabolism and metabolic disease in offspring cord blood        2 diabetes.
from pregnant mothers with obesity.
    Previous studies have shown that tissues from people           Strengths and Limitations
with obesity have different methylation profiles versus             A strength of this study is the randomized design, the high
lean people (13,16,48); however, DNA methylation can be            rate of completers in the TOP-study, and the relatively
changed by lifestyle (40,49). Obesity during pregnancy             homogenous study population in terms of prepregnancy
increases the risk of metabolic disease in offspring (2),          BMI and ethnicity, which should reduce the risk of bias.
and obesity in pregnant mothers is associated with epigenetic      A pedometer intervention is an inexpensive method for
alterations in cord blood (17). We demonstrate that exercise       increasing daily physical activity and can easily be imple-
and healthy diets during pregnancy can change cord blood           mented into daily life. Other physical activity interventions
DNA methylation and that these epigenetic changes took             often include attendance to classes, which can be difficult to
place on genes involved in metabolic processes. It is possible     implement. It is also a strength that we used several different
that a healthier lifestyle during pregnancy and the conse-         methods to adjust the methylation data for cell composition
quential epigenetic changes help enhance the offspring’s           and technical variation, which showed that DNA methyla-
health later in life. The epigenetic mechanisms linked to          tion of a large proportion of the identified sites was asso-
exercise and healthy diets in our study seem to be different       ciated with the lifestyle intervention independent of the
compared with those previously associated with maternal            method used, although the strength of the associations was
BMI (17) and gestational diabetes (16,19).                         reduced for the reference-based compared with the refer-
    We demonstrate that offspring to mothers in the life-          ence-free method. It is important to adjust cord blood DNA
style intervention have higher abdominal and a trend to-           methylation data for cell type composition. For discovery of
ward higher total lean mass versus control subjects. This          our significant DNA methylation results, we used the ref-
result indicates a positive effect of the lifestyle intervention   erence-free method developed by Houseman et al. (32) for
on the offspring as they were born with more metabolically         deconvolving heterogeneous cell mixtures. We then used the
active tissue, which might protect against future metabolic        reference-based (33) and PCA-based methods to validate
diseases. This is supported by studies showing that the body       our results. These different methods (e.g., reference-based
composition of newborns being born small for GA (SGA)              vs. reference-free) have their pros and cons. A reference-
differs more in terms of less lean mass than differences in        based method might provide robust estimations. However,
fat mass, compared with appropriate-for-gestational-age            it is usually based on few samples with limited clinical
newborns (50), and SGA increases the risk of metabolic             conditions. For umbilical cord blood, there is an available
disease later in life (51). Thereby, suggesting that negative      reference of 26 samples (33), which might not be able cover
effects of being born SGA could be due to decreased lean           the variance in our data set, as it is eight times larger. In the
mass. Increased muscle mass and higher metabolic activity          publication by Houseman et al. (32), they show via a simu-
on the other hand may have beneficial effects on insulin            lation study and several real data analyses that their method
sensitivity and protect from obesity and type 2 diabetes (7).      can perform as well as or better than methods that make
We found associations between cord blood epigenetics and           explicit use of reference data sets. They also discuss that this
lean mass in the offspring at birth. For the majority of these     reference-free method may adjust for detailed cell type
sites, methylation levels were higher in cord blood of the         differences that may be unavailable in existing reference
lifestyle intervention group and positively associated with        data sets. Additionally, the algorithm estimates the number
greater lean mass, and methylation at several sites seems to       of cell types, meaning it should also consider the nucleated
partially mediate the lifestyle effect on lean mass. Interest-     red blood cells that cord blood contains.
ingly, the lifestyle intervention group had decreased meth-            Furthermore, in this study, we used two methods to
ylation of SETD3, which encodes a methyltransferase.               correct for multiple testing, Benjamini-Hochberg and Bon-
Hypomethylation of SETD3 correlates with increased ex-             ferroni. However, Bonferroni is known to be too conservative
pression and, in turn, increased muscle mass (52), which           for epigenome-wide association studies since DNA methyl-
might in part explain the greater lean mass we see in the          ation values at nearby probes are known to be correlated and
offspring of the lifestyle intervention group.                     many sites on the array are nonvariable (55,56). The
864 Lifestyle Alters DNA Methylation in Cord Blood Diabetes Volume 70, April 2021
alternative approach, Benjamini-Hochberg adjustment, is Funding. Sygekassernes Helsefond, Hartmann Fonden, Hvidovre Hospital, and
potentially a more powerful method identifying the associ- The Danish Council for Strategic Research supported the TOP-study. The work
ated sites with the phenotype of interest, but it may also performed by A.C.E. and P.W.F. was supported by grants from the European
Foundation for the Study of Diabetes, Vetenskapsrådet, Hjärt-Lungfonden, the
generate some false-positive results. The PCA-based method
H2020 European Research Council (CoG-2015_681742_NASCENT), and Novo
that we used may, however, reduce false-positive results.
Nordisk Fonden. The work performed by J.J., S.G.-C., A.P., and C.L. was
A limitation is that the two lifestyle intervention groups supported by grants from the Novo Nordisk Fonden, Vetenskapsrådet, and Region
were merged. This was, however, necessary to have suffi- Skåne (ALF), an H2020 European Research Council co-grant (PAINTBOX, number
cient statistical power due to the modest number of 725840), H2020 Marie Skłodowska-Curie Actions grant agreement 706081 (Epi-
samples with cord blood in each group. However, we Hope), Hjärt-Lungfonden, EXODIAB, Stiftelsen för Strategisk Forskning (IRC15-
have shown that lifestyle interventions in the TOP-study 0067), and Diabetesförbundet. All researchers from Lund University Diabetes
were effective and could reduce GWG (9), suggesting that Centre were supported by a research center grant from the Swedish Strategic
both interventions successfully achieved the main primary Science Foundation.
end point, thus reducing potential bias when merging Duality of Interest. No potential conflicts of interest relevant to this article
them. It should also be noted that the maternal energy were reported.
intake is self-reported and may infer a type of reporting Author Contributions. J.J. analyzed data, performed the statistical
analyses, and drafted and revised the manuscript. K.M.R., A.V., P.W.F., and
bias. Nevertheless, the maternal energy intake at late
C.L. designed and planned the current study and participated in drafting the
gestation was reduced in the lifestyle intervention group manuscript. K.M.R. and K.N. designed and planned the TOP-study. K.M.R. and
versus control subjects, indicating a successful interven- E.M.C. conducted the TOP-study and collected data. S.G.-C. participated in
tion. Previous dietary analyses of participants in the TOP- analyzing data and drafting the manuscript. A.P. performed DNA methylation
study showed that participants having dietary and physical analysis. A.C.E. contributed to designing the study and performed statistical
activity intervention changed their dietary composition in analyses. M.V.L. interpreted data and gave statistical support. M.V.L., K.F.M., and
a healthier direction (12). Participants in the group only E.M.C. collected data on the offspring at follow-up after delivery. L.H. contributed
performing physical activity demonstrated a trend toward to planning the epigenetic part of the study. E.M.C. analyzed the DXA scans. P.W.F.
dietary changes in the same direction (12). This supports and C.L. supervised the analyses. All authors reviewed and provided critical
the approach of merging the intervention groups. comments on the manuscript. J.J. and K.M.R. are the guarantors of this work and,
as such, had full access to all the data in the study and take responsibility for the
As in other intervention studies of pregnant women with
integrity of the data and the accuracy of the data analysis.
obesity, it might be a challenge that the intervention in-
tensity was too low, and a high proportion of the partic- References
ipants were noncompliant to the recommended diet and
1. Rasmussen KM, Yaktine AL (Eds). Weight Gain During Pregnancy:
physical activity intervention. Few women achieved the Reexamining the Guidelines. Washington (DC), National Academies Press,
target of the physical activity intervention, possibly indi- 2009
cating that this target was set high for this group and should 2. Gu S, An X, Fang L, et al. Risk factors and long-term health consequences of
be revised for future studies. macrosomia: a prospective study in Jiangsu Province, China. J Biomed Res 2012;
Of note, the methylation array covers ;2% of sites in 26:235–240
the human genome, and it is therefore possible that 3. Simmonds M, Llewellyn A, Owen CG, Woolacott N. Predicting adult obesity
methylation of additional sites may be associated with from childhood obesity: a systematic review and meta-analysis. Obes Rev 2016;
the intervention. Future studies are needed to fully un- 17:95–107
derstand the biology behind the associations presented in 4. Ervin RB. Prevalence of metabolic syndrome among adults 20 years of age
and over, by sex, age, race and ethnicity, and body mass index: United States,
this article and their possible health effects.
2003-2006. Natl Health Stat Rep 2009;13:1–7
In summary, this study demonstrates that a lifestyle
5. Franks PW, Hanson RL, Knowler WC, Sievers ML, Bennett PH, Looker HC.
intervention in pregnant women with obesity is associated Childhood obesity, other cardiovascular risk factors, and premature death. N Engl J
with the cord blood epigenome in offspring. We also provide Med 2010;362:485–493
evidence that epigenetic markers in cord blood associate 6. Global Burden of Disease Collaborative Network. Global Burden of Disease
with lean mass and growth in offspring. These results Study 2015 (GBD 2015) Obesity and Overweight Prevalence 1980-2015, 2017.
underline that the intrauterine environment in humans Institute for Health Metrics and Evaluation. Accessed 11 March 2020. Available
might have the ability to program the epigenome, which in from http://ghdx.healthdata.org/record/ihme-data/gbd-2015-obesity-and-overweight-
turn may affect metabolism and growth later in life. prevalence-1980-2015
7. Kim G, Lee SE, Jun JE, et al. Increase in relative skeletal muscle mass over
time and its inverse association with metabolic syndrome development: a 7-year
Acknowledgments. The authors thank Marlena Maziarz, Department of retrospective cohort study. Cardiovasc Diabetol 2018;17:23
Clinical Sciences, Lund University/CRC, Skåne University Hospital SUS, Malmö, 8. Bann D, Wills A, Cooper R, et al.; NSHD Scientific and Data Collection Team.
Sweden, for guidance and expertise in biostatistics and Silja Schrader, Epigenetics Birth weight and growth from infancy to late adolescence in relation to fat and lean
and Diabetes Unit, Department of Clinical Sciences, Lund University Diabetes mass in early old age: findings from the MRC National Survey of Health and
Centre, Lund University, Scania University Hospital, Malmö, Sweden, for help with Development. Int J Obes 2014;38:69–75
power calculations. The authors also thank the Danish Diabetes Academy via the 9. Renault KM, Nørgaard K, Nilas L, et al. The Treatment of Obese Pregnant
Novo Nordisk Foundation for support throughout this project and the National Women (TOP) study: a randomized controlled trial of the effect of physical activity
Bioinformatics Infrastructure Sweden, SciLifeLab (Uppsala, Sweden), for the intervention assessed by pedometer with or without dietary intervention in obese
bioinformatics long-term support with Nikolay Oskolkov. pregnant women. Am J Obstet Gynecol 2014;210:134.e1–134.e9diabetes.diabetesjournals.org Jönsson and Associates 865 10. Carlsen EM, Renault KM, Nørgaard K, et al. Newborn regional body com- 32. Houseman EA, Molitor J, Marsit CJ. Reference-free cell mixture adjustments position is influenced by maternal obesity, gestational weight gain and the in analysis of DNA methylation data. Bioinformatics 2014;30:1431–1439 birthweight standard score. Acta Paediatr 2014;103:939–945 33. Gervin K, Salas LA, Bakulski KM, et al. Systematic evaluation and validation of 11. Renault KM, Carlsen EM, Nørgaard K, et al. Intake of carbohydrates during reference and library selection methods for deconvolution of cord blood DNA pregnancy in obese women is associated with fat mass in the newborn offspring. methylation data. Clin Epigenetics 2019;11:125 Am J Clin Nutr 2015;102:1475–1481 34. Bursac Z, Gauss CH, Williams DK, Hosmer DW. Purposeful selection of 12. Renault KM, Carlsen EM, Nørgaard K, et al. Intake of sweets, snacks variables in logistic regression. Source Code Biol Med 2008;3:17 and soft drinks predicts weight gain in obese pregnant women: detailed 35. Boyle EI, Weng S, Gollub J, et al. GO:TermFinder: open source software for analysis of the results of a randomised controlled trial. PLoS One 2015;10: accessing Gene Ontology information and finding significantly enriched Gene e0133041 Ontology terms associated with a list of genes. Bioinformatics 2004;20:3710– 13. Ling C, Rönn T. Epigenetics in human obesity and type 2 diabetes. Cell Metab 3715 2019;29:1028–1044 36. Phipson B, Maksimovic J, Oshlack A. missMethyl: an R package for analyzing 14. Morales E, Groom A, Lawlor DA, Relton CL. DNA methylation signatures in data from Illumina’s HumanMethylation450 platform. Bioinformatics 2016;32: cord blood associated with maternal gestational weight gain: results from the 286–288 ALSPAC cohort. BMC Res Notes 2014;7:278 37. Supek F, Bošnjak M, Škunca N, Šmuc T. REVIGO summarizes and visualizes 15. Jørgensen SW, Brøns C, Bluck L, et al. Metabolic response to 36 hours of long lists of gene ontology terms. PLoS One 2011;6:e21800 fasting in young men born small vs appropriate for gestational age. Diabetologia 38. Tingley D, Yamamoto T, Hirose K, Keele L, Imai K. mediation: R package for 2015;58:178–187 causal mediation analysis. J Stat Softw 2014;59:38 16. Hjort L, Martino D, Grunnet LG, et al. Gestational diabetes and maternal 39. Nilsson E, Jansson PA, Perfilyev A, et al. Altered DNA methylation and obesity are associated with epigenome-wide methylation changes in children. JCI differential expression of genes influencing metabolism and inflammation in Insight 2018;3:e122572 adipose tissue from subjects with type 2 diabetes. Diabetes 2014;63:2962–2976 17. Sharp GC, Salas LA, Monnereau C, et al. Maternal BMI at the start of 40. Nitert MD, Dayeh T, Volkov P, et al. Impact of an exercise intervention on DNA pregnancy and offspring epigenome-wide DNA methylation: findings from the methylation in skeletal muscle from first-degree relatives of patients with type pregnancy and childhood epigenetics (PACE) consortium. Hum Mol Genet 2017; 2 diabetes. Diabetes 2012;61:3322–3332 26:4067–4085 41. Buniello A, MacArthur JAL, Cerezo M, et al. The NHGRI-EBI GWAS Catalog of 18. Heijmans BT, Tobi EW, Stein AD, et al. Persistent epigenetic differences published genome-wide association studies, targeted arrays and summary sta- associated with prenatal exposure to famine in humans. Proc Natl Acad Sci U S A tistics 2019. Nucleic Acids Res 2019;47:D1005–D1012 2008;105:17046–17049 42. Graff M, Scott RA, Justice AE, et al.; CHARGE Consortium; EPIC-InterAct 19. Howe CG, Cox B, Fore R, et al. Maternal gestational diabetes mellitus and Consortium; PAGE Consortium. Genome-wide physical activity interactions newborn DNA methylation: findings from the pregnancy and childhood epigenetics in adiposity: a meta-analysis of 200,452 adults. PLoS Genet 2017;13: consortium. Diabetes Care 2020;43:98–105 e1006528 20. Geraghty AA, Sexton-Oates A, O’Brien EC, et al. A low glycaemic index diet in 43. Karlsson T, Rask-Andersen M, Pan G, et al. Contribution of genetics to pregnancy induces DNA methylation variation in blood of newborns: results from visceral adiposity and its relation to cardiovascular and metabolic disease. Nat Med the ROLO randomised controlled trial. Nutrients 2018;10:455 2019;25:1390–1395 21. Renault K, Nørgaard K, Andreasen KR, Secher NJ, Nilas L. Physical activity 44. Bradfield JP, Vogelezang S, Felix JF, et al.; Early Growth Genetics Con- during pregnancy in obese and normal-weight women as assessed by pedometer. sortium. A trans-ancestral meta-analysis of genome-wide association studies Acta Obstet Gynecol Scand 2010;89:956–961 reveals loci associated with childhood obesity. Hum Mol Genet 2019;28:3327– 22. Ejlerskov KT, Christensen LB, Ritz C, Jensen SM, Mølgaard C, Michaelsen KF. 3338 The impact of early growth patterns and infant feeding on body composition at 45. Kundaje A, Meuleman W, Ernst J, et al.; Roadmap Epigenomics Consortium. 3 years of age. Br J Nutr 2015;114:316–327 Integrative analysis of 111 reference human epigenomes. Nature 2015;518:317– 23. Bibikova M, Barnes B, Tsan C, et al. High density DNA methylation array with 330 single CpG site resolution. Genomics 2011;98:288–295 46. Renault KM, Carlsen EM, Hædersdal S, et al. Impact of lifestyle intervention 24. R Core Team. A language and environment for statistical computing version for obese women during pregnancy on maternal metabolic and inflammatory 3.6.1. Vienna, Austria, R Foundation for Statistical Computing, 2019 markers. Int J Obes 2017;41:598–605 25. Du P, Kibbe WA, Lin SM. lumi: a pipeline for processing Illumina microarray. 47. Jin K, Xiang M. Transcription factor Ptf1a in development, diseases and Bioinformatics 2008;24:1547–1548 reprogramming. Cell Mol Life Sci 2019;76:921–940 26. Davis S, Du P, Bilke S, Triche T Jr., Bootwalla M. methylumi: Handle Illumina 48. Davegårdh C, Broholm C, Perfilyev A, et al. Abnormal epigenetic changes methylation data. R package version 2.28.0, Bioconductor, 2018 during differentiation of human skeletal muscle stem cells from obese subjects. 27. McCartney DL, Walker RM, Morris SW, McIntosh AM, Porteous DJ, Evans KL. BMC Med 2017;15:39 Identification of polymorphic and off-target probe binding sites on the Illumina 49. Perfilyev A, Dahlman I, Gillberg L, et al. Impact of polyunsaturated and Infinium MethylationEPIC BeadChip. Genom Data 2016;9:22–24 saturated fat overfeeding on the DNA-methylation pattern in human adipose tissue: 28. Du P, Zhang X, Huang CC, et al. Comparison of Beta-value and M-value a randomized controlled trial. Am J Clin Nutr 2017;105:991–1000 methods for quantifying methylation levels by microarray analysis. BMC Bio- 50. Hediger ML, Overpeck MD, Kuczmarski RJ, McGlynn A, Maurer KR, Davis informatics 2010;11:587 WW. Muscularity and fatness of infants and young children born small- or large- 29. Teschendorff AE, Marabita F, Lechner M, et al. A beta-mixture quantile for-gestational-age. Pediatrics 1998;102:E60 normalization method for correcting probe design bias in Illumina Infinium 450 k 51. Hattersley AT, Tooke JE. The fetal insulin hypothesis: an alternative ex- DNA methylation data. Bioinformatics 2013;29:189–196 planation of the association of low birthweight with diabetes and vascular disease. 30. Johnson WE, Li C, Rabinovic A. Adjusting batch effects in microarray ex- Lancet 1999;353:1789–1792 pression data using empirical Bayes methods. Biostatistics 2007;8:118–127 52. Seaborne RA, Strauss J, Cocks M, et al. Human skeletal muscle possesses 31. Leek JT, Johnson WE, Parker HS, Jaffe AE, Storey JD. The sva package for an epigenetic memory of hypertrophy. Sci Rep 2018;8:1898 removing batch effects and other unwanted variation in high-throughput ex- 53. Wei H, Qu H, Wang H, et al. 1,25-Dihydroxyvitamin-D3 prevents the de- periments. Bioinformatics 2012;28:882–883 velopment of diabetic cardiomyopathy in type 1 diabetic rats by enhancing
866      Lifestyle Alters DNA Methylation in Cord Blood                                                                      Diabetes Volume 70, April 2021

autophagy via inhibiting the b-catenin/TCF4/GSK-3b/mTOR pathway. J Steroid          55. Mansell G, Gorrie-Stone TJ, Bao Y, et al. Guidance for DNA methylation
Biochem Mol Biol 2017;168:71–90                                                     studies: statistical insights from the Illumina EPIC array. BMC Genomics 2019;20:
54. Shim YJ, Kim JE, Hwang SK, et al. Identification of candidate gene variants in   366
Korean MODY families by whole-exome sequencing. Horm Res Paediatr 2015;83:          56. Saffari A, Silver MJ, Zavattari P, et al. Estimation of a significance threshold
242–251                                                                             for epigenome-wide association studies. Genet Epidemiol 2018;42:20–33
You can also read