Summer Meals for NYC Students: Understanding the Perspectives and Experiences of Families - No Kid Hungry Center for ...
←
→
Page content transcription
If your browser does not render page correctly, please read the page content below
Summer Meals for NYC Students: Understanding the
Perspectives and Experiences of Families
Even before the Covid-19 crisis and its deep economic effects, over a million New Yorkers
struggled with food insecurity, meaning that there was not always sufficient food for all members of
their households to live active, healthy lives. 1 In 2017, almost 13 percent of New Yorkers lived in
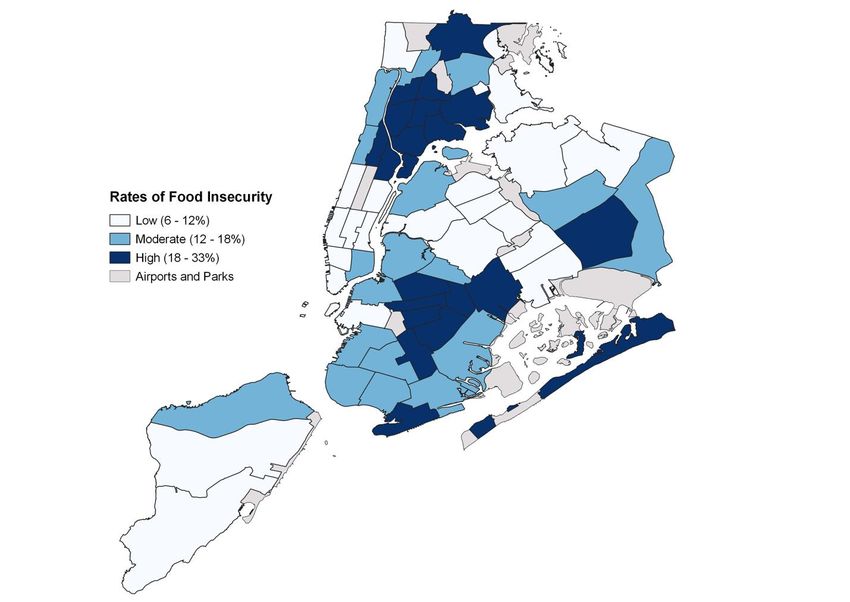
food-insecure households, and alarmingly, 18 percent of NYC children did.2 The rates of food
insecurity were much higher in low-income communities of color. As Figure 1 highlights, the 19
Community Districts (CDs)3 with high rates of food insecurity were largely clustered in the South
Bronx and Central Brooklyn, while those with the lowest rates were located primarily in Lower
Manhattan, Queens and Staten Island.
Figure 1: Rates of Food Insecurity by NYC Community District
Source: Research Alliance calculations based on publicly available data from the 2017 Feeding America project via
DATA2GOHEALTH.NYC, 2018.
Notes: Calculations include food insecurity rates for all NYC Community Districts (N=59) in 2017. New York City Community
Districts are governed by community boards and usually include multiple neighborhoods. Food Insecurity data are collected at
the PUMA (Public Use Microdata Areas) level, a US Census statistical area, which can be mapped onto NYC Community
Districts.2
Since many low-income families with children rely heavily on meal programs provided to students
during the school year, rates of food insecurity increase sharply over the summer.4 Federal Food
Service Programs (FFSPs) attempt to close this gap in food assistance by providing funding to states
to serve summer meals to children. During the summer of 2019 in NYC, free meals were available
at more than 1,300 locations, including over 500 sites that were open to the public in schools,
community parks and pools, libraries and even mobile food trucks. 5 About half of these sites were
located in the 19 CDs in Figure 1 with the highest rates of food insecurity.
Yet, participation in these programs was strikingly low, as was the case nationwide. In 2017, an
estimated 36 NYC children received summer meals for every 100 children who were eligible for
free or reduced priced meals during the school year.6 The reasons for this gap in participation are
not entirely clear. While survey research has documented that many low-income families do not
take advantage of summer meals programs,7 there has been little in-depth qualitative work
exploring why. Our study, which we conducted with sponsorship from Share Our Strength, begins
to address that question. Drawing on in-depth focus groups with families from neighborhoods with
high levels of food insecurity, our study provides insight into their summertime nutritional needs,
as well as how summer meal programs might be more responsive to those needs. This report also
draws on the Research Alliance’s extensive archive of system-wide administrative records from the
NYC Department of Education (NYCDOE), information about summer meal site locations, and
publicly available data on Community District health indicators, including rates of food insecurity. 8
We use these data to put the parents’ perspectives in the context of the communities where they
live, allowing us to better understand community health and food security conditions and potential
barriers to participating in summer meals programs.
Research Methods and Activities
Our study was guided by the following questions:
1.) What are low-income families’ food needs during the summer?
2.) What reasons might families have for not participating in the summer meals program?
a. Are there ways that vulnerable populations—such as recently arrived immigrant
families—might face unique barriers to access?
3.) How can summer meals programs better serve families?
4.) What are some ways that outreach to families about summer meals programs might be
improved?
To gain insight into parents’ perspectives on these issues, we conducted focus groups with parents
and caregivers whose children attended eight selected schools in the fall and winter of the 2019-
2020 school year (see Table 1; each school was given a pseudonym corresponding to the
neighborhood where it is located).3
. An advantage of focus groups is that the interactive format often prompts a wide discussion of
experiences, perceptions, and attitudes from the different perspectives of the participants. 9 In our
focus group interviews, we asked parents to discuss the reasons they had for participating (or not)
in summer meals programs, and the ways that the programs could be more responsive to their
needs. This approach provided in-depth explanations of barriers to participation, useful insights
into how parents experienced summer meals programs, and an understanding of the reasoning
behind their suggestions about how to improve the programs.
Table 1: Demographic Characteristics of Focus Group Schools
School a % % % % % English % Free or % Poverty in
Asian Black Latino White Language Reduced Price Census
Learner Lunch Tractb
Bedford School 3.2 22.4 72.9 1.1 22.9 97.1 34.7
Bushwick 1.4 10.2 86.8 0.8 29.7 95.3 42.5
School
Central Harlem 0.7 63.4 32.8 1.6 7.0 87.6 57.0
School
East New York 42.3 28.9 24.0 1.3 20.5 85.6 46.5
School
Longwood 0.2 19.8 77.6 1.8 12.7 98.4 49.4
School
Mott Haven 0.3 26.1 71.1 0.7 22.3 92.0 44.7
School
University 1.5 25.4 72.0 0.8 14.0 90.6 35.2
Heights School
Sunset Park 4.6 2.0 87.5 5.6 42.4 95.3 53.3
School
All NYC 14.0 27.7 41.0 14.6 14.9 76.0 19.5
Elementary
Schools c
Source: Research Alliance calculations based on data obtained from the NYC Department of Education.
Notes: Table includes the proportions of students in each demographic indicator each school, for the 2017-2018 school year.
a
Each focus group school was given a pseudonym corresponding to the neighborhood where it is located.
b
Refers to the proportion of households living below the federal poverty line in the school census tract.
c
Refers to the averages across all NYC elementary schools (those serving exclusively kindergarten through fifth grade) (N=719).
Recruitment Strategy and Participating Schools
Using our extensive archive of system-wide administrative data from the NYCDOE, we generated
a list of 105 high-poverty elementary schools from which to recruit parents for focus groups. 10 We
recruited schools by sending emails to principals and parent coordinators, and following up with
phone calls.
As indicated in Table 1, in the 2017-2018 school year, over four fifths of the student body were
eligible for free or reduced-priced lunch, and in census tracts with poverty rates substantially higher4
than average, in all of the participating schools. Moreover, while the schools varied in their
demographic makeup; all but one served predominately Black and Latino students. The schools also
varied in the proportion of students who were English Language Learners—for instance, in the
Sunset Park school, nearly half of the student body received these services, while in the Central
Harlem school, only 7 percent did.
School Focus Groups
In the eight schools, we recruited parents for focus groups by presenting our study at PTA meetings
and other family events, and asking for volunteers (see Table 2 for information about parent
participants). Each focus group lasted approximately 40 minutes and followed a semi-structured
protocol that prompted parents to discuss: their general use of summer meals programs; their
family’s nutritional needs over the summer; how, if at all, they received information about the
programs; how convenient it was to access the program sites; their experiences at the program
sites; and any suggestions to improve the programs (including better outreach). We conducted
focus groups in both English and Spanish.
Table 2: School Focus Group Information
School # of Parents in Focus Group Race/Ethnicity of Parents in the
Focus Group Language Focus Group
Bedford School 5 English Black and Latino Parents
Bushwick School 6 English and Black and Latino Parents
Spanish
Central Harlem 7 English Black and Latino Parents
School
East New York 7 English Black, Latino, and South Asian
School Parents
Longwood School 3 Spanish Latino Parents
Mott Haven School 6 English and Latino Parents
Spanish
Sunset Park School 10 Spanish Latino Parents
University Heights 4 English Black and Latino Parents
School
Total 48 _______ _______
Source: Research Alliance focus group information.
Notes: Table includes information about all of the focus group schools (N=8), which were given pseudonyms based on the school
neighborhood.5 Data Analysis We analyzed the focus group data through coded analysis of interview transcripts. Using our research questions, and reflecting on a first reading of the transcripts, we constructed our codebook, which we amended through an iterative process as we used it to code the transcripts. We coded all of the transcripts using Deedose, a qualitative data analysis software. After coding, we looked for patterns in the data, condensed it into salient categories, and explored the relationships between and across these categories.11 We fleshed out key themes and determined the prevalence of specific concepts and patterns across all of the participants’ interview data, working toward a cohesive set of findings that connected the research questions to the patterns and evidence present in the data. Throughout both the interviewing process and in analyzing the data, we strove to be aware of our own positionality as researchers and its potential influence on our interpretations. The goal of these focus groups was to elevate the perspectives of families whose children attend high-poverty schools and who live in communities with high rates of food insecurity—the families that summer meals programs are intended to serve. In addition, we used the information about summer meals sites provided by the NYCDOE to calculate the proportions of different types of summer meal sites open to the public. We also used this information to map the street addresses of the meal sites in QGIS software onto their census tracts and CDs. This allowed us to understand which sites were located in the immediate neighborhood surrounding the focus group schools (as determined by census tract) and in the larger CD. We then drew on data—both from our archive of educational administrative records, and from publicly available datasets—to paint a portrait of the conditions in these communities and put the parents’ experiences and perspectives in context. Food Insecurity in NYC In NYC and nationally, the prevalence of food insecurity in low-income communities of color reflects persistent patterns of racial and socioeconomic inequality. As Table 3 demonstrates, the 19 CDs with high rates of food insecurity also had the highest proportions of Black and Latino residents. Strikingly, in the five CDs with the very highest rates of food insecurity, where over a fourth of households were food insecure in 2017—Central Harlem, Bedford Stuyvesant, South Crown Heights and Lefferts Garden, Brownsville, and East Flatbush—over 70 percent of residents were Black. Demonstrating the link between financial hardship and food insecurity, the proportion of residents living in poverty and the share of households that receive SNAP benefits were also largest in the CDs with high levels of food insecurity.
6

 Table 3: Average Demographic Characteristics of NYC Community Districts, by
 Level of Food Insecurity
                                 High Food              Moderate Food             Low Food                 NYC Overall
                               Insecurity CDs           Insecurity CDs          Insecurity CDs
 # of CDs                            19                       19                      21                         59
 % Asian                             4.9                     16.3                    21.0                       14.6
 % Black                            48.0                     17.4                     5.7                       22.2
 % Latino                           35.8                     28.4                    24.3                       29.1
 % White                             9.5                     36.1                    46.6                       32.0
 % Poverty a                        25.3                     20.3                    15.9                       20.2
 % Households                       34.3                     22.8                    10.9                       22.0
 receiving SNAP

 Population Size                   2,480,421               3,067,524                2,986,145               8,534,090
 Sources: Research Alliance calculations based publicly available data from the 2018 NYC Department of Health, Community
 Health Profiles and the 2017 Feeding America project via DATA2GOHEALTH.NYC, 2018.

 Notes: Calculations include food insecurity rates for all NYC Community Districts (N=59) in 2017. New York City Community
 Districts are governed by community boards and usually include multiple NYC neighborhoods. Demographic proportions refer to
 the total number of residents who reside in each Community District.
 a
   Poverty refers to the proportion of residents that live below the federal poverty line in the Community Districts.

Disproportionate rates of food insecurity in these communities are not only related to higher rates
of poverty, but the characteristics of neighborhoods that make healthy, fresh food more difficult to
find and afford. In densely populated cities such as NYC, unhealthy neighborhood food
environments are characterized less by the absence of supermarkets, and more by the
oversaturation of unhealthy food options—such as fast food chain restaurants. Research
demonstrates that in NYC low-income Black and Latino residents have more unhealthy food
options in their neighborhoods.12 This is particularly the case in low-income predominately Black
neighborhoods—suggesting that racial segregation plays a role in neighborhood food disparities.13
Table 2 shows that the CDs with high and moderate levels of food insecurity had, on average, over
double the bodega-to-supermarket ratio as the CDs with the lowest rates of food insecurity.
Bodegas and corner stores are generally less likely to stock fresh produce than supermarkets, and
more bodegas or corner stores in low-income urban neighborhoods have been linked to greater
access to unhealthy food.14 While, on average, the 21 CDs with low food insecurity rates have 9
bodegas for every 1 supermarket, the 19 CDs with high rates of food insecurity have 21 bodegas for
every supermarket.
 Table 4: Select Health Indicators, by Community District Food Insecurity Rate
                                      High Food               Moderate Food             Low Food             NYC Overall
                                    Insecurity CDs            Insecurity CDs          Insecurity CDs
 # of CDs                                 19                        19                      21                      59
 # of Gentrifying CDsa                    10                         7                       0                      17
7
Average Bodega- 21 19 9 16
Supermarket Ratiob
% No Fruit or Vegetablec 17.4 12.3 9.0 13.0
% Child Obesity 22.7 20.1 15.4 20.0
Population Size 2,480,421 3,067,524 2,986,145 8,534,090
Sources: Research Alliance calculations based publicly available data from the 2018 NYC Department of Health, Community
Health Profiles and the 2017 Feeding America project via DATA2GOHEALTH.NYC, 2018.
Notes: Food Insecurity data is collected at the PUMA (Public Use Microdata Areas) level, a US Census statistical area, which
can be mapped onto NYC Community Districts. New York City has 59 Community Districts, which are governed by community
boards. They usually include multiple NYC neighborhoods.
a
The Community District gentrification indicator is from the NYU Furman Center’s 2015 State of NYC’s Housing and
Neighborhoods report. Community districts were classified as gentrifying if they were low income in 1990 and experienced higher
than median rent increases between 1990 and 2010-2014.
b
This refers to the number of bodegas per supermarket within a CD based on address of business.
c
This refers to the percentage of adults ages 18 and older who reported not eating one or more servings of fruits and/or
vegetables in the last day, as measured through the NYC DOHMH, Community Health Survey.
Access to healthy food is not just about proximity, it is also about affordability. In general, energy-
dense, processed food costs less per calorie than nutrient-dense food, such as fresh produce and
lean proteins, making an unhealthy diet cost less per day than a healthy diet. 15 Low-income parents
might also be reluctant to purchase more expensive healthy food items, especially if there is a
greater risk that their children will dislike the food and it will go to waste.16
As a result, even when low-income residents have access to supermarkets that sell healthy food,
they might find that these choices are not affordable. Research suggests this may be especially true
of low-income residents who live in rapidly gentrifying neighborhoods, where high-end
supermarkets might replace stores that used to sell more reasonably priced food.17 As Table 2
shows, of the 19 CDs with high rates of food insecurity, 10 are gentrifying. When we look at the 5
CDs with the very highest levels of food insecurity, we find that 4 of the 5 are gentrifying. Given
the many barriers low-income residents face in accessing and affording healthy food, it is perhaps
unsurprising that, on average, the CDs with high food insecurity also have the highest rates of adults
reporting that they have not eaten a serving of fruits or vegetables in the past day, as well as the
highest rates of childhood obesity (see Table 2).
Food Assistance Programs
School meals programs provide critical access to nutritious foods, which is especially important for
students from low-income, food-insecure families. In addition to other programs such as SNAP
(Supplemental Nutrition Assistance Program), which directly help low-income families purchase
food, many economically vulnerable households rely on school-based meal programs to ensure that
their children are served breakfast and lunch. In a typical year, NYC public schools serve over
900,000 meals to students each day.18 School meals, along with other food assistance programs—
all of which have strict nutrition requirements—are a vital part of the social safety net.8
In the summer, when children are no longer in school to receive meals, rates of food insecurity
increase sharply among low-income families.19 This is especially true for families receiving SNAP
benefits—which do not increase over the summer months—who struggle to absorb the additional
cost of food without school meals.20 Inadequate nutrition can have serious developmental
consequences for children, including lower academic performance, social-emotional difficulties,
and worse health outcomes.21
Summer meals programs aim to bridge the gap in food assistance, but participation is generally low.
While NYC ranks among the top performing cities in summer meals participation, only 36 percent
of children who were eligible for free or reduced priced lunch also participated in summer meals
programs. Our research is designed to shed light on this disparity and to foster a better
understanding of any barriers that are preventing low-income families from taking advantage of
these programs.
Taking Stock of Parents’ Perspectives and Experiences
As Figure 2 shows, in 2019 there were three types of sites in NYC where children under 18 could
receive free meals—summer school sites that serve meals to children attending summer school;
summer partner sites, which are usually summer camps for children that serve meals; and public
meals sites where children can just drop in to eat. Of those public sites, over half were public
school sites, where children could visit a school building to eat in the cafeteria (see Figure 2). Parks
and pools, libraries, and a collection of other sites—located at community centers, NYCHA
housing projects, and churches—also served meals.
Figure 2: 2019 NYC Summer Meals Sites by Site Type
All Summer Meals Sites (N=1,313) Public Meals Sites (N=522)
301 112
522
67 275
490 68
Public Meal Sites Summer School Sites School Sites Park or Pool Sites
Summer Partner Sites Library Sites Other Sites
Source: Research Alliance calculations based on data obtained from the NYC Department of Education.
Notes: Data includes all 2019 Summer Meal Sites. N=1,313.9
The parents described their children spending their time over the summer in a variety of ways—
including at home, in structured settings such as summer camps or summer school, out in the
neighborhood with their families or caregivers, or even in other states or countries to visit relatives.
About a quarter of the parents who we spoke with did not take advantage of any of the free summer
meals options. Of the parents who did, a little less than half reported that their children were
enrolled in summer school or summer camp where they would receive meals. However, the
parents whose children went to summer camp noted that these programs were not always in
operation for the entire summer. For that reason, some of the summer camp parents also took
advantage of summer meal sites open to the public. About a third of the parents reported that their
children ate meals at public drop-in meal sites—such as parks, pools, and libraries.
What Were Some of the Reasons Why Parent Did Not Participate in
Summer Meals Programs?
Consistent with other research, we found that a lack of information was a major barrier to
participation in summer meals programs. 22 Only a few parents knew that they could call, text, or
go online to look up meal locations and schedules. Parents’ knowledge of meal site locations was
largely shaped by what sites were located in their community. Parents who lived near multiple sites
that were open to the public—especially parks, pools and libraries—were more likely to know
about the summer meals programs.
The schools varied in the number of public summer meals sites that were nearby (see Table 5). In
2019, the school in the Mott Haven neighborhood in the Bronx only had four school sites and three
parks/pools in its Community District and none in its census tract, while the school in Central
Harlem—a community with much greater population density—had a school site its census tract
and eight school sites, three park/pool sites, and nine other sites (including churches and a food
bank) in its CD. Almost none of the parents from the Mott Haven school knew about public
summer meal sites, while most of the parents from the Central Harlem school did.
Table 5: School Focus Group Information and Nearby Summer Meals Sites in
Summer 2019
School School Public Summer Meal Public Summer Meal Sites in Wider
Borough Sites in School Community District b
Census Tract a10
Bedford Bronx 1 school (the school 5 schools;
School itself) 1 park; and
1 other site (mobile truck)
Bushwick Brooklyn 1 school (the school 4 schools;
School itself); and 1 parks/pools;
1 public library site 2 public libraries; and
1 other site (a camp)
Central Manhattan 1 school 8 schools;
Harlem 3 parks/pools;
School 9 other sites (including churches, mobile
truck, food bank)
East New Brooklyn 1 school site (the school 8 schools;
York School itself) 2 public libraries; and
3 other sites (including camps, church and
NYCHA sites)
Longwood Bronx 1 school 5 schools;
School 2 parks/pools; and
1 other site (a church)
Mott Haven Bronx None 4 schools; and
School 3 parks/pools
Sunset Park Brooklyn 1 school (the school 5 schools; and
School itself) 1 park/pool
University Bronx 1 school (the school 7 schools;
Heights itself) 2 parks/pools; and
School 2 other sites (a church and a NYCHA site)
Source: Research Alliance calculations based on 2019 summer meals site location data obtained from the NYC DOE website.
Notes: Table includes information about all of the focus group schools (N=8), which were given pseudonyms based on the
school neighborhood. We used QGIS to map the locations of the schools and nearby summer meals sites.
a
A census tract is roughly equivalent to a neighborhood, as estimated by the US Census Borough.
b
New York City has 59 Community Districts, which are governed by community boards. They usually include a couple of NYC
neighborhoods.
The parents were more likely to find out about public meal sites through word of mouth from
other parents in their community, or because they happened to be spending time with their
children at one of the locations where meals were served. A parent from the school in Central
Harlem, which was located near the most sites open to the public of any of the schools—including
three parks and pools—talked about finding out about free summer meals because she stumbled
upon a summer meals site at a park. She said,
“I was actually surprised, ’cause I went to the park, and then my son came back with
a bag of food. I’m like, ‘Where did you get that from?’ He said, ‘Oh, the lady gave it
to me.’ I went to the table, and I saw that it was a program, and they were also
offering activities for the kids at the same time, like games and stuff.”11 Even though the majority of public summer meals sites are schools, parents expressed reluctance about visiting them in the summer to receive free meals. While all of the schools except for three—those in the Longwood, Central Harlem and Mott Haven neighborhoods—served as a summer meals site that was open to the public (see Table 5), very few parents visited their child’s school to receive summer meals. Research has documented that fear and distrust among low-income parents of color often act as barriers to parents coming to schools to participate in family engagement activities.23 In line with this body of research, parents we spoke with said that visiting a school, especially one that their child did not attend, could be intimidating. Some parents also believed that visiting a school for a free meal could be stigmatizing or embarrassing for families because doing so made it obvious that the family was struggling to afford food. Both of these factors helped explain why most of the parents preferred receiving summer meals at sites within their community—like parks, pools, and libraries—a finding that is consistent with other research on summer meals programs.24 One parent, from the school in the University Heights neighborhood in the Bronx, who had not participated in summer meals programs because he did not know that they were available at parks and pools said, “Coming to the school in the summer, you kinda feel intimidated to come to the school for food, [because] people gonna say, ‘Oh, they don’t have food at their house. They have to come to the school.’ At the park, you know, everybody’s always at the park with their kids, so you go to the park, get your food, eat there, and go home. Nobody knows nothing.” Anti-hunger and nutrition advocates and program leaders are increasingly concerned that anti- immigrant policies—such as the Department of Homeland Security’s recent public charge rule— might create additional barriers to access for undocumented and mixed-status immigrant families.25 Evidence suggests that undocumented families enroll in government assistance programs, like WIC or SNAP, at lower rates because they fear punitive immigration law enforcement, such as raids or deportation.26 While we took care to not ask parents directly about their own immigration status, we did ask the focus groups about their sense of whether undocumented families might face unique barriers to access due to fear of law enforcement. Their views were mixed. Some parents said that because free meal programs do not ask for ID, and just serve meals to any children under 18 years of age, undocumented families could participate without fear—and gave examples of undocumented family members or friends who took their children to meal sites. However, many parents— especially those in the focus groups we conducted in Spanish—did mention that there was a general climate of fear among undocumented families that made people afraid to spend time outside over
12

the summer. During the focus group at the Sunset Park School in Brooklyn, where nearly half of
the people in the community were born outside of the United States,27 one parent said,
“I have spent many years in the park during summers, since my daughter started
taking swimming lessons, and it was just super crowded. But this summer, if you saw
20 people, that was a lot. My son plays soccer at the park, and when they said there
might be a raid—that next day, only the children showed up to play soccer, the
parents were all absent.”
Another parent agreed. “The police go to where there are more people, so the
community is afraid, not just individual people, it’s everyone,” she said. “Even the
children are worried because they know who their parents are and where they come
from. They too are getting scared. Better to stay home.”
These parents’ accounts are in line with other research that undocumented families fear
congregating in public spaces where they feel vulnerable.28 This might discourage families from
being out in the community during the summer, which could limit how much they use summer
meals programs, especially those that are open to the public.
What Were Some of the Benefits of Summer Meals Programs?
All of the focus group schools were located in CDs that had higher rates of food insecurity and
lower community health indicators than NYC on average (see Table 6). In light of this, it is perhaps
unsurprising that parents generally believed that summer meals programs were beneficial for
families, as the programs could help families meet their nutritional needs over the summer when
budgets were tighter. Money that would have been spent on breakfast or lunches could go toward
other expenses. Parents also mentioned that free meal programs saved them time, as they did not
have to pack or prepare breakfasts or lunches for their children.

 Table 6: Health Indicators for Focus Group Schools’ Community Districts
 School            School        % Food       % Household          Bodega to         % No Fruit or
                  Borough       Insecure a     receiving          Supermarket        Vegetables c
                                                 SNAP               Ratio b
 Bedford            Bronx          17.6           41.8                18                 16.0
 School
 Bushwick          Brooklyn        17.0            32.2                31                18.0
 School
 Central          Manhattan        25.7            23.4                11                16.0
 Harlem
 School
 East New          Brooklyn        21.8            34.1                13                24.0
 York School
13 Longwood Bronx 20.9 51.6 20 18.0 School Mott Haven Bronx 20.9 52.2 25 18.0 School Sunset Park Brooklyn 13.5 23.8 45 13.0 School University Bronx 21.6 52.5 20 22.0 Heights School NYC Overall ______ 12.8 22.0 16 13.0 Source: Data is from the 2018 NYC Department of Health, Community Health Profiles Notes: Table includes indicators for each focus group school’s Community District. The last row contains averages for NYC overall. a Food Insecurity refers to proportion of households where there is not always sufficient food for all members of their households to live active, healthy lives. Data is collected at the PUMA (Public Use Microdata Areas) level, a US Census statistical area, which can be mapped onto NYC Community Districts. b This refers to the number of bodegas per supermarket within a CD based on address of business. c This refers to the percentage of adults ages 18 and older who reported not eating one or more servings of fruits and/or vegetables in the last day, according to the Community Health survey. Parents also appreciated that summer meals gave their children access to healthy food, which could be expensive or hard to find for families in their communities. A parent from the school in the Bedford neighborhood in the Bronx, where bodegas outnumber supermarkets 18 to 1, and 16 percent of adult residents reported not eating a serving of fruit or vegetables in the past day, explained how the meals programs help parents save money, and provide access for costly foods– like fresh fruit. She said, “You don’t have to spend money for lunch or breakfast, which is pricy. Especially, in the summer, because if you’re out and about, going to parks, it can be expensive. If they provide the food for the kids, it’s one less thing that you have to. And the fresh fruit and vegetables that they give…sometimes you only have enough for bare necessities…you can’t have that fruit every day in your house because it spoils if you don’t hurry up and eat it.” Parents described benefits to summer meals programs that go beyond just the free meals. Parents appreciated that these sites provided the opportunity for children to interact with other children, and participate in activities, without them having to sign their child up for a summer camp in advance. Indoor locations also allowed children and caregivers could be in a cool air-conditioned place during the hot summer. A grandparent, from the school in the Bushwick neighborhood in Brooklyn, where nearly a quarter of residents do not have functioning air-conditioning units in their homes,29 talked about how she would take her grandson to the nearby public library to spend the day, because it was a cool air-conditioned place, with activities for him to do. The fact that the library had started serving meals made it even more convenient for her. She said,
14

“I used to have to tell him, ‘Come on, let’s take a break,’ because we couldn’t be at
the library from open to close. I’d take him to McDonalds or something to get food.
And then we’d come back. But [with the summer meals] I don’t have to leave. He
can just stay and be on the computer, or watch the movie. They’re feeding him.”
Research indicates that parents value summer meals locations that provide enriching activities for
children to participate in, along with food. 30 The focus group parents appreciated sites open to the
public in locations where children could eat and stay occupied during the day. These locations—
such as parks, pools and libraries—were places that caregivers would have likely taken their
children anyway, making them convenient and reducing the fear of stigma.
What Were Some of the Obstacles That Parents Faced at Summer Meals
Sites?
Many of the difficulties that parents reported having at summer meals sites seem to stem from the
regulations that dictate how the meals are served—or, at least from perceptions about those
regulations, among staff and/or families. Summer meals staff have to follow a host of regulations to
ensure that the meals are reimbursable. The parents we spoke with talked about regulations—such
as those that prohibited them from taking food off site; that required children to take entire meals
(and not just the specific items they want); and that required that food only be served during a set
timeframe31—as barriers to their participation in the program. While parents understood that meal
staff had to follow these regulations, they reported that staff could be curt in the way that they
communicated the rules to families and children. Parents were especially taken aback about the
ways that some meal staff enforced the requirement that no adults eat any of the food.
Parents reported that the brusque rule enforcement happened more at school sites, perhaps because
school cafeterias offer a less relaxed, communal setting, compared to a library, park or pool. In the
school in the Bedford neighborhood in the Bronx, families cited treatment from staff as the main
reason why they did not like going to the school for meals over the summer, despite the fact that
the school principal and parent coordinator did a lot of outreach to families to let them know about
the program. The parents described seeing meal staff monitoring parents, and reprimanding them if
their child shared some food with them. One parent said,
“One thing that has brushed me off from coming [to the school] is the people
working for the free lunch. They make you feel not really welcomed. You don’t want
to come back to get that treatment, so you find elsewhere.”
Another parent agreed with her. “We came, and they made it understood this is just for
the child, not for you,” she said. “It’s rude. We do understand that it’s only for the
kids. When they come and say, ‘No! It's not for you!’ it was very aggressive.”
15

Although it is hard to know how widespread this was in practice, another concern that parents
reported across most of the focus groups was the sense that a lot of food was being thrown out at
meals sites. This bothered them, especially because of their understanding that adults were not
supposed to eat any of the food, and families were not supposed to take food that their child did not
finish. In the school in Central Harlem, a parent talked about how the time slot to serve and eat
lunch at a nearby pool during the summer is only one hour, which meant that a lot of food was
being wasted. She said,
“The only thing I don’t like is I see them throwing out a lot of the food. I see a lot of
the food getting dumped. (Because) they don’t give you past that one hour.”
Another parent added, “The food they can’t eat, you might as well just tell the parents,
‘Hey, anybody wanna eat? Come get it,’ or stand outside the pool and give it to the
homeless.”
In this focus group, parents also described seeing other parents hiding food from meal staff to take
it home. They wondered why it was better to throw out food than give it to parents who might be
hungry. Parents wondered why the extra food could not be given to parents, older siblings, or
other caregivers who might be hungry, or given away to local churches or homeless shelters for
hungry people in their communities.
What Are Some Suggestions that Parents Have to Improve Summer Meals
Programs?
The suggestions from parents to improve summer meals programs fell into three categories—ways
to improve outreach; ways to improve the experiences that parents and children had at the meal
sites; and ways to get feedback from children to make sure that they liked (and would eat) the food.
Parents believed that outreach from their child’s school would be a good way to let caregivers
know about summer meals sites, because the information would come from a trusted source, and
schools have the potential to reach the most parents. While we do not know if and to what extent
the schools in our study attempted to provide information about summer meals to parents, it was
the impression of parents in some of the focus groups that they had not received any. In the school
in the Mott Haven neighborhood in the Bronx, very few parents knew about summer meals sites,
and had recommendations about how to best get the information out. One parent suggested that
the school could relay information about summer meals through packets distributed to students
before the end of the school year. She said,
 “[The packet] could give information, like a calendar, explaining the program, and
sending out a web page, if there is one. It could be put up on social media.”
Another parent agreed with her. “At each school they should tell the children before they
leave school so that they are informed,” she said. “And the word will be spread.”
16

Along with information packets for students to take home, parents largely agreed that schools could
use technology to notify parents—through posting on social media websites like Facebook or
Twitter, or sending messages through parent-teacher communication platforms like Class Dojo.
Parents emphasized that it was important for this information to include which public summer sites
are located in the school’s surrounding community (e.g. any parks, pools and libraries), and the
times that meals are served. While there were no meal sites in the immediate vicinity of the Mott
Haven school, there were several park and pool sites in the larger CD. The parents said that they
would have planned to travel a little further to take their children to those parks if they had known
they served free meals.
In addition to improving outreach, parents had suggestions about making schools more welcoming
places for families to receive meals, which is important because the majority of meal sites are
schools. A parent at the Mott Haven school—which is not a summer meal site—described how it
was intimidating to visit an unfamiliar school for meals. She said,
“It’s also scary to enter the schools. I know they give out food but just going into any
school…at a park or pool [it’s not], but without knowing the school, it’s scary to
enter.”
She suggested having staff outside of school sites to welcome children and parents in from the
community, and help show them where the cafeteria was, to make it less intimidating.
Parents also believed that summer meals staff could be trained to better communicate about the
restrictions that regulations impose on meal service to families, and to be more welcoming and
friendly to families. A parent from a school in East New York, in Brooklyn, said that instead of
going to their own school for meals where staff could be curt, her children preferred going to
another nearby school, where staff were friendly with the children. She said, “[The children] are
supposed to feel welcome, like when you go to somebody’s house. If [meal staff]
make a face like, ‘You’re only here for the free food, or something,’ it’ll end up that
people won’t come.”
She described the atmosphere at the school nearby as much more welcoming. “When the kids
come in, [the meal staff] talks to them. They tell them what’s on the menu. They say
things like, ‘Hi, how are you doing? I haven’t seen you in a couple of days. Are you
okay?’”
Finally, parents largely believed that the quality of the food the programs served could be
improved, so that children would like the meals more. Parents had mixed views about whether the
foods served should be more culturally oriented. Some believed that might make children like the
meals better, but others said that it was better just to serve kid-friendly items (e.g., fruit cups and
17

pizza). One parent from the school in Central Harlem suggested surveying students to see what
they liked the most. She said,
“I was watching the news recently, and they had a whole event for a school meal
program where they had kids try out different things that they’re gonna be
introducing. I think the same attention should be given to the summer meals. They
could have a test panel—and pick some kids from different areas, different religions,
different diversities, so that they have different likes, and let them sit down and test
it.”
Parents who had information about summer menus said that their children would choose to go to
summer meals sites on certain days based on what was being served. Parents suggested that sites
find out which food items were the most popular with students, and then always try to have those
items on hand to reduce food waste.

Implications for Summer Meals Program Design and Policy
The perspectives of the focus group parents provide feedback that can be useful for summer meals
program design and policy changes to reduce barriers to families’ participation. First, parents
believed that conducting more outreach about summer meal programs through schools would be an
effective way to get information out. This is in line with other research that suggests that educators
are trusted sources of information about summer meal programs for parents. 32 Efforts to ensure
that summer meals site information is released to schools before the summer begins is a step in the
right direction.33 While schools may already be sharing information with parents, the fact that some
focus group parents reported that they did not receive any suggests that there may be room for
improvement—perhaps that it should be shared more often or in a variety of formats. Parents also
stressed that the information they received should include site location and meal time information.
Other research suggests that having parents call an information hotline to get this information might
be an additional barrier to participation.34 Schools could let parents know location and meal time
information for the sites that are near to the school, in addition to letting them know how they
could look up summer meals information—either on the meals website, on social media, or with
the NYCDOE’s mobile summer meals app—if they happen to be spending time outside of their
neighborhood.
Second, when it comes to public meal sites, parents preferred sites in the community—like parks,
pools or libraries, as opposed to school cafeterias. Sites in the community were convenient
locations that parents and caregivers were likely to take children to during the summer anyway, and
parents found going to these locations less stigmatizing. Program designers should consider
expanding the number of community sites that serve summer meals. Moreover, given that most
meal sites are schools, program designers should consider ways to make meal sites more welcoming
18

to families. This might include having staff participate in hospitality training, or be on hand to
welcome parents into school buildings and let them know where the cafeteria is.
Finally, the parents offered some insights into larger program changes that could remove some
obstacles to their participation. Research suggests that easing regulations, such as the congregate
requirement that meals must be eaten on site and that prohibit adults from eating food, might
increase participation.35 In the wake of the COVID-19 pandemic, the federal government has
waived many of these requirements to ensure that children and families could receive meals during
the school year even though school buildings are shuttered.36 As of the writing of this brief, the
NYCDOE Office of Food and Nutrition Services shifted to a model similar to its summer meals
programs—and began to offer grab and go meals three times a day—at over 400 school locations in
communities with higher rates of food insecurity.37 This strategy relies on the waiving of federal
regulations that would normally prohibit parents from picking up more than one meal at a time and
bringing them home. Devastatingly, due to economic shocks from the pandemic crisis, there is
evidence that rates of food insecurity have grown.38 Meal providers will need flexibility to ensure
that meal delivery is responsive to the needs of families, even as COVID-related restrictions
continue to be lifted. Our findings suggests that permanent changes aimed at this kind of flexibility
may be key to increasing families’ participation in summer meals programs.
Endnotes
1 See Coleman-Jensen, A. et al. (2019), for more details on how food insecurity is defined and measured.
2 See Gibson, A. (2018).
3 In NYC, there are 59 geographically based Community Districts, which are governed by local community boards. They range in

the size of their population from approximately 50,000 to 200,000 residents. See the NYC Department of City Planning’s
Community Portal website for more information.
4 See Huang. et al. (2015) and Nord & Romig (2006).

5 See NYC Office of Food and Nutrition Services (2019) and Fu & Kang (2018).

6 See Huger Solutions New York (2019).

7 See Binder, C. (2016) and Amstutz, et al. (2019).

8 We drew on data from Feeding America’s Map the Meal Gap project (2019) via DATA2GOHEALTH.NYC (2018), which

brings together federal, state and local data on a range of health indicators. We use data on rates food insecurity and proportions
of SNAP recipients collected at the Community District and PUMA (Public Use Microdata Areas) levels (which roughly
correspond to Community Districts). We also draw on data from the NYC Department of Health and Mental Hygiene’s
Community Health Profiles (2018), which include measures of neighborhood health at the Community District level, compiled
from various local agencies and research centers.
9
  See Vaughn, et al. (1996)
10 This recruitment list of 105 schools was generated by using American Community Survey census data for the schools’ census

tracts, and school-level data on the proportions of students eligible for free or reduced priced lunch. We first included all schools
that were in the top quintile in terms of the Neighborhood Disadvantage Index, measured by the proportions of (1) non-white
residents, (2) families under the federal poverty line, (3) unemployed residents, (4) female-headed households, (5) residents
receiving public assistance, and (6) residents under the age of 18. Then from that group of schools, we selected schools that were
19

in census tracts with poverty rates above average for that group, and that had above the city-wide average proportion of students
qualifying for free or reduced priced lunch.
11 See Luker, K. (2009) and Saldana, J.(2015).

12 See Kwate et al. (2009)and Neckerman et al. (2010)

13 See Kwate et al. (2009)

14 See Bower, K. et al. (2014) and Truehaft, S. & Karpyn A. (2010).

15 See Darmon, N. & Drewnowski, A. (2008) and Rao et al. (2013).

16 See Daniel, C. (2016).

17 See Bryer, B. & Voss-Andreae, A. (2013), Cohen, N. (2018) and Anguelovski, I. (2015).

18 See Leos-Urbel et al. (2013).

19 See Huang. et al. (2015) and Nord & Romig (2006).

20 See Almada, L. & McCarthy, I. (2017).

21 See Alaimo, et al.(2001) and Jyoti, et al. (2005).

22 See Binder, C. (2016).

23 See Edwards, P. A.(2016).
24 See Bruce, et al. (2017) and (2019).

25 See Food Action and Research Center, (2020).

26 See Vargas, E. & Pirog, M. (2016) and Perreira, K. & Pedroza, J. (2019).

27 See NYC Department of Health and Mental Hygiene’s Community Health Profiles (2018).

28 See California Food Policy Advocates (2017).

29 See NYC Department of Health and Mental Hygiene’s Community Health Profiles (2018).

30 See Binder, C. (2016) and Amstutz, et al. (2019).

31 See USDA (2016, pp. 60–65).

32 See California Food Policy Advocates (2017).

33 See NYC Food Policy Center (2017)

34 See Binder, C. (2016).

35 See Amstutz, et al. (2019).

36 See Fulks, et al. (2020).

37 See Strong, A. (2020).
38 See Bauer, L. (2020)

References
Alaimo, K., Olson, C., & Frongillo, E. (2001). Food insufficiency and American school-aged children’s cognitive, academic, and
          psychosocial development. Pediatrics, 108(1), 44–53. PubMed.
Almada, L., & McCarthy, I. M. (2017). It’s a cruel summer: Household responses to reductions in government nutrition
          assistance. Journal of Economic Behavior & Organization, 143, 45–57. https://doi.org/10.1016/j.jebo.2017.08.009
Amstutz, N., Brenner, D., & Berg, J. (2019). Summer Meals for Children: Site Barriers and Opportunities. Hunger Free America.
          https://www.hungervolunteer.org/sites/default/files/atoms/files/Summer%20Meals%20Barriers%20and%20Oppo
          rtunities%20Report%202019.pdf
Anguelovski, I. (2015). Healthy Food Stores, Greenlining and Food Gentrification: Contesting New Forms of Privilege,
          Displacement and Locally Unwanted Land Uses in Racially Mixed Neighborhoods. International Journal of Urban and
          Regional Research, 39(6), 1209–1230. https://doi.org/10.1111/1468-2427.12299
Bauer, L. (2020). About 14 million children in the US are not getting enough to eat. Hamilton Project, Brookings Institute.
Binder, C. (2016). Summer Meals Barrier Analysis. Hunger Free NYC.
20
Bower, K. M., Thorpe, R. J., Jr, Rohde, C., & Gaskin, D. J. (2014). The intersection of neighborhood racial segregation,
poverty, and urbanicity and its impact on food store availability in the United States. Preventive Medicine, 58, 33–39.
PubMed. https://doi.org/10.1016/j.ypmed.2013.10.010
Breyer, B., & Voss-Andreae, A. (2013). Food mirages: Geographic and economic barriers to healthful food access in Portland,
Oregon. Health & Place, 24, 131–139. https://doi.org/10.1016/j.healthplace.2013.07.008
Bruce, J. S., Cruz, M. M. D. L., Moreno, G., & Chamberlain, L. J. (2017). Lunch at the library: Examination of a community-
based approach to addressing summer food insecurity. Public Health Nutrition, 20(9), 1640–1649.
https://doi.org/10.1017/S1368980017000258
Bruce, J. S., De La Cruz, M. M., Lundberg, K., Vesom, N., Aguayo, J., & Merrell, S. B. (2019). Combating Child Summer
Food Insecurity: Examination of a Community-Based Mobile Meal Program. Journal of Community Health, 44(5), 1009–
1018. https://doi.org/10.1007/s10900-019-00675-0
California Food Policy Advocates. (2017). Latino Children and Summer Meal Programs: Insights from Latino Parents in Mixed Status
Families. California Food Policy Advocates.
Cohen, N. (2018). Feeding or Starving Gentrification: The Role of Food Policy. CUNY Urban Food Policy Institute.
Coleman-Jensen, A., Matthew Rabbitt, Gregory, C., & Singh, A. (2019). Household food security in the United States in 2018.
U.S. Department of Agriculture-Economic Research Service, 2070.
https://www.ers.usda.gov/webdocs/publications/94849/err-270.pdf?v=963.1
Daniel, C. (2016). Economic constraints on taste formation and the true cost of healthy eating. Social Science & Medicine, 148, 34–
41. https://doi.org/10.1016/j.socscimed.2015.11.025
Darmon, N., & Drewnowski, A. (2008). Does social class predict diet quality? The American Journal of Clinical Nutrition, 87(5),
1107–1117. https://doi.org/10.1093/ajcn/87.5.1107
Edwards, P. A. (2016). New ways to engage parents: Strategies and tools for teachers and leaders, K–12. Teachers College Press.
Food Research and Action Center. (2020). The New Public Charge Rule Does Not Include Free and Reduced-Price School Meals.
https://frac.org/wp-content/uploads/new-public-charge-rule-does-not-include-frp-school-meals.pdf
Fu, J., & Kang, J. (2018, July 3). 30 million children rely on free school lunch. Where do they eat when school’s out? New Food
Economy. https://newfoodeconomy.org/summer-hunger-new-york-city/
Fulks, E., Anderson, S., & Harper, K. (2020). States can do more to help students access nutritious school meals during
pandemic-related school closures. Child Trends.
Gibson, A., Berg, J., & Aber, N. (2018). The Uneaten Big Apple: Hunger’s High Cost in NYC. Hunger Free America.
https://www.hungerfreeamerica.org/sites/default/files/atoms/files/NYC%20and%20NYS%20Hunger%20Report
%202018_0.pdf
Gundersen, C., Dewey, A., Crumbaugh, A., Kato, M., & Engelhard, E. (2019). Map the meal gap 2019: A report on county and
congressional district food insecurity and county food cost in the United States in 2017. Feeding America.
https://www.feedingamerica.org/sites/default/files/2019-05/2017-map-the-meal-gap-all-modules_0.pdf
Huang, J., Barnidge, E., & Kim, Y. (2015). Children Receiving Free or Reduced-Price School Lunch Have Higher Food
Insufficiency Rates in Summer. The Journal of Nutrition, 145(9), 2161–2168. https://doi.org/10.3945/jn.115.214486
Hunger Solutions New York. (2019). New York State Summer Food Service Program: Status Report. Hunger Solutions New York.
https://hungersolutionsny.org/wp-content/uploads/2019/07/Summer-Meals-Report-web-spreads-7_26_19.pdf
Jyoti, D. F., Frongillo, E. A., & Jones, S. J. (2005). Food Insecurity Affects School Children’s Academic Performance, Weight
Gain, and Social Skills. The Journal of Nutrition, 135(12), 2831–2839. https://doi.org/10.1093/jn/135.12.2831
Kwate, N. O. A., Yau, C.-Y., Loh, J.-M., & Williams, D. (2009). Inequality in obesigenic environments: Fast food density in
New York City. Health & Place, 15(1), 364–373. https://doi.org/10.1016/j.healthplace.2008.07.003
Leos-Urbel, J., Schwartz, A. E., Weinstein, M., & Corcoran, S. (2013). Not just for poor kids: The impact of universal free
school breakfast on meal participation and student outcomes. Economics of Education Review, 36, 88–107. PubMed.
https://doi.org/10.1016/j.econedurev.2013.06.007
Luker, K. (2009). Salsa Dancing into the Social Sciences. Harvard University Press.21
Measure of America, Social Science Research Council. (2018). DATA2GOHEALTH.NYC. www.data2gohealth.nyc
Neckerman, K. M., Bader, M. D. M., Richards, C. A., Purciel, M., Quinn, J. W., Thomas, J. S., Warbelow, C., Weiss, C. C.,
Lovasi, G. S., & Rundle, A. (2010). Disparities in the Food Environments of New York City Public Schools. American
Journal of Preventive Medicine, 39(3), 195–202. https://doi.org/10.1016/j.amepre.2010.05.004
New York City Food Policy Center. (2017, November 13). Testimony: A Local Law to Amend the Administrative Code of the City of New
York, in Relation to Information Regarding Summer Meals. Int. No. 461-2014. NYC Food Policy Center.
https://www.nycfoodpolicy.org/testimony-local-law-amend-administrative-code-city-new-york-relation-
information-regarding-summer-meals-int-no-461-2014/
New York City Office of Food and Nutrition Services. (2019). Summer Meals: Free Breakfast and Lunch.
http://www.schoolfoodnyc.org/OurPrograms/breakfast.htm#summer
Nord, M., & Romig, K. (2006). Hunger in the Summer. Journal of Children and Poverty, 12(2), 141–158.
https://doi.org/10.1080/10796120600879582
NYC Department of Health and Mental Hygiene. (2018). How Healthy is Your Community? New York City Community Health Profiles.
https://www1.nyc.gov/site/doh/data/data-publications/profiles.page
Perreira, K. M., & Pedroza, J. M. (2019). Policies of Exclusion: Implications for the Health of Immigrants and Their Children.
Annual Review of Public Health, 40(1), 147–166. https://doi.org/10.1146/annurev-publhealth-040218-044115
Rao, M., Afshin, A., Singh, G., & Mozaffarian, D. (2013). Do healthier foods and diet patterns cost more than less healthy
options? A systematic review and meta-analysis. BMJ Open, 3(12), e004277. https://doi.org/10.1136/bmjopen-2013-
004277
Saldana, J. (2015). The Coding Manual for Qualitative Researchers. SAGE Publications, Inc.
Treuhaft, S., & Karpyn, A. (2010). The Grocery Gap: Who Has Access to Healthy Food and Why It Matters. Policy Link and The Food
Trust. http://thefoodtrust.org/uploads/media_items/grocerygap.original.pdf
United States Department of Agriculture. (2016). Administration Guide: Summer Food Service Program. https://fns-
prod.azureedge.net/sites/default/files/sfsp/AdminGuideSponsors.pdf
Vargas, E. D., & Pirog, M. A. (2016). Mixed-Status Families and WIC Uptake: The Effects of Risk of Deportation on Program
Use*. Social Science Quarterly, 97(3), 555–572. https://doi.org/10.1111/ssqu.12286
Vaughn, S., Schumm, J. S., & Sinagub, J. (1996). Focus Group Interviews in Education and Psychology. SAGE Publications, Inc.
https://doi.org/10.4135/9781452243641You can also read