A 3D Spatially Weighted Network for Segmentation of Brain Tissue From MRI
←
→
Page content transcription
If your browser does not render page correctly, please read the page content below
898                                        IEEE TRANSACTIONS ON MEDICAL IMAGING, VOL. 39, NO. 4, APRIL 2020

              A 3D Spatially Weighted Network for
             Segmentation of Brain Tissue From MRI
              Liyan Sun, Wenao Ma, Xinghao Ding , Yue Huang , Dong Liang , and John Paisley

   Abstract — The segmentation of brain tissue in MRI is
valuable for extracting brain structure to aid diagnosis,
treatment and tracking the progression of different neuro-
logic diseases. Medical image data are volumetric and some
neural network models for medical image segmentation
have addressed this using a 3D convolutional architecture.
However, this volumetric spatial information has not been
fully exploited to enhance the representative ability of deep
networks, and these networks have not fully addressed
the practical issues facing the analysis of multimodal MRI
data. In this paper, we propose a spatially-weighted 3D
network (SW-3D-UNet) for brain tissue segmentation of
single-modality MRI, and extend it using multimodality
MRI data. We validate our model on the MRBrainS13 and
MALC12 datasets. This unpublished model ranked first on
the leaderboard of the MRBrainS13 Challenge.
   Index Terms — Brain tissue segmentation, deep convolu-
tional neural network, spatial weighting, multimodality MRI.

                                                                                 Fig. 1. Some examples of axial brain MRI with different modalities
                          I. I NTRODUCTION                                       (first row) from different imaging scans and their corresponding manual
                                                                                 segmentation provided by expert radiologists (second row).

M       AGNETIC resonance imaging (MRI) of the brain
        provides safe, non-intrusive and valuable anatomical
and functional information for diagnosis, treatment, prognosis
                                                                                 disease and other brain disorders [8]. In this paper, we focus on
and brain development monitoring [22]. Brain parcellation
                                                                                 segmenting three major brain tissues: white matter (WM), gray
seeks to partition MRI into regions of similar features such
                                                                                 matter (GM) and cerebrospinal fluid (CSF). The segmentation
as intensity homogeneity, texture and physiological function.
                                                                                 on these three tissues helps visualize brain structures, analyze
Depending on the task, segmentation of brain tissue helps to
                                                                                 the physiological changes in the brain with age, and even
detect lesions such as tumors, Alzheimer’s disease, Parkinson’s
                                                                                 help guide surgery [5]. Manual segmentation by a human
  Manuscript received June 1, 2019; revised August 13, 2019; accepted            is laborious and requires expert medical knowledge. Thus
August 19, 2019. Date of publication August 23, 2019; date of current ver-       automatic brain tissue segmentation algorithms are useful for
sion April 1, 2020. This work was supported in part by the National Natural
Science Foundation of China under Grant 61571382, Grant 81671766,                such analyses.
Grant 61571005, Grant 81671674, Grant 61671309, and Grant                           Automatically segmenting brain tissue is challenging
U1605252, in part by the Fundamental Research Funds for the Central              because of high intra-class variation on anatomical structures
Universities under Grant 20720160075 and Grant 20720180059, in part
by the CCF-Tencent Open Fund, and in part by the Natural Science Foun-           among different imaging patients and the difficulty of distin-
dation of Fujian Province of China under Grant 2017J01126. The work of           guishing inter-class tissues [22]. This is illustrated by the axial
L. Sun was supported by Columbia University under China Scholarship              images shown in Figure 1, where the segmented regions vary
Council under Grant 201806310090. (The co-first authors, Liyan Sun
and Wenao Ma, contributed equally to this work.) (Corresponding author:          in size, shape and position. These three imaging modalities
Xinghao Ding.)                                                                   also exhibit variations in contrast. These multimodality brain
  L. Sun, W. Ma, X. Ding, and Y. Huang are with the School of Information        MRI are provided by the MRBrainS13 challenge [20].
Science and Engineering, Xiamen University, Xiamen 361005, China
(e-mail: dxh@xmu.edu.cn).                                                           Conventionally, brain tissue segmentation algorithms are
  D. Liang is with the Paul C. Lauterbur Research Center for Biomed-             built upon hand-designed features or atlas labels, which are
ical Imaging, Shenzhen Institutes of Advanced Technology, Chinese                limited by the complicated features of brain tissues. For this
Academy of Sciences, Shenzhen 518055, China.
  J. Paisley is with the Department of Electrical Engineering, Columbia          reason, deep convolutional neural networks (CNN) have been
University, New York, NY 10027 USA, and also with the Data Science               leveraged for medical image segmentation to learn better
Institute, Columbia University, New York, NY 10027 USA.                          feature representations.
  Color versions of one or more of the figures in this article are available
online at http://ieeexplore.ieee.org.                                               In this work, we propose a 3D spatially-weighted network
  Digital Object Identifier 10.1109/TMI.2019.2937271                             for brain tissue segmentation using MRI. We propose a

                   0278-0062 © 2019 IEEE. Personal use is permitted, but republication/redistribution requires IEEE permission.
                                 See https://www.ieee.org/publications/rights/index.html for more information.

      Authorized licensed use limited to: Columbia University Libraries. Downloaded on May 15,2020 at 00:21:33 UTC from IEEE Xplore. Restrictions apply.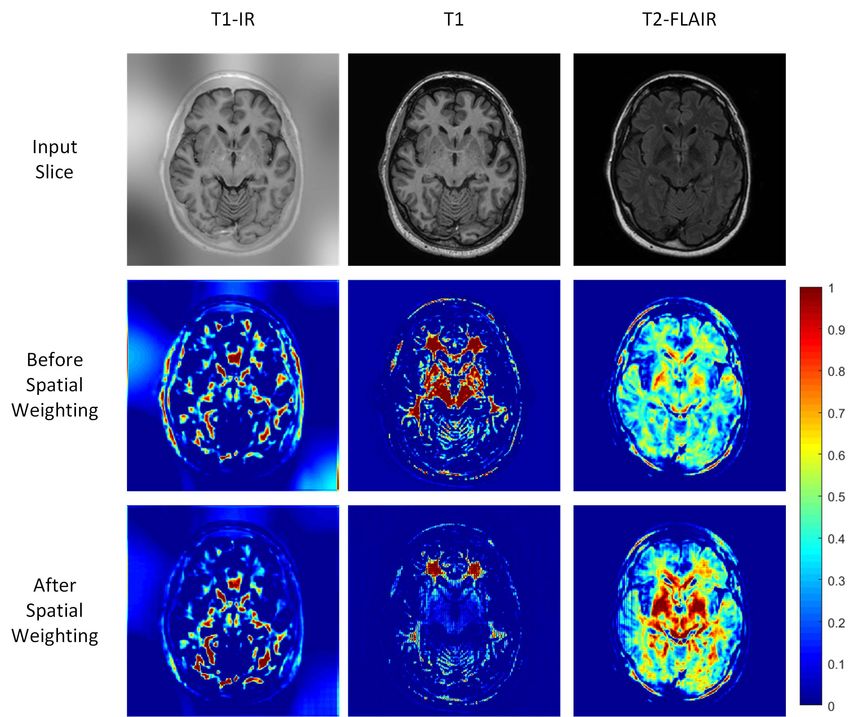
SUN et al.: 3D SPATIALLY-WEIGHTED NETWORK FOR SEGMENTATION OF BRAIN TISSUE                                                                                  899

volumetric feature recalibration (VFR) layer in combination
with plane-level modeling. An explicit low-rank regulariza-
tion helps focus modeling of the factors most important for
segmentation. We share features to account for multimodal
MRI. We use a deep supervision strategy to help information
propagate to the shallow layers of the model. Extensive
ablation studies are performed to validate the design of VFR
layer, information sharing among multimodality MRI and
deep supervision block. This proposed model ranked the first
place in the leaderboard in the MRBrainS13 Challenge1 [20].
                                                                                  Fig. 2. We visualize the 3D human brain and show the segmented
The proposed approach is also validated on the multi-label                        sample slices on the axial, coronal and sagittal planes.
brain segmentation task: MICCAI 2012 Grand Challenge and
Workshop on Multi-Atlas Labeling (MIAL) [18] with larger
datasets and finer brain labeling.                                                Some works extend the CNN to allow multiple pathways [13]
   The paper is organized as follows: We review research                          or input patches of different size [22] for multi-scale informa-
on brain tissue segmentation in Section II. We detail our                         tion aggregation. PyraMiD-LSTM [31] combines a CNN and
spatially-weighted 3D network model in Section III. We report                     long short-term memory (LSTM) to model spatio-temporal
experimental results and some discussions in Section IV.                          information. In a more related line of work, fully convolutional
We end with a conclusion in Section V.                                            networks (FCN) remove the fully connected layers to allow
                                                                                  various input sizes and dense predictions. This approach has
                         II. R ELATED W ORK
                                                                                  been applied to brain tissue segmentation using 2D [24] and
   Brain tissue segmentation models generally fall into three                     3D [23] architectures. Similar 3D convolution modeling can
categories, which we review below.                                                also be found in [10]; for example we will compare our results
   1) Atlas-Based Registration: Atlas (map template) methods                      with a 3D U-Net extension [6] and 3D ResNet extension [5].
provide reference for accurate segmentation assuming appro-                          Although an increasing body of work on brain tissue seg-
priate MRI registration (alignment). Atlas registration meth-                     mentation using convolutional networks has achieved impres-
ods use either label propagation or label fusion approaches.                      sive results, there are still some practical concerns:
For label propagation, one atlas map is spatially mapped or                          • Strategies for modeling MRI in its 3D volumetric form
deformed to the targeted medical volume [26]. To overcome                               are lacking. Developing spatial attention models can aid
the major limitation of the of label propagation approach                               the learned representation for segmentation.
resulting from insufficies of a single atlas, fusion based meth-                     • Different MRI settings are usually employed to acquire
ods fuse multiple label propagations to produce the segmen-                             richer and more complementary diagnostic information.
tation [2]. Although good performance is achieved based on                              Models capable of exploiting multimodal information in
the fusion of high-quality atlas references, the segmentation                           MRI can further boost segmentation quality.
error due to imperfect registration and limited representa-                          3D information in MRI data have been considered by
tive ability of atlas references are still major issues [5].                      applying the same set of 2D convolutional filters on the set
Probabilistic modeling strategies have been developed for                         of 2D slices [19], [36], and by using 3D convolutional kernels
atlas-based approaches [3], [29], [33] for acceleration and                       on the 3D volume for segmentation or detection [5], [6], [11].
multimodality MRI.                                                                Although 3D convolution is better able to extract features
   2) Hand-Designed Feature Models: Another line of research                      from volumetric data, increasing the kernel size to capture
applies machine learning algorithms on expert-designed fea-                       more contextual information introduces a cubically-growing
tures to perform voxel-wise classification. These include mod-                    number of network parameters, which may cause over-fitting
els based on the support vector machine (SVM) [21], Gaussian                      of data.
mixture model (GMM) [12], random forests [35] and hidden                             To further highlight the 3D spatial modeling problem for
Markov random fields [37]. The main drawback of these                             brain MRI segmentation, we visualize a 3D brain image
models is that their performance significantly depends on                         in Figure 2. We observe that intra-plane slices tend to
the predefined feature representation of the data. Given the                      change smoothly with the geometric shape of the anatom-
complexity of multimodal 3D MRI, this is a challenging                            ical brain. From the inter-plane view, the slices are quite
task.                                                                             different in shape, size and textures, providing multi-view
   3) Deep Learning Models: To address the limitations of                         information about the anatomical tissue. These two obser-
atlas-based registration and hand-designed feature mod-                           vations motivate us to model the spatial correlation within
els, deep learning models have been developed for brain                           each plane and combine their results in a volumetric model.
parcellation.                                                                     Some previous work has taken advantage of such triplanar
   Convolutional neural networks (CNN) can perform                                information [4], [27], [30]. However, these methods all focus
voxel-wise class prediction using contextual information.                         on applying 2D convolutions on the orthogonal slices and have
  1 http://mrbrains13.isi.uu.nl/results.php (first place team as of 11/7/2018).   not considered 3D spatial attention schemes for this triplanar
Team: XMU_SmartDSP2                                                               data.

       Authorized licensed use limited to: Columbia University Libraries. Downloaded on May 15,2020 at 00:21:33 UTC from IEEE Xplore. Restrictions apply.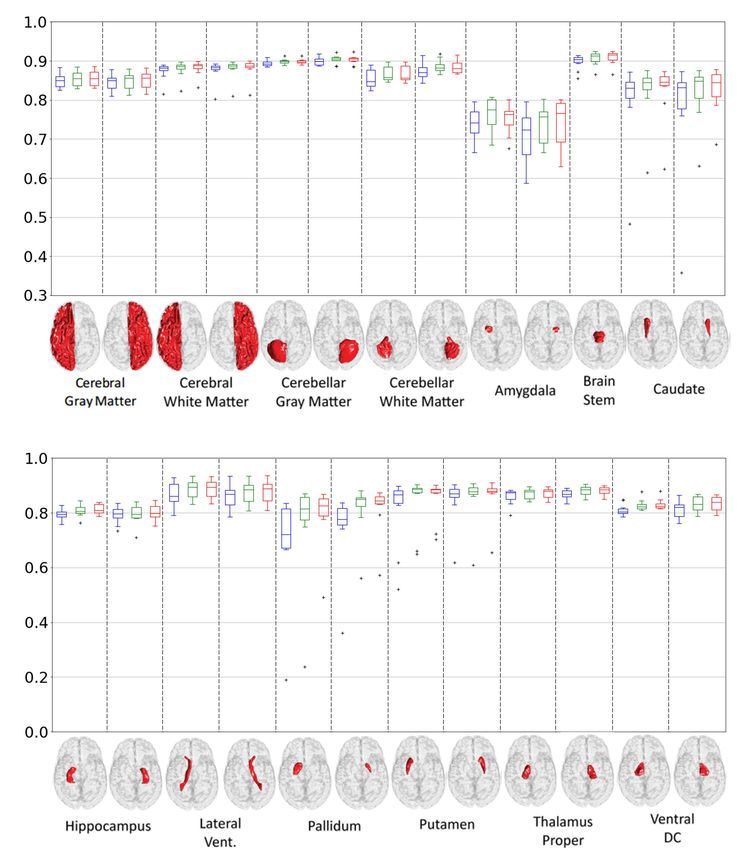
900                                                                                IEEE TRANSACTIONS ON MEDICAL IMAGING, VOL. 39, NO. 4, APRIL 2020

Fig. 3. The flowchart of the proposed volumetric feature recalibration layer (we show the pth channel for illustration). The compression transform
extracts statistical information from each orthogonal plane. We then use fully connected layers for nonlinearity. The resulting single-plane spatial
information vectors are combined using a tensor product to form the low-rank weighting tensor, which is used to re-weight the input volumetric feature
by element-wise product.

                             III. M ETHOD                                          We also adopt fully connected (FC) layers to introduce
                                                                                 additional nonlinearity to the production of the weight vectors,
   We propose a spatially-weighted 3D U-Net model

(SW-3D-UNet) for MRI segmentation. To present the model,                              al, p = FCa al, p = σ Wa,l, p,2 δ Wa,l, p,1 a l, p ,
we first detail the proposed volumetric feature recalibration
                                                                                      cl, p = FCc cl, p = σ Wc,l, p,2 δ Wc,l, p,1 cl, p ,
layer. Then we build our single-modality model based on
the spatial weighting strategy with deep supervision block                            sl, p = FCs s l, p = σ Ws,l, p,2 δ Ws,l, p,1 s l, p , (2)
incorporated, and finally extend it to the multimodal MRI                        where δ and σ denote the ReLU and sigmoid activation
framework.                                                                       functions, respectively, and W represents the weight matrix
                                                                                 of the two-layer fully connected architecture. We construct a
A. Volumetric Feature Recalibration Layer                                        bottleneck architecture with two fully connected layers. The
   We develop a volumetric feature recalibration (VFR) layer                     first fully connected layer serves as dimensionality reduction,
to fully exploit the spatial contextual information on the intra-                with the reduction ratio being 1/4 to limit capacity and improve
plane level and leverage it for volumetric spatial weighting                     model generalization.
on the inter-plane level. This emphasizes important regions in                       2) Construction of Volumetric Spatial Weights: With the
the volumetric feature maps. The flowchart of the volumetric                     weighting vectors for each plane, we conduct weighting on the
feature recalibration layer is shown in Figure 3.                                feature tensors. For example, given the single feature tensor
  1) Modeling Single-Plane Spatial Contextual Information:                        fl, p and the weighting vector al, p in the axial plane, we can
Under the 3D convolutional network architecture, we assume                       slice the fl, p into K 2D matrices fl, p (:, :, k) along the axis
the volumetric feature tensors Fl input to the VFR layer in                      and multiply by the k t h entry in the corresponding weight
the l t h layer is of the size I × J ×K ×P where the I , J and                   vector, al, p (k). Similarly, we slice the same volumetric feature
K are the length, width and height of a feature tensor and Fl                    along the coronal and sagittal planes and weight those resulting
contains P channels. We denote a volumetric feature tensor in                    slices with their vectors, cl, p and sl, p .
Fl as fl, p of the size I × J ×K in the p t h (1 ≤ p ≤ P) channel.                   Mathematically, if the feature tensor is weighted along
To acquire the spatial statistical information representation on                 the three planes, this is equivalently a tensor product of the
a chosen plane, we apply a global average pooling (GAP) with                     orthogonal weighting vectors,
the subscript representing the operation along the designated                                          wl, p = al, p ⊗ cl, p ⊗ sl, p ,                     (3)
view plane,
                                                                                 where the (i, j, k) entry in the weighting tensor is
                                   1                                         wl, p (i, j, k) = al, p (i ) cl, p ( j ) sl, p (k). With the constructed
        al, p = GAPa fl, p         =      fl, p (i, j, k),
                                     IJ                                          tensor weights, we re-weight the input features channel-wise
                                           i       j
                               1                                             using element-wise multiplication,
        cl, p    = GAPc fl, p =        fl, p (i, j, k),
                                IK
                                   i k
                                                                                                           fl+1, p = fl, p wl, p                          (4)
                               1                                                In the construction of the weighting tensor, low-rank regu-
        s l, p   = GAPs fl, p =        fl, p (i, j, k).                  (1)
                                JK                                               larization (which in our case is rank-1) is imposed explicitly.
                                               j   k
                                                                                 The low-rank regularization on the weighting tensor forces it to
The three resulting orthogonal vectors āl, p ∈ R 1×1×K ,                        capture the most critical patterns within the feature tensor for
c̄l, p ∈ R 1×J ×1 and s̄l, p ∈ R I ×1×1 compress the statistical                 the segmentation [17]. Also, low-rank regularization satisfies
information in the entire slice along each plane. A similar                      the smoothness assumption about the brain’s anatomical struc-
transformation has previously been used in other problems,                       tures [34], where the overall relative spatial positions of the
for example in SENet [15].                                                       three segmented tissues (WM, GM and CSF) are consistent

      Authorized licensed use limited to: Columbia University Libraries. Downloaded on May 15,2020 at 00:21:33 UTC from IEEE Xplore. Restrictions apply.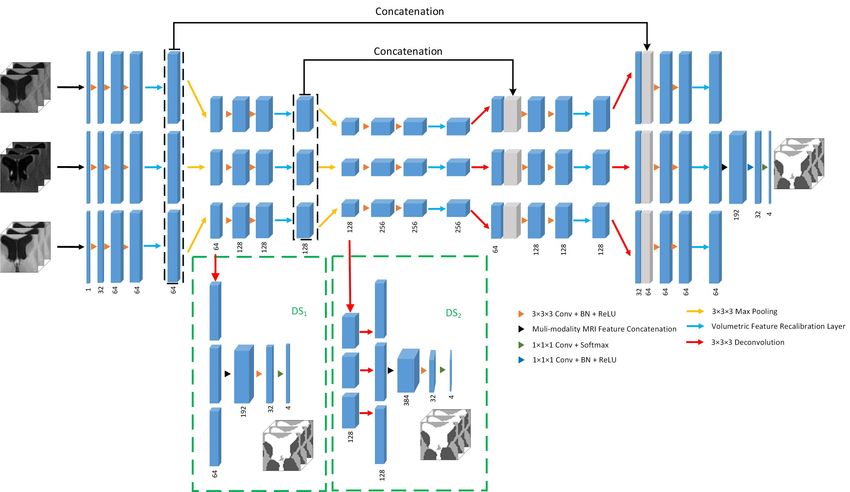
SUN et al.: 3D SPATIALLY-WEIGHTED NETWORK FOR SEGMENTATION OF BRAIN TISSUE                                                                                 901

                                                                                 of low-rank regularization tends to promote the most salient
                                                                                 features in a signal yet without every signal details being
                                                                                 presented. The weight maps of the coronal and sagittal planes
                                                                                 show similar results.
                                                                                    3) Comparison With Other Attention-Based Methods: In pre-
                                                                                 vious literature, attention-based methods have been explored to
                                                                                 capture and highlight important patterns within the data. The
                                                                                 recently proposed network architecture called Squeeze-and-
                                                                                 Excitation Networks (SENet) [15] achieved impressive perfor-
                                                                                 mance in the image recognition problem and won 1st place on
                                                                                 the ImageNet 2017 Challenge. In SENet, a weighting strategy
                                                                                 is applied to the 2D feature maps to enhance useful features
                                                                                 and suppress less important ones to eliminate redundancies.
                                                                                 Unlike SENet, our proposed VFR layer models attention based
                                                                                 on spatial weights from a multi-view perspective instead of
                                                                                 using channel-specific attention. The idea of channel-specific
                                                                                 attention was applied to segmentation of medical image slices
                                                                                 by [28], where spatial attention was also developed and com-
                                                                                 bined with channel attention. However, 3D spatial weighting
                                                                                 was not considered. A similar single-plane spatial attention
                                                                                 method was used by [25] to segment the pancreas.

                                                                                 B. Spatial Weighted 3D Networks
                                                                                    Equipped with the volumetric feature recalibration (VFR)
                                                                                 layer, we propose a spatially weighted 3D network based on
                                                                                 the state-of-the-art segmentation network 3D U-Net [6], where
                                                                                 pooling was designed to capture large scale contextual infor-
                                                                                 mation and a skip connection from shallow layers containing
                                                                                 more accurate localization information to corresponding deep
                                                                                 layers was also proposed.
                                                                                    We show our proposed single-modality SW-3D-UNet in
                                                                                 Figure 5 where the number of channels is marked below
                                                                                 each layer. In this architecture, we apply the VFR layer
                                                                                 before the max pooling layer in the encoder component and
                                                                                 symmetrically before the deconvolution layer in the decoder
                                                                                 component. The reason for this design is to enhance the
                                                                                 features before resizing, which changes the resolution and
                                                                                 cause spatial information loss.
                                                                                    When training deep neural networks, shallow layers often
Fig. 4.    We show some input axial slices of VFR layer and their                suffer from insufficient training due to gradient vanish-
corresponding weight maps in different channels. In the first two rows
we show some of the input slices into the VFR layer. In the next two rows
                                                                                 ing [14], [16]. Different techniques have been proposed to fix
we show the weight maps in the 1st channel generated in the VFR layer.           this problem and stabilize training, such as batch normalization
In the bottom two rows we show another groups of weight maps in the              (BN) [16] and residual learning [14]. Here we use deep super-
3rd channel in the same layer.                                                   vision (DS) [9], [11], shown in the dashed box in Figure 5,
                                                                                 to help directly guide the training of shallow layers with the
across different scans of imaging subjects and each type of                      label information. In the first DS block (DS1 ), a deconvolution
tissue lies on certain low-dimensional manifold regardless of                    layer resizes the features to the input MRI volume size.
fine structural details.                                                         In the second DS block (DS2 ), two deconvolutional layers are
   In Figure 4, we show some extracted consecutive axial                         used for the same purpose. We note that this deep supervision
slices and their corresponding weight maps in heatmap rang-                      is only used in the training stage to optimize the network
ing from 0 to 1 on different channels in the same VFR                            parameters in shallow layers. The corresponding loss function
layer. We observe the weight maps tend to highlight certain                      is shown in the Equation 5. When training is completed, these
semantically meaningful regions on different feature channels,                   deep supervision branches can be discarded. To segment a new
meaning the most discriminative patterns are emphasized and                      MRI volume, the main branch output is used.
each channel allows focus on different patterns. In a given
channel, the weight maps along axial view plane change                           C. Multimodality Extension
smoothly, which agrees with our low-rank assumption and                            We extend the single-modality version of the SW-3D-UNet
the high spatial correlation on adjacent slices. The nature                      model to a multimodal version to exploit the complementary

      Authorized licensed use limited to: Columbia University Libraries. Downloaded on May 15,2020 at 00:21:33 UTC from IEEE Xplore. Restrictions apply.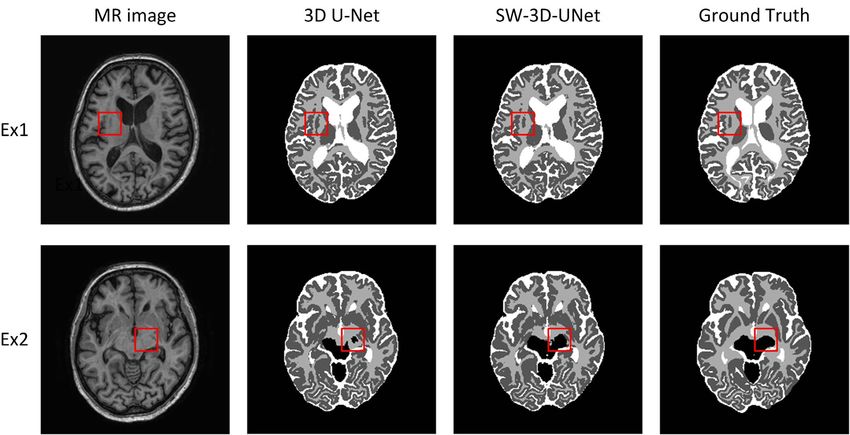
902                                                                                IEEE TRANSACTIONS ON MEDICAL IMAGING, VOL. 39, NO. 4, APRIL 2020

Fig. 5. The architecture of the single-modality SW-3D-UNet. We show the number of channel below each layer. The deep supervision blocks are
shown in the dashed green box.

Fig. 6. A flowchart of the proposed volumetric feature recalibration layer for multimodality MRI.

information provided by multi-parametric imaging. Effectively                    In such a design, the weighting tensor of each modality is
fusing the multimodal information is important for high-                         produced using the spatial information in all the modalities.
quality segmentation. Instead of using the standard 3D U-Net                     Compared with applying the single-modality spatial weighting
with a multi-channel input [6], we modify and extend it to                       strategy shown in Figure 3 on each modality MRI, information
different modalities (T1, T1-IR and T2-FLAIR) using a paral-                     sharing among all MRI modalities via concatenation can boost
lel feed forward network, and only fuse their deep high-level                    performance.
features for voxel-wise prediction. We refer to this approach                       The architecture of the Multimodality (MuMo) SW-3D-
as Parallel 3D U-Net (P3D U-Net). (A similar strategy was                        UNet is shown in Figure 7. Similarly we extend the deep
shown to work well for infant brain segmentation [24].)                          supervision block to its multimodal version in the design of
   We also extend the single-modality VFR layer to the mul-                      MuMo SW-3D-UNet. We use the multimodality MRI feature
timodality environment as shown in Figure 6. We denote the                       concatenation in these deep supervision blocks to take the
multimodality (T1, T1-IR and T2-FLAIR) feature tensors input                     multimodal information into account.
to the multimodality VFR layer as fl,T1      p
                                               , fl,IRp and fl,FLAIR
                                                                p
                                                                     . The          In Figure 8, we show an axial slice of three modalities
                  T1      IR
feature tensors fl, p , fl, p and fl, p FLAIR  of different modalities           and their corresponding feature maps before and after weight-
are first concatenated along the axial, corona and sagittal                      ing. We observe different regions in the same channel are
view planes. We then use global average pooling (GAP)                            highlighted in the different modalities, which proves that
for spatial information compression on the view planes as                        the modalities are enhanced differently. This helps explain
shown in Figure 6 to obtain the spatial statistical information                  the improvement in performance. These weighting maps are
representation al, p , cl, p , s l, p . Note these vectors are three             learned automatically during optimization.
times longer than their single-modality counterparts. Then
FC layers are used to infer the weighting vectors for each                       D. Implementation Details
modality. The weighting vectors of each modality are assem-                        To train the proposed SW-3D-UNet model, we mini-
bled to form the low-rank tensor for feature enhancement.                        mize the weighted cross-entropy loss function with weight

      Authorized licensed use limited to: Columbia University Libraries. Downloaded on May 15,2020 at 00:21:33 UTC from IEEE Xplore. Restrictions apply.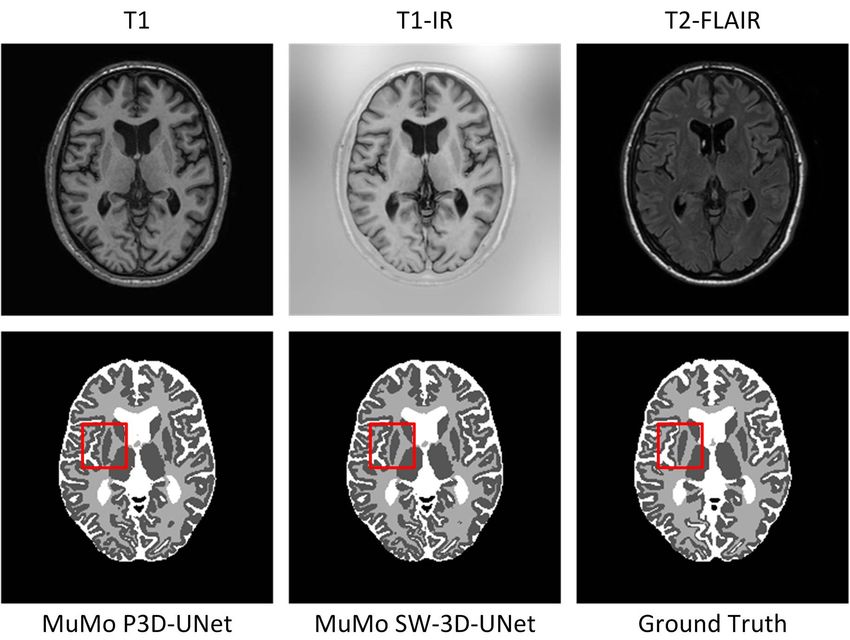
SUN et al.: 3D SPATIALLY-WEIGHTED NETWORK FOR SEGMENTATION OF BRAIN TISSUE                                                                                 903

Fig. 7. The architecture of our proposed multimodality SW-3D-UNet.

                                                                                 In our implementation on the 3-class segmentation task in
                                                                                 MRBrainS13, the number of classes C = 4, corresponding to
                                                                                 gray matter, white matter, cerebrospinal fluid and background.
                                                                                 Their respective weights are ω = [1.2, 1.3, 1, 1] determined
                                                                                 via grid search using cross validation. For the 25-class seg-
                                                                                 mentation in MALC12 datasets, we set equal weights 1 to
                                                                                 all the segmented structures. The weights for the two deep
                                                                                 supervision branches μα are both set to 0.5. We also use 2
                                                                                 regularization on the network parameters with regularization
                                                                                 weight λ = 10−4 .
                                                                                    Our model is implemented on Tensorflow using a work-
                                                                                 station with a NVIDIA TITAN X GPU. We use the ADAM
                                                                                 optimizer and Xavier initilization. Our model is trained for
                                                                                 20,000 iterations with initial learning rate 0.001, and the
                                                                                 learning rate is halved every 5,000 iterations. The training
                                                                                 of our model takes 1 day. Because of GPU memory limits,
                                                                                 we input randomly cropped sub-volumes of the training scans
                                                                                 of size 32 × 32 × 32 × N for training, where N is the
Fig. 8. We show the features input to the VFR layer and the correspond-          number of MRI modalities (N = 3 for the T1, T1-IR and
ing enhanced features for T1-IR, T1 and T2-FLAIR modalities on the MRI           T2-FLAIR in our multimodality MRI experiments). In the
data.
                                                                                 testing phase, we apply the trained model on the scans to
                                                                                 be segmented using a sliding window with overlap of 8.
decay regularization
                                                                               Multiple probabilities maps are produced by the softmax
L (X, Y ; ) = λ 22 −                  ωc Yc log pc (X, )                    layer in the model on the overlapping positions, the multiple
                               (X,Y ) C                                          overlapped probability maps are then averaged to generate
                                                                              final probability maps, which are used for label prediction.
                     −       μα              ωc Yc log pcα (X, ),       (5)
                                                                                 We also use data augmentation via horizontal/vertical flipping,
                         α        (X,Y ) C
                                                                                 rotation and shifting of the original MRI.
where  represents the network parameters and (X, Y )
denotes the input sub-volume and the ground truth segmen-                                         IV. R ESULTS AND D ISCUSSIONS
tation label pair for training. There are C classes to be
assigned to the input and ωc is the corresponding weight.                        A. Dataset
The value pc (X, ) represents the predicted probability of                        1) MRBrainS13: We evaluate SW-3D-UNet model on the
the ct h class after the softmax layer for the input (X, Y ).                    2013 MICCAI MRBrainS Challenge Dataset [20], which is

      Authorized licensed use limited to: Columbia University Libraries. Downloaded on May 15,2020 at 00:21:33 UTC from IEEE Xplore. Restrictions apply.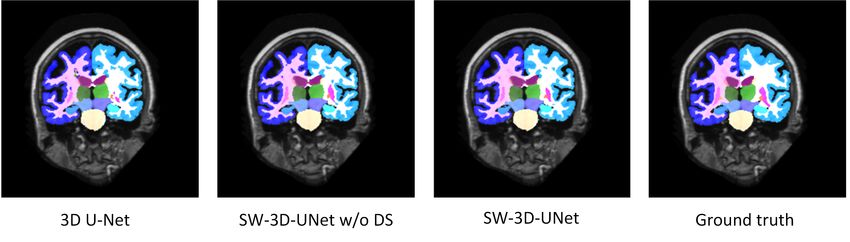
904                                                                                IEEE TRANSACTIONS ON MEDICAL IMAGING, VOL. 39, NO. 4, APRIL 2020

                                                                      TABLE I
                                                 R ESULTS OF THE A BLATION S TUDY ON MRB RAIN S13

a well-recognized benchmark for comparing and evaluating
state-of-the-art automatic brain segmentation models. In the
challenge, four MRI regions (WM, GM, CSF and background)
are to be segmented. We merge the multiple labels into the
4 classes as recommended by the organizers. The data for the
challenge was acquired at UMC Utrecht from patients with
diabetes with different degrees of atrophy and white matter
lesions, and their matched controls. Each imaging subject is
scanned to acquire multimodality MRI brain data, including
T1, T1-IR and T2-FLAIR modalities. All scans have been bias-
corrected and the data of each patient is aligned. The voxel size
is 0.958mm×0.958mm×3.00mm for all modalites. There are                           Fig. 9. A segmentation comparison between the 3D U-Net and the
five multimodality scans (2 male and 3 female) with manual                       SW-3D-UNet on T1 modality using two MRI.
segmentation by human experts in the training dataset. The
testing dataset contains 15 subjects and is not available to the
public. This data is used for independent and fair comparison                    Compared with the classic HD measure, the 95th-percentile of
by the organizers and all algorithms are evaluated by the                        the Hausdorff distance is more robust to outliers. A smaller
organizers by uploading code to their website.                                   HD means better segmentation.
   2) MALC12: We also evaluate our VFR layer and deep                              The absolute volume difference (AVD) is defined as
supervision block on the MICCAI 2012 Multi-atlas Labeling                                                           |VS − VL |
Challenge (MALC12) [18]. In this challenge, 30 T1-weighted                                       AVD (S, L) =                  × 100%,                     (8)
                                                                                                                        VL
MRI scans of OASIS project are provided with segmentation
                                                                                 where VS is the volume of segmentation prediction and
labels from Neuromorphometrics, Inc. The 256×256 coronal
                                                                                 VL the volume of label. Smaller AVD means the predic-
slices are isotropic 1mm. Different scans vary in the number
                                                                                 tion and ground truth are closer. The final ranking in the
of slices. A total of 25 anatomical brain structures are targeted
                                                                                 MRBrainS13 challenge depends on a combination of all
for segmentation. We apply no pre-processing methods, such
                                                                                 three performance measures assessed separately on the three
as inhomogeneity bias-correction or intensity normalization.
                                                                                 anatomical tissues.
B. Evaluation Metrics
   The organizers of MRBrainS13 use three evaluation met-                        C. Ablation Study
rics to evaluate segmentation performance for each tissue                           We perform an ablation study to validate our VFR layer
type (WM, GM and CSF). These are the Dice Coef-                                  and the extension to multimodality MRI based on the proposed
ficient (DC), the 95th-percentile of the Hausdorff Dis-                          P3D U-Net. We also show that deep supervision helps segmen-
tance (HD) and the Absolute Volume Difference (AVD). For                         tation accuracy. We use cross validation on the training scans
the MALC12 challenge data, Dice Coefficient is traditionally                     of the MRBrainS13 benchmark: 4 scans are used for training
used for evaluation [18].                                                        and 1 scan for testing, giving an average of 5 performance
   The Dice Coefficient is in the range 0 to 1 and measures the                  measures.
overlap between the segmentation prediction and segmentation                        1) Validation of the VFR Layer: We compare the single-
label,                                                                           modality 3D U-Net and the proposed SW-3D-UNet condi-
                             2 |S ∩ L|                                           tioned on the T1 modality MRI as a single-channel input
              DC (S, L) =              × 100%,              (6)                  with the deep supervision (DS) architecture incorporated.
                             |S| + |L|
where the S is the set of segmentation prediction and L the set                  We choose the T1 modality for illustration since it contains
of segmentation label. A higher DC means better segmentation                     much anatomical information. In Table I, we observe that
accuracy.                                                                        T1 SW-3D-UNet outperforms T1 3D U-Net by a large margin,
   The 95th-percentile of the Hausdorff distance also measures                   which can be attributed to the better representation provided
the distance between the prediction S and ground truth L,                        by the proposed feature recalibration scheme. In Figure 9,
                                                                               we show two segmentation examples with a red box high-
 HD (S, L)=max K s∈S  th
                          min S−L , K s∈S
                                         th
                                             min L − S . (7)                   lighting specific differences. It is noteworthy that the brainstem
                             g∈G                     g∈G                         (classified as background in the challenge) shares very similar

      Authorized licensed use limited to: Columbia University Libraries. Downloaded on May 15,2020 at 00:21:33 UTC from IEEE Xplore. Restrictions apply.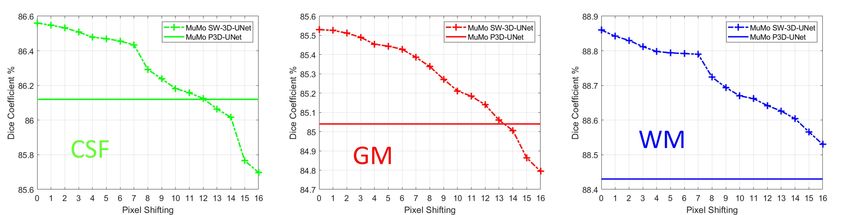
SUN et al.: 3D SPATIALLY-WEIGHTED NETWORK FOR SEGMENTATION OF BRAIN TISSUE                                                                                 905

Fig. 10. The segmentation Dice Coefficients for the 3D U-Net (blue box), SW-3D-UNet w/o DS (green box) and SW-3D-UNet (red box) on the
25 brain structures. The centerlines represent the median, the boxes extend to the 25th and 75th percentiles and the cross whiskers indicate the
extreme values which are not considered outliers. The 3D rendering of the brain structures are provided by the organizers.

MR intensities with the white matter regions in the second                       VFR layer and deep supervision for the single-modality MRI
example in the red box. In the 3D U-Net model, such similarity                   segmentation problem.
leads to misclassification. However, our SW-3D-UNet model                           2) Validation of Multimodality Extension: We extended
is capable of distinguishing the highly similar tissues through                  the single-modality MRI segmentor to the multimodality
its spatial weighting design.                                                    MRI environment by proposing a multimodality (MuMo)
   We also validate the VFR layer and deep supervision                           P3D-UNet with deep supervision as a baseline. We first com-
block on MALC12, which consists of a larger single-modality                      pare the MuMo P3D U-Net with the Regular 3D U-Net with
T1-weighted MRI with more tissue labeling. The segmen-                           multimodality MRI as multichannel inputs in Table I. Deep
tation results in DC score are reported in Figure 10. For                        supervision is used in both models. We observe the proposed
the MALC12 dataset, we use 20 scans for training and the                         P3D U-Net achieves better segmentation than the regular
remaining 10 for testing. We show a group of example segmen-                     MuMo 3D U-Net whose model performance is comparable
tations in Figure 11. The averaged DSC on the 25 structures is                   with the T1 3D U-Net model. From Table I, we see that
82.56%, 84.46% and 84.82% for the 3D U-Net, SW-3D-UNet                           MuMo P3D-UNet achieves better segmentation than the T1
w/o DS and SW-3D-UNet with the standard deviations 5.08%,                        3D U-Net since it can use additional T1-IR and T2-FLAIR
4.18% and 3.59%. This result demonstrates the utility of the                     information. However, T1 SW-3D-UNet achieves comparable

      Authorized licensed use limited to: Columbia University Libraries. Downloaded on May 15,2020 at 00:21:33 UTC from IEEE Xplore. Restrictions apply.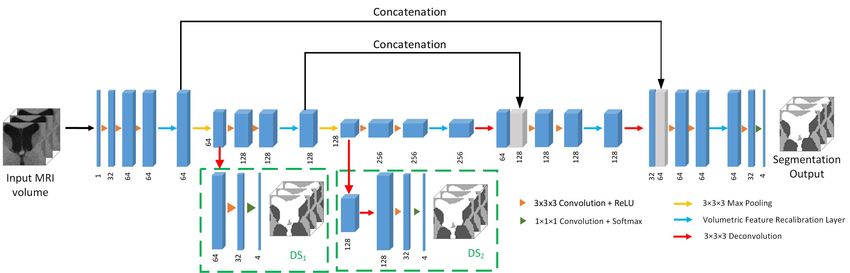
906                                                                                IEEE TRANSACTIONS ON MEDICAL IMAGING, VOL. 39, NO. 4, APRIL 2020

Fig. 11. Example segmentations for the compared methods on the MALC12 dataset in the coronal view plane.

                                                                                 standard deviation 1.64%, 2.32% and 1.04%, which shows
                                                                                 a deterioration of performance compared with our MuMo
                                                                                 SW-3D-UNet in Table I.

                                                                                 E. Discussion on Misalignment Environment
                                                                                    The data used for the MRBrainS13 challenge is well-
                                                                                 registered and the spatial weighting strategy with multimodal-
                                                                                 ity volumetric MRI provides considerable improvements.
                                                                                 However, we also conduct the experiments under non-
                                                                                 registration environment to assess how misalignments affect
                                                                                 the proposed MuMo SW-3D-UNet. Two experimental settings
                                                                                 are used:
                                                                                    • Training using aligned MRI data and testing using mis-
                                                                                       aligned MRI data;
                                                                                    • Training using misaligned MRI data and testing using
                                                                                       identically-misaligned MRI data.
                                                                                 We assess how the proposed MuMo 3D-SW-UNet performs
Fig. 12. A segmentation comparison between the P3D U-Net and the
SW-3D-UNet using multimodality MRI.
                                                                                 under the first setting. We fix T1-IR and T1 and shifting
                                                                                 T2-FLAIR towards upper left by different number of voxels.
                                                                                 The shifting is implemented in axial plane. Here we use leave-
performance with MuMo P3D-UNet, meaning that the pro-                            one-out cross validation in DC score to make the results more
posed spatial weighting strategy can improve the segmentation                    convincing statistically.
up to the level obtained by the multimodality MRI setting.                          We shift T2-FLAIR by 1 to 16 voxels and show the
This is valuable when multimodality MRI data acquisition                         results in Figure 13. We observe the performance of
or registration are difficult. Again, we observe that MuMo                       MuMo SW-3D-UNet deceases steadily. In comparison, we set
SW-3D-UNet using the VFR layer achieves good segmentation                        P3D-UNet with well-aligned testing and training data as base-
in Table I, which is also demonstrated by the comparison in                      line. We observe even by shifting some voxels, the misaligned
Figure 12. From Table I, we observe that our final model                         MuMo SW-3D-UNet still outperforms well-aligned MuMo
MuMo SW-3D-UNet outperforms its counterpart without deep                         P3D-UNet. For WM and GM tissues, the performance of
supervision.                                                                     our model further deteriorates when the misalignment exceeds
                                                                                 13 voxels, such that its performance is inferior to the well-
D. Evaluation on Information Sharing Between Modalities                          aligned MuMo P3D-UNet. However, our approach provides
   In the VFR layer of the multimodality SW-3D-UNet,                             stable gains over the well-aligned baseline for WM tissue even
the spatial weighting vectors for each modality are produced                     when misalignment reaches 16 voxels. Thus, our proposed
by exploiting all the multimodality information. To show that                    VFR layer provides performance improvements over its plain
modeling these multiple modalities can benefit the segmen-                       segmentor with voxels misaligned under mild conditions.
tation, we compare it with a version of our model in which                          In the experiments under the second setting, we fix T1-IR,
no interaction and information sharing across the modalities                     T1 and shift T2-FLAIR to the identical degree on all the train-
exists for generating the spatial weighting vectors. In other                    ing and testing datasets. After training, we observe the neural
words, the features of each MRI modality are recalibrated                        network weights of the shifted T2-FLAIR modalities vanish to
separately using the single-modality spatial weighting strategy                  extremely small values, meaning the network learns to discard
shown in Figure 3. The resulting segmentation DC score                           the misleading information in the T2-FLAIR modality, and so
without multimodality MRI information sharing is 86.33%,                         the three-modality SW-3D-UNet model deteriorates to a two-
88.63% and 85.47% for GM, WM and CSF tissues with the                            modality SW-3D-UNet model. Consequently, the segmentation

      Authorized licensed use limited to: Columbia University Libraries. Downloaded on May 15,2020 at 00:21:33 UTC from IEEE Xplore. Restrictions apply.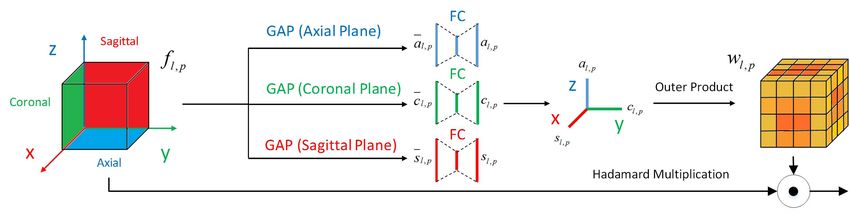
SUN et al.: 3D SPATIALLY-WEIGHTED NETWORK FOR SEGMENTATION OF BRAIN TISSUE                                                                                 907

Fig. 13. The Dice coefficient with different number of misaligned T2-FLAIR voxels of the MuMo SW-3D-UNet. The MuMo P3D-UNet trained and
tested with perfect alignment serves as a baseline here.

Fig. 14. Some example segmentation results on the IBSR dataset using the 3D U-Net and SW-3D-UNet with and without fine-tuning.

accuracy is 86.40% in GM, 88.60% in WM and 85.30% in                                                          TABLE II
CSF using Dice Coefficient, which are slightly lower than the                              R ESULTS ON C ROSS D OMAIN B RAIN S EGMENTATION
well-registered MuMo SW-3D-UNet as reported in Table I.

F. Discussion on Cross Domain Brain Segmentation
   To test the robustness to cross domain brain segmenta-
tion of our VFR with deep supervision, we directly apply
our T1 SW-3D-UNet trained on MRBrainS13 to another
datasets called the Internet Brain Segmentation Reposi-
tory (IBSR)2 consisting of 20 T1-weighted scans. The
datasests of MRBrainS13 and IBSR are significantly different                     segmentation accuracy. The segmentation on CSF is improved
in their appearance and labeling. The sulcal CSF regions                         significantly in DC score. We also show some example
are clearly labeled as CSF in the MRBrainS data, and as                          segmentations in Figure 14. After fine-tuning, SW-3D-UNet
GM in the IBSR data [20], [32]. As a consequence, our                            learns to segment the brain from IBSR datasets according to
model trained on MRBrainS13 tends to predict the sulcal                          its segmentation protocol.
CSF regions as CSF, leading to extremely low DC scores
on CSF tissues when testing on IBSR data. We report the
                                                                                 G. Leaderboards on the MRBrainS13 Challenge
segmentation results on a randomly picked scan from IBSR in
Table II. Here we observe the SW-3D-UNet with VFR layer                             We next compare our multimodality SW-3D-UNet with
and DS block outperforms the 3D U-Net even though the                            state-of-the-art deep neural network methods including Tail-
inconsistencies of data distribution and label protocol between                  Hot, WTA2, XLab, HyperDenseNet [7], VoxResNet [5],
the MRBrainS13 and IBSR datasets.                                                LRDE, MSL-SKKU, MDGRU [1] and 3D U-Net [6].
   We next fine-tuned the model trained on MRBrainS13 using                      We report the top-11 ranking in the leaderboard of
randomly chosen scan from the IBSR datasets. In Table II,                        MRBrainS13 benchmark in Table III. The segmentation of
we observe the 3D U-Net and SW-3D-UNet both are improved                         WM, GM and CSF tissues are evaluated using the three
after fine-tuning while SW-3D-UNet still provides better                         metrics. We observe our model achieves the best segmentation
                                                                                 on GM and WM tissues with respect to the DC and HD metrics
 2 https://www.nitrc.org/projects/ibsr                                           and third place with respect to the AVD metric. On segmenting

      Authorized licensed use limited to: Columbia University Libraries. Downloaded on May 15,2020 at 00:21:33 UTC from IEEE Xplore. Restrictions apply.
908 IEEE TRANSACTIONS ON MEDICAL IMAGING, VOL. 39, NO. 4, APRIL 2020
TABLE III
T HE R ESULTS FOR THE MRB RAIN S13 B ENCHMARK
[2] X. Artaechevarria, A. Munoz-Barrutia, and C. Ortiz-De-Solorzano,
“Combination strategies in multi-atlas image segmentation: Applica-
tion to brain MR data,” IEEE Trans. Med. Imag., vol. 28, no. 8,
pp. 1266–1277, Aug. 2009.
[3] J. Ashburner and K. J. Friston, “Unified segmentation,” NeuroImage,
vol. 26, no. 3, pp. 839–851, 2005.
[4] A. de Brebisson and G. Montana, “Deep neural networks for anatomical
brain segmentation,” in Proc. IEEE Conf. Comput. Vis. Pattern Recognit.,
Jun. 2015, pp. 20–28.
[5] H. Chen, Q. Dou, L. Yu, J. Qin, and P. Heng, “VoxResNet: Deep vox-
elwise residual networks for brain segmentation from 3D MR images,”
NeuroImage, vol. 170, pp. 446–455, Apr. 2018.
[6] Ö. Çiçek, A. Abdulkadir, S. S. Lienkamp, T. Brox, and O. Ronneberger,
“3D U-Net: Learning dense volumetric segmentation from sparse anno-
tation,” in Proc. Int. Conf. Med. Image Comput. Comput.-Assist. Inter-
vent., 2016, pp. 424–432.
Fig. 15. Two examples of multimodality MRI segmentation on the testing [7] J. Dolz, K. Gopinath, J. Yuan, H. Lombaert, C. Desrosiers, and
dataset of the MRBrainS13 benchmark. I. B. Ayed, “HyperDense-Net: A hyper-densely connected CNN for
multi-modal image segmentation,” IEEE Trans. Med. Imag., vol. 38,
the CSF tissue, our model achieves second place on DC, first no. 5, pp. 1116–1126, May 2019.
[8] L. Dora, S. Agrawal, R. Panda, and A. Abraham, “State-of-the-art
place on HD and third place on AVD. Overall, according methods for brain tissue segmentation: A review,” IEEE Rev. Biomed.
to the Sum Score (the smaller the better) provided by the Eng., vol. 10, pp. 235–249, 2017.
organizers, our multimodality SW-3D-UNet achieves 1st rank [9] Q. Dou, H. Chen, Y. Jin, L. Yu, J. Qin, and P.-A. Heng, “3D deeply
supervised network for automatic liver segmentation from CT volumes,”
in the competition. We show some segmentation results in in Proc. Int. Conf. Med. Image Comput. Comput.-Assist. Intervent., 2016,
Figure 15 provided by our model.3 pp. 149–157.
[10] Q. Dou et al., “Automatic detection of cerebral microbleeds from MR
V. C ONCLUSION images via 3D convolutional neural networks,” IEEE Trans. Med. Imag.,
vol. 35, no. 5, pp. 1182–1195, May 2016.
We developed a 3D spatially-weighted network for brain [11] Q. Dou et al., “3D deeply supervised network for automated seg-
MRI tissue segmentation called SW-3D-UNet, and extended mentation of volumetric medical images,” Med. Image Anal., vol. 41,
pp. 40–54, Oct. 2017.
it to the multimodality MRI environment. The designed vol- [12] H. Greenspan, A. Ruf, and J. Goldberger, “Constrained Gaussian mixture
umetric feature recalibration layer was shown to effectively model framework for automatic segmentation of MR brain images,”
improve the representative power of the features by exploiting IEEE Trans. Med. Imag., vol. 25, no. 9, pp. 1233–1245, Sep. 2006.
[13] M. Havaei et al., “Brain tumor segmentation with deep neural networks,”
the 3D spatial information. A weighting strategy was also Med. Image Anal., vol. 35, pp. 18–31, Jan. 2017.
applied on multi-parametric MRI for information sharing [14] K. He, X. Zhang, S. Ren, and J. Sun, “Deep residual learning for
and deep supervision helped train the shallow layers in the image recognition,” in Proc. IEEE Conf. Comput. Vis. Pattern Recognit.,
Jun. 2016, pp. 770–778.
network. An ablation study demonstrated the utility of the [15] J. Hu, L. Shen, and G. Sun, “Squeeze-and-excitation networks,” in Proc.
proposed spatial weighting and deep supervision schemes. IEEE Conf. Comput. Vis. Pattern Recognit., Jun. 2018, pp. 7132–7141.
As a result, our algorithm ranked 1st in the well-known [16] S. Ioffe and C. Szegedy, “Batch normalization: Accelerating deep
network training by reducing internal covariate shift,” in Proc. Mach.
MRBrainS13 Challenge, which demonstrates the state-of- Learn. Res., 2015, pp. 448–456.
the-art segmentation quality produced by our model. Such [17] C. Jia, G. Zhong, and Y. Fu, “Low-rank tensor learning with discriminant
automatic segmentation models can provide a powerful tool analysis for action classification and image recovery,” in Proc. AAAI
Conf. Artif. Intell., Jun. 2014, pp. 1228–1234.
for assessing and diagnosing neurodegenerative diseases and [18] B. A. Landman and S. Warfield, “MICCAI 2012: Grand challenge
disorders in the human brain. and workshop on multi-atlas labeling,” in Proc. Int. Conf. Med. Image
Comput. Comput. Assist. Intervent., vol. 2012, 2012.
R EFERENCES [19] N. Lee, A. F. Laine, and A. Klein, “Towards a deep learning approach
to brain parcellation,” in Proc. IEEE Int. Symp. Biomed. Imag., Nano
[1] S. Andermatt, S. Pezold, and P. Cattin, “Multi-dimensional gated recur- Macro, Mar./Apr. 2011, pp. 321–324.
rent units for the segmentation of biomedical 3D-data,” in Deep Learn- [20] A. M. Mendrik et al., “MRBrains challenge: Online evaluation frame-
ing and Data Labeling for Medical Applications. Cham, Switzerland: work for brain image segmentation in 3T MRI scans,” Comput. Intell.
Springer, 2016, pp. 142–151. Neurosci., vol. 2015, Jan. 2015, Art. no. 813696.
[21] P. Moeskops et al., “Automatic segmentation of MR brain images of
3 The segmentation labels are not given here since the segmentation ground preterm infants using supervised classification,” NeuroImage, vol. 118,
truths are unavailable to the public. pp. 628–641, Sep. 2015.
Authorized licensed use limited to: Columbia University Libraries. Downloaded on May 15,2020 at 00:21:33 UTC from IEEE Xplore. Restrictions apply.SUN et al.: 3D SPATIALLY-WEIGHTED NETWORK FOR SEGMENTATION OF BRAIN TISSUE 909
[22] P. Moeskops, M. A. Viergever, A. M. Mendrik, L. S. de Vries, [30] A. A. A. Setio et al., “Pulmonary nodule detection in CT images:
M. J. N. L. Benders, and I. Išgum, “Automatic segmentation of MR False positive reduction using multi-view convolutional networks,” IEEE
brain images with a convolutional neural network,” IEEE Trans. Med. Trans. Med. Imag., vol. 35, no. 5, pp. 1160–1169, May 2016.
Imag., vol. 35, no. 5, pp. 1252–1261, May 2016. [31] M. F. Stollenga, W. Byeon, M. Liwicki, and J. Schmidhuber, “Parallel
[23] D. Nie, L. Wang, E. Adeli, C. Lao, W. Lin, and D. Shen, “3-D fully multi-dimensional LSTM, with application to fast biomedical volumetric
convolutional networks for multimodal isointense infant brain image image segmentation,” in Proc. Adv. Neural Inf. Process. Syst., 2015,
segmentation,” IEEE Trans. Cybern., vol. 49, no. 3, pp. 1123–1136, pp. 2998–3006.
Mar. 2019. [32] S. Valverde, A. Oliver, M. Cabezas, E. Roura, and X. Lladó, “Com-
[24] D. Nie, L. Wang, Y. Gao, and D. Shen, “Fully convolutional networks parison of 10 brain tissue segmentation methods using revisited IBSR
for multi-modality isointense infant brain image segmentation,” in Proc. annotations,” J. Magn. Reson. Imag., vol. 41, no. 1, pp. 93–101,
IEEE 13th Int. Symp. Biomed. Imag. (ISBI), vol. 108, Apr. 2016, Jan. 2015.
pp. 1342–1345. [33] K. Van Leemput, F. Maes, D. Vandermeulen, and P. Suetens, “Automated
[25] O. Oktay et al., “Attention U-Net: Learning where to look for the model-based tissue classification of MR images of the brain,” IEEE
pancreas,” Apr. 2018, arXiv:1804.03999. [Online]. Available: https:// Trans. Med. Imag., vol. 18, no. 10, pp. 897–908, Oct. 1999.
arxiv.org/abs/1804.03999 [34] J. Wright, A. Ganesh, S. Rao, Y. Peng, and Y. Ma, “Robust principal
[26] G. Postelnicu, L. Zollei, and B. Fischl, “Combined volumetric and sur- component analysis: Exact recovery of corrupted low-rank matrices via
face registration,” IEEE Trans. Med. Imag., vol. 28, no. 4, pp. 508–522, convex optimization,” in Proc. Adv. Neural Inf. Process. Syst., 2009,
Apr. 2009. pp. 2080–2088.
[27] H. R. Roth et al., “Improving computer-aided detection using convo- [35] M. Yaqub, M. K. Javaid, C. Cooper, and J. A. Noble, “Investigation of
lutional neural networks and random view aggregation,” IEEE Trans. the role of feature selection and weighted voting in random forests for
Med. Imag., vol. 35, no. 5, pp. 1170–1181, May 2016. 3-D volumetric segmentation,” IEEE Trans. Med. Imag., vol. 33, no. 2,
[28] A. G. Roy, N. Navab, and C. Wachinger, “Recalibrating fully con- pp. 258–271, Feb. 2014.
volutional networks with spatial and channel ‘squeeze and excita- [36] W. Zhang et al., “Deep convolutional neural networks for multi-modality
tion’ blocks,” IEEE Trans. Med. Imag., vol. 38, no. 2, pp. 540–549, isointense infant brain image segmentation,” NeuroImage, vol. 108,
Feb. 2019. pp. 214–224, Mar. 2015.
[29] M. R. Sabuncu, B. T. T. Yeo, K. Van Leemput, B. Fischl, and [37] Y. Zhang, M. Brady, and S. Smith, “Segmentation of brain MR images
P. Golland, “A generative model for image segmentation based on label through a hidden Markov random field model and the expectation-
fusion,” IEEE Trans. Med. Imag., vol. 29, no. 10, pp. 1714–1729, maximization algorithm,” IEEE Trans. Med. Imag., vol. 20, no. 1,
Oct. 2010. pp. 45–57, Jan. 2001.
Authorized licensed use limited to: Columbia University Libraries. Downloaded on May 15,2020 at 00:21:33 UTC from IEEE Xplore. Restrictions apply.You can also read