TESLA VALUATION THESIS - ICADE BUSINESS SCHOOL MÁSTER UNIVERSITARIO EN FINANZAS Author: Iván Sánchez Puebla - Repositorio Comillas
←
→
Page content transcription
If your browser does not render page correctly, please read the page content below

ICADE BUSINESS SCHOOL

MÁSTER UNIVERSITARIO EN FINANZAS

 TESLA VALUATION THESIS

 Author: Iván Sánchez Puebla
 Director: Pedro Mirete

 Madrid
 June 2018

Tabla de contenido
1. Abstract ............................................................................................................. 3
2. Introduction....................................................................................................... 3
3. Company Valuation Methods............................................................................. 5
 3.1 Discounted Cash Flows ................................................................................................ 5
 3.2 Multiples ..................................................................................................................... 8
 Discounted Dividends ......................................................................................... 12
 PER ..................................................................................................................... 14
4. The Automotive Industry ................................................................................. 16
 4.1 General Overview ...................................................................................................... 16
 4.2 Electric Vehicles Market ............................................................................................ 17
 4.3 Governments Incentives ............................................................................................ 17
 4.4 Market Competitors ............................................................................................ 18
 4.5 Tesla Competitive Advantage .............................................................................. 19
5. Tesla Motors Inc. ............................................................................................. 20
 5.1 Tesla Motors Strategy ................................................................................................ 22
 5.2 Historical Share Price Analysis ................................................................................... 24
 5.3 Ownership Structure ................................................................................................. 25
 5.4 Financial Statements Analysis .................................................................................... 26
6. WACC .............................................................................................................. 28
 6.1 Cost of Debt (kd)........................................................................................................ 28
 6.2 Cost of Equity (ke) ..................................................................................................... 28
 6.2.1 Risk Free rate ............................................................................................................ 29
 6.2.2 Systematic Risk ......................................................................................................... 29
 6.2.3 Market Risk Premium ............................................................................................... 29
 6.4 Capital Structure ................................................................................................. 30
7. DCF Valuation .................................................................................................. 31
 7.1 Time Frame of the Forecast ....................................................................................... 31
 7.2 Revenues ................................................................................................................... 32
 7.3 Cost of Revenues and Operating Expenses ................................................................. 33
 7.4 Cash Flow Statement .......................................................................................... 34
 7.5 Terminal Value .......................................................................................................... 34
 7.6 Final Results of the forecast ....................................................................................... 35
8. Multiples Valuation ......................................................................................... 36
9. Conclusions...................................................................................................... 37
10. Bibliography ................................................................................................. 38
11. Appendices .................................................................................................. 40
 Appendice A: Tesla Income Statements Information ....................................................... 40
 Appendice B: Claculations ............................................................................................... 47

 pág. 2
1. Abstract
In this thesis, the main reasons and motivations for enabling a valuation process are
disclosed, as well as it is the definition and specification of the different valuation
methods, commonly used for similar companies and sectors, such as the Discounted
Cash Flow, the Multiples and the Price to Earnings Ratio methods. It is important to
take in consideration that the value of the company may change depending on the
method used to evaluate the company. The same way, the different tools needed in
order to understand either the economic situation, the sector insights and performance,
or the company economic and financial information, will be provided during the
development of this thesis.

The determination of the value is a critical factor for the company so it is the main
driver in terms of investment allocation.

The aim of this project is to develop the valuation methodology needed to determine the
value of the company Tesla Motors. The valuation methodology will be based on the
utilization of multiples from the sector and similar companies and the discounted cash
flow, all to determine the final value of the share of the company and make the decision
of either buy, hold or sell.

 2. Introduction
The process of evaluating a company is one of the most important ones in terms of
company’s operation and investment strategies. Establishing the value of a company is
essential in order to implement new segments or activities, develop a new business
model, negotiating new financing terms or even to operate in the stock market. The
same way, this calculated value is essential in order to be able to measure the value
creation for the shareholder.

The process of evaluating a company could be defined as the process by which a
company’s wealth and activities are valuated as well as its expectations of future
income.

In this thesis, the valuation of Tesla Motors is developed according to the financial
Multiples method, based on similar companies and the average of the sector, and the
Discounted Cash Flows method, based on the projections of the company for future
cash flows and wealth distribution. For this purpose, all the financial information and
the future projections of the company have been taken directly from Tesla Motors itself
as well as the Securities Exchange Commission (SEC). These two institutions provide
this thesis with trustable information as well as additional data from similar companies
and sector insights. The financial statements as well as the economic-financial
information are properly developed in this document and will be useful in order to
understand the current situation of the company and its future projections.

In addition, the PER multiple method is properly defined and employed in the
development of the valuation of Tesla Motors.

 pág. 3

The company studied, Tesla Motors Inc., was founded in 2003 in Silicon Valley,
California by Elon Musk, Martin Eberhard and JB Straubel. Tesla Motors design,
manufacture and sell electric cars, components for electric car propulsion and electric
battery storage systems.

Among the development of this thesis, the external environment surrounding the
company is properly defined so it is a sector with a high changeability and innovation
growth. Regarding recent reports from reliable sources such as Mackency and Deloitte
about future trends and Mobility Technologies, electric vehicles, car sharing and Saas
based companies will lead the future of transportation itself. Tesla is not an exception,
even though is one of the largest electric car manufacturers all around the world, Tesla
has problems related to the usage and utilization of the generated cash flows and losses
management. In addition, recently high amount of discussions is being hold regarding
Tesla cars and the different disadvantages they have.

The aim of this project is to establish an objective price of a Tesla Motors share, using
for this purpose the different valuation methods previously described and heading to the
final objective of this thesis, determining if a share of Tesla Motors is over-valuated or
under-valuated.

The project is organized following this scheme: In first place, the different valuation
method is properly defined and explained as well the way to use them in nowadays
companies. In second place, the company itself, the sector surrounding it, and its
different activities and operations are described. Afterwards, a proper analysis of
projections and the different calculations needed for reaching the value of the company
are disclosed. The end of this thesis is based on the explanation of the value reached on
the previous step and the conclusions derived from the entire project.

 pág. 4
3. Company Valuation Methods
The valuation of a company is an essential factor not only in terms of determining if the
share is over-valuated or it is not, but also a company’s value is crucial in order to take
different decisions based on operational strategies or even to develop a new business
model that will affect the value creation of the shareholder. It is also important to take in
consideration the current value of a company in merge and acquisition situations and in
order to operate in the stock exchange. It is also important to know the debt situation of
the company and its asset distribution in order to understand how the company creates
value and how it keeps it inside the company.

The value of a company may differ from buyers to sellers. For instance, in a merge or
acquisition situation not only the value of a company is different between buyers and
sellers, but also it is also different between several buyers since the value of a company
also depends of the different and individual synergies it offers to the buyer.

The process of acquiring a company includes the establishment on the buy side of a
maximum price that is willing to pay for a company, and from the sell side, the
minimum price that is willing to accept for the same company. Finally, buyer and seller
agree on a given price that satisfies both of them.

 3.1 Discounted Cash Flows

The Discounted Cash Flows Method (here and onwards DCF), tries to determine the
estimated value of the future cash flows of the company independently of how they will
be distributed based on the company’s wealth distribution policy. After the calculation
of the value of these future cash flows, they will be discounted applying a given interest
rate, which will be based and associated with the level of risk of those cash flow. The
given interest rate will be ultimately different in every kind of cash flow and company.

According to Viñola and Adserá (1997), the main advantages of this method are:

 • Based on cash flows and not in accounting terms.
 • Information provided by the balance sheet and the Income Statement.
 • It provides with a higher accuracy the current situation and circumstances that
 may affect the value of a company.
 • Time Value of Money is taken in consideration.
 • Detailed and complete analysis of the risk of a company.

 pág. 5
The value of the company is obtained discounting the future cash flows of the company,
as follows:

Where: PV corresponds to the discounted value of future cash flows of the company,
CF corresponds to the future cash flow of the period i, r is the interest rate used to
discount the future cash flows and attending to the risk associated with those cash
flows.

It is important to take in consideration that even though the number of future cash flows
could be infinite, their value is decreased with every additional period because of the
discount interest rate applied.

There is also another factor to take in consideration when evaluating a company. It is
the residual value, which could be defined as the estimated present value of the after-tax
future cash flow expected to be earned after the forecast period. That expected value
needs to be discounted at a determined interest rate in order to calculate which is its
present value. When calculating the residual value, there are a few different methods:

 1. Perpetuity method: According to Damodaran (1994), the constant growth rate
 used to calculate the future cash flows is based on GDP trends. This is an
 accepted method and is widely used unless results become illogical.

 2. Relative Valuation Multiples method: It is based on the usage of multiple,
 usually from the same sector of the company, (EBITDA multiple, P/E multiple,
 P/S multiple…). This method is based on the assumption that the companies
 belonging to the same sector have similar risk levels, cash flow generation and
 similar risk profile.

 3. Liquidation Asset Value method: It is defined as the value of the assets at the
 time of sale. It does not include the value from intangible assets in order to
 calculate the final value.

The perpetuity formula previously mentioned is calculated according to the following
scheme:

 CFn ∗ (1 + g)
 =
 (r − g)

Where PV is the present value of the residual value, CFn is the expected cash flow, g is
the constant growth rate applied to the cash flows and r is the discount rate.
In order to reach the value of the company by using the DFC method, several steps need
to be followed:

 pág. 6
1. Determination of the generated cash flows by the company.
 2. Calculate the growth rate to be applied.
 3. Calculate the discount rate to be applied to the future cash flows.
 4. Determine the residual value and sum it into the last cash flow of the
 projection.

It is a key point to understand that when we talk about the discount rate to be applied,
this number needs to be calculated. In order to calculate the discount rate, first we will
calculate the cost of capital or cost of equity of the company according to CAPM model
which stands for the following formula:

 = + − ∗

Where r is the discount rate, Rf is the return given by the risk-free asset, (Rm –Rf) is
the risk premium given by the market and calculated by the difference between the
return offered by the market and the one from the risk-free asset.

After we have calculated the cost of Equity of the company, we will proceed to
calculate the discount rate or WACC (Weighted Average Cost of Capital). In order to do
so, we apply the following formula:

 ( ∗ ) ( ∗ )
 WACC = 1 − ∗ +
 + +

Where t is the tax rate applied to the company, kd is the cost of debt of the company,
ke is the cost of equity previously calculated, E is the Equity of the company and D is
the total amount of debt of the company.

There are four different types of cash flow inside the companies:

 1. Shareholder Cash Flow: it allows us to calculate the value available from the
 cash flow to enable the value creation for the shareholder, taking into account
 debt and the cost of equity. It is calculated attending to the operation of
 subtracting the principal and interest payments from the Free Cash Flow (here
 and onwards FCF). It also takes in consideration the Working Capital Needs of
 the company during the period and the reinvestment in fixed assets.

 ℎ ℎ ℎ = − 1 − ∗ − +

 2. Debtholders Cash Flow: This cash flow can be calculated by the sum between
 the interests paid by the company and the repayment of the principal of the
 Debt hold. In this cash flow the cost of debt (here and onwards kd) is taking in

 pág. 7
consideration and used in order to discount these cash flows and calculate
 their present value.

 3. Capital Cash Flow: The Capital Cash Flow is supposed to represent the total
 cash flows available for the capital holder after taxes. This figure is the result of
 the sum between the cash flows available for the shareholders plus the cash
 flows available for the debtholders, the last one is composed by the principal
 repayment plus interests.

 The formula of the Capital Cash Fow (CCF) is the following one:

 = ℎ ℎ + ( ∗ − ∆ )

 Where D is the total financial debt hold by the company and kd is the cost of
 debt of the company.

 4. Free Cash Flow (FCF): The Free Cash Flow (here and onwards FCF) allows the
 valuation of a company through the calculation of this cash flow which is based
 on the cash flow available after all of the operations, after also discounting
 fixed assets reinvestments and the Working Capital needs of the company. This
 cash flow does not take into account the financial debt neither leverage of the
 company. In order to calculate this cash flow, after doing the previous steps, it
 is necessary to calculate the discounted future Free Cash Flows of the company
 as well.

 = ∗ 1 − + + − ∆ −

 Where t is the tax rate applied, D is the Depreciation of the assets, A is the
 amortization, DWC is the Working Capital needs of the company and Capex is
 the Capital Expenditure that the company has incurred in.

 3.2 Multiples

The multiples valuation method based its structure in calculating the value of a
company using the current value of other similar companies inside the sector. In order

 pág. 8
to do so, the quotation of other companies must be taken into account and based on
some of their ratios, then those ratios are applied to the company in order to reach a
value by comparison. Sometimes instead of using ratios or the quotation of other
companies, the sector average is taken as reference and the value is calculated based on
it. This method assume that market is efficient, all prices have been discounted and all
the information is available for everybody.

However, there are different multiples methods in order to evaluate a company:

v Quotation Multiples method

The Quotation Multiples method is based on the estimation of a company’s value taking
other company’s quotation and ratios in order to calculate it. It is a key point to revise
other company’s Income Statement os accounts in order to analyze if the quotation of
such company is related or based in their accounts, otherwise it will not be useful to use
their ratios and quotation to calculate the value of other company. Usually, the sector
average ratios are taken in order to evaluate companies using the quotation multiples.
The main disadvantage of this method is the subjectivity of it, since it uses comparable
companies in order to calculate the value of other company which could not perform the
same or could not be structured the same way even though both belong to the same
sector.

Therefore, we have the following structure to apply the Quotation Multiples method:

 1) Sector Analysis and Companies selection: In first place, a sectorial analysis must
 take place in order to identify the companies that are going to be taken as a
 reference to evaluate the company. To enable that selection, it must be taken
 into account factors such as the geography of the target companies, similar
 activity, similar size and operational structure.

 2) Target Companies Analysis: The companies selected need to be analyzed in
 order to identify if they actually have the same structure, similar revenue
 projections, similar competitive situation and similar vertical integration than
 the company is being evaluated.
This two steps are very important in order to reach a proper and correct valuation of the
company since if the selection and sector analysis is not correctly done, the ratios and
multiples will not be appropriated for the company being evaluated and therefore the
final valuation will not be a fair representation of the value of the company.
 3) Once those two first steps have been properly achieved, the selection and
 calculation of the quotation multiples have to be performed:

 - Price to Earnings ratio (PER): It is calculated by the division of the Market
 Capitalization by the Net Income of the company. Other way to calculate

 pág. 9
this multiple is to divide the quotation price of the share by the Earnings per
 Share (EPS) of the company. The result of this multiple will ultimately be
 influenced by the leverage level of the company.

 = / =
 Net Income

 - Relative PER: It is calculated dividing the PER of the company by the PER of
 the country where the company has its fiscal residence.

 Company P/E
 / =
 Country P/E

 - EBIT multiple: Calculated based on the division of the Enterprise Value by
 the EBIT of the company. This multiple is not influenced by the leverage
 level of the company.

 EV
 =
 EBIT

 - EBITDA multiple: The calculation based its result in the division of the
 Enterprise Value by the EBITDA of the company. It is a good multiple choice
 in order to acquire foreign companies and it also does not take into
 consideration the leverage level of the company.

 EV
 =
 EBITDA

 - EV / Operating Cash Flow: The main difference between this multiple and
 the previous one is that the Operating Cash Flow takes into account the
 Working Capital needs of the company, being its formula the following one:

 ℎ = + ±

 It is important to take in consideration that this ratio is not a good choice in order
 to evaluate companies with a high growth expectation since this method rarely
 estimates future cash flows and as a consequence the valuation of the company
 could be lower than expected.
4) After selecting ad calculating the multiples, the final step is the selection
 of the valuation range for the target. In order to do so, it is important to
 follow the next steps:

 a. Selection of the final valuation range based on the calculations obtained
 during the previous steps.

 pág. 10
b. It is important to give an extra importance to the PER multiple since it is
 one of the most important and reliable ones in quoted companies. If the
 company is not quoted could be a better choice to use the EBITDA
 multiple over the PER one.
 c. It is also important to revise the results obtained from other multiples in
 order to be able to determine if factors such as depreciation are having
 a crucial impact in the valuation of the company.
 d. Revising if calculations and result are logical and make sense comparing
 them with similar companies is always important in order to determine
 a proper and reliable valuation of the company.

The selection of this method to determine valuations of companies is always a
good strategy since it takes in consideration sector trends, risks associated to the
business area and future growth based on expectations. However, the
probabilities of finding a company 100% comparable to the one being evaluated
because of several factors such as accounting principles and legislation.

v Transaction Multiples method

The objective of this methodology is to calculate the price of a company based
on other prices or transactions that others have paid for similar companies to
the target company.

The multiples represent the price paid for similar companies for the 100% of
the capital of the company, including features such as shares, warrants and
options, other convertible products with high execution probability.

The result of this multiples is usually higher from the quotation ones. This is
basically due to the fact that transaction multiples take as reference particular
transactions that could include especial conditions and agreements between
the companies inside the deal.

The main ratios used in this methodology are:

 - Price/Sales
 - Price/Profit
 - Price/Value in Books
 - EV/Sales
 - EV/EBITDA

 pág. 11
- EV/EBIT

It is important to take in consideration crucial factors such as the date of the
transaction, for instance, if the transaction taken in consideration is from years
ago, the estimation by multiples will no longer be accurate. The transactions
selected need to be from the present and need to be based on similar size,
operations and circumstances companies in order to reach a reliable and accurate
calculation.

The advantages of using this valuation method come from sources such as the
establishment of reasonable prices, the knowledge about sector trends and
expectations and finally the estimation of the supply and demand of the sector
which is a key point when evaluating a company. But this method also has some
disadvantages, for instance: transactions from similar companies are rarely highly
comparable which provides with a wide range of price variations, also the data
needed to do the calculations inside this method could sometimes be confidential.

Both multiples valuation methods are complementary to the Discounted Cash
Flows one. Usually, these methods should serve to check if the DCF results are
logical since the results from both should also be similar.

 Discounted Dividends

The Discounted Dividends method is based on the estimation of a share value taking
as reference the projections for those dividends and their present discounted value.
The result of the calculation is defined as the figure resulting from the present value
of dividends projection plus the final value in the sale.

This model assumes that the cost of equity (ke) keeps constant among the valuation
period, the formula by which this model is represented is the following:

 = S +
 1 + ^

Where Di are the projected dividends and ke is the cost of equity.

Due to the fact that a projection of infinite dividends is not logical, there several
different methods inside the Discounted Dividends method.

 pág. 12
One of the most common ways to calculate the Discounted dividends is through the
Gordon Shapiro approach, which establishes that given the expected dividend of the
following year to the calculation and applying a constant growth rate, the value of a
share can be calculated:

 Di
 =
 (ke − g)
Where Di is the dividend of the following year to the calculation, ke is the cost of
equity and g is the constant growth rate applied.
According to Shapiro this formula would be as follows if the dividend for the
following year is not an available information:

 Do ∗ (1 + g)^i
 =
 (ke − g)
Where Do is the current’s year dividend distributed by the target company.
Damodaran (2002) establishes two main considerations regarding this method of
Discounted dividends:
 - First, the constant growth rate used in the calculations of the present value
 of the share cannot be higher that the GDP growth rate for the same period
 that the calculations.
 - Second, it is assumed that, as a constant growth rate is taken for the
 calculations, the dividend distribution rate must follow the same trend as
 the growth one.

 According to Shapiro approach, the constant growth rate can be also calculated
 based on the Payout of the company. The payout of a company is the dividend
 distribution rate, the Plowback rate is the result of subtracting the payout ratio
 (always in %) from 1. The result of this operation is the Plowback ratio, which
 after multiplying it by the Return on Equity (ROE) of the company would result
 in the theoretical growth rate of the company. Find the formulas disclosure
 below:

 pág. 13
 = 1 −

 = ∗

Other different manner of calculating the value of a share by applying the
Discounted dividends method is by using different growth rates, a higher one for the
first years of the calculation and a lower one for the rest of the years. This theory is
based on the idea that starting companies usually have a very high growth rate
during the early stages of their life cycle. However, these companies start to lower
their growth rate and keep it stable when they are in the maturity inside the lifecycle
of the company. That is the reason why this calculation is more appropriate for
companies in early stages or with not stable payout ratio.

 PER

The PER (Price to Earnings Ratio), is one of the most used ratios in valuation
models for companies of the majority of the sectors. It indicates the times that the
market pays the profit of the company or in other words the market value of every
euro of profit of the company. PER allows us to compare companies from different
sectors and shows us the expectations for that company and future trends.

The PER is calculated by dividing the market price of the share in the Stock Market
by the Earnings per share (EPS), which is calculated by the division between the Net
Income of the company and the current number of shares. The calculation would be
as follows:

 price
 =
 EPS
 The PER is also related with the growth rate of the company and as a result it is
 related with the ROE as well. The growth rate for the company is determined by
 the variables ROE and Plowback as previously mentioned in the Gordon Shapiro
 approach.

 ROE is calculated as follows:

 Net Income
 =
 Equity

 pág. 14
Based on previously mentioned calculations and formulas, it can be deduced the
following equations process:

 ∗ Plowback
 PER = =
 − ∗ −

Then:

 1−
 = = −
 − ( − )
Other different approach in PER terms is the relative PER which represents the
relation and connection of a company’s PER with the ones from a country or with
other sectors.

The PER is one of the most used indicators in the market in order to perform
valuations and management activities. It allows to compare companies between each
other and to compare the prices of each of them based on the number of times that
the market is paying each profit unit of the company.

The main advantages of the PER are:

 - It allows quoted and open capital companies to use it and the calculations
 are quite simple.
 - It relates the market price of the share with the profit of the target
 company.

Main disadvantages:

 - It does not take in consideration risk, changes in growth rates and changes
 in dividends distribution policies.
 - It may be affected by changes in the macroeconomic environment.

 pág. 15
4. The Automotive Industry

 4.1 General Overview

In order to conduct a proper evaluation of the company Tesla Motors, it is important
also to understand the environment and market behavior that is surrounding the
company. Factors such as macroeconomic ones are crucial to reach a deeper
understanding of the market behavior of the Automotive Industry. Even though
consumer’s perception of the automobiles is based on the idea of a basic need, they are
still considered as luxury goods in general terms.

First of all, an illustration the impact of the Automotive Industry sales over the global
economy is important to understand this market.

 Vehicle Sales impact on GDP
 15%

 10%

 5%

 0%
 2005 2006 2007 2008 2009 2010 2011 2012 2013 2014 2015 2016
 -5%

 -10%

 Global GDP growth Global Vehicle Sales growth

 Data: World Bank
 Source: Own compilation

As it can be seen, both indicators are correlated between each other, meaning that the
Automotive Industry has an important impact over the global GDP. The Automotive
Industry is one of the most consolidated industries of the world, it is also one of the
most competitive markets, where 15 companies control most of the market share. But,
even though, big players have an important weight in the market, it has been proven that
the Automotive market is highly dependent on the world’s economy performance.

In terms of market dominance, there are four main markets in global car sales – Europe,
United States, China and Japan -. China is currently the largest market of the world and
so it was during the economic crisis. This leadership allowed the global market to
remain relatively stable during the recession. However, Tesla Motors has redirected its
strategy and focused it in strong economies such as Europe, UK and United States.

 pág. 16
Growth in public debt is also a key point in terms of Automotive Industry analysis.
Europe, Japan and United States have increased their public debt during last years, since
the economic crisis and China has entered into an overcapacity problem. These factors
altogether stand that a wider outlook of the economy must be considered, in order to
take into account possible impacts across the industry.

 4.2 Electric Vehicles Market

In order to reach a more reliable forecast and valuation of Tesla Motors is important to
first not only understand the market of Electric Vehicles (EV), but also to analyze where
is going.

The EV market has been growing at a relatively fast pace during last year, the
improvements in range capacity, relatively lower prices and the establishments of
certain grants for EV acquirers are some of the main factors that have made possible
this development in the market. Several market researches have shown that most of
driver would rather own an electric car than an oil car. Between main obstacles for
acquiring electric cars, the most common one is the price of electric cars or for instance
the range of the car. These obstacles have been diminishing with the appearance of not
only new electric cars but also new business models. Tesla Motors has solved the range
problem for driver, reaching at maximum more than 350 miles with just one charge.
The other obstacle, the price, is still one of the main problem of electric cars for drivers,
however Tesla Motors has recently launched a new model called “Model 3” which
average price is between 35-38 thousand dollars. Comparing these prices and ranges,
which were obstacle for most driver in order to acquire an electric vehicle, it can be
seen how comparing nowadays’ electric cars with oil cars, the differences are no longer
that wide.

Despite being a relatively recent market, EV companies have shaped their business
model in order to achieve profitability. New manufacture strategies, additional
regulatory standards and policies against vehicles emissions are some of the factors
contributing to the shifting of the sector from traditional oil powered vehicles to electric
and newer vehicles. This shift will continue to increase as long as electric vehicles
continue to improve not only their features and capabilities but also their price.

 4.3 Governments Incentives

Governments form most of the countries have certainly interest in electric cars as the
new way of mobility. Campaigns related with environment sustainability are common
nowadays and government support in this subject is notoriously stronger than years ago.
To promote the production and acquisition of electric and hybrid cars, European and
American governments offer certain grants for the customers in order to help them to
acquire this type of vehicles.

 pág. 17
A clear example of this type of grants or incentives are the USA Department of Energy
income tax credits reaching up to $7,500 for Electric and Hybrid Vehicles buyers. For
instance, Tesla vehicles buyers would receive the full amount of the grant since is a
fully electric car.

The way this government strategy affects Tesla Motors in particular is by increasing its
demand. People would be more willing to change their traditional vehicles to new
electric ones if there is some kind of financial incentive or grant related with it. With
this kind of strategies, the transition from traditional vehicles to electric ones will be
faster and cheaper for the customer, resulting in a better technology use and a reduction
in the usage of fossil fuels.

 4.4 Market Competitors

In order to be able to analyze Tesla Motors competitive environment is a key point to
deeply understand what are the current alternatives to its vehicles. Fuel vehicles market
is highly competitive and there are some brands that are completely established in the
market share of the sector. Current Tesla models X and S are currently competing on the
premium sedan and SUV market which main competitors are well known brands such as
Mercedes, BMW, Audi and Lexus. With the launching of the new Model 3 Tesla is
entering at the same time in the medium-sized sedans market which is dominated by the
same brands as previously mentioned in addition of brands such as Toyota and Honda.

But Tesla vehicles are no longer competing against fuel cars from the previously
mentioned brands. Most of the big players in car manufacturing have already began to
produce and sell electric cars as well. BMW launched two years ago i3, i5 and i8
models, first fully electric vehicles in the history of the brand. Volkswagen will launch
its first fully electric car at the beginning of 2020, the Volkswagen Phaeton which will
compete with Tesla’s model X. In addition, Porsche has announced the launching of its
fully electric sedan by 2020 to compete with Tesla’s model S, the new Porsche will have
a 15% higher range than Tesla’s one and will have a similar competitive price.

Market competition in terms of electric cars will be strong by 2020. The main reason is
the quick development of fully electric cars by the big players in the market. These new
electric cars will directly compete with Tesla’s different models. However, Tesla is
settled in the market from the beginning which gives it a competitive advantage over its
competitors and gives it the opportunity of further developments of its existing cars and
the opportunity of creating new more innovative ones.

Regarding Tesla’s Energy production and storage products, there are several companies
currently developing technologies to directly compete with Tesla’s integrated systems
and energy storage systems. For instance, AES Energy Storage, LG Chem and Samsung
are developing different energy storage systems in order to create a competitive
advantage. Solar Energy competition remains stable, being the only competitors the
traditional local utility companies. Residential Solar Energy competition counts with
several competitors such as Sunrun Inc., Vivint Solar Inc. and Trinity Solar and
Songevity Inc.

 pág. 18
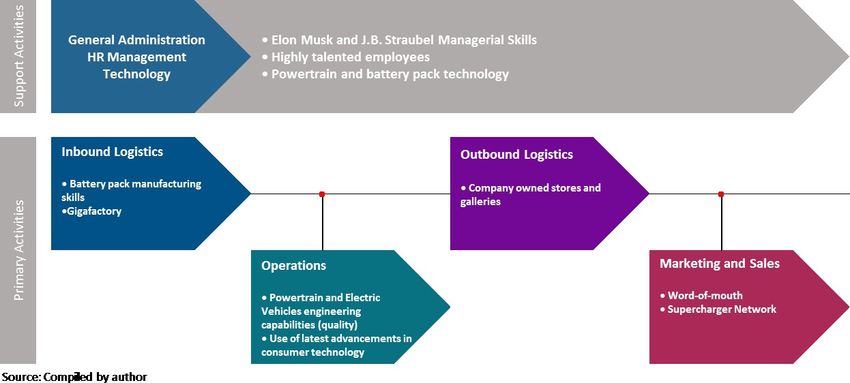
In addition of the competition created by the existing big player in the Automotive
Industry, new competitors in electric vehicles are arising as well. The switch from fuel
vehicles to electric vehicles is still in development but this movement has generated
new market opportunities for new players.

Even though market entry barriers are high there are still companies willing to invest in
electric cars and take a competitive advantage over the traditional big players.
Companies such as Google, which is the main technological company nowadays, is
developing self-driving electric cars to compete with Tesla. On the other hand,
completely new companies such as Lucid Motors Inc., are developing innovative
electric cars that supposes additional competition in the redefined Automotive Industry.

 4.5 Tesla Competitive Advantage

Previously in this thesis it has be mentioned that even though Tesla has several
competitors the company is still ahead of its competition. Further innovation, current
existing product and value chain flexibility are key points for Tesla to keep its growth
rate. The use of Porter’s Value Chain Analysis (1985) is a good way in order to see
what are Tesla’s best value-creation sources:

Tesla is one of the few companies that follows a vertical manufacturing strategy. Tesla
design, manufacture and monitor the quality all inside the company. This vertical
strategy makes possible a cost reduction improves final product quality.

Regarding the powertrain of Tesla Inbound Logistics, it is developed in its California
factory and the battery packs, called superwall, are sourced from Panasonic. Tesla’s
battery packs and electric batteries are in most cases ahead of the competitors because
of their innovation and quality.
Tesla’s competitive advantage from Operations comes mainly from the technical know-
how, years of research and development and higher innovative features. Tesla is
expected to keep this competitive advantage based on the idea that other competitors are
years behind Tesla and while they are currently launching products to compete with the
Tesla’s ones launched several years ago, Tesla is creating new technologies and
improving its cars.

 pág. 19
In terms of the overall value chain, Tesla is supported by its installed capacity and
know-how manufacture of products to maintain its competitive advantage over the rest
of competitors.

 5. Tesla Motors Inc.

Tesla Motors is the most famous electric car company in the world. The company’s
business model is based on the sale of electric cars, electric batteries, solar panels and
components for electric propulsion of vehicles.

The core of the company is based on the propulsion system engineering which includes:
the batteries pack, motor, power electronics and the engine. Tesla provides with a
copper three phases motor and an especial engine in order to reduce the resistance and
the loss of energy. Tesla electric cars contain high number of processors and algorithms
in order not only to control the power and security but also to manage the vehicle
stability, acceleration and the charge status of the batteries pack.

Tesla motors sells cars all around the world via Internet by its web platform or via
specialized retail commerce. Currently, Tesla has run out stock of reservations in the
new model Tesla Model 3. In order to measure the presence of Tesla around the world it
makes more sense to attend to the number of charge stations around the world over the
number of cars, since the last ones can be sell through the web platform all around the
world even if the buyer country has no Tesla infrastructure at all.

As a curious fact, Tesla Motors introduced the electric autonomous car to the market
which has made the company really famous and has provided it with a very good image
and high brand value. However, Tesla cars have still some problems related to their
innovation, that is why during March and April Tesla share’s price went down at a fast
pace.

In addition, Tesla has been graded as the top company in
terms of customer satisfaction. Through a consumer survey,
it was determined that the 91% of Tesla owner would buy a
Tesla car again.

Customer satisfaction is one of the key KPIs in the
Automotive Industry, combining a vertical value chain
strategy, further innovations than competitors and product
quality Tesla is currently positioned at the top of the Electric
Vehicles Industry.

 pág. 20
Tesla has over 1.210 charge stations around the world and counts with more than 9.428
superchargers distributed all around the world. These stations and superchargers are
distributed through North America, Europe, Middle East and Asia. The objective of
Tesla is to increase the number of stations and chargers through the following years
which will help to build a sustainable infrastructure for not only Tesla users but also for
electric car users in general.

 Source: Tesla Motors Inc.

 Source: Tesla Motors Inc.

 pág. 21
5.1 Tesla Motors Strategy

When talking about the Automotive Industry, it could be have seen in the previous point
how difficult is actually to penetrate in the sector and how many well established
competitors are in the market. The barriers for new market players are really high and it
is a difficult task to actually become of the main players in the market. Most of the big
players are traditional players that have been in the sector for more than 40 years and
that count with not only the resources but also the image and brand to keep their
position and number of customers.

The case of Tesla is not different, the company had to overpass the entrance barriers of
the market in order to become a player and be able to establish itself in the sector. But
one of the most important factors od success of Tesla Motors is its long-term strategy.
Back at the beginnings of Tesla, the first car ever launched by the company was the
Tesla Roadster. The Roadster was a sports car launched by Tesla in 2008, it had an
autonomy around 390km and an acceleration of 3,9 second from 0-100km/h. Even
though the car specifications were good enough and in addition the Roadster was one of
the first fully electric car that could be compared with traditional cars, they were only
sold 2450 units worldwide, so it was not really an overwarming success of the car. In
addition, the car price was above 100 thousand dollars for the basic option, supposing a
luxury car in general terms.

Even though the first Tesla car was not really a huge success, it was the perfect feature
to begin the Tesla long-term strategy. This strategy was based on the manufacturing of
an initial car which was supposed to be luxury and to have a sport design in order to
create and image for the brand and set the quality of their products. This was the first
stage of the strategy. The second stage was to manufacture a similar priced car but with
a new level of innovation and that could be a fully competitor of traditional cars but still
include more technology and innovations than the majority of the cars. This was the
Model S, launched in 2012 at an average price of 100 thousand dollars was the best sold
Tesla car in the history of the company. The next stage of Tesla’s strategy was to launch
an even more expensive and higher quality vehicle which had to not only improve the
quality associated with the brand but also to increase the role of innovation inside the
company, this car was the Model X, launched in 2015 at an average price of 130
thousand dollars. The Model X consolidated the Tesla brand as a high quality luxury
cars and best innovation in electric cars in the market. In addition, with the launching of
these two vehicles, Tesla became the first automotive company to include a working
Autopilot that could be use by users in public roads.

With this strategy Tesla wanted to introduce itself as a luxury fully electric car
manufacturer which offer high technology and the best quality in their products while
being respectful with the environment. One of the key points of the strategy was to
reinvest most of the revenues generated for the first to models in order to manufacture
the las model which was going to be the final result of the strategy. The final model was
the Model 3 launched in 2017 at an average price of 35 thousand dollars. This model is

 pág. 22
intended to be the culmination of Tesla’s strategy. Is the first tesla model which has
been made to produce it in masses, the Model 3 is intended to be the most affordable
Tesla car ever made but still keeping the quality and the technology of the previous
models.

Inside Tesla’s strategy is also the sale of electric batteries and the leasing of its vehicles.
Both of those activities are included in the consolidated Income statement of the
company. Even though the weight of these activities is much lower than the weight of
the car sales over the total revenues of the company.

Finally, Tesla’s strategy is expected to remain the same in the long-term due to its
efficiency and in addition, Tesla is slowly incorporating the supply of solar roof tops
between its products. This has been possible thanks to the acquisition of Solar City by
Tesla. However, there has been no sales of these products so far.

Through this strategy, Tesla will be able to improve the image of the brand and, at the
final point of the strategy, to create value not only for the customer but also for the
shareholder. In addition, is expected that Tesla will make a positive result within the
following two years thanks to the long-term strategy that has been following:

 pág. 23
SWOT
STRENGHS OPPORTUNITIES
 Ø Proper developed strategy in terms of
 demography distribution attending to
 Ø Innovative in electric car customer segmentation.
 development. Ø Image of an environmentally respectful
 Ø Biggest charging stations network company, which improves relationship and
 worldwide reputation regarding customers.
 Ø Higher technology tan competitors Ø Market growth of electric cars increasing
 Ø Fully vertical integrated: much faster than the hybrid cars one.
 manufacturing, promotion and Ø Improve post-sale services and
 distribution is done by the Company. relationship with customers by offering
 Ø Competitive price taking in extended guarantees and a better service
 consideration quality and features network.
 that vehicles provide Ø Expectations about the electric car sector
 are optimistic since quantity and Price of
 oil will get worse.
WEAKNESSES THREATS

 Ø Higher Price due to low demand on
 Ø Current Price of fossil fuels in decreasing.
 electric cars.
 Ø The market is still dependent of grants and
 Ø Customers do not rely completely in
 equivalent to increase the demand.
 the sector yet.
 Ø New competitors with advanced
 Ø Little customer segments the main
 technology currently penetrating in the
 objective of the Company.
 market.
 Ø Long delivery time of the vehicles and
 Ø Customer may not be willing to change
 products.
 their traditional vehicles for the new
 Ø Need of installing devices in homes
 technologies.
 such as chargers or batteries.

 5.2 Historical Share Price Analysis

 Tesla’s IPO was launched in 2010 and the initial Price of the IPO was $17 per share.
 The share price is currently at around $290 and shares reaches their maximum point in
 history in June 2017 at a price of $383,45 per share. The biggest increase to date was
 from November 2016 to June 2017 where share price went up more than a 200% in just
 6 months. This rise can be explained by the fact of Tesla launching a new model, mode
 3, which was the cheapest model yet and was going to provide large amounts of cars at
 a faster pace. The establishment in Europe as the primary fully electric car was also one
 of the factors that affected Tesla’s rise and Uber’s deal with Tesla was the final factor to
 reach the maximum value of the company yet.

 pág. 24
Source: Yahoo Finance

The most important falls that can be seen on the screen are mainly due to car accidents
with Tesla cars that were being driven by the Autopilot. There have been more than two
autopilot accidents in the history of Tesla’s technology. Every time there is one
accident, the share price of the company experiences an important fall. The most recent
example is the car accident in USA in March 2018. It can be seen in the screen how at
this time there is a fall in the share price.

In addition, it is a really interesting matter of study how Tesla share have gone up in
general terms since the IPO even though the company has not done any profit yet and
being all the net result from previous years negative.

 5.3 Ownership Structure

There are currently 156.100.000 Tesla shares outstanding. Out of the total number of
shares, the 22% is held by insiders, a 5% by the owners and the remaining number of
shares in free float. Assuming that most of investors are Mutual Funds or Institutional
funds and that the average daily trade is around 5 million shares, is correct to say that
Tesla’s shares are easily traded in the market and that the risk of counterparty is really
low in this case.

 pág. 25
5.4 Financial Statements Analysis

 2017 2016 2015
 Total revenues 11.758.751 7.000.132 4.046.025
 Growth 52% 55% 24%

 Total cost of revenues 9.536.264 5.400.875 3.122.522
 Growth 57% 55% 27%

 Gross profit 2.222.487 1.599.257 923.503
 As a % of the Sales 19% 23% 23%

 EBIT -1.632.086 -667.340 -716.629
 Growth -89% 7% -284%

 EBT -2.209.032 -746.348 -875.624
 Growth -109% 16% -208%

 Net Profit -2.240.578 -773.046 -888.663
 Growth -106% 14% -202%

Tesla has been exponentially growing since 2014 until 2016. In this period, it has
counted with a CAGR of 97,8% and its main source of income is still automotive sales.
However, during last year (2017) even though Tesla has increased its revenue as
previous years, the EBIT of the company is an 89% lower than in 2016. This difference
is mainly due to operating expenses and selling and administrative of the company, both
figures increased more than a 70% from 2016 to 2017 concluding in much lower EBIT
in 2017 even though Tesla had higher revenues that year. Since Tesla is a fully vertical
integrated company, operating expenses supposes an important figure inside the
company’s Income Statements. Selling and Administrative is also an important part of
Tesla since the company has its own stores and has been developing new and more
innovative selling platforms.

 Research and Development supposed a higher expense in 2017, an expenditure that
was mainly due to recent investigations about automotive improvement and the possible
launching of new models in a near future. New battery packs and the released of the
new solar roof tops supposed for Tesla a higher expenditure of research and
development, affecting its Income Statement.

As a result, the Net profit of the company was a 106% lower in 2017 being -2.209
million dollars. This negative Net profit has been stable since the IPO, 8 years ago now,
has had a negative impact in the Return on Equity (ROE). This situation of losses since
2010 has been reducing value for shareholder, which at the end, a company’s main
purpose is to create and increase that value.

 pág. 26
Balance Sheet in millions $ 2013 2014 2015 2016 2017
Total current assets 1.266 3.199 2.792 6.260 6.571
Total non-current assets 1.151 2.651 5.301 16.404 22.085
Total current liabilities 675 2.107 2.816 5.827 7.675
Total non-current liabilities 1.075 2.830 4.187 12.084 16.743
Total stockholders' equity 667 912 1.089 4.753 4.237

 2013 2014 2015 2016 2017
Debt / Assets 72,4% 84,4% 86,5% 79,0% 85,2%
Debt / Equity 262,4% 541,3% 643,1% 376,8% 576,3%
ROE -11,1% -32,3% -81,6% -16,3% -52,9%

It can be taken from Tesla’s Balance Sheet that Tesla’s assets are mostly non-current
assets. This is mainly due to the fact that most of Tesla’s assets are divided between
Property and Solar Energy Systems, being both of them valued at more than 6 billion
dollars each. The Balance Sheet also shows that it has grown by a CAGR higher than
100% in general terms, by its side, the stockholders’ equity having had its biggest
increasing from 2015 to 2016. As it is shown in the table, leverage has increased
significantly, being the Debt to Equity ratio of 576% in 2017 and having reached its
peak in 2015 with a 643%.
In general terms, Tesla has more leverage but also more non-current assets and
infrastructure, at the same time its ROE has been decreasing since 2013 which means
that value creation for shareholders is lower every year.

 pág. 27
6. WACC
The Weighted Average Cost of Capital (WACC) is the most common and accepted tool
in order to discount cash flows. It takes in consideration the time value and risk
assumed by the company, in this case by Tesla Motors, by including the cost of equity
and the cost of debt in its calculation. The calculation of the WACC has been previously
explained in this thesis. Tesla’s WACC result of the previously explained calculations is
8,52%.

 6.1 Cost of Debt (kd)

In order to understand the result of Tesla’s cost of debt, is important to know that since
2014 Tesla was graded as “B-”by S&P500. This change in the grading of the company
meant a change in the cost of debt as well, since companies with lower rates have
usually a higher cost of debt due to their implicit risk added. According to this
statement, Tesla’s cost of debt has been calculated attending to its outstanding debt and
several products considered also as debt inside the Balance Sheet and the interest
expense incurred by the company throughout the different years.

However, according to the S&P500 rating, companies within this grade range and with
a higher capitalization than 5 billion dollars are assigned with a credit spread of 5,5%,
Damodaran (2014).

 6.2 Cost of Equity (ke)

The cost of equity has been calculated by the CAPM model explained at the beginning
of this thesis. The CAPM model takes in consideration the market risk free rate, the
systematic risk (Beta) and the equity risk premium. The result of the model is a proper
calculation of the return that shareholders are going to ask for the given risk of the
company.

 pág. 28
6.2.1 Risk Free rate

In this case, the risk-free rate considered for the different calculations is the 10-year U.S
Treasury Bond. In the chart is shown the history of the U.S 10-year Treasury Bond, as it
can be seen is currently at 2,83% and it overall terms it has been decreasing since the
year 2000. However, during the last two years this rate has been raising at a stable rate
which indicates a recovery of the economic situation in the country.

Source: NASDAQ

6.2.2 Systematic Risk

In order to calculate the Beta of the company is necessary to make a regression between
Tesla’s share price and the overall market returns in order to reach a certain correlation
between them and therefore estimate what is the risk implicit in Tesla. However, this
model even though is the most used one in terms of systematic risk, has some factors
that does not take in consideration. For that reason, and in order to make the valuation
of Tesla more realistic, the Beta that is going to be used in the valuation will come from
an average of the different calculated Betas of Reuters and Bloomberg. Their
calculations take addition factors in consideration and their Betas are in most cases
accepted in order to evaluate companies. According to this, The Beta of Tesla would be
between 0,94 and 0,99.

6.2.3 Market Risk Premium

The Market Risk Premium is the extra return that investor require to the market in order
to cover the cost opportunity. This premium would consist on the difference between
the market return and the risk-free rate, which supposes the cost of opportunity of
investing in the market and assuming the implied risk in comparison to investing in the
risk-free asset which in theory would have no risk at all. Damodaran calculated that this
risk premium of the market was 5,69% at the end of 2017 and this figure will be used in
order to do the valuation of Tesla.

 pág. 29
You can also read