Combination of RNA Seq transcriptomics and iTRAQ proteomics reveal the mechanism involved in fresh cut yam yellowing - Nature
←
→
Page content transcription
If your browser does not render page correctly, please read the page content below
www.nature.com/scientificreports
OPEN Combination of RNA‑Seq
transcriptomics and iTRAQ
proteomics reveal the mechanism
involved in fresh‑cut yam yellowing
Shuang Guo1,2,4, Dan Wang2,4, Yue Ma2, Yan Zhang3 & Xiaoyan Zhao1,2*
The aim of this study was to examine the regulation of transcriptomics and proteomics related to the
yellowing of fresh-cut yams after storage. The comparison of yellow fresh-cut yam (YFY) vs. white
fresh-cut yam (control) revealed 6894 upregulated and 6800 downregulated differentially expressed
genes along with 1277 upregulated and 677 downregulated differentially expressed proteins. The
results showed that the total carotenoids, flavonoids, and bisdemethoxycurcumin in YFY were higher
than in the control due to the significant up-regulation of critical genes in the carotenoid biosynthesis
pathway, flavonoid biosynthesis pathway, and stilbenoid, diarylheptanoid, and gingerol biosynthesis
pathway. In addition, the tricarboxylic acid cycle and phenylpropanoid biosynthesis were both
enhanced in YFY compared to the control, providing energy and precursors for the formation of yellow
pigments. The results suggest that the synthesis of yellow pigments is regulated by critical genes,
which might explain the yellowing of fresh-cut yam after storage.
Chinese yam (Dioscorea opposita Thunb.) is a well-known vegetable with high nutritional and medicinal values1,
which contains mainly proteins, sugars, vitamins, fats, choline, amylase, iodine, iron, calcium, phosphorus, and
other trace elements that are indispensable to the human body. In addition, the yam possesses may pharmacologi-
cal effects including antioxidant, anti-aging, anti-tumor, and hypoglycemic. The yam also enhances immunity
and is thus widely used in functional foods, health care products, medicine, and other i ndustries2,3.
Fresh-cut fruits and vegetables are minimally processed, cold transported and ready-to-eat products, pro-
viding convenience and freshness to consumers4. Some consumers are allergic to the epiderm of Chinese yam5.
Besides with the convenient eating characteristics, processing of fresh-cut Chinese yam can provide a good way
to solve the allergy issues. The change in the color of the yam is a common quality issue during the processing and
storage of fresh-cut yams, with browning being a limiting factor. Our recent study revealed that fresh-cut yam
turns yellow during storage, which is attributed to various yellow substances including bisdemethoxycurcumin
and other unknown c ompounds6,7. This yellowing process is different from the browning process during stor-
age, which results from the polyphenol oxidase-catalyzed oxidation of phenolic compounds to o rthoquinones8.
However, a variety of specific metabolic pathways may be related to yellowing, and few prior studies have inves-
tigated these pathways fully.
Modern genetic research has demonstrated that most genes exercise their functions through the regulation
of particular proteins. It has been extensively shown that post-transcriptional processing determines the levels
of steady-state p roteins9. RNA sequencing (RNA-Seq) is a method for transcript quantification that allows the
more precise measurement of transcript levels and their isoforms compared to other approaches. Thus, RNA-Seq
has been widely and successfully applied in transcript profiling, annotation, and gene identification in various
plant species10–12.
Likewise, proteomics is also gaining recognition as a reliable and reproducible high-throughput approach
for understanding biological p rocesses13,14. Isobaric tags for relative and absolute quantification (iTRAQ) is a
second-generation, gel-free proteomics approach that can be used to accurately quantify protein levels.
1
College of Food Science, Shenyang Agricultural University, Shenyang 110866, Liaoning, China. 2Beijing
Vegetable Research Center, Beijing Academy of Agriculture and Forestry Sciences, Beijing Key Laboratory
of Agricultural Products of Fruits and Vegetables Preservation and Processing, Key Laboratory of Vegetable
Postharvest Processing, Ministry of Agriculture and Rural Affairs, Beijing 100097, China. 3Longda Food Group
Co. LTD, Shandong 265231, China. 4These authors contributed equally: Shuang Guo and Dan Wang. *email:
xiaoyanzhao001@163.com
Scientific Reports | (2021) 11:7755 | https://doi.org/10.1038/s41598-021-87423-4 1
Vol.:(0123456789)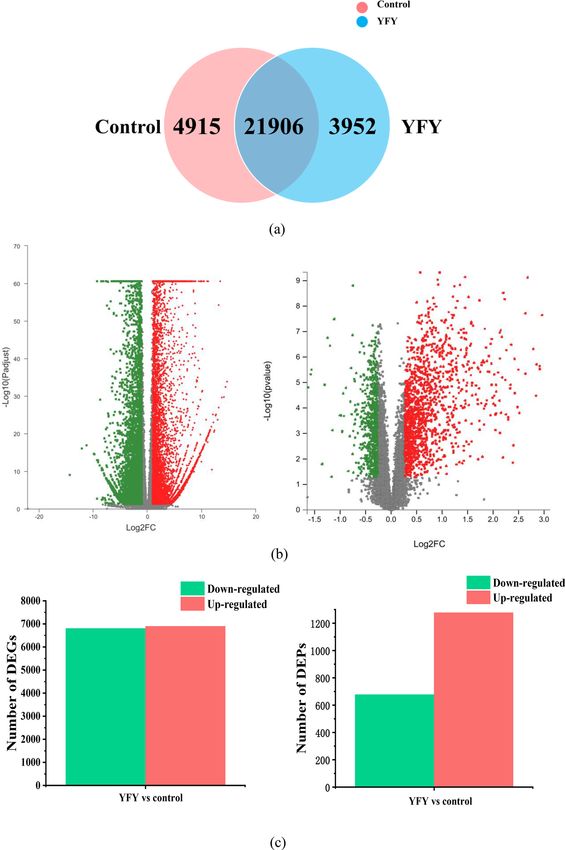
www.nature.com/scientificreports/

                                            Figure 1.  Apparent color analysis of fresh-cut yam: (a) yellowing of fresh-cut yam; and (b) L*, (c) a*, and (d) b*
                                            values of different groups. Each group included six replicate samples.

                                                To clarify the yellowing mechanism of fresh-cut yam, we investigated the differentially expressed pathways
                                            responsible for yellowing. To do so, we carried out transcriptomic and proteomic profiling to identify changes in
                                            the expression levels of critical genes and proteins. GO and KEGG enrichment analyses were conducted along
                                            with a functional analysis to elucidate the pathways involved in the regulation of genes/proteins responsible for
                                            yellowing. The results provide valuable information for the preservation of yams.

                                            Results
                                            Apparent color analysis of fresh‑cut yam. The color of fruits and vegetables is an important quality
                                            factor that reflects the freshness and indicates the market value of fresh products. In the present study, the color
                                            of fresh-cut yam became yellow after storage. The L*, a*, and b* values were evaluated, and the results for white
                                            fresh-cut yam (control) and YFY are shown in Fig. 1. As shown in Fig. 1, yams in the control group appeared
                                            white, which was the original color of the fresh-cut yam. In contrast, the yams in the YFY group appeared yellow,
                                            indicating significant yellowing during storage. Compared to the control, the YFY samples exhibited decreased
                                            L* and a* values but a significantly increased b* value, which is the most important index for evaluating yam
                                            yellowing, indicating that yellowing occurred during storage. The control and YFY samples were used for tran-
                                            scriptome and proteome analyses.

                                            Primary transcriptome analysis. By using statistical methods, we can make statistics and quality control
                                            of the tested sequence that directly reflect the quality of library construction and sequencing.
                                                This method can also be used to analyze the base quality, base error rate, and base distribution of each sample.
                                            The total numbers of reads obtained for the two groups of fresh-cut yams are listed in Table 1. In the transcrip-
                                            tome analysis, we tested two RNA-Seq groups (control and YFY) with three biological replications, generating
                                            approximately 48,844,588 raw reads with sequencing error rates less than 3%. The raw reads were pre-processed
                                            by removing the reads containing adapter/primer sequences, reads with a percentage of indeterminate bases

          Scientific Reports |   (2021) 11:7755 |                https://doi.org/10.1038/s41598-021-87423-4                                                   2

Vol:.(1234567890)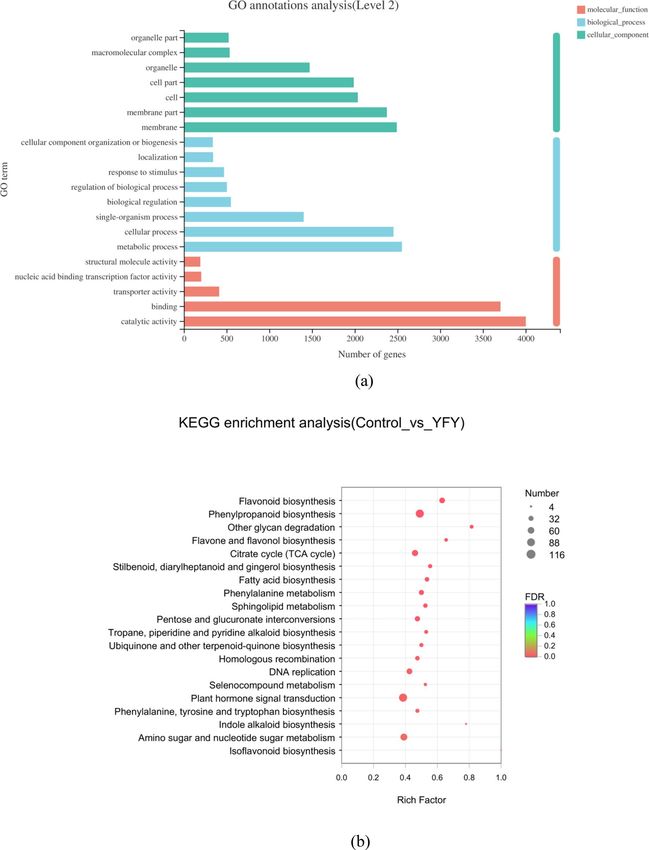
www.nature.com/scientificreports/

                                   Sample     Raw reads    Raw bases    Clean reads   Clean bases   Error rate (%)   Q20 (%)   Q30 (%)   GC content (%)
                                   Control1   47131910     7116918410   46602498      6938963552    0.0258           97.76     93.24     46.26
                                   Control2   48427706     7312583606   47959846      7147194065    0.0252           98.01     93.84     46.36
                                   Control3   43885330     6626684830   43482318      6468284270    0.0247           98.2      94.31     46.21
                                   YFY1       45593078     6884554778   45098134      6702012579    0.0255           97.84     93.58     47.7
                                   YFY2       61711348     9318413548   61018598      9065874144    0.0258           97.75     93.36     47.69
                                   YFY3       46318156     6994041556   45650264      6781600407    0.0272           97.18     92.03     47.56
                                   Average    48844588     7375532788   48301943      7183988170    0.0257           97.79     93.39     46.96

                                  Table 1.  Sequencing statistics for control and YFY.

                                  exceeding 10%, reads of low-quality sequences, and duplicates. A total of 48,301,943 clean reads were obtained
                                  for transcriptome assembly. Q20 is the percentage of bases number which is higher than 20 in the total bases
                                  number, and its ratio is 97.79%. Q30 is the percentage of bases number which is higher than 30 in the total bases
                                  number, and its ratio is 93.39%. Both Q20 and Q30 were higher than 90%. The GC content is the percentage of G
                                  and C bases out of the total number of bases; the GC content was approximately 50%. These results demonstrate
                                  that the sequencing level meets the quality needs.
                                      Supplementary Fig. S1a shows a correlation heatmap depicting the correlations between the three replicate
                                  samples based on the normalized expression results. The correlation coefficients between control samples were
                                  96.3% (control 1 and control 2), 96.5% (control 1 and control 3), and 96.9% (control 2 and control 3). For the
                                  YFY samples, the correlation coefficients were 97.1% (YFY1 and YFY2), 97.0% (YFY1 and YFY3), and 97.5%
                                  (YFY3 and YFY2). The correlations indicate high sample repeatability. However, low correlation coefficients were
                                  obtained between the control and YFY, indicating that yellowing had a large effect on the samples. Principal
                                  component analysis (PCA) was used to explore the dataset and reveal hidden data patterns. After dimension
                                  reduction analysis, relative coordinate points were observed in the principal component plane. The distance
                                  between sample points represents the degree of similarity between the samples, with a shorter distance cor-
                                  responding to greater similarity. In Supplementary Fig. S1b, the points of YFY samples are clustered together,
                                  indicating that YFY had the same characteristics. In contrast, the points of the control and YFY are scattered
                                  with respect to each other in Supplementary Fig. S1b with large separation distances, indicating that the control
                                  samples (control 1, control 2, and control 3) were significantly different from the YFY samples (YFY1, YFY2,
                                  and YFY3). More importantly, the process of yellowing greatly changed the characteristics of fresh-cut yam.

                                  Protein quality control. The high-resolution mass spectrometry results were statistically and qualitatively
                                  analyzed to reflect the quality of the detection results and data. A total of 866,811 spectra were produced from
                                  the iTRAQ experiments. By analyzing these spectra, we identified 175,705 known spectra, 45,580 peptides,
                                  23,092 proteins, and 8459 protein groups. The spectrum utilization (i.e., the percentage of identified spectra out
                                  of the total spectra) was approximately 20% (Supplementary Fig. S2a), demonstrating that the chosen database
                                  was appropriate. The distribution of peptide length is shown in Supplementary Fig. S2b. Most peptides con-
                                  tained 5–20 amino acids, indicating that the enzymes had been sufficiently hydrolyzed. Supplementary Fig. S2c
                                  shows the distribution of protein mass. Proteins with masses of 1–21 kDa were the greatest in number (2251)
                                  followed by proteins with masses of 21–41 and 41–61 kDa. Peptide matching errors were within ± 20, and most
                                  of the errors were close to 0 (Supplementary Fig. S2d).
                                      The results of the protein repetitive analysis are shown in Supplementary Fig. S2e,f. The coefficient of variation
                                  (CV) values for the control and YFY groups were both less than 0.1. The proportion of variation level between
                                  10 and 20% accounted for the major part, demonstrating the high repetition in each group. The PCA results are
                                  shown in Supplementary Fig. S2g. Based on the score plot, the YFY samples were considerably different from the
                                  control samples; the YFY samples plotted on the negative side of the X axis, while the control samples plotted on
                                  the positive side. The results indicate that the YFY samples were quite different from the control samples, which
                                  can be attributed to the important effects of yellowing.

                                  Analysis of DEGs and DEPs. The software RNA-Seq by Expectation–Maximization (RESM) was used to
                                  analyze the expression levels of genes and transcripts using transcripts per million as a quantitative index. The
                                  number of transcripts was taken as the unit of calculation instead of the number of spliced segments. Factors
                                  such as the transcript length and the number of genes expressed in samples were considered comprehensively. A
                                  total of 21,906 transcripts were expressed in the control and YFY samples (Fig. 2a). DESeq2, a differential expres-
                                  sion algorithm, was used for functional analysis to dig DEGs in different transcriptome groups. To generate
                                  resource of DEGs associated with the yellowing of fresh-cut yam, three independent biological replicates were
                                  produced for the transcriptome analysis of each group to determine the changes in gene expression for control
                                  and YFY. Transcripts found by DESeq2 with adjusted P values less than 0.05 were categorized as differentially
                                  expressed. Volcano plots were drawn to express the abundances and distributions of DEGs and DEPs. As shown
                                  in Fig. 2b, the distribution of DEGs and DEPs was in screening threshold dimensions. The abscissa was the
                                  multiple change value of DEGs/DEPs between two samples, which was obtained by dividing the expressions of
                                  the YFY and control samples. The ordinate was the P value of the DEGs/DEPs. A higher P value corresponds
                                  to a more significant differential expression. The abscissa and ordinate values are presented logarithmically in

Scientific Reports |   (2021) 11:7755 |                   https://doi.org/10.1038/s41598-021-87423-4                                                           3

                                                                                                                                                          Vol.:(0123456789)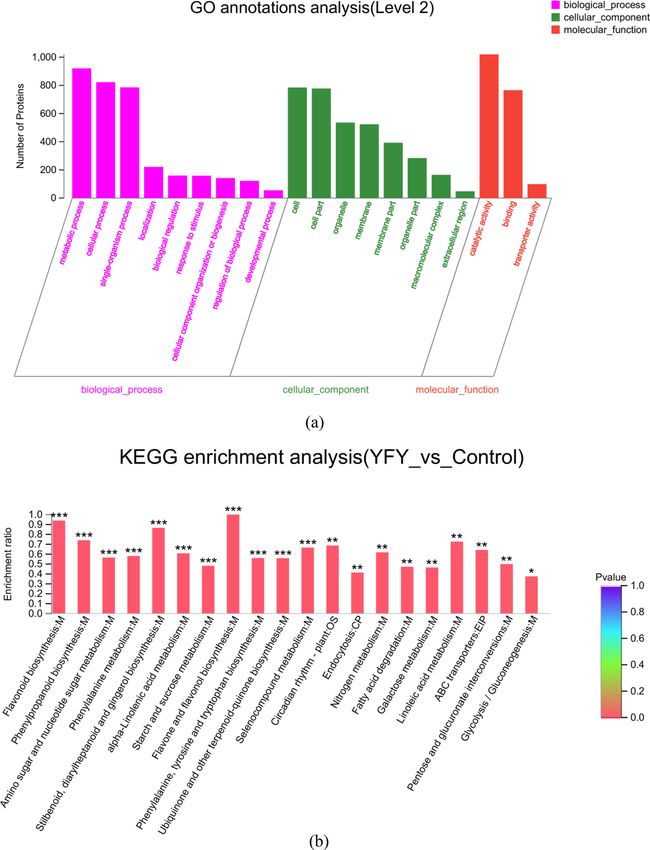
www.nature.com/scientificreports/

                                            Figure 2.  (a) Venn diagram in which the circles of different colors represent the number of UniGene/
                                            transcripts expressed in a group of samples. The areas of circle overlap represent the numbers of UniGene/
                                            transcripts shared by the groups. (b) Volcano plots of gene expression level and expressed protein abundance
                                            distribution. The green points represent downregulated genes/proteins, the red points represent upregulated
                                            genes/proteins, and the gray points represent non-regulated genes. (c) Numbers of DEGs and DEPs. The red
                                            bars denote upregulated genes/proteins, while the green bars show downregulated genes/proteins.

                                            Fig. 2b. Each point in Fig. 2b represents a specific gene/protein; the red points represent significantly upregulated
                                            genes/proteins, the green points represent significantly downregulated genes/proteins, and gray points represent
                                            non-significantly different genes/proteins. After mapping all the genes, we could conclude that the green points

          Scientific Reports |   (2021) 11:7755 |                https://doi.org/10.1038/s41598-021-87423-4                                                    4

Vol:.(1234567890)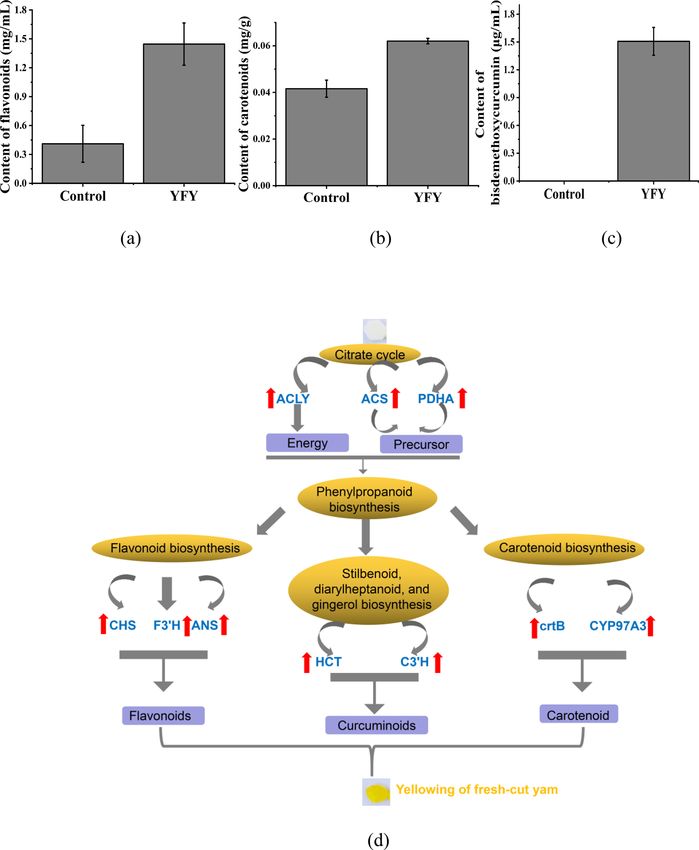
www.nature.com/scientificreports/
represent downregulated expressions, while the red points are genes/proteins with upregulated expressions. Fig-
ure 2c shows the numbers of significantly up/downregulated genes and proteins. In the comparison of YFY vs
the control, there were 6894 upregulated genes and 6800 downregulated genes. Among which, the expression
of citrate synthase (TRINITY_DN6100_c0_g1) in YFY was up-regulated 45.3 times, phenylalanine ammonia
lyase (TRINITY_DN24846_c0_g1) and chalcone synthase (TRINITY_DN15220_c2_g1) in YFY was up-reg-
ulated 67.4 and 37 times compared to control, which were critical regulators of the tricarboxylic acid cycle,
phenylpropanoid biosynthesis pathway and flavonoids biosynthesis pathway. Meanwhile, the yellowing resulted
in the increased expression of 1277 proteins and the decreased expression of 677 proteins. Such as, the protein
expression of 5-O-(4-coumaroyl)-d-quinate 3′-monooxygenase (TRINITY_DN19359_c4_g1_i3_m.150690) in
YFY was up-regulated 41.8 times. The expression of cinnamate 4-hydroxylase (TRINITY_DN20568_c1_g1_
i13_m.285108) and 15-Cis-phytoene desaturase (TRINITY_DN18297_c0_g1_i10_m.312058) in YFY was up-
regulated 19.7 and 31.2 times compared to control, which were critical regulators of the stilbenoid, diarylhep-
tanoid, and gingerol biosynthesis pathway, phenylpropanoid biosynthesis pathway and carotenoid biosynthesis.
Thus, we can conclude that the expression of both genes and proteins are changed during storage, promoting
the formation of yellow pigments in fresh-cut yam.
GO and KEGG pathway enrichment analysis of DEGs. We used Web Gene Ontology (WEGO) soft-
ware for Gene Ontology (GO) functional classification to understand the distribution of genes at a macro level
(Fig. 3a). According to the biological process, the DEGs that mapped to “cellular process” and “metabolic pro-
cess” constituted a high proportion in yellowing fresh-cut yam, revealing high metabolic activity. This might
reflect the biosynthesis and accumulation of bioactive secondary metabolites in yellowing fresh-cut yam. Two
terms of “membrane” and “membrane part” occupied the highest part in cellular component category. Most of
the DEGs were annotated as “binding” and “catalytic activity,” suggesting high catalytic activity in yellowing
fresh-cut yam. Additionally, many genes were found to be related to “single-organism process” in the biological
process area; “cell” and “cell part” in the cellular component; and “transporter activity” in the area of molecular
function. In contrast, few genes were classified into the “cellular component organization or biogenesis,” “orga-
nelle part,” and “structural molecule activity” groups (Fig. 3a). Pathway enrichment analyses of the DEGs based
on the Kyoto Encyclopedia of Genes and Genomes (KEGG) database were performed to study the gene interac-
tions with each other during biological functions. Figure 3b shows a scatter plot for the top 20 KEGG enrichment
results. Most genes were clustered in the phenylpropanoid biosynthesis and plant hormone signal transduction
categories. The expressions of DEGs related to flavonoid biosynthesis and amino sugar and nucleotide sugar
metabolism were higher in the YFY group compared to in the control group. Supplementary Table S1 shows
the annotation pathways of DEGs in YFY vs. control. Of the total 63,357 annotated genes, 13,694 DEGs were
produced, which enriched in 127 pathways, while 25 pathways were significant enriched. The main pathways
(e.g., phenylpropanoid biosynthesis; flavonoid biosynthesis; and other glycan degradation pathways) affiliated
with metabolism in the first category played an important role in the comparison of the YFY and control groups.
These results demonstrate that different genes were produced and expressed, inducing the formation of yellow
pigments in YFY.
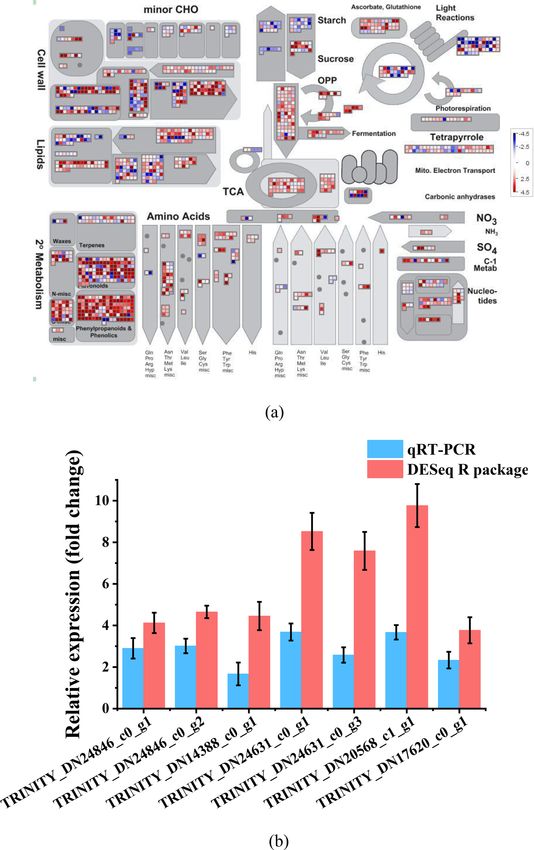
Overview of metabolism using MapMan. Figure 4a shows a visual overview of metabolism obtained
using MapMan. This figure shows the different functional categories that passed the cutoff (q value < 0.05 q and
greater than two-fold change) for differential expression. In Fig. 4a, red represents upregulated genes, while blue
represents downregulated genes. Compared to the control samples, the YFY samples exhibited higher expres-
sions of genes related to ascorbate and glutathione metabolism, OPP, TCA and amino acids but lower expres-
sions of genes related to light reaction and starch metabolism. The secondary metabolism contained numerous
genes related to the synthesis of flavonoids, phenylpropanoids, and phenolics. The YFY group exhibited higher
expressions of most genes related to flavonoids, phenylpropanoids, and phenolics. Genes in the cell wall and
lipids showed different changes; some were upregulated, while some were downregulated. The results show that
the yellowing of fresh-cut yam led to the accumulation of flavonoids, phenylpropanoids, and phenolics along
with the degradation of starch and tetrapyrrole. The transformation of these substances may be an important
reason for the yellowing.
RT‑PCR analysis. To further verify the results from the RNA-Seq work, seven transcripts of each sample
were selected for quantitative RT-PCR analysis. The IDs of these genes are as follows: TRINITY_DN24846_
c0_g2 (phenylalanine ammonia lyase), TRINITY_DN14388_c0_g1 (phenylalanine ammonia-lyase-like), TRIN-
ITY_DN24631_c0_g1 (4-coumarate-CoA ligase-like 1), TRINITY_DN24631_c0_g3 (4-hydroxycinnamoyl-
CoA ligase 3), TRINITY_DN20568_c1_g1 (cytochrome P450 CYP73A100), TRINITY_DN17620_c0_g1
(trans-cinnamate 4-monooxygenase), and TRINITY_DN24846_c0_g1 (PAL5). These genes were found to be
differentially expressed in the transcriptome of yellowing fresh-cut yam. The results of the RT-PCR analysis are
shown in Fig. 4b. The trends in the expressions of all the unigenes from quantitative RT-PCR were consistent
with the RNA sequencing analysis (Fig. 4b). These results demonstrate that the transcriptomic profiling data
accurately reflected the response of fresh-cut yam to yellowing.
GO and KEGG pathway enrichment analysis of DEPs. According to certain criteria (e.g., function,
expression level, and expression differences), the protein list was obtained and analyzed. Some proteins related
to the yellowing of fresh-cut yam were extracted, and their functions and expressions were studied.
GO enrichment was used to analyze the key cellular process between the control and YFY samples. The dis-
tribution of proteins and their functional classifications are shown in Fig. 5a. Under the category of biological
Scientific Reports | (2021) 11:7755 | https://doi.org/10.1038/s41598-021-87423-4 5
Vol.:(0123456789)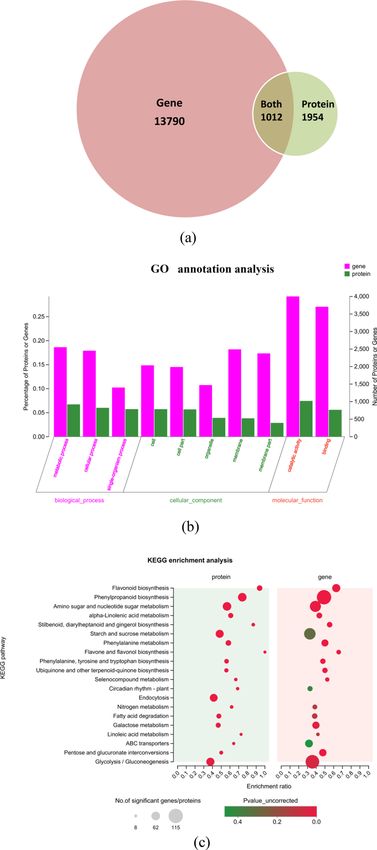
www.nature.com/scientificreports/

                                            Figure 3.  (a) GO terms enrichment of differentially expressed transcripts. The ordinate represents the
                                            secondary classification of GO, while the abscissa represents the number of genes included in the secondary
                                            classification. The color bars on the right represent the three branches of GO (blue, biological process; green,
                                            cellular component; dark pink: molecular function). (b) Statistics for the top 20 enriched pathway terms in the
                                            comparison of YFY vs control. The vertical axis represents the pathway name, and the abscissa represents the
                                            rich factor (i.e., the ratio of DEGs annotated in this pathway term to all gene numbers annotated in this pathway
                                            term; a greater rich factor indicates greater intensiveness). The size of the point indicates the number of genes in
                                            the pathway, while the color of the point corresponds to the Q value range.

          Scientific Reports |   (2021) 11:7755 |                https://doi.org/10.1038/s41598-021-87423-4                                                    6

Vol:.(1234567890)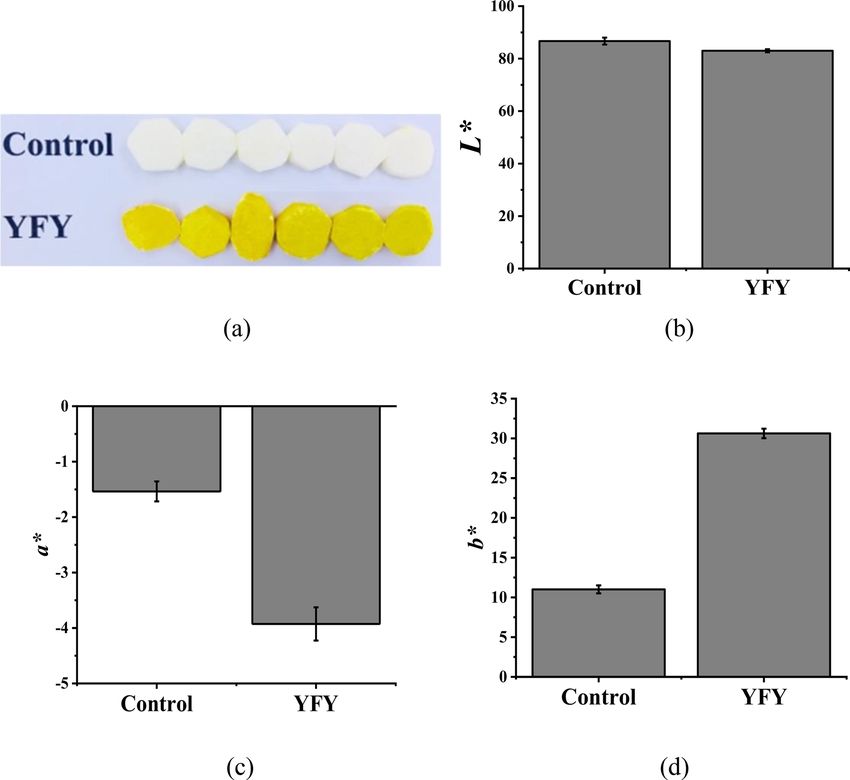
www.nature.com/scientificreports/

                                  Figure 4.  (a) Overview of DEGs involved in various metabolic processes under different treatments. Red
                                  represents upregulated genes, while blue represents downregulated genes. (b) Quantitative RT-PCR validation of
                                  gene expression.

                                  process, the majority of the DEPs were classified as “metabolic process” and “cellular process,” response to
                                  stimulus and regulation of biological process. The “cell,” “cell part,” and “organelle” categories were predominant

Scientific Reports |   (2021) 11:7755 |                https://doi.org/10.1038/s41598-021-87423-4                                                  7

                                                                                                                                              Vol.:(0123456789)
www.nature.com/scientificreports/
Figure 5. (a) GO terms enrichment of differentially expressed proteins. Each column represents a secondary
classification of GO; a taller bar corresponds to more protein in the secondary classification. The abscissa
represents the secondary GO classification term, and the ordinate represents the number of proteins annotated
to each secondary classification. (b) KEGG enrichment analysis results. The abscissa represents the pathway
name, and the ordinate represents the enrichment rate (i.e., ratio of the number of proteins enriched in the
pathway to the number of proteins annotated in the pathway; a larger ratio corresponds to a greater degree of
enrichment). The color gradient within the column indicates the significance of enrichment, with a darker color
indicating greater enrichment in the KEGG term. ***Indicates P or FDR < 0.001; **indicates P or FDR < 0.01;
and *indicates P or FDR < 0.05.
within the cellular component category, and most genes were annotated in the “catalytic activity” and “binding
categories. The comparative transcriptomic and proteomic data show that several cellular processes, including
“metabolic process,” “cellular process,” and “catalytic activity” were affected by changes in key regulators at both
the transcript and protein levels in our fresh-cut yam samples. Compared to the control samples (Fig. 5b), the
YFY samples were enriched in most DEPs related to flavonoid biosynthesis; flavone and flavonol biosynthesis;
phenylalanine biosynthesis; and stilbenoid, diarylheptanoid, and gingerol biosynthesis. These results reveal that
different proteins were produced and expressed, and the enrichment in proteins involved in different pathways
was basically consistent with the transcriptome results.
Scientific Reports | (2021) 11:7755 | https://doi.org/10.1038/s41598-021-87423-4 8
Vol:.(1234567890)www.nature.com/scientificreports/
Transcriptome and proteome correlation analysis. The Venn diagram in Fig. 6a presents the correla-
tions in mRNA and protein differences among samples. The expression patterns of related molecules were stud-
ied at the transcription and protein levels. The analysis identified 13,790 DEGs and 1954 DEPs. Among which,
1012 genes were differentially expressed, and their corresponding translated proteins were also differentially
expressed. Figure 6b shows the results of the GO correlation analysis, indicating that correlated proteins and
genes were annotated to three biological processes: “metabolic process,” “cellular process,” and “single-organism
process.” The correlated proteins and genes that mapped to “cell,” “cell part,” “organelle,” “membrane,” and “mem-
brane part” constituted a high proportion of proteins and genes in the cellular component category. Furthermore,
most of these correlated proteins and genes were annotated to the “binding” and “catalytic activity” molecular
function categories. Indeed, as shown by the integrated comparative transcriptomic and proteomic data, several
cellular processes were affected by changes in key regulators at both the transcript and protein levels in fresh-cut
yam during yellowing, resulting in high metabolic activity, catalytic activity, and the accumulation of bioactive
secondary metabolites in yellowing fresh-cut yam. KEGG enrichment of correlation data are shown in Fig. 6c.
The correlated proteins and genes were both significantly annotated to flavonoid biosynthesis; phenylpropanoid
biosynthesis; alpha-Linolenic acid metabolism; stilbenoid, diarylheptanoid, and gingerol biosynthesis; fatty acid
degradation; ubiquinone and other terpenoid-quinone biosynthesis; phenylalanine metabolism; flavone and fla-
vonol biosynthesis; and tyrosine metabolism. The P values of all these pathways were less than 0.1. The changes
in these pathways might be critical factors in the yellowing of fresh-cut yam.
Discussion
Vegetable color is generally accepted as one of the most important quality parameters and plays a decisive role
in evaluating the quality of the vegetable product at the point of sale. In the present study, storage at 25 °C for
24 h decreased the L* and a* values but increased the b* value of fresh-cut yam, indicating yellowing (Fig. 1).
According to our preliminary results, we extracted the yellow pigment in yellowing fresh-cut yam and identified
its components. The yellow pigment was found to be composed primarily of bisdemethoxycurcumin, although
other unknown substances were also present. To understand the yellowing mechanism of fresh-cut yam after
storage at a molecular level, we compared the transcriptome and proteomic profiles of YFY and control samples.
The important aspects of the physiological process related to yellowing are discussed below.
The tricarboxylic acid cycle is the basic metabolic pathway shared by most organisms. The tricarboxylic acid
cycle is the central hub of metabolism, participating in both catabolism and anabolism15. The tricarboxylic acid
cycle also provides precursors for biosynthetic p athways16 such as the synthesis of acetyl-CoA, which has been
implicated in the synthesis of secondary metabolites including flavonoids (Fig. 7a), stilbenoids, and isoprenoids.
Acetyl-CoA is synthesized by two enzyme systems, the pyruvate dehydrogenase complex and acetyl-CoA syn-
thetase systems17. In this study, pyruvate dehydrogenase complex (TRINITY_DN13442_c0_g1) and acetyl-CoA
synthetase (TRINITY_DN19742_c0_g1) were respectively upregulated by 2.8 and 10.5 times in YFY compared
to the control; the expressions of proteins TRINITY_DN15840_c2_g1_i7_m.43526 and TRINITY_DN13441_
c0_g1_i1_m.148133 were also upregulated, resulting in the enhancement of acetyl-CoA metabolism. In addition,
acetyl-CoA was carboxylated by acetyl-CoA carboxylase to form malonyl-CoA, the substrate for the biosynthesis
of bisdemethoxycurcumin. The expression of acetyl-CoA carboxylase (TRINITY_DN9689_c0_g1) in YFY was
6.8 times higher than in the control. Therefore, the expressions of crucial genes related to acetyl-CoA biosyn-
thesis and accumulation were significantly enhanced, providing precursors for the formation of yellow pigments
(Fig. 7a–c). Furthermore, the tricarboxylic acid cycle can also meet most requirements for cell energy via the
complete oxidation of acetyl-CoA. The activity of citrate synthase is fundamental to combine acetyl-CoA with
oxaloacetate to form citrate15. In this study, the expressions of genes and proteins involved in citrate synthase
(TRINITY_DN6100_c0_g1 and TRINITY_DN26760_c1_g2_i5_m.177726) were both significantly higher in
YFY samples than in control samples. Therefore, the crucial genes/proteins involved in the oxidation of acetyl-
CoA were upregulated, providing energy for the formation of yellow pigments.
The branches of the phenylpropanoid biosynthesis pathway give rise to thousands of compounds18. As the
beginning of metabolic pathway of each branch (Fig. 7d), the phenylpropanoid biosynthesis pathway can provide
precursors for the synthesis of yellow pigments. P-coumaroyl-CoA and cinnamoyl-CoA are the critical precur-
sors of flavonoid biosynthesis and stilbenoid, diarylheptanoid, and gingerol biosynthesis19,20. The initial three
steps in the pathway are catalyzed by phenylalanine ammonia lyase, cinnamate 4-hydroxylase, and 4-coumaroyl
CoA-ligase, which are mandatory and provide the basis for all subsequent branches and resulting m etabolites21.
Phenylalanine ammonia lyase is one of the most well studied enzymes in the biosynthetic pathways of secondary
metabolism. Phenylalanine ammonia lyase catalyzes the first step in the general phenylpropanoid pathway along
with the deamination of phenylalanine to yield trans-cinnamic acid. Subsequently, cinnamate 4-hydroxylase and
4-coumarate CoA ligase catalyze the conversion of cinnamic acid to p-coumaroyl-CoA and 4-coumaroyl-CoA,
respectively, which serve as intermediates and precursors for different phenylpropanoid compounds including
flavonoids22,23 and curcuminoids. In this study, the expression levels of phenylalanine ammonia lyase (TRINITY_
DN24846_c0_g1), cinnamate 4-hydroxylase (TRINITY_DN20568_c1_g1), and 4-coumaroyl CoA-ligase (TRIN-
ITY_DN19105_c0_g1) were significantly higher in YFY compared to the control. The DEGs can be correlated to
the changes in the protein levels of phenylalanine ammonia lyase (TRINITY_DN27047_c0_g2_i5_m.279346),
cinnamate 4-hydroxylase (TRINITY_DN20568_c1_g1_i13_m.285108), and 4-coumaroyl CoA-ligase (TRIN-
ITY_DN27047_c0_g2_i5_m.279346). This result indicates that phenylpropanoid biosynthesis was enhanced
during storage, consistent with the high level of yellow pigments (Fig. 7a–c). The changes in the expressions
of genes and proteins involved in phenylpropanoid biosynthesis were proportional to the degree of yellowing,
further verifying that phenylpropanoid compounds play important roles in the yellowing of fresh-cut yam.
Scientific Reports | (2021) 11:7755 | https://doi.org/10.1038/s41598-021-87423-4 9
Vol.:(0123456789)www.nature.com/scientificreports/
Figure 6. (a) Results of the correlation analysis of DEGs and DEPs. (b) Results of GO correlation analysis.
The bars represent the secondary classifications of GO; bar height corresponds to the number of proteins or
genes in the secondary classification; The abscissa represents the GO secondary classification term. The left
ordinate represents the percentage of proteins or genes included in the secondary classification with respect to
the total protein or gene number. The right ordinate represents the number of proteins or genes annotated to
the secondary classification. (c) KEGG enrichment analysis results. The ordinate represents the pathway name,
and the abscissa represents the enrichment rate (i.e., the ratio of the number of genes/proteins enriched in
the pathway to the number of genes/proteins annotated in the pathway; a larger ratio corresponds to a greater
degree of enrichment). Each bubble represents a path. The size of the bubble is directly proportional to the
number of proteins or genes enriched in this pathway. The colors of the bubbles represent the p-values.
Scientific Reports | (2021) 11:7755 | https://doi.org/10.1038/s41598-021-87423-4 10
Vol:.(1234567890)www.nature.com/scientificreports/
Figure 7. (a) Content of total flavonoids. (b) Content of total carotenoids. (c) Content of
bisdemethoxycurcumin. (d) Hypothetical mechanism for the yellowing of fresh-cut yam.
Flavonoids are a series of natural compounds that are widely distributed in plants and play important roles
in diverse biological processes. For example, flavonoids impart various colors as they are major pigmentation
factors24. In this study, the level of total flavonoids was analyzed in control and YFY samples (Fig. 7a). The YFY
samples had a higher flavonoid content (0.22 mg/mL) than the control (0.19 mg/mL), indicating that total flavo-
noids increased during yellowing. Chalcone synthase, chalcone isomerase, and flavonoid 3′,5′-hydroxylase, are
key enzymes in flavonoid biosynthesis and control the flux of flavonoids. In YFY, chalcone synthase (TRINITY_
DN15220_c2_g1), chalcone isomerase (TRINITY_DN21557_c0_g1), and flavonoid 3′,5′-hydroxylase (TRINITY_
DN15219_c0_g1) were respectively upregulated by 37, 25, and 16 times compared to the control, in agreement
with the observed changes in protein levels. The expressions of chalcone synthase (TRINITY_DN15220_c2_g2_
i4_m.227203) and chalcone isomerase (TRINITY_DN21557_c0_g1_i4_m.293684) in YFY were also upregulated
by 4 and 7 times compared to the control, respectively. Flavonoid 3′-hydroxylase is also considered to be critical
and rate-limiting enzyme. In this study, flavonoid 3′-hydroxylase (TRINITY_DN24846_c0_g1) was upregulated
Scientific Reports | (2021) 11:7755 | https://doi.org/10.1038/s41598-021-87423-4 11
Vol.:(0123456789)www.nature.com/scientificreports/
by 28 times in YFY compared to the control. The upregulated expressions of chalcone synthase, chalcone isomer-
ase, flavonoid 3′,5′-hydroxylase, and flavonoid 3′-hydroxylase correspond directly to the increased content of
total flavonoids in YFY compared to the control. Flavonoids such as eriodictyol and naringenin have been shown
to lead to the yellowing of fresh-cut Chinese water chestnut25,26. However, the specific flavonoid substances
responsible for the yellowing of fresh-cut yam merit further study.
The characteristic yellowish color of turmeric is attributed to the presence of polyphenolic pigment curcumi-
noids. The stilbenoid, diarylheptanoid, and gingerol biosynthesis pathway is responsible for the biosynthesis of
curcumin, demethoxycurcumin, and bisdemethoxycurcumin, which has an intense yellow color. In the present
study, bisdemethoxycurcumin was not detected in the control, while YFY contained 1.507 μg/mL bisdemeth-
oxycurcumin (Fig. 7c), and its content was proportional to the degree of yellowing. This further verifies that
bisdemethoxycurcumin plays an important role in the yellowing of fresh-cut yam. DEGs/DEPs were significantly
enriched in the stilbenoid, diarylheptanoid, and gingerol biosynthesis pathway. Feruloyl-CoA, an intermedi-
ate of curcuminoids, was formed under the catalysis of shikimate O-hydroxycinnamoyltransferase, 5-O-(4-
coumaroyl)-d-quinate, 3′-monooxygenase, and caffeoyl-CoA O-methyltransferase. In this study, the relative
expressions of shikimate O-hydroxycinnamoyltransferase (TRINITY_DN22259_c0_g1, TRINITY_DN12166_
c0_g3_i1_m.298158) and 5-O-(4-coumaroyl)-d-quinate 3′-monooxygenase (TRINITY_DN19359_c4_g1,
TRINITY_DN19359_c4_g1_i3_m.150690) were upregulated in YFY. Moreover, the expression of caffeoyl-CoA
O-methyltransferase (TRINITY_DN24830_c0_g2, TRINITY_DN21539_c3_g1_i3_m.294149) was approximately
three and seven times higher in YFY than in the control. Curcumin synthase (TRINITY_DN8031_c0_g1) cata-
lyzes formation of bisdemethoxycurcumin from p-coumaroyl-CoA, which was 1.8 times higher in YFY than in
control. The synthesis of bisdemethoxycurcumin was enhanced in YFY compared to the control, indicating that
these compounds were partly responsible for the yellowing of fresh-cut yam; this conclusion is supported by our
recent results indicating that the yellow pigment was composed primarily of bisdemethoxycurcumin (73.7%)6.
Fruit color is related to the accumulation of carotenoids and other pigments, which play a major role in
the yellow and orange pigmentation of maize k ernel27. Due to the strong effect of carotenoids on fruit color,
changes in the content of total carotenoids were analyzed in this study (Fig. 7b). The carotenoid content in the
control (0.04 mg/g) was lower than that in YFY (0.06 mg/g), indicating that the content of total carotenoids
increased during the yellowing of fresh-cut yam. Phytoene synthase, the first catalytic enzyme in carotenoid
synthesis, was previously reported to control the synthesis of carotenoids in chromoplasts and determine the
colors of mature pepper fruits28. In the present study, the expressions of phytoene synthase gene and protein
(TRINITY_DN6245_c0_g1 and TRINITY_DN19316_c0_g1_i2_m.256713, respectively) eight and three times
higher in YFY compared to the control, respectively, resulting in a significantly higher content of phytoene in
YFY compared to control. Phytoene acts as a precursor to the formation of lutein, which is bright yellow. Lutein
could be formed via the catalysis of α-carotene with beta-ring hydroxylase29. In this study, the expression of
beta-ring hydroxylase (TRINITY_DN26312_c0_g1) in YFY was 12 times higher than in the control. Lycopene
is the critical intermediate in the formation of lutein. 15-Cis-phytoene desaturase (TRINITY_DN18297_c0_g1,
TRINITY_DN18297_c0_g1_i10_m.312058) and prolycopene isomerase (TRINITY_DN27028_c0_g1), which
were upregulated in YFY compared to the control, catalyzed the formation of lycopene. These results suggest
that the carotenoid biosynthesis pathway was enhanced in YFY, which might be critical for the accumulation
of yellow substances.
According to the analysis above, in addition to bisdemethoxycurcumin and flavonoids, carotenoids might also
contribute to the yellowing of fresh-cut yam. Based on the energy and precursors provided by the tricarboxylic
acid cycle and phenylpropanoid biosynthesis, the yellow pigments were formed by the flavonoid biosynthesis,
stilbenoid, diarylheptanoid, and gingerol biosynthesis, and carotenoid biosynthesis pathways (Fig. 7d).
Materials and methods
Samples. Fresh yam (Dioscorea oppositifolia L.), “Tiegun,” was purchased from Henan province, China.
Uniformly sized yams without physical damage or disease were selected for experiment. The fresh yams were
washed, peeled using a sharp, stainless-steel peeler, and chopped into small slices with thicknesses of 5 mm. The
slices were then disinfected using 100 mL of NaClO solution (50 mg/L, pH 6.5) for 2 min. Gauze was used to
wipe the water off the surface of each yam slice. The fresh-cut yam slices were packed in polyethylene plastic bags
(70 ± 0.5 g) and preserved at 25 °C at 97% humidity for 24 h. The yams stored for 0 h were used as the control.
After storage, the yam turned yellow (YFY). All materials were stored at − 80 °C until further analysis or used
immediately.
Color analysis. The external color of fresh-cut yam was measured using a chroma meter (Konica Minolta
R-400 colorimeter; Minolta Co., Osaka, Japan), and measurements were taken on opposite sides of each slice.
L* describes lightness (L* = 0 indicates black, L* = 100 indicates white), a* describes red–green intensity (a*
> 0 indicates red, a* < 0 indicates green), and b*describes blue–yellow intensity (b* > 0 indicates yellow, b* < 0
indicates blue). The instrument was calibrated by a standard white and black board, in accordance with CIE
specifications. 3 points were taken to be measured in each side of yam, and the mean for three pieces of fresh-cut
yam in each replication.
Analysis of total flavonoids in fresh‑cut yam. The content of total flavonoids was investigated using
a commercial kit (Solarbio, Beijing, China). Frozen tissue (0.5 g) was homogenized using a pestle and mortar
in liquid nitrogen with 3 mL of extracting solution. The mixture was transferred to 10 mL centrifuge tube and
extracted for 30 min. After centrifuging at 12,000 rpm for 10 min at 25 °C, the supernatant was collected as a
source of flavonoids. Absorbance readings at 470 nm (UV-1800, Shimadzu, Japan) were taken and rutin was
Scientific Reports | (2021) 11:7755 | https://doi.org/10.1038/s41598-021-87423-4 12
Vol:.(1234567890)www.nature.com/scientificreports/
used for a standard curve. The content of total flavonoids in the supernatant was measured accurately using a
detection kit for flavonoids in plants (Solarbio, Beijing, China) according to the manufacturer’s instructions.
Three biological repeats were applied in both YFY and Control.
Analysis of total carotenoids in fresh‑cut yam. The content of total carotenoids was investigated using
a commercial kit (Solarbio, Beijing, China). Frozen tissue (0.5 g) was homogenized using a pestle and mortar in
liquid nitrogen with 1 mL of distilled water and 20 mg reagent 1 under dark condition, and then transferred to
a 10 mL centrifuge tube. The mixture was extracted for 3 h in the absence of light. During the process of extrac-
tion, the centrifuge tube was shaken twice to fully extract. After the tissue residue turning nearly white, which
was in the bottom of tube, the mixture was centrifuged at 4000 rpm for 5 min. The supernatant was collected as
a source of carotenoids. Absorbance readings at 440 nm (UV-1800, Shimadzu, Japan) were taken. The content
of total carotenoids in the supernatant was measured accurately with a detection kit for carotenoids in plants
(Solarbio, Beijing, China) according to the manufacturer’s instructions. Three biological repeats were carried out
in YFY and Control.
Analysis of bisdemethoxycurcumin in fresh‑cut yam. The content of bisdemethoxycurcumin was
measured and quantified according to Zhao et al.6. Three biological repeats were carried out in both YFY and
Control.
RNA extraction. In the transcriptome analysis, three biological replicates of each treatment were used.
Total RNA was extracted from the yam tissue using TRIzol Reagent according the manufacturer’s instructions
(Invitrogen, Carlsbard, CA, USA), and genomic DNA was removed using DNase I (TaKara, Japan). The integrity
and purity of the total RNA was then determined using a bioanalyzer (Agilent 2100 Bioanalyzer, Agilent Tech-
nologies, Inc., Santa Clara CA, USA) and quantified using an ND-2000 spectrophotometer (NanoDrop Thermo
Scientific, Wilmington, DE, USA). Only high-quality RNA samples (OD260/280 = 1.8–2.2, OD260/230 ≥ 2.0,
RIN ≥ 8.0, 28S:18S ≥ 1.0, > 2 μg) were used to construct the sequencing library.
Library preparation and sequencing. Library preparation and sequencing were begun as described
previously30.
De novo assembly and annotation. The raw paired-end reads were trimmed and controlled for quality
using the default parameters of SeqPrep (https://github.com/jstjohn/SeqPrep) and Sickle (https://github.com/
najoshi/sickle). The clean data were then used for de novo assembly with Trinity (http://trinityrnaseq.sourc
eforge.net/)31. To retrieve the function annotations of the assembled transcripts, the transcripts were searched
against the NCBI protein nonredundant (NR), string, and KEGG databases using BLASTX to identify the pro-
teins with the highest sequence similarity to the given transcripts; typical cut-off E-values of less than 1.0 × 10⁻⁵
were used. The BLAST2GO (http://www.blast2go.com/b2ghome)32 program was used to obtain the GO anno-
tations of unique assembled transcripts for describing biological processes, molecular functions, and cellular
components. Metabolic pathway analysis was performed using the Kyoto Encyclopedia of Genes and Genomes
(KEGG, http://www.genome.jp/kegg/).
Differential expression analysis and functional enrichment. To identify differentially expressed
genes (DEGs) between two different samples, the expression level of each transcript was calculated according
to the fragments per kilobase of exon per million mapped reads (FRKM) method. RSEM (http://deweylab.biost
at.wisc.edu/rsem/)33 was used to quantify gene and isoform abundances. Differential expression analysis was
carried out in the R statistical package using EdgeR (Empirical analysis of Digital Gene Expression in R, http://
www.bioconductor.org/packages/2.12.bioc/html/edgeR.html). GO and KEGG functional enrichment analyses
were performed to identify which DEGs were significantly enriched in GO terms and metabolic pathways at
Bonferroni-corrected P-value ≤ 0.05 compared to the whole-transcriptome background. GO functional enrich-
ment and KEGG pathway analysis were carried out using Goatools (https://github.com/tanghaibao/Goatools)
and KOBAS (http://kobas.cbi.pku.edu.cn/home.do), respectively34.
RT‑PCR analysis. To validate the transcriptomic data, seven DEGs were chosen for RT-PCR analysis
according to the method of Zhang et al.35 with slight modifications. Total RNA was extracted with Trizol reagent
(Invitrogen) from control and YFY plant tissues. RNA samples were treated with RNase-free DNase I (TaKaRa,
Tokyo, Japan) to remove genomic DNA. RNA (10 µg) was used for reverse transcription with a PrimeScript RT
reagent kit (Perfect Real Time, TaKaRa) according to the manufacturer’s instructions, and cDNA was used for
RT-PCR analysis with specific primers. Quantitative RT-PCR was performed using an Applied Biosystems 7500
real-time PCR system with Power SYBR green chemistry (TaKaRa). Actin was quantified as an internal control
and the 2 −ΔΔCt method was used to analyze the differential expression36. The mean of three biological replicates,
for which three technical replicates were averaged, was presented. Genes were considered to be differentially
expressed if (1) fold change ≥ 1.5 or ≤ 0.6 and (2) P value from post hoc ANOVA test ≤ 0.05.
Total protein extraction. Five biological replicates of each treatment were used. The fresh-cut yam sam-
ples were resuspended in 1% crosslinked polyvinylpyrrolidone and BPP buffer (100 mM EDTA, 50 mM borax,
50 mM ascorbic acid, 30% sucrose, 100 mM TrisBase, 1% TritonX-100, 5 mM DTT, pH 8.0). Samples were
treated using a high-throughput tissue grinder and vortexed three times for 40 s each time. After the samples
Scientific Reports | (2021) 11:7755 | https://doi.org/10.1038/s41598-021-87423-4 13
Vol.:(0123456789)www.nature.com/scientificreports/
were centrifugated at 12,000×g at 4 °C for 20 min, the protein supernatants were mixed with equal volumes
of Tris-saturated phenol and vortexed for 10 min at 4 °C. After centrifugation at 12,000×g at 4 °C for 20 min,
the phenol phase was added to an equal volume of BPP and vortexed for 10 min at 4 °C. After centrifugation
at 12,000×g at 4 °C for 20 min, the phenol phase was added to a five-fold volume of pre-cooled methanolic
ammonium acetate solution to precipitate protein for 12 h at − 20 °C. After centrifugation at 12,000×g at 4 °C for
20 min, the pellet was rinsed twice with 90% acetone and then dried under vacuum. The acetone-dried powder
was resuspended in protein lysis buffer containing 8 M urea, 1% SDS, and an appropriate amount of protease
inhibitor. The mixture was treated ultrasonically for 20 min, and after centrifugation at 12,000×g at 4 °C for
20 min, the concentration of protein was determined using the bicinchoninic acid (BCA) method with a BCA
Protein Assay Kit (Thermo, MA, USA). Protein quantification was performed according to the kit protocol.
Protein digestion and TMT labeling. Protein was digested with trypsin (Promega, Madison, WI, USA)
and incubated at 37 °C with a mass ratio of 1:50 (enzyme/substrate) overnight. The iTRAQ labeling was per-
formed according to the manufacturer’s illustration (Applied Biosystems, Sciex, Foster City, CA, USA). All
labeled peptides were pooled, desalted, and vacuum-dried37.
High‑pH RPLC separation. The pooled samples were fractionated using an ultraperformance liquid chro-
matography (Acquity, Waters, USA) with an Acquity UPLC BEH C18 Column (1.7 µm, 2 mm × 150 mm; Waters,
USA) to increase the proteomic depth. Briefly, the peptides were first separated via gradient elution (Phase A:
5 mM ammonium hydroxide solution containing 2% acetonitrile, pH 10; Phase B: 5 mM ammonium hydroxide
solution containing 80% acetonitrile, pH 10) over 48 min at a flow rate of 200 μL/min with the following gradi-
ent: 0–5% buffer B for 2 min; 5% buffer B from 2–17 min; 5–30% buffer B from 17–35 min; 30%–36% buffer B
from 35–38 min; 36–42% buffer B from 38–39 min; 42–100% buffer B from 39–40 min; 100–0% buffer B from
40–45 min; and 0% buffer B for 3 min. Thirty fractions were collected from each sample. These fractions were
pooled, resulting in 15 total fractions per sample.
Liquid chromatography tandem mass spectrometry (LC–MS/MS) analysis. The labeled peptides
were analyzed by online nanoflow LC–MS/MS performed on an EASY-nLC system (Thermo, USA) connected
to a Q Exactive quadrupole orbitrap mass spectrometer (Thermo, USA) using a nanoelectrospray ion source.
Briefly, a C18 reversed-phase column (75 μm × 25 cm; Thermo, USA) was equilibrated with solvent A (A: 2%
acetonitrile with 0.1% formic acid) and solvent B (B: 80% ACN with 0.1% formic acid). The peptides were eluted
using the following gradient program: 0–1 min, 0–5% B; 1–63 min, 5–23% B; 63–77 min, 23–29% B; 77–86 min,
29–38% B; 86–88 min, 38–48% B; 88–89 min, 48–100% B; and 89–95 min, 100% B) at a flow rate of 300 nL/min.
The spectrometer was operated in the data-dependent mode to automatically switch between full-scan MS and
MS/MS acquisition. The full-scan survey (m/z 350–1300) was acquired using an Orbitrap with a resolution of
70,000. The dynamic exclusion time was set to 18 s. The 20 most intense MS peaks were sequentially isolated and
fragmented in the octopole collision cell using high-energy collisional dissociation with a resolution of 35,000
in fast-scanning mode.
Protein identification. With ProteomeDiscoverer (Thermo Scientific, Version 2.2), analysing raw data
against transcriptome was conducted. The searching of MS/MS was according to the criteria: Two missed cleav-
ages in the trypsin digesting were allowed, with a mass tolerance of 0.05 Da (10 ppm). Choosing TMT of the
N-terminus and lysine side chains of peptidases and carbamido methylation of cysteine to fix modification. A
false discovery rate (FDR) threshold of less than 1% were used.
Received: 11 December 2020; Accepted: 23 March 2021
References
1. Xue, H. et al. Optimization of the ultrafiltration-assisted extraction of Chinese yam polysaccharide using response surface meth-
odology and its biological activity. Int. J. Biol. Macromol. 121, 1186–1193 (2019).
2. Sukhija, S., Singh, S. & Riar, C. S. Effect of oxidation, cross-linking and dual modification on physicochemical, crystallinity, mor-
phological, pasting and thermal characteristics of elephant foot yam (Amorphophallus paeoniifolius) starch. Food Hydrocolloid.
55, 56–64 (2016).
3. Awolu, O. O. & Olofinlae, S. J. Physico-chemical, functional and pasting properties of native and chemically modified water yam
(Dioscorea alata) starch in the production of starch-based yoghurt. Starch Starke. 68, 719–726 (2016).
4. Ma, L., Zhang, M., Bhandari, B. & Gao, Z. Y. Recent developments in novel shelf life extension technologies of fresh-cut fruits and
vegetables. Trends Food Sci. Technol. 64, 23–38 (2017).
5. Atiim, G. A., Elliott, S. J., Clarke, A. E. & Janes, C. “What the mind does not know, the eyes do not see”. Placing food allergy risk
in sub-Saharan Africa. Health Place. 51, 125–135 (2018).
6. Zhao, L., Wang, D., Ma, Y., Zhang, Y. & Zhao, X. Yellow pigment formation, pigment composition, and quality of fresh-cut yam
(Dioscorea opposita) slices. RSC Adv. 10, 1104–1113 (2010).
7. Zhao, L., Zhao, X., Ma, Y., Zhang, Y. & Wang, D. DNA binding characteristics and protective effects of yellow pigment from freshly
cut yam (Dioscorea opposita). Molecules 25, 175–186 (2020).
8. Deutch, C. E. Browning in apples: Exploring the biochemical basis of an easilyobservable phenotype. Biochem. Mol. Biol. Educ.
46, 76–82 (2018).
9. Chen, S. X. & Harmon, A. C. Advances in plant proteomics. Proteomics 6, 5504–5516 (2006).
Scientific Reports | (2021) 11:7755 | https://doi.org/10.1038/s41598-021-87423-4 14
Vol:.(1234567890)www.nature.com/scientificreports/
10. Ekblom, R. & Galindo, J. Applications of next generation sequencing in molecular ecology of non-model organisms. Heredity 107,
1–15 (2010).
11. Yang, S. S. et al. Using RNA-Seq for gene identification, polymorphism detection and transcript profiling in two alfalfa genotypes
with divergent cell wall composition in stems. BMC Genom. 12, 199 (2011).
12. Haas, B. J. & Zody, M. C. Advancing RNA-Seq analysis. Nat. Biotechnol. 28, 421–423 (2010).
13. Rakwal, R. & Agrawal, G. K. Rice proteomics: Current status and future perspectives. Electrophoresis 24, 3378–3389 (2003).
14. Ahsan, N. et al. Comparative proteomic study of arsenic-induced differentially expressed proteins in rice roots reveals glutathione
plays a central role during As stress. Proteomics 8, 3561–3576 (2008).
15. Gansemer, E. R. et al. NADPH and glutathione redox link TCA cycle activity to endoplasmic reticulum homeostasis. IScience. 23,
101116 (2020).
16. Owen, O. E., Kalhan, S. C. & Hanson, R. W. The key role of anaplerosis and cataplerosis for citric acid cycle function. J. Biol. Chem.
277, 30409–30412 (2002).
17. Oliver, D. J., Nikolau, B. J. & Wurtele, E. S. Acetyl-CoA—Life at the metabolic nexus. Plant Sci. 176, 597–601 (2009).
18. Weisshaar, B. & Jenkins, G. I. Phenylpropanoid biosynthesis and its regulation. Curr. Opin. Plant Biol. 1, 251–257 (1998).
19. Fathi, E., Majdi, M., Dastan, D. & Maroufi, A. The spatio-temporal expression of some genes involved in the biosynthetic pathways
of terpenes/phenylpropanoids in yarrow (Achillea millefolium). Plant Physiol. Biochem. 142, 43–52 (2019).
20. Katsuyama, Y., Kita, T. & Horinouchi, S. Identification and characterization of multiple curcumin synthases from the herb Curcuma
longa. FEBS Lett. 583, 2799–2803 (2009).
21. Thomas, V. Phenylpropanoid biosynthesis. Mol. Plant. 3, 2–20 (2010).
22. Anterola, A. M., Jeon, J. H., Davin, L. B. & Lewis, N. G. Transcriptional control of monolignol biosynthesis in Pinus taeda: Factors
affecting monolignol ratios and carbon allocation in phenylpropanoid metabolism. J. Biol. Chem. 277, 18272–18280 (2002).
23. Humphreys, J. M. & Chapple, C. Rewriting the lignin roadmap. Curr. Opin. Plant Biol. 5, 224–229 (2002).
24. Ferreyra, M. L. F., Rius, S. P. & Casati, P. Flavonoids: Biosynthesis, biological functions, and biotechnological applications. Front.
Plant Sci. 3, 1–15 (2012).
25. Li, Y. X., Pan, Y. G., He, F. P., Yuan, M. Q. & Li, S. B. Pathway analysis and metabolites identification by metabolomics of etiolation
substrate from fresh-cut chinese water chestnut (Eleocharis tuberosa). Molecules 21, 1648–1663 (2016).
26. Pan, Y. G., Li, Y. X. & Yuan, M. Q. Isolation, purification and identification of etiolation substrate from fresh-cut Chinese water-
chestnut (Eleocharis tuberosa). Food Chem. 186, 119–122 (2015).
27. Guo, Y., Bai, J., Duan, X. & Wang, J. Accumulation characteristics of carotenoids and adaptive fruit color variation in ornamental
pepper. Sci. Hortic-Amsterdam. 275, 109699 (2021).
28. Huh, J. H. et al. A candidate gene approach identified phytoene synthase as the locus for mature fruit color in red pepper (Capsicum
spp.). Theor. Appl. Genet. 102, 524–530 (2001).
29. Hirschberg, J. Carotenoid biosynthesis in flowering plants. Curr. Opin. Plant Biol. 4, 210–218 (2001).
30. Wang, Y., Zeng, X. & Liu, W. D. novo transcriptomic analysis during Lentinula edodes fruiting body growth. Gene 641, 326–334
(2017).
31. Grabherr, M. G. et al. Full-length transcriptome assembly from RNA-Seq data without a reference genome. Nat. Biotechnol. 29,
644–652 (2011).
32. Conesa, A. et al. Blast2GO: A universal tool for annotation, visualization and analysis in functional genomics research. Bioinfor-
matics 21, 3674–3676 (2005).
33. Li, B. & Dewey, C. N. RSEM: Accurate transcript quantification from RNA-Seq data with or without a reference genome. BMC
Bioinform. 12, 323–339 (2011).
34. Xie, C. et al. KOBAS 2.0: A web server for annotation and identification of enriched pathways and diseases. Nucleic Acids Res. 39,
316–322 (2011).
35. Zhang, A. et al. Transcriptomic and proteomic feature of salt stress-regulated network in Jerusalem artichoke (Helianthus tuberosus
L.) root based on de novo assembly sequencing analysis. Planta 247, 715–732 (2018).
36. Livak, K. J. & Schmittgen, T. D. Analysis of relative gene expression data using real-time quantitative PCR. Methods 25, 402–408
(2001).
37. Jian, W. et al. Complementary RNA-sequencing based transcriptomics and iTRAQ proteomics reveal the mechanism of the allevia-
tion of quinclorac stress by salicylic acid in Oryza sativa ssp. japonica. Int. J. Mol. Sci. 18, 1975 (2017).
Acknowledgements
This work was supported by Beijing Natural Science Foundation (6212008), the Special Training Program for
Outstanding Scientists of the Beijing Academy of Agricultural and Forestry Sciences (JKZX201908), the Col-
laborative Innovation Center of the Beijing Academy of Agricultural and Forestry Sciences (KJCX201915),
China Agriculture Research System (CARS-23), and the Efficient Ecological Agriculture Innovation Project of
the Taishan Industry Leading Talent Program, Shandong Province (LJNY201705).
Author contributions
S.G. and D.W. were responsible for performing the experiments, collecting and analyzing the data, and writing
the manuscript. Y.M. and Y.Z. contributed to procuring experimental materials, and performed some experi-
ments. X.Z. was responsible for conceptualization and funding acquisition.
Competing interests
The authors declare no competing interests.
Additional information
Supplementary Information The online version contains supplementary material available at https://doi.org/
10.1038/s41598-021-87423-4.
Correspondence and requests for materials should be addressed to X.Z.
Reprints and permissions information is available at www.nature.com/reprints.
Publisher’s note Springer Nature remains neutral with regard to jurisdictional claims in published maps and
institutional affiliations.
Scientific Reports | (2021) 11:7755 | https://doi.org/10.1038/s41598-021-87423-4 15
Vol.:(0123456789)You can also read