Genomic variations in patients with myelodysplastic syndrome and karyotypes without numerical or structural changes - Nature
←
→
Page content transcription
If your browser does not render page correctly, please read the page content below
www.nature.com/scientificreports
OPEN Genomic variations in patients
with myelodysplastic syndrome
and karyotypes without numerical
or structural changes
Cristiano Luiz Ribeiro 1,5*, Irene P. Pinto1,5, Samara S. S. Pereira1, Lysa B. Minasi1,
Fernanda de S. M. Kluthcouski3, Adriano de M. Arantes4, Aparecido D. da Cruz1,2,5,
Marcio A. A. de Almeida6, Tom E. Howard6 & Cláudio C. da Silva1,2,5
Myelodysplastic syndrome (MDS) is an onco-hematologic disease with distinct levels of peripheral
blood cytopenias, dysplasias in cell differentiation and various forms of chromosomal and
cytogenomic alterations. In this study, the Chromosomal Microarray Analysis (CMA) was performed
in patients with primary MDS without numerical and/or structural chromosomal alterations in
karyotypes. A total of 17 patients was evaluated by GTG banding and eight patients showed no
numerical and/or structural alterations. Then, the CMA was carried out and identified gains and losses
CNVs and long continuous stretches of homozygosity (LCSHs). They were mapped on chromosomes 1,
2, 3, 4, 5, 6, 7, 9, 10, 12, 14, 16, 17, 18, 19, 20, 21, X, and Y. Ninety-one genes that have already been
implicated in molecular pathways important for cell viability were selected and in-silico expression
analyses demonstrated 28 genes differentially expressed in mesenchymal stromal cells of patients.
Alterations in these genes may be related to the inactivation of suppressor genes or the activation
of oncogenes contributing to the evolution and malignization of MDS. CMA provided additional
information in patients without visible changes in the karyotype and our findings could contribute
with additional information to improve the prognostic and personalized stratification for patients.
Onco-hematologic diseases constitute a group of neoplasms with different degrees of bone marrow insufficiency,
characterized by the expansion of cells with ineffective hematopoietic f unctions1,2. Myelodysplastic syndrome
(MDS) comprises a heterogeneous subgroup of neoplasms of bone marrow clones, which present different levels
of cytopenia in the peripheral blood, abnormal differentiation of the myeloid lineage, and dysplastic myeloid
changes1,3. Chromosomal and/or genomic instability inherent in MDS is associated with an increased risk of
unfavorable clinical evolution and the development of acute myeloid leukemia (AML), which can occur in 20
to 40% of primary MDS c ases1,4.
The estimated population incidence rate of MDS is four patients per 100.000 individuals per year in the gen-
eral population. With advancing age, the incidence of MDS significantly increases. For the age group ≥ 80 years,
the incidence of MDS increases 12.5-fold5. The average age of onset is 60 y ears6 and only 10% of patients are
under 50 years old5,7. Chromosomal changes are observed in approximately 50% of primary MDS and 80 to
90% of secondary neoplasms8–11. Karyotype data provides important variables for the diagnosis and prognosis
of primary MDS, according to the consensus of the International Working Group for the Prognosis of MDS
(IWG-PM) of the Myelodysplastic Syndrome Foundation, Inc. The MDS-Foundation proposed the International
Prognostic Scoring System Revised (IPSS-R), in which cytogenetic abnormalities are used to predict the overall
survival and risk of primary MDS t ransformation6.
1
Genetics Master’s Program, Replicon Research Group, Department of Agricultural and Biological Sciences,
Pontifical Catholic University of Goiás, Rua 235, n. 40, Bloco L, Área IV‑S. Universitario, Setor Leste Universitario,
Goiânia, GO CEP 74605‑050, Brazil. 2Human Cytogenetics and Molecular Genetics Laboratory, Health Secretary of
Goiás State, Goiânia, GO, Brazil. 3Department of Hematology, Clinics Hospital, Federal University of Goiás, Goiânia,
GO, Brazil. 4Hospital Araújo Jorge-Cancer Combat Association of Goiás, Goiânia, GO, Brazil. 5Biotechnology and
Biodiversity PhD Program, Federal University of Goiás, Goiânia, GO, Brazil. 6Department of Human Genetics,
School of Medicine, STDOI‑South Texas Diabetes and Obesity Institute, University of Texas Rio Grande Valley,
Brownsville, TX, USA. *email: cristianoluiz@pucgoias.edu.br
Scientific Reports | (2021) 11:2783 | https://doi.org/10.1038/s41598-021-81467-2 1
Vol.:(0123456789)www.nature.com/scientificreports/
The Chromosomal Microarray Analysis (CMA) based on single-nucleotide polymorphism (SNP) is a robust
methodology for genomic prospection and, therefore, is useful for investigating cytogenomic rearrangements
in MDS3,12. The use of CMA could improve MDS diagnosis, refine risk stratification, and provide additional
genomic information that can be applied in patient handling and management13. The CMA allows for the accurate
detection of copy-number variation (CNV) and long continuous stretches of homozygosity (LCSH) acquired
in cell-clone neoplasms of MDS patients. This analysis is particularly important in cases where the karyotype
was unable to identify chromosomal rearrangements or could not be performed on biological s amples2,14–18.
Previous studies have implicated LCSHs in the genomic instability observed in patients with MDS19,20. LCSHs
occur in about 50% of MDS patients with karyotypes without numerical and/or structural alterations. There-
fore, genomic variations like LCSH play an important role in tumorigenesis and can alter gene e xpression21,22.
CNVs and LCSHs demonstrate prognostic significance in MDS and AML21. Previous studies have shown that
74% of the patients evaluated by molecular or cytogenomic techniques present at least one oncogenic copy or
pathogenic CNV related to the etiology and development of MDS. Changes in molecular pathways involving
epigenetic regulation, chromatin modification, transcriptional regulation, signal transduction, apoptosis, RNA
splicing, and cell cycle control in mesenchymal stromal cells in the medullary microenvironment may alter
hematopoiesis in M DS10,23–26.
In the context previously described, the overall objective of the present study was to identify CNVs and LCSHs
by applying the CMA using high-density SNP arrays in patients with primary MDS whose karyotypes presented
without numerical and/or structural chromosomal alterations.
Materials and methods
Patients and biological materials. This study was conducted at the Replicon Research Center of the
School of Agricultural and Biological Sciences of the Pontifical Catholic University of Goiás and in the Human
Cytogenetics and Molecular Genetics Laboratory of the Secretary of Goias State for Public Health. The devel-
opment of this research relied on collaboration with the South Texas Diabetes and Obesity Institute (STDOI),
Department of Human Genetics, School of Medicine from the University of Texas Rio Grande Valley in the
United States of America. For each of the 17 patients with MDS, the attending physician collected a total of 4 mL
of bone marrow tissue. All methods were carried out in accordance with ethical and technical relevant guidelines
and regulations, following both national and international consensuses. This study was approved by Human
Research Ethics Committee of the Federal University of Goiás Clinics Hospital (HREC-FUG/HC), under pro-
tocol no. 1.621.064/2016. All research procedure was done in accordance with the Declaration Helsinki. All
patients signed an informed consent document approved by the Human Research Ethics Committee.
Cytogenetic analysis. Karyotypes from metaphase with a 450-band resolution were obtained through
cell culture in bone marrow tissue samples from patients with primary MDS. The chromosomes were banded
by the GTG method (following standard procedures), modified, and optimized in accordance with previ-
ous protocols27. Short-term cultures (48 h) were established by incubating 1.0 mL of cell suspension in 5 mL
RPMI1640 (Gibco Life Science, USA) supplemented with 1 mL of fetal bovine serum (Gibco Life Science, USA)
and 100 μL L-glutamine (Gibco Life Science, USA) at 37 °C and in 5% C O2. To achieve metaphase, mitotic divi-
sions were interrupted by adding 100 μL of colchicine solution (10 μg/mL) in water (Gibco Life Science, USA) to
the culture system for 30 min prior to harvesting the cell suspension. Subsequently, the cells were incubated in
a hypotonic solution of KCl (0.075 M) (Merck KGaA, Germany) for 30 min at 37 °C and in 5% C O2. Following
hypotonization, the cells were fixed in methanol solution/glacial acetic acid (3:1), that was added by drip. The
cells were mixed, centrifuged, and resuspended in fresh fixative solution. The fixation step was repeated three
to four times. The fixed cells were dripped onto microscopy slides, subjected to GTG chromosome banding
with the enzyme Trypsin (Invitrogen Life Technologies, USA), and stained in 4% Giemsa solution (Gibco Life
Science, USA). Trypsin enzyme was diluted in phosphate-buffered saline (Invitrogen Life Technologies, USA).
Twenty metaphases were analyzed per sample. The metaphase images were captured with the aid of an Axio-
Imager 2 microscope (Carl Zeiss, Germany) connected to the blade-sweeping platform Metafer4 (MetaSystems
Corporation, Germany). Chromosomal analyses were performed by the software IKAROS (Version 5.0, Meta-
Systems Corporation, Germany).
SNP array analysis. The platform GeneChip CytoScan HD array (Thermo Fisher Scientific, USA) was used
for the identification of CNVs and LCSHs in the genome of 8/17 patients with primary MDS, who presented
karyotypes without numerical or structural alterations. The genomic DNA of bone marrow tissue was extracted
using the DNA GenomicPrep Mini Kit (GE Healthcare, USA) following the manufacturer’s instructions. A total
of 250 ng of DNA from each sample was digested with the restriction enzyme NspI, following the manufacturer’s
recommendations (Thermo Fisher Scientific, USA). Once digested, the samples were connected to the adapters,
and then a universal primer was used to amplify the fragments using restriction fragment length polymorphism
(RFLP) through polymerase chain reaction (PCR). PCR conditions were optimized to amplify fragments of sizes
ranging from 150 to 2000 bp in length. The fragments were confirmed on 2% agarose gel in 1X TBE, subjected to
a constant electric field of 10 V/cm for 1 h, and stained in an aqueous solution of ethidium bromide (5 mg/mL).
The gel image was captured by the GelDoc XR + Imaging System (Bio-Rad Laboratories, USA).
The amplified products were purified with magnetic beads and quantified on the spectrophotometer NanoVue
Plus (GE Healthcare, USA). Next, the amplified products were fragmented into 50- to 200-pb segments, purified,
confirmed on a 4% agarose gel in TBE 1X, and separated in a constant electric field of 10 V/cm/h. The bands
were revealed in an aqueous solution of ethidium bromide (5 mg/mL). The gel image was captured by the video
documentation system GelDoc XR + Imaging System (Bio-Rad Laboratories, USA). DNA fragments were tagged
Scientific Reports | (2021) 11:2783 | https://doi.org/10.1038/s41598-021-81467-2 2
Vol:.(1234567890)www.nature.com/scientificreports/
with a terminal deoxynucleotidyl transferase and applied to the GeneChip CytoScan HD, followed by hybridiza-
tion for 16–18 h at 50 ºC and 60 rpm in the GeneChip Hybridization Oven 645 (Thermo Fisher Scientific, USA).
Subsequently, the chips were washed and stained in GeneChip Fluidic Station 450 (Thermo Fisher Scientific,
USA) and scanned by a GeneChip Scanner 3000 7G (Thermo Fisher Scientific, USA) controlled by the Thermo
Fisher Scientific GeneChip Command Console (AGCC, Version 3.2.2). The array was designed for cytogenomic
diagnosis, with approximately a 2.7-million-marker copy number range, covering the entire human genome,
including 743,304 SNP markers and > 1.9 million non-polymorphic markers. The CEL archives obtained by
scanning each patient were compared with two databases: DGV (Database of Genomic Variants—http://proje
cts.tcag.ca/variat ion) and CytoScanHD Array Database (provided by software ChAS). CNVs were also compared
with the genetic diseases database DECIPHER (Database of Chromosomal Imbalance and Phenotype in Humans
using Ensembl Resources: https://decipher.sanger.ac.uk/application/). Additionally, 100% of the constitutional
genes were covered by The International Standards for Cytogenomic Arrays Consortium (ISCA: https://www.
iscaconsortium.org), including about 12,000 genes from OMIM and more than 36,000 genes from the RefSeq
(Reference Sequence Database/NCBI).
In the ChAS, analysis parameters were fixed at 50 markers and a size of 100 kpb to detect gains and at 25
markers and a size of 100 kpb to detect losses. The filter was fixed to ≥ 3 Mb to detect the LCSHs. In the study,
the parameters for CNV analysis followed both standard criteria based on manufacture’s recommendations and
on the LCSHs analysis previously reported28,29. All analyzed chips met the quality control metrics, being MAPD
and SNP-QC defined at ≤ 0.25 and ≥ 15, respectively. CNVs, LCSHs, and genes were identified, selected, and
separated based on their association with molecular factors of MDS. The databases Online Mendelian Inheritance
in Man (OMIM) and RefSeq were accessed by software R to support data mining, analysis, and interpretation
of the cytogenomic information obtained by CMA.
Expression analysis through public databases. Expression analysis was performed on public data-
bases of patients with primary MDS. An NCBI GEO dataset file (https://www.ncbi.nlm.nih.gov/geo/) was down-
loaded. The study (accession number GSE61853) was based on the analysis of gene expression in mesenchymal
tissues of bone marrow stromal cells of patients with MDS and normal controls. The transcriptome was inves-
tigated with the aid of the platform Thermo Fisher Scientific Human Gene 1.0 ST Array (USA). Based on the
global expression profile of bone marrow mesenchymal stem cells (BM MSCs), the top 250 genes were ranked
based on P-value in the study GSE61853 where smallest P-value were the most significant. Afterwards, we com-
pared the genes selected in the CNVs and LCSHs regions with the top 250 genes from the database. The logFC
values were used to define which genes were considered to positively or negatively regulated in the individuals
with MDS involved in this study.
Results
The average age of the 17 patients was 56 (26–79) years. The small sample group is a result of the reduced inci-
dence of primary MDS in the population. Of the 17 cases, in 6/17, the results of karyotype with banding GTG
demonstrated numerical or structural changes, being + 8, + 15, + 17, + 21, − X, t(4;11)(q21;q23) add(1)(q?), and
polyploidy clones; in 3/17, the karyotype was not informative, given that there was no clonal expansion, so these
cases were removed from subsequent analyses. In 8/17 patients, the karyotype showed no numerical and/or
structural chromosomal changes, and their results were previously reported and were not included in the current
analysis30. With assistance from CMA, 41 genomic variants were identified in 7/8 patients with no visible changes
in karyotype, including 11/41 variations in the number of copies per gain, 2/41 regions with genomic loss, and
28/41 long continuous extensions of homozygosis, mapped on chromosomes 1, 2, 3, 4, 5, 6, 7, 9, 10, 12, 14, 16, 17,
18, 19, 20, 21, X, and Y (Figs. 1 and 2). Ninety-one genes that have already been implicated in relevant molecular
pathways for cell viability were selected, including 9/91 gains and 4/91 losses, and 78/91 in regions with LCSHs.
The cytogenetic risk of patients with karyotypes without numerical or structural alterations was rated as
good, based on the International Prognostic Scoring System—Revised, while the risk of prognostic transforma-
tion of MDS ranged from very low to low. Only one patient died, while the others remained stable at the end of
the study. Table 1 summarizes the results identified by the CMA and the risk estimates, according to IPSS-R, in
addition to the clinical outcomes of these eight primary MDS patients.
The size of the genomic changes varied from 0.1 to 23.4 Mb. The LCSHs were larger when compared with
the CNVs, ranging from 3.9 to 23.4 Mb. A CNV of loss identified in the cytoband 20q11.21 with 17.1 Mb was
the largest genomic variant. The biggest CNV of gain was identified in the cytoband 7q36.3 with 0.52 Mb, while
the lowest genomic gain was in cytoband 3q12.2 with 0.1 Mb.
Among the selected genes, 28/91 are differentially expressed by up-regulation or down-regulation in the
mesenchymal stromal cells of bone marrow tissue from patients with MDS and karyotypes without numerical or
structural changes. The value of logFC was used to define which of the 91 selected genes were regulated positively
or negatively in the MDS patients included in this study. Table 2 shows the biological functions and expression
patterns of the 28 genes at diagnosis, in addition to the logFC value.
Some recurrent genomic variations have been identified in patients in the present sample group. The
LCSHs in cytoband 19q13.32 with sizes of 13.64 Mb and 5.48 Mb were identified in patients ONCO003 and
ONCO005, respectively. In this region, the genes ERCC2, SIX5, SYMPK, STRN4, BBC3, BAX, GYS1, CD37,
FLT3LG, BCL2L12, and IL4I1, which were common among these patients, were selected. That said, the genes
SIX5, SYMPK, and FLT3LG were differentially expressed by up-regulation or down-regulation. The LCSHs
in cytoband 10q26.12 with 3.9 Mb and 10.76 Mb were identified in the patients ONCO003 and ONCO012,
respectively, and the gene C10orf88 was identified to be differentially expressed by down-regulation. CNVs of
genomic gain involving cytoband 17p11.2 with different sizes were also identified. In patient ONCO002 with
Scientific Reports | (2021) 11:2783 | https://doi.org/10.1038/s41598-021-81467-2 3
Vol.:(0123456789)www.nature.com/scientificreports/
Figure 1. Ideograms of chromosomes following Denver’s group nomenclature summarizing the mapping of
13 unusual and clinically significant CNVs, identified by CMA in 7/8 MDS patients with karyotypes without
numerical or structural chromosomal changes. Legend: Blue lines indicate CNVs with genomic gains, while red
lines indicate CNVs of genomic loss. A dotted green line was added to indicate the alignment of chromosomes
by centromeres.
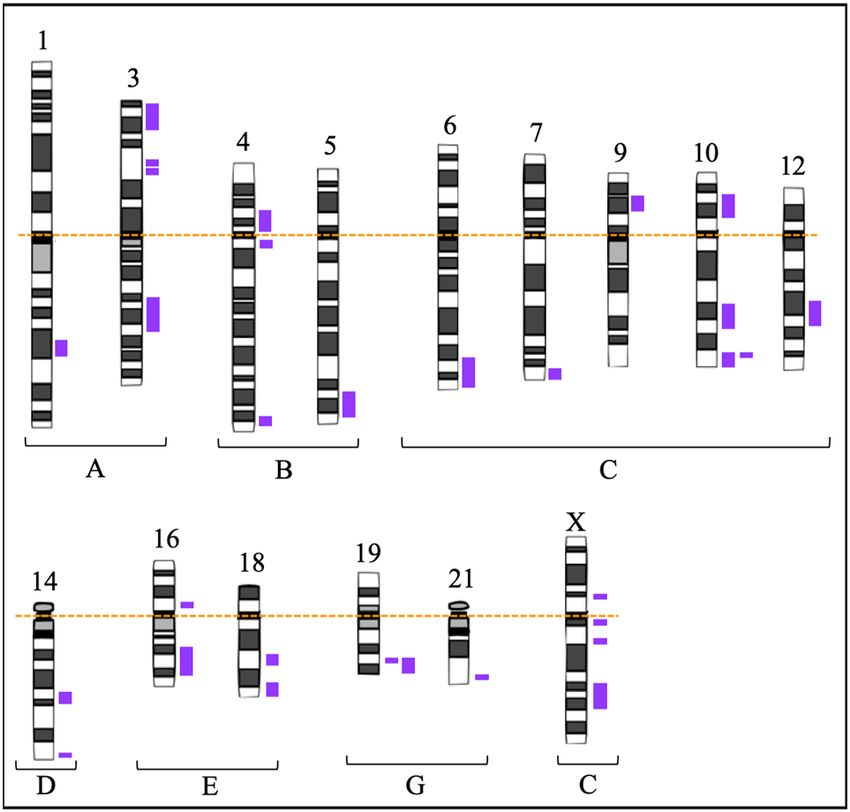
Figure 2. Ideogram of chromosomes following Denver’s group nomenclature summarizing the mapping of 28
unusual and clinically significant LCSHs, indicated by purple bars, identified by CMA in 7/8 patients with MDS
and with karyotype without numerical and/or structural chromosomal changes. Legend: A dotted orange line
was added to indicate the alignment of chromosomes by centromeres.
0.29 Mb, the up-regulated oncogene MAP2K3 was selected, and in patient ONCO014 with 0.13 Mb and 0.15 Mb,
the SPECC1 gene was selected.
Discussion
In the present study, patient karyotypes without numerical and/or structural alterations were classified according
to cytogenetic risk as good, whereas risk prediction for primary MDS ranged from very low to low. These results
confirmed that cytogenetic risk is an important informative variable for inferring prognosis because, according to
the clinical outcomes, only one patient died, while the others remained stable at the end of the study. The CMA
analysis of patients with primary MDS and no karyotype changes visible under the microscope also provided
useful information for better understanding of the etiological aspects of this hematological d isease3,8,10,11.
CNVs and LCSHs that are potentially associated with the etiology of MDS were identified in 87.5% (7/8) of
the patients included in this study, of which 91 genes were selected that had already been implicated in molecular
pathways important for cell metabolism and viability. According to the Cancer Genomics Consortium (CGC),
CMA shows efficiency in detecting genomic variations in primary MDS in 10 to 80% of patient karyotypes with-
out numerical or structural chromosomal changes13. Despite recent advances in diagnostic tools, MDS continues
Scientific Reports | (2021) 11:2783 | https://doi.org/10.1038/s41598-021-81467-2 4
Vol:.(1234567890)www.nature.com/scientificreports/
Blasts IPSS-R**
in bone IPSS-R** age- Selected
Age marrow Karyotypic cytogenetic IPSS-R** adjusted Risk Genomic Size Number OMIN Clinical
Case (years) Sex Cytopenias (%) notation* risk score risk prediction variation Cytoband (Mb) of genes genes*** outcome
BHLHE40,
LMCD1,
RAD18,
LCSH 3p26.1 16.9 125 MTMR14,
TADA3,
JAGN1,
RAF1
LCSH 4q11 5.1 40 ***
KLHL5,
UCHL1,
LCSH 4p14 10.1 56
TMEM33,
Thrombocy- OCIAD2
ONCO002 52 F 2 46,XX 20
Good 1 0.19 Very low Death
topenia
CUBN,
HACD1,
MIR511,
LCSH 10p13 9.1 47
MLLT10,
BMI1,
ARMC3
POC1B,
LCSH 12q21.31 8.7 41
BTG1
RNF40,
LCSH 16p11.2 4.5 65
KAT8
Gain 17p11.2 0.29 4 MAP2K3
CHTOP,
ILF2,
Gain 1q21.3 0.11 5
NPR1,
INTS3
Gain 3q12.2 0.1 2 TFG
Loss 4q13.2 0.12 0 ***
LCSH 1q31.1 6.88 16 RGS1
LCSH 4q34.2 10.76 54 KLKB1
LATS1,
ULBP2,
ULBP1,
LCSH 6q24.3 23.41 143 DYNLT1,
RPS6KA2,
AFDN,
DLL1
SNORA12,
LCSH 10q23.1 15.21 176
HIF1AN
LCSH 10q26.12 3.9 33 C10orf88
BMP4,
ONCO003 49 F Leukopenia 0 46,XX 20
Good 1 0.05 Very low Stable
GMFB,
LCSH 14q22.2 10 70
PPM1A,
PPP2R5E
LCSH 18q22.3 9.21 38 ZNF516
ERCC2,
SIX5,
SYMPK,
STRN4,
BBC3,
BAX, GYS1,
LCSH 19q13.32 13.64 602
CD37,
FLT3LG,
BCL2L12,
IL4I1,
SIGLEC7,
ZNF446
GATA1,
LCSH Xp11.23 5.38 108 PIM2,
HUWE1
LCSH Xq13.1 5.65 41 HDAC8
LCSH Xq23 14.29 85 SEPT6
Thrombocy-
ONCO004 42 F 0.5 46,XX20 Good 1 -0.26 Very low Gain 7q36.3 0.52 3 PTPRN2 Stable
topenia
Continued
Scientific Reports | (2021) 11:2783 | https://doi.org/10.1038/s41598-021-81467-2 5
Vol.:(0123456789)www.nature.com/scientificreports/
Blasts IPSS-R**
in bone IPSS-R** age- Selected
Age marrow Karyotypic cytogenetic IPSS-R** adjusted Risk Genomic Size Number OMIN Clinical
Case (years) Sex Cytopenias (%) notation* risk score risk prediction variation Cytoband (Mb) of genes genes*** outcome
RALY,
RAB5IF,
Loss 20q11.21 17.1 224
ADA,
SLC2A10
Gain 21q22.2 0.18 1 ERG
Gain Yq11.2 0.41 5 ***
MRAS,
LCSH 3q22.2 20.2 114
MME
LCSH 9p22.1 9.41 58 CDKN2B
MOK,
Pancyto- TRAF3,
ONCO005 57 M 0.5 46,XY20 Good 2.5 2.01 Low LCSH 14q32.31 5.45 72 Stable
penia TNFAIP2,
TRMT61A
ERCC2,
SIX5,
SYMPK,
STRN4,
BBC3,
LCSH 19q13.32 5.48 244
BAX, GYS1,
CD37,
FLT3LG,
BCL2L12,
IL4I1
LCSH 21q22.3 4.9 120 MX2, MX1
SPARC,
HAVCR2,
LCSH 5q33.1 21.1 96
ITK, TLX3,
NPM1
Thrombocy- LCSH 7q36.1 4.9 72 ZNF282
ONCO012 73 F 0 46,XX20 Good 1 1.14 Very low Stable
topenia
C10orf88,
DHX32,
LCSH 10q26.12 10.76 69 DOCK1,
MGMT,
EBF3
Gain 2q37.3 0.29 5 ***
Gain 21q21.1 0.27 4 ***
ONCO013 42 F Leukopenia 0 46,XX20 Good 1 -0.26 Very low CBFB, Stable
LCSH 16q21 17.91 202 NOL3,
E2F4
LCSH Xq11.1 5.19 17 ***
Gain 17p11.2 0.13 1 ***
Thrombocy- Gain 17p11.2 0.15 2 SPECC1
ONCO014 75 F 0 46,XX20 Good 1 1.23 Very low Stable
topenia Gain 17q25.3 0.15 1 ***
LCSH 18q21.1 8.19 37 ***
Pancyto- 20
ONCO15 60 F 0 46,XX Good 2.5 2.13 Low NAF *** *** *** *** Stable
penia
Table 1. Clinical features, cytogenetic and cytogenomic results, and risk estimates (according to the
International Prognostic Scoring System—Revised) of a cohort of patients with myelodysplastic syndrome in
addition to clinical outcomes. F female, M male, NAF no alterations found, LCSH long continuous stretches
of homozygosity. *ISCN2016: an international system for human cytogenomic chromosome nomenclature.
**IPSS-R: risk estimates, according to the International Prognostic Scoring System—revised ***No
cytogenomic rearrangements and no genes were identified using the CMA in the analyzed region. # Estimated
score according to hemoglobin levels, absolute neutrophil count, platelet count, percentage of blasts in the
bone marrow, and cytogenetic risk.
to show variability in its clinical course and response to t reatment1,3,31,32. In this scenario, the identification of
genomic variants associated with primary MDS could prove widely useful, offering additional information for
the biological understanding and prognostic classification of this d isease13,15,33,34.
The imbalances, characterized by gains and losses in the genome, represented 31.7% (13/41) of the genomic
variations identified. Therefore, gene copy gains and losses may result in an increase or decrease/absence of any
functional transcript. In this context, alterations in gene dosages play a determining role in the quantity of the
expressed product and, consequently, down-regulate important molecular pathways of hematopoietic progenitor
cells (HPCs), which are associated with the etiological processes of M DS35,36.
Expression analysis via a public database indicated that 30.8% (28/91) of the genes in this study located in
regions with CNVs and LCSHs are up-regulated or down-regulated in the mesenchymal stromal cells of bone
marrow tissue in patients with MDS, when compared with those of controls. Additionally, alterations in gene
expression may be related to the inactivation of suppressor genes or the activation of oncogenes26. These altered
molecular biological mechanisms may interfere with cell survival and correlate with the expansion of cells with
ineffective hematopoietic functions, which may contribute to the possibility of the evolution and malignization
of clinical MDS.
Scientific Reports | (2021) 11:2783 | https://doi.org/10.1038/s41598-021-81467-2 6
Vol:.(1234567890)www.nature.com/scientificreports/
Selected genes Genomic variation Cytoband Biological function* logFC Expression**
MX1 LCSH 21q22.3 Cellular antiviral response 2.743 Up-regulation
MX2 LCSH 21q22.3 Cellular antiviral response 1.191 Up-regulation
POC1B LCSH 12q21.31 Centrosome − 0.522 Down-regulation
RALY Loss 20q11.21 Embryonic development 0.715 Up-regulation
SIX5 LCSH 19q13.32 Gene expression control 0.589 Up-regulation
SYMPK LCSH 19q13.32 Gene expression control 1.115 Up-regulation
ZNF282 LCSH 7q36.1 Gene expression control 0.392 Up-regulation
ZNF446 LCSH 19q13.32 Gene expression control 0.373 Up-regulation
SLC2A10 Loss 20q11.21 Glucose homeostasis − 0.719 Down-regulation
ADA Loss 20q11.21 Immunological response 0.696 Up-regulation
FLT3LG LCSH 19q13.32 Immunological response 0.438 Up-regulation
KLHL5 LCSH 4p14 Immunological response 0.235 Up-regulation
UCHL1 LCSH 4p14 Neuro transmission − 1.126 Down-regulation
MAP2K3 Gain 17p11.2 Oncogene 0.278 Up-regulation
SNORA12 LCSH 10q23.1 RNA processing 0.774 Up-regulation
HACD1 LCSH 10p13 Signaling molecule − 0.845 Down-regulation
TMEM33 LCSH 4p14 Transmembrane protein − 0.572 Down-regulation
TRMT61A LCSH 14q32.31 tRNA stabilization 0.593 Up-regulation
GMFB LCSH 14q22.2 Tumor proliferation − 0.661 Down-regulation
KAT8 LCSH 16p11.2 Tumor proliferation 0.681 Up-regulation
RGS1 LCSH 1q31.1 Tumor proliferation 0.414 Up-regulation
OCIAD2 LCSH 4p14 Tumor supressor − 0.794 Down-regulation
HIF1AN LCSH 10q23.1 Tumor supressor 0.351 Up-regulation
MTMR14 LCSH 3p26.1 Tumor supressor 0.367 Up-regulation
RNF40 LCSH 16p11.2 Tumor supressor 0.603 Up-regulation
SIGLEC7 LCSH 19q13.32 Tumor supressor 0.272 Up-regulation
C10orf88 LCSH 10q26.12 Identical protein binding − 0.535 Down-regulation
RAB5IF Loss 20q11.21 Interacting factor protein − 0.806 Down-regulation
Table 2. Biological functions and expression patterns at diagnosis of (28/91) selected genes in MDS patients
with karyotypes without numerical or structural changes. *The biological functions of the genes were identified
via RefSeq (NCBI Reference Sequence Database: http://www.genome.jp/dbget-bin/www_bget?ds:H0148
1; Kegg Disease: Myelodysplastic syndrome—Genome Net). **For the analysis of expression through
public databases of MDS patients, one GEO Dataset from NCBI (https://www.ncbi.nlm.nih.gov/geo/) was
downloaded. The transcriptome was based on the study with accession number GSE61853 in which the gene
expression patterns of mesenchymal bone marrow stromal cells from patients with MDS and normal controls
were analyzed. The value of logFC was used to define which genes were up-regulated or down-regulated in
MDS patients with karyotypes without numerical or structural changes.
Of the altered genes, 32.1% (9/28) were down-regulated and 67.9% (19/28) were up-regulated. The main
functional pathways in which these genes are involved have been identified; in this context, the investigation
only described the biological processes that may be affected by altered gene expression. This study reports that
the molecular pathways associated with gene expression control, immune response, and tumor proliferation
and suppression were the most commonly deregulated. The relationship between RNA polymerase and the eti-
ology of MDS is not well-defined26. One can infer that RNA polymerase dysregulation would alter the normal
transcription of critical genes, such as tumor suppressor genes (GSTs), because RNA polymerase plays a role in
modulating DNA transcription.
Identified CNVs harbor 17.9% (5/28) of genes with positive or negative regulation in the mesenchymal
stromal cells of bone marrow tissue in patients with MDS. In the CNV of genomic loss in 20q, the RALY and
ADA genes were found to be up-regulated and SLC2A10 and RAB5IF were down-regulated. The ADA and RALY
genes are associated with immune response pathways and embryonic development, respectively, while the genes
SLC2A10 and RAB5IF correlate with glucose homeostasis pathways and protein interaction factor, respectively;
these genes are expressed in the mesenchymal stromal cells of normal bone marrow tissue.
According to reports previously p ublished37,38, loss of CNVs lead to haploinsufficiency and can inactivate
GSTs. In addition, the RALY and ADA genes were up-regulated in lost CNVs, suggesting compensation for
protein products. Therefore, in microdeletion events in the genome, varied molecular mechanisms can occur
and be associated with the pathophysiology of MDS. Thus, CNVs of genomic loss represent important markers
with biological significance, providing additional information for understanding the mechanisms and molecular
pathways related to the etiology and transformation potential of MDS36.
The MAP2K3 oncogene, located in the CNV with genomic gain in 17p with 0.29 Mb, shows altered expression
with positive regulation. The protein encoded by this gene is a dual-specificity kinase that belongs to the family of
map-kinases and is activated by mitogenic and environmental s tress38. Changes in the pathways involving these
kinases can deregulate molecular processes related to differentiation, cell cycle survival, and control, leading to
the process of apoptosis in patients with MDS. Imbalances caused by positive gene expression, when compared
with negative gene expression, may be less unfavorable for cellular biological pathways37,38. The present study
Scientific Reports | (2021) 11:2783 | https://doi.org/10.1038/s41598-021-81467-2 7
Vol.:(0123456789)www.nature.com/scientificreports/
confirms this statement, since about 2/3 of the genes are up-regulated and 7/8 patients with no visible changes
in the karyotype exhibited stable clinical outcomes at the end of the study.
All three gain CNVs involving the 17p11.2 cytoband with different sizes, being 0.29 Mb, 0.13 Mb, and
0.15 Mb, are significant. Events involving chromosome 17p were considered important due to the proximity of the
cytoband 17p13.1, which houses the GST TP53. The TP53 protein participates in the regulation and expression of
several target genes, inducing cell cycle control, apoptosis signaling, cell senescence, and DNA r epair39,40. Muta-
tions in one or both alleles of TP53 can deregulate several molecular pathways involved in about 50% of human
cancers and 20% of onco-hematologic malignancies, including MDS. Therefore, according to the risk prognosis
and clinical results, these CNVs with a 17p gain may have a negative effect on hematological evolution and patient
survival, as evidenced by the patient who died during the course of this study. The other CNVs with genomic
gain in 2q, 17p, 17q, 21q and Yq, the CNV of genomic loss in 4q, and the LCSHs in 4q, 18q and Xq presented
in Table 1 were selected as relevant due to the high instability inherent in the genomes of MDS patients, which
is the basis for the accumulation of mutations in this d isease24. Expression per positive regulation of the ADA
gene, inserted in a region with genomic loss in 20q, and of the FLT3LG gene in 19q and KLHL5 in 4p, located in
regions within LCSHs, may be associated with changes in interferon signaling pathways (immune response)41.
These deregulated pathways in the medullary microenvironment in patients with MDS demonstrate that these
factors participate in inducing the inflammatory state and immunological disorders, which alters hematopoiesis,
thereby causing intramedullary apoptosis along with abnormal HPC differentiation and maturation.
LCSHs are abnormalities that represent 68.3% (28/41) of the genomic variations identified in the present
study. Of the selected genes, 85.7% (78/91) were inserted in regions with LCSHs and associated with biological
regulatory functions. Additionally, 82.1% (23/28) of up-regulated or down-regulated genes in mesenchymal
stromal cells in the medullary microenvironment of patients with MDS were located in regions with loss of
heterozygosity. The pathological potential of LCSHs emerges as a mechanism of clonal alteration in a proportion
of somatic cells with uniparental disomy (UPD)19,20,42,43. In this context, recurring areas of LCSHs are strongly
associated with the loss of the wild allele or an entire region, which also leads to the hypothesis of haploinsuf-
ficiency. Thus, these events indicate changes in biological processes that are important to the cells and signal
a predisposition to hematological malignancies19,20. The terminal segmental LCSHS identified in 6q, 14q, 18q,
19q, and 21q presented in Fig. 2 indicates that break-induced replication (BIR) can be a dominant mechanism
by which a cell duplicates a somatically acquired event, such as a mutation, microdeletion, or epigenetically
suppressed region, and consequently becomes homozygous for this segment. BIR seems to be a common repair
mechanism in replication, but only the reduplication of a region that contains a genetic or epigenetic alteration
gives the cell a growth advantage, allowing for its dominance and clonal selection. Regions with LCSHs involv-
ing 3p, 4p, 10p, 12q, and 16p were identified only in the patient who died. The UCHL1, TMEM33, and OCIAD2
genes inserted in 4p, the HACD1 gene in 10p, and the POC1B gene in 12q, which encode neural transmission
functions, transmembrane protein, tumor suppressor, signaling molecule, and centrosome, respectively, were
down-regulated. Five out of nine selected and down-regulated genes were located in the LCSHs identified in the
patient who died. Thus, unlike up-regulation, down-regulation events are potentially more damaging to impor-
tant molecular pathways and fundamental cellular functions, as observed in this patient during the hematological
evolution of the d isease44.
The MX1 gene, located in an LCSH region at 21q, was the most up-regulated, being 2.74-times more expressed
in bone marrow mesenchymal stromal cells in patients with MDS. This gene encodes a protein that metabolizes
the guanosine triphosphate (GTP) that participates in the antiviral cellular response. The protein encoded by
this MX1 gene is induced by the type I and II interferon pathways. In this study, the patients with genomic
variations involving 21q were classified as having low and very low predicted risk, respectively, with stable
clinical outcomes. These findings contradict previously p ublished9 reports that changes involving chromosome
21 have been observed in more advanced cases of MDS, with a more aggressive evolution and rapid leukemic
transformation1,11. On the other hand, the UCHL1 gene inserted in an LCSH region with 4p was the most down-
regulated, being 1.12-times less expressed in the mesenchymal stromal cells of the medullary tissue of the MDS
patient who died. The gene UCHL1 provides information for the production of the enzyme Ubiquitin Carboxyl-
Terminal Esterase L1, which is involved in the cellular machinery that breaks down unnecessary substances45. In
cells, damaged or excess proteins are marked with ubiquitin molecules so that the ubiquitin–proteasome system
can act as a cellular quality control system.
In patients with MDS, persistent and refractory cytopenias can be induced by cytokines and associated with
T-cell mediated myelosuppression46. Alongside this, changes in the medullary microenvironment inhibit the
growth of HPCs through the high secretion of interferon-gamma (IFN-γ), TNF, and Interleukin-6 (IL-6)14,47. An
increase in the number of stem cells could offset the phenotypic consequences of the simultaneous repression
of differentiation genes, creating a pre-leukemic hematopoiesis with little or no morphological abnormalities48.
As such, the association between dysplastic cell characteristics and the increase in total genomic changes is an
observation that suggests a significant parallel trend. Also, the more morphological dysplasia a marrow tissue
sample presents, the more extensive the underlying genomic changes can b e48. Both events, CNVs and LCSHs,
contributed significantly to the correlation between the identified genomic variations and the clinical and labora-
tory phenotypes of patients with MDS in this study, highlighting the usefulness of matrix platforms containing
markers for SNPs.
In only 12.5% (1/8) of the patients, the CMA did not reveal genomic variations. It is important to note that
this result without changes does not imply that there could not be some kind of deleterious mutation in the
genes associated with the molecular pathways associated with the MDS phenotypes. Thus, it was not possible
to suggest a genetic cause for this disease, since the CMA resolution was not comprehensive enough to identify
changes in the genome. This study highlights that balanced translocations are not detectable by CMA, which is a
disadvantage of this cytogenomic analysis technique49,50. The possibility of testing other more sensitive or specific
Scientific Reports | (2021) 11:2783 | https://doi.org/10.1038/s41598-021-81467-2 8
Vol:.(1234567890)www.nature.com/scientificreports/
genomic technologies, such as Next Generation Exome Sequencing (NGS), may be a differential approach to
identify point mutations that may be associated with MDS, in which the etiology is multifactorial and extremely
heterogeneous51.
The limitation of this study was the small size of the sample group. This limitation is typical of studies involv-
ing patients with primary MDS, which have reduced casuistry due to the low incidence of the disease in the
population. The present findings from CNVs and LCSHs can contribute to subsequent studies of the adequate
characterization of the MDS phenotype and bring additional information to improve the quality of prognostic
and personalized stratification for the patient, in addition to the possibility of identifying potentially more effec-
tive therapeutic treatments in the near future13,16. The interpretation and association of CNVs that result in pri-
mary MDS is still challenging, mainly due to the unclear effects of variations in the genome that can be influenced
by incomplete penetrance, variable expressiveness, and e pistasis40,52,53. In this context, further investigations are
needed in larger cohorts, including patients with greater heterogeneity of clinical outcomes and prognostic risks.
Conclusion
This study identified and reported CNVs and LCSHs that may be associated with primary MDS in the group of
participants. Ninety-one genes involved in important molecular pathways of metabolism and cell viability were
selected. From the analysis of the cytogenomic findings, when compared to information from public genomic
databases, CNVs and LCSHs were related to bone marrow failure, which was characterized by the expansion
of cells with ineffective hematopoietic functions. CMA is a robust and efficient cytogenomic technique for
expanding the resolution of the genomic analysis of the medullary cells of primary MDS patients, allowing the
identification of unusual and clinically significant genomic variations in patients without visible changes in the
karyotype. Finally, 30.8% (28/91) of the selected genes showed altered expression and 2/3 of these genes showed
positive regulation when compared to public data on gene expression in mesenchymal stromal cells of bone
marrow tissue in primary MDS. Changes in gene expression may be related to the etiology and progression of
primary MDS, with a resulting effect on the relative risk and clinical outcome of this onco-hematological disease.
Received: 8 September 2020; Accepted: 23 December 2020
References
1. Adès, L., Itzykson, R. & Fenaux, P. Myelodysplastic syndromes. Lancet 383, 2239–2252 (2014).
2. Haferlach, T. et al. Landscape of genetic lesions in 944 patients with myelodysplastic syndromes. Leukemia 28(2), 241–247 (2014).
3. Prebet, T. et al. Outcome of high-risk myelodysplastic syndrome after azacitidine treatment failure. J. Clin. Oncol. 29, 3322–3327
(2011).
4. Arber, D. A. et al. The 2016 revision to the World Health Organization classification of myeloid neoplasms and acute leucemia.
Blood 127, 2391–2405 (2016).
5. Neukirchen, J. et al. Incidence and prevalence of myelodysplastic syndromes: Data from the Düsseldorf MDS-registry. Leuk. Res.
35, 1591–1596 (2011).
6. Greenberg, P. L. The multifaceted nature of myelodysplastic syndromes: Clinical, molecular, and biological prognostic features.
JNCCN. 11(7), 877–884 (2013).
7. Lubeck, D. P. et al. Systematic literature review of the global incidence and prevalence of myelodysplastic syndrome and acute
myeloid leukemia. Blood 128, 5930 (2016).
8. Bejar, R. Prognostic models in myelodysplastic syndromes. Hematol. Am. Soc. Hematol. Educ. Program. 504–510 (2013).
9. Malcovati, L. et al. Diagnosis and treatment of primary myelodysplastic syndromes in adults: Recommendations from the European
Leukemia Net. Blood 122(17), 2943–2964 (2013).
10. Estephan, F. & Tiu, R. V. Current and novel therapeutic approaches in myelodysplastic syndromes. J. Commun. Support Oncol. 12,
236–249 (2014).
11. Mohammad, F. Z. et al. Cytogenetic abnormalities in myelodysplastic syndromes: An overview. Int. J. Hematol. Oncol. Stem Cell
Res. 11(3), 231–239 (2017).
12. Arenillas, L. et al. Single nucleotide polymorphism array karyotyping: A diagnostic and prognostic tool in myelodysplastic syn-
dromes with unsuccessful conventional cytogenetic testing. Genes Chromosomes Cancer. 52, 1167–1177 (2013).
13. Kanagal-Shamanna, R. et al. Assessing copy number aberrations and copy neutral loss of heterozygosity across the genome as best
practice: An evidence-based review of clinical utility from the cancer genomics consortium (CGC) working group for myelodys-
plastic syndrome, myelodysplastic/myeloproliferative and myeloproliferative neoplasms. Cancer Genet. 228–229, 197–217 (2018).
14. Raaijmakers, M. H. Myelodysplastic syndromes: Revisiting the role of the bone marrow microenvironment in disease pathogenesis.
Int. J. Hematol. 95(1), 17–25 (2012).
15. Greenberg, P. L. et al. Revised international prognostic scoring system for myelodysplastic syndromes. Blood 120, 2454–2465
(2012).
16. Macedo, L. C. et al. Genetics factors associated with myelodysplastic syndromes. Blood Cells Mol. Dis. 55, 76–81 (2015).
17. Zhang, L., Padron, E. & Lancet, J. The molecular basis and clinical significance of genetic mutations identified in myelodysplastic
syndromes. Leuk. Res. 39, 6–17 (2015).
18. Diamantidis, M. D. & Papanastasiou, D. Myelodysplastic syndromes: Aiming at deciphering their secrets. Leuk. Res. 51, 1–2 (2016).
19. Jerez, A. et al. Topography, clinical, and genomic correlates of 5q myeloid malignancies revisited. J. Clin. Oncol. 30(12), 1343–1349
(2012).
20. Schanz, J. et al. New comprehensive cytogenetic scoring system for primary myelodysplastic syndromes (MDS) and oligoblastic
acute myeloid leukemia after MDS derived from an international database merge. J. Clin. Oncol. 30(8), 820–829 (2012).
21. Kolquist, K. A. et al. Microarray-based comparative genomic hy- bridization of cancer targets reveals novel, recurrent genetic
aberrations in the myelodysplastic syndromes. Cancer Genet. 204, 603–628 (2011).
22. Ahmad, A. & Iqbal, M. A. Significance of genome-wide analysis of copy number alterations and UPD in myelodysplastic syndromes
using combined CGH-SNP arrays. Curr. Med. Chem. 19, 3739–3747 (2012).
23. Liu, F. et al. JAK2V617F-mediated phosphorylation of PRMT5 downregulates its methyltransferase activity and promotes myelo-
proliferation. Cancer Cell 19, 283–294 (2011).
24. Papaemmanuil, E. et al. Clinical and biological implications of driver mutations in myelodysplastic syndromes. Blood 122, 3616–
3627 (2013).
25. Itzykson, R. & Fenaux, P. Epigenetics of myelodysplastic syndromes. Leukemia 28, 497–506 (2014).
Scientific Reports | (2021) 11:2783 | https://doi.org/10.1038/s41598-021-81467-2 9
Vol.:(0123456789)www.nature.com/scientificreports/
26. Kim, M. et al. Increased expression of interferon signaling genes in the bone marrow microenvironment of myelodysplastic syn-
dromes. PLoS ONE 10(3), e0120602. https://doi.org/10.1371/journal.pone.0120602 (2015).
27. Verma, R. S. & Babu, A. Human Chromosomes: Principles and Techniques (McGraw-Hill, New York, 1995).
28. Kearney, H. M. et al. Diagnostic implications of excessive homozygosity detected by SNP-based microarrays: Consanguinity,
uniparental disomy, and recessive single-gene mutations. Clin. Lab. Med. 31, 595–613 (2011).
29. Chaves, T. F. et al. Long contiguous stretches of homozygosity detected by chromosomal microarrays (CMA) in patients with
neurodevelopmental disorders in the South of Brazil. BMC Med. Genomics 12, 50 (2019).
30. Ribeiro, C. L. et al. High diversity of chromosomal aberrations in a Brazilian myelodysplastic syndrome cohort. Genet. Mol. Res.
18(2), 18322 (2019).
31. Akagi, T. et al. Frequent genomic abnormalities in acute myeloid leukemia/myelodysplastic syndrome with normal karyotype.
Haematologica 94(2), 213–223 (2009).
32. Cordoba, I. et al. The degree of neutropenia has a prognostic impact in low risk myelodysplastic syndrome. Leuk. Res. 36(3),
287–292 (2012).
33. Cazzola, M. & Malcovati, L. Prognostic classification and risk assessment in myelodysplastic syndromes. Hematol. Oncol. Clin. N.
Am. 24(2), 459–468 (2010).
34. Giagounidis, A. & Haase, D. Morphology, cytogenetics and classification of MDS. Best Pract. Res. Clin. Haematol. 26, 337–353
(2013).
35. McNerney, M. E. et al. CUX1 is a haploinsufficient tumor suppressor gene on chromosome 7 frequently inactivated in acute myeloid
leukemia. Blood 121, 975–983 (2013).
36. - Mitelman, F., Johansson, B. & Mertens, F. Mitelman database of chromosome aberrations and gene fusions in cancer. http://cgap.
nci.nih.gov/Chromosomes/Mitelman. (2016).
37. Bejar, R. et al. Validation of a prognostic model and the impact of mutations in patients with lower-risk myelodysplastic syndromes.
J. Clin. Oncol. 30, 3376–3382 (2012).
38. Gomez-Segui, I. et al. Novel recurrent mutations in the RAS-like GTP-binding gene RIT1 in myeloid malignancies. Leukemia 27,
1943–1946 (2013).
39. Jasek, M. et al. P53 mutations in myeloid malignancies are either homozygous or hemizygous due to copy number-neutral loss of
heterozygosity or deletion of 17p. Leukemia 24(1), 216–219 (2010).
40. Jadersten, M. et al. TP53 mutations in low-risk myelodysplastic syndromes with del(5q) predict disease progression. J. Clin. Oncol.
29, 1971–1979 (2011).
41. Larrosa, G. M. & Baer, M. R. FLT3 inhibitors in acute myeloid leukemia: Current status and future directions. Mol. Cancer Ther.
16(6), 991–1001 (2017).
42. Makishima, H. & Maciejewski, J. P. Pathogenesis and consequences of uniparental disomy in cancer. Clin. Cancer Res. 17, 3913–3923
(2011).
43. Svobodova, K. et al. Copy number neutral loss of heterozygosity at 17p and homozygous mutations of TP53 are associated with
complex chromosomal aberrations in patients newly diagnosed with myelodysplastic syndromes. Leuk. Res. 42, 7–12 (2016).
44. Hemmat, M. et al. Submicroscopic deletion of 5q involving tumor suppressor genes (CTNNA1, HSPA9) and copy neutral loss
of heterozygosity associated with TET2 and EZH2 mutations in a case of MDS with normal chromosome and FISH results. Mol.
Cytogenet. 7, 35 (2014).
45. Patricia, C. et al. Ubiquitin carboxyl-terminal esterase L1 (UCHL1) is associated with stem-like cancer cell functions in pediatric
high-grade glioma. PLoS ONE 12(5), e0176879. https://doi.org/10.1371/journal.pone.0176879 (2017).
46. Barrett, A. J. & Sloand, E. Autoimmune mechanisms in the pathophysiology of myelodysplastic syndromes and their clinical
relevance. Hematologica. 94(4), 449–451 (2009).
47. Feng, X. et al. Cytokine signature profiles in acquired aplastic anemia and myelodysplastic syndromes. Haematologica 96, 602–606
(2011).
48. Yeung, C. et al. Impact of copy neutral loss of heterozygosity and total genome aberrations on survival in myelodysplastic syndrome.
Mod. Pathol. 31(4), 569–580 (2018).
49. Tiu, R. V. et al. Prognostic impact of SNP array karyotyping in myelodysplastic syndromes and related myeloid malignancies.
Blood 117(17), 4552–4560 (2011).
50. Dermody, J., Tolias, P. & Toruner, G. A. Chromosomal microarrays: Influential players in the diagnosis of developmental disorders.
Person Med. 9, 167–169 (2012).
51. Lalonde, E. et al. Unexpected allelic heterogeneity and spectrum of mutations in Fowler syndrome revealed by next-generation
exome sequencing. Hum. Mutat. 31, 918–923 (2010).
52. Pellagatti, A. et al. Deregulated gene expression pathways in myelodysplastic syndrome hematopoietic stem cells. Leukemia 24,
756–764 (2010).
53. Zanni, G. et al. Mutation of plasma membrane Ca2+ ATPase isoform 3 in a family with X-linked congenital cerebellar ataxia
impairs Ca2+ homeostasis. Proc. Natl. Acad. Sci. 109, 14514–14519 (2012).
Acknowledgements
The authors thank the patients for their voluntary participation. We also appreciate the possibility of carrying
out this study at the Replicon Research Center of the School of Agricultural Sciences and Biological Sciences of
the Pontifical Catholic University of Goiás in partnership with the Human Cytogenetics and Molecular Genetics
Laboratory of the Health Department of the State of Goiás. We are grateful for the broad collaboration with the
South American Institute of Diabetes and Obesity, associated with the medical school the University of Texas,
Rio Grande Valley, USA. We are also particularly grateful for the encouragement of the Goiás Research Support
Foundation and CAPES—The Coordination for the Improvement of Higher Education Personnel for granting
scholarships. A.D.C is a research fellow PQ2 from CNPq (National Council for Scientific and Technological
Development).
Author contributions
C.L.R., I.P.P., L.B.M., A.D.C. and C.C.S. designed the study. F.S.M.K. was the patients’ attending physician.
C.L.R., A.D.C., C.C.S. and I.P.P. performed the experiments. C.L.R., I.P.P., M.A.A.A and A.D.C. analyzed data
and performed the statistical analysis. C.L.R., I.P.P., S.S.S.P., T.E.H., C.C.S., A.M.A and A.D.C. contributed to
manuscript writing. All authors read and approved the final manuscript.
Competing interests
The authors declare no competing interests.
Scientific Reports | (2021) 11:2783 | https://doi.org/10.1038/s41598-021-81467-2 10
Vol:.(1234567890)www.nature.com/scientificreports/
Additional information
Correspondence and requests for materials should be addressed to C.L.R.
Reprints and permissions information is available at www.nature.com/reprints.
Publisher’s note Springer Nature remains neutral with regard to jurisdictional claims in published maps and
institutional affiliations.
Open Access This article is licensed under a Creative Commons Attribution 4.0 International
License, which permits use, sharing, adaptation, distribution and reproduction in any medium or
format, as long as you give appropriate credit to the original author(s) and the source, provide a link to the
Creative Commons licence, and indicate if changes were made. The images or other third party material in this
article are included in the article’s Creative Commons licence, unless indicated otherwise in a credit line to the
material. If material is not included in the article’s Creative Commons licence and your intended use is not
permitted by statutory regulation or exceeds the permitted use, you will need to obtain permission directly from
the copyright holder. To view a copy of this licence, visit http://creativecommons.org/licenses/by/4.0/.
© The Author(s) 2021
Scientific Reports | (2021) 11:2783 | https://doi.org/10.1038/s41598-021-81467-2 11
Vol.:(0123456789)You can also read