MRI Assessment of Complete Response to Preoperative Chemoradiation Therapy for Rectal Cancer: 2020 Guide for Practice from the Korean Society of ...
←
→
Page content transcription
If your browser does not render page correctly, please read the page content below
Original Article | Gastrointestinal Imaging
eISSN 2005-8330
https://doi.org/10.3348/kjr.2020.0483
Korean J Radiol 2020;21(7):812-828

MRI Assessment of Complete Response to Preoperative
Chemoradiation Therapy for Rectal Cancer: 2020 Guide
for Practice from the Korean Society of Abdominal
Radiology
Seong Ho Park, MD, PhD1, Seung Hyun Cho, MD, PhD2, Sang Hyun Choi, MD, PhD1,
Jong Keon Jang, MD, PhD1, Min Ju Kim, MD3, Seung Ho Kim, MD, PhD4, Joon Seok Lim, MD, PhD5,
Sung Kyoung Moon, MD, PhD6, Ji Hoon Park, MD, PhD7, Nieun Seo, MD, PhD5,
for the Korean Society of Abdominal Radiology Study Group for Rectal Cancer
1
 Department of Radiology and Research Institute of Radiology, University of Ulsan College of Medicine, Asan Medical Center, Seoul, Korea;
2
 Department of Radiology, Kyungpook National University Medical Center, School of Medicine, Kyungpook National University, Daegu, Korea;
3
 Department of Radiology, Ewha Womans University Seoul Hospital, Seoul, Korea; 4Department of Radiology, Inje University College of Medicine,
Haeundae Paik Hospital, Busan, Korea; 5Department of Radiology, Severance Hospital, Yonsei University College of Medicine, Seoul, Korea;
6
 Department of Radiology, Kyung Hee University Hospital, Seoul, Korea; 7Department of Radiology, Seoul National University College of Medicine,
Seoul National University Bundang Hospital, Seongnam, Korea

Objective: To provide an evidence-based guide for the MRI interpretation of complete tumor response after neoadjuvant
chemoradiation therapy (CRT) for rectal cancer using visual assessment on T2-weighted imaging (T2) and diffusion-weighted
imaging (DWI).
Materials and Methods: PubMed MEDLINE, EMBASE, and Cochrane Library were searched on November 28, 2019 to identify
articles on the following issues: 1) sensitivity and specificity of T2 or DWI for diagnosing pathologic complete response (pCR)
and the criteria for MRI diagnosis; 2) MRI alone vs. MRI combined with other test(s) in sensitivity and specificity for pCR;
and 3) tests to select patients for the watch-and-wait management. Eligible articles were selected according to meticulous
criteria and were synthesized.
Results: Of 1615 article candidates, 55 eligible articles (for all three issues combined) were identified. Combined T2 and
DWI performed better than T2 alone, with a meta-analytic summary sensitivity of 0.62 (95% confidence interval [CI], 0.43–
0.77; I2 = 80.60) and summary specificity of 0.89 (95% CI, 0.80–0.94; I2 = 92.61) for diagnosing pCR. The criteria for the
complete response on T2 in most studies had the commonality of remarkable tumor decrease to the absence of mass-like or
nodular intermediate signal, although somewhat varied, as follows: (near) normalization of the wall; regular, thin, hypointense
scar in the luminal side with (near) normal-appearance or homogeneous intermediate signal in the underlying wall; and
hypointense thickening of the wall. The criteria on DWI were the absence of a hyperintense signal at high b-value (≥ 800
sec/mm2) in most studies. The specific algorithm to combine T2 and DWI was obscure in half of the studies. MRI combined
with endoscopy was the most utilized means to select patients for the watch-and-wait management despite a lack of strong
evidence to guide and support a multi-test approach.
Conclusion: This systematic review and meta-analysis provide an evidence-based practical guide for MRI assessment of
complete tumor response after CRT for rectal cancer.
Keywords: Rectal cancer; Adenocarcinoma; Chemoradiotherapy; Chemoradiation; Response; Remission; Regression; CR;
Magnetic resonance imaging; Watch and wait; Wait and see; Organ preservation; Surveillance; Evidence; Guideline; Recommendation

Received: April 18, 2020 Revised: April 18, 2020 Accepted: April 19, 2020
Corresponding author: Seong Ho Park, MD, PhD, Department of Radiology and Research Institute of Radiology, University of Ulsan
College of Medicine, Asan Medical Center, 88 Olympic-ro 43-gil, Songpa-gu, Seoul 05505, Korea.
• Tel: (822) 3010-5984 • Fax: (822) 476-4719 • E-mail: parksh.radiology@gmail.com
This is an Open Access article distributed under the terms of the Creative Commons Attribution Non-Commercial License (https://
creativecommons.org/licenses/by-nc/4.0) which permits unrestricted non-commercial use, distribution, and reproduction in any medium,
provided the original work is properly cited.

812                                                                                              Copyright © 2020 The Korean Society of Radiology
Complete Response on MRI after CRT for Rectal Cancer

INTRODUCTION                                                     other types of tumor spread, such as nodal metastasis and
                                                                 tumor deposits.
   Preoperative neoadjuvant chemoradiation therapy (CRT)
is now a standard treatment for rectal cancers with a high       MATERIALS AND METHODS
risk of recurrence after surgery (1). CRT typically takes
5–6 weeks (long-course therapy), and surgery is generally        Literature Database Search
performed a few months later (1). Within the published              PubMed MEDLINE, EMBASE, and Cochrane Library were
literature, 10–25% of patients achieve pathologic complete       searched to identify articles related to any of the three
response (pCR) after CRT, i.e., no residual tumor on             issues as follows:
pathologic examination (1, 2). Evidence from observational          • Issue 1: sensitivity and specificity of MRI (T2 or DWI)
studies suggests that patients who are considered to have        for diagnosing pCR and the criteria for the MRI diagnosis
achieved pCR after CRT could be managed with careful                • Issue 2: comparison of MRI alone (T2 with or without
regular surveillance, referred to as the watch-and-wait          DWI) and MRI combined with other test(s) regarding
approach as an alternative to surgery (3-7). This watch-         sensitivity and specificity for pCR
and-wait approach may provide an opportunity to avoid               • Issue 3: tests used to select patients for the watch-and-
surgical complications, perioperative morbidity and              wait management.
mortality, and the need for a permanent stoma. It is critical       This study developed the search queries according to the
to carefully determine patients with no clinically apparent      PICO method (18) as much as applicable and jointly used
residual tumor with a thorough assessment of the treatment       hand-searching to enable an exhaustive literature search,
response to CRT, as the safety of the watch-and-wait             as shown in Table 1. Besides the basic search terms, this
approach is yet uncertain.                                       study also included extra terms that frequently appeared in
   Magnetic resonance imaging (MRI) is the imaging of            the relevant articles in the search query in ‘OR’ combination
choice in patients with rectal cancer to evaluate the            to expand the search (i.e., additional terms regarding P, I,
response to CRT, as well as for the initial pretreatment         and C as shown in Table 1). The last update of the literature
evaluation (7-9). Unlike well-established guidelines on the      database search was on November 28, 2019. The literature
pretreatment MRI evaluation of rectal cancers (10-15), there     database search covered both print publications and
is a relative scarcity of guidance for the MRI evaluation        electronic publications ahead of print.
of CRT response. Therefore, this study aimed to provide an          A total of 1615 articles were screened for eligibility, after
evidence-based guide from the Korean Society of Abdominal        deleting overlaps between the three databases (Fig. 1).
Radiology (KSAR) for the MRI assessment of complete tumor        The general criteria for article exclusion were as follows: 1)
response after CRT for rectal cancer. There is a variety of      duplicated publications; 2) articles not within the topics of
MRI techniques used for this purpose. Of those, this study       interest of this study; 3) not an original research or study
addresses visual assessment using T2-weighted imaging (T2)       protocol (for issue 3), such as case reports, review articles,
and diffusion-weighted imaging (DWI) because these are           editorials, letters, or comments; 4) articles without the full
the imaging methods that are widely used in the real-world       text available, such as conference abstract/proceedings;
practice at present. Other techniques—including radiomics,       and 5) articles written in other languages than English.
texture analysis, modeling using artificial intelligence (such   Articles that had any of these characteristics were excluded.
as machine learning or deep learning), quantitative lesion       Then, each issue-specific eligibility criteria were applied
metrics (such as volumetry or sum of the areas by drawing        to further select relevant articles, as explained later in the
the lesion boundary), quantitative diffusion analysis (such      corresponding sections. The article screening and selection
as apparent diffusion coefficient, kurtosis coefficient, and     were performed by one of eight authors. In any case, where
intravoxel incoherent motion parameters), and perfusion          there was an ambiguity, another reviewer was invited to
analysis by dynamic-contrast enhanced imaging—were not           jointly review the article and arrive at a consensus. The
considered as these are mostly still in research territory       nine authors also performed data extraction from eligible
due to limitations in generalizability, reproducibility, and     articles for meta-analysis and systematic review in the same
practicality (16, 17). Additionally, this study focuses on the   manner, i.e., data extraction by one of the eight authors
evaluation of the primary tumor site and does not cover          and double-checked by the remaining author to make a

kjronline.org     https://doi.org/10.3348/kjr.2020.0483                                                                     813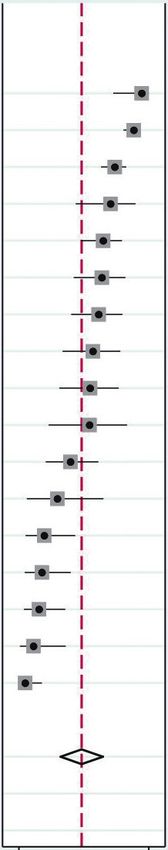
Park et al.

Table 1. Query for Literature Database Search
                                        Query for Issues 1 and 2                                              Query for Issue 3
      PICO
                  Search Concept                          Search Term                       Search Concept                 Search Term
P: A AND B     A. Patient with      #1: “Rectal Neoplasms”[Mesh]                     A. P atient with       #1: “Rectal Neoplasms”[Mesh]
 AND C            rectal cancer:     #2: (Colorectal[TW] OR Rectal[TW] OR rectum[TW]     rectal cancer:      #2: (Colorectal[TW] OR Rectal[TW] OR
                  #1 OR #2                OR Anus[TW]) AND (Neoplasm*[TW] OR              #1 OR #2                 rectum[TW] OR Anus[TW]) AND
                                          neoplasia[TW] OR cancer*[TW] OR tumor*[TW]                               (Neoplasm*[TW] OR neoplasia[TW]
                                          OR tumour*[TW] OR Carcinoma*[TW] OR                                      OR cancer*[TW] OR tumor*[TW] OR
                                          Malignan*[TW])                                                           tumour*[TW] OR Carcinoma*[TW]
                                                                                                                   OR Malignan*[TW])
               B. Undergoing        #3: “Chemoradiotherapy”[Mesh]                       B. Undergoing       #3: “Chemoradiotherapy”[Mesh]
                  chemoradiation     #4: chemoradiotherap*[TW] OR                           chemoradiation   #4: chemoradiotherap*[TW] OR
                  therapy: #3             chemoradiation*[TW] OR                             therapy: #3           chemoradiation*[TW] OR
                  OR #4 OR #5             radiochemotherap*[TW] OR chemo-rad*[TW]            OR #4 OR #5           radiochemotherap*[TW] OR
                  OR #6                   OR Radio-Chemo*[TW] OR “CCRT”[TW] OR               OR #6                 chemo-rad*[TW] OR Radio-
                                          “CCRTx”[TW]                                                              Chemo*[TW] OR “CCRT”[TW] OR
                                                                                                                   “CCRTx”[TW]
                                     #5: chemotherap*[TW] AND (radiation therap*[TW]                         #5: chemotherap*[TW] AND (radiation
                                          OR Radiotherap*[TW])                                                     therap*[TW] OR Radiotherap*[TW])
                                     #6: “Neoadjuvant Therapy”[Mesh] OR                                      #6: “Neoadjuvant Therapy”[Mesh] OR
                                          neoadjuvant*[TW]                                                         neoadjuvant*[TW]
               C. Pathologic        #7: Basic terms: complete respon*[TW] OR           C. M
                                                                                             anaged by       #14: “Watchful Waiting”[Mesh] OR
                  complete                complete remission*[TW]                           watch and wait          “Watch and wait”[TW] OR
                  response to        #8: Additional terms to expand the search:            approach after          “Wait-and-see”[TW] OR
                  therapy:                completed respon*[TW] OR pathologic               therapy: #14            “Watch & Wait”[TW]
                  #7 OR #8                respon*[TW] OR Clinical respon*[TW] OR
                                          “tumour regression grade”[TW] OR “tumor
                                          regression grade”[TW] OR “tumour regression
                                          grades”[TW] OR “tumor regression grades”[TW]
                                          OR viable[TW]
I and C        MRI or other          #9: Basic terms: Magnetic Resonance            Not applicable
                typical tests            Imaging[Mesh] OR Magnetic Resonanc*[TW] OR
                 (endoscopy,              MRI[TW] OR MRIs[TW] OR MR[TW]
                 endorectal          #10: Additional terms to expand the search:
                 ultrasound, CT,           “diffusion-weighted”[TW] OR “DWI”[TW] OR
                or PET): #9 OR             “T2-weighted”[TW]
                #10 OR #11 OR        #11: “Colonoscopy”[Mesh] OR colonoscop*[TW]
                #12 OR #13                 OR Endoscop*[TW] OR Ultrasound*[TW]
                                           OR ultrasonograp*[TW] OR EUS[TW] OR
                                           Endosonography[Mesh] OR Endosonograp*[TW]
                                     #12: “Tomography, X-Ray Computed”[Mesh]
                                           OR CT[TI] OR Computed tomograp*[TW]
                                           OR computer assisted tomograp*[TW] OR
                                           computerised tomograp*[TW]
                                     #13: “Positron-Emission Tomography”[Mesh] OR
                                           “Positron-Emission”[TW] OR PET[TW]
O              Not applied, i.e., hand search of relevant articles                       Not applicable
Others         Written in English    #15: English[Lang]                                  Written in English   #15: English[Lang]
Final search   P AND (I and C) AND Others                                                P AND Others
  query
Table shows search query for PubMed MEDLINE. Search in EMBASE and Cochrane Library was performed using same search queries except
for minor modifications related to differences in design of three databases. We additionally limited EMBASE search to article, article in
press, and review by adding “AND (‘article’/it OR ‘article in press’/it OR ‘review’/it)” to query for more effective search as EMBASE includes
a lot more conference abstracts/proceedings than PubMed MEDLINE. We could not use language restriction to English (#15) for Cochrane
Library as it did not have this functionality. CT = computed tomography, PET = positron-emission tomography

814                                                                                        https://doi.org/10.3348/kjr.2020.0483      kjronline.org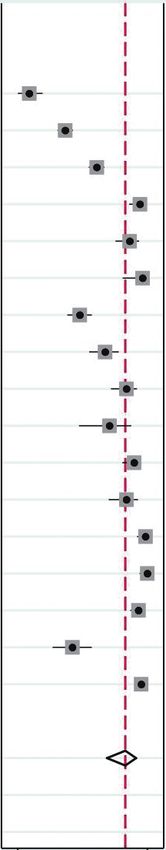
Complete Response on MRI after CRT for Rectal Cancer

                                                  Records identified through database searching
                                         PubMed MEDLINE (n = 1152), EMBASE (n = 939), Cochrane (n = 272)

                                                Records after duplicates between databases removed

                                                                  Records screened                              Records excluded
                                                                     (n = 1615)                                    (n = 1187)

                                                              Full-text articles assessed
                                                                                                           Full-text articles excluded
                                                                     for eligibility
                                                                                                                    (n = 373)
                                                                       (n = 428)

                                                               Issue 2: original research
                 Issue 1: original research                                                                 Issue 3: original research
                                                              of MRI alone vs. combined
                    of MRI (T2 or DWI)                                                                         or study protocol of
                                                               MRI and other test(s) in
                accuracy for diagnosing pCR                                                                watch-&-wait management
                                                             accuracy for diagnosing pCR
                          (n = 23)                                                                                   (n = 32)
                                                                        (n = 4*)

Fig. 1. Flow diagram of literature search. Four articles selected for issue 2 (asterisk) are also included in 23 articles selected for issue 1.
DWI = diffusion-weighted imaging, MRI = magnetic resonance imaging, pCR = pathologic complete response, T2 = T2-weighted imaging

consensus for any ambiguities. All the nine people who
                                                                                                                                Reference standard:
participated in the literature review were board-certified                                              Reference standard:
                                                                                                                                       not pCR
                                                                                                               pCR
radiologists with expertise in the subject matters as well as                                                                  (i.e., residual cancer)
in the systematic review of the literature.                                          Index test:
                                                                                                                a                        c
                                                                                  complete response

Issue 1: Sensitivity and Specificity of MRI (T2 or                                    Index test:
                                                                                                                b                        d
                                                                                not complete response
DWI) for Diagnosing pCR and the Criteria for the MRI
Diagnosis                                                                                                             Sensitivity for pCR = a / (a + b)
                                                                                                                      Specificity for pCR = d / (c + d)
  For this analysis, eligible articles were selected by
further applying the following issue-specific criteria:                      Fig. 2. Diagnostic 2-by-2 table for pCR.
1) accurate, sufficient details to construct a diagnostic
2-by-2 table of visual interpretation of T2 or DWI and                       because ROC analysis alone, unaccompanied by a suggestion
the reference standard findings for pCR (Fig. 2); 2) at                      of a specific cutoff, can only show a theoretical diagnostic
least ten patients for both patients with pCR and those                      performance over the entire range of possible cutoff
without pCR; 3) technical requirement for MRI according                      values. Therefore, it cannot be directly translated into daily
to the 2016 recommendation from the European Society                         practice.
of Gastrointestinal and Abdominal Radiology (ESGAR),
including use of an external surface coil on a 1.5T or 3T                    Meta-Analysis of the Sensitivity and Specificity of T2,
systems and, in case of DWI, use of a high b-value of ≥ 800                  DWI, and Combined T2 and DWI for Diagnosing pCR
sec/mm2 (16); and 4) MRI obtained after the completion                         One article may contain more than one set of the 2-by-
of CRT. Articles not fulfilling any of these criteria were                   2 results (Fig. 2). Then, the data for meta-analysis were
excluded. As shown in Figure 2, pCR instead of residual                      chosen as follows: the main result was considered when
cancer was considered as the target condition to diagnose,                   both the main result for the entire subjects and result(s)
and the sensitivity and specificity were defined accordingly.                for the subgroup(s) were present; if one article presents
Studies that reported receiver operating characteristic (ROC)                parallel results for > 1 independent patient groups, each
analysis alone without presenting any specific cutoff to use                 was considered as a separate study; and in case of a multi-
for the binary diagnosis were excluded. The exclusion was                    reader study or a study suggesting > 1 discrete diagnostic

kjronline.org        https://doi.org/10.3348/kjr.2020.0483                                                                                          815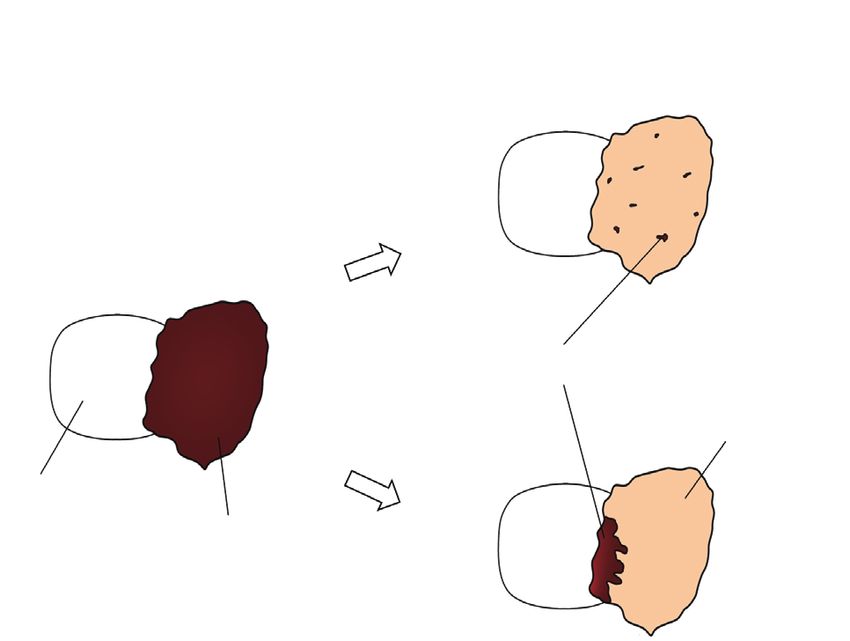
Park et al.

criterion, the result of the reader or the diagnostic criterion   15.1 was used, with p < 0.05 considered statistically
that yielded the highest Youden index value was considered.       significant.
  The presence of heterogeneity between studies
concerning sensitivity and specificity was assessed using         Issue 3: Tests Used to Select Patients for the Watch-and-
Higgins I2 statistics (19, 20). Heterogeneity by threshold        Wait Management
effect was analyzed primarily by visual assessment of the           Articles that collected patients to offer the watch-and-
coupled forest plots of sensitivity and specificity. It was       wait management after CRT for rectal cancer and mentioned
further tested using the Spearman correlation coefficient         the use of specific test(s) for the patient selection, for
between sensitivity and 1-specificity (20, 21). The summary       example, a clear mention of MRI, endoscopy, etc., instead of
sensitivity and specificity and their 95% confidence              a vague description of “various imaging modalities,” besides
intervals (CIs) were obtained using a bivariate random-           basic physician assessment and physical examination (such
effects model (20, 22). These analyses were performed             as digital rectal examination), were collected. Both original
separately for T2, DWI, and combined T2 and DWI.                  research studies and research protocols describing a plan
  Of the eligible studies, a subgroup of studies that             for such a study were identified. The two types of articles
reported sensitivity and specificity for pCR both for T2 and      were checked regarding any overlap, i.e., a publication
for combined T2 and DWI in the same group of patients             of research that corresponds to a previously published
were identified. T2 and combined T2 and DWI were                  protocol. Specific tests that were used to select patients
compared regarding the sensitivity and specificity for pCR        for the watch-and-wait management, as described in the
in this subgroup of studies using a joint-model bivariate         published articles, were summarized.
meta-regression.
  The statistical analyses were conducted using Stata             RESULTS
version 15.1 (StataCorp LLC, College Station, TX, USA), with
p < 0.05 considered statistically significant.                    Article Selection
                                                                    The article screening and selection processes are
Systematic Review of the Criteria for the MRI Diagnosis of        summarized in Figure 1. A total of 23 articles (23-45)
Complete Tumor Response                                           were identified regarding issues 1 and 2, and a total of 32
  The criteria for diagnosing complete tumor response on          articles were identified for issue 3 (6, 46-76).
either T2 or DWI described in the studies identified were
categorized, and the number of articles for each category         Issue 1: Sensitivity and Specificity of MRI (T2 or
was counted. The methods of combining the results of the          DWI) for Diagnosing pCR and the Criteria for the MRI
two imaging methods were recorded for studies reporting           Diagnosis
the sensitivity and specificity of combined T2 and DWI.              Of the 23 eligible articles (23-45), 20 were reports of
                                                                  retrospective research studies, and three were prospective
Issue 2: Comparison of MRI alone (T2 with or without              studies. They included a total of 40–514 patients (median,
DWI) and MRI Combined with Other Test(s) Regarding                103 patients); with 10–103 patients with pCR (median,
Sensitivity and Specificity for pCR                               21 patients) and 29–411 patients (median, 83 patients)
  We considered endoscopy, endorectal ultrasound, and             without pCR (i.e., residual tumor). There were 17 studies,
positron-emission tomography (PET, including PET, PET-            five studies (a study by Cai et al. (25) was counted twice as
CT, and PET-MR) as other tests used in combination with           it had separate results for two independent patient groups,
MRI. Reports of studies that evaluated the sensitivity and        each of which was considered separately for the meta-
specificity for diagnosing pCR both for MRI alone and for         analysis), and eight studies that reported the sensitivity
MRI combined with any of these other tests in the same            and specificity for diagnosing pCR for T2, DWI, and
group of patients were identified. Otherwise, the article         combined T2 and DWI, respectively.
selection criteria were the same as those explained earlier
in issue 1. MRI alone and MRI combined with other test(s)         Meta-Analysis of the Sensitivity and Specificity of T2,
were compared regarding sensitivity and specificity for pCR       DWI, and Combined T2 and DWI for Diagnosing pCR
using a joint-model bivariate meta-regression. Stata version       The meta-analytic results of the 17 studies reporting the

816                                                                          https://doi.org/10.3348/kjr.2020.0483   kjronline.org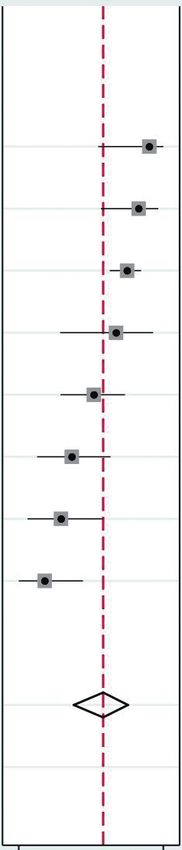
Complete Response on MRI after CRT for Rectal Cancer

                 Study ID                        Sensitivity (95% CI)                              Study ID                      Specificity (95% CI)

      Bhoday (2016) (24)                         0.94 (0.73–1.00)                       Bhoday (2016) (24)                       0.25 (0.18–0.33)
           Yoo (2020) (44)                       0.88 (0.81–0.94)                            Yoo (2020) (44)                     0.48 (0.43–0.53)
         Jang (2018) (29)                        0.74 (0.63–0.83)                          Jang (2018) (29)                      0.68 (0.63–0.73)
            Ko (2019) (32)                       0.71 (0.44–0.90)                             Ko (2019) (32)                     0.95 (0.88–0.99)
          Kim (2018) (30)                        0.65 (0.48–0.79)                           Kim (2018) (30)                      0.89 (0.80–0.95)
     Santiago (2020) (39)                        0.64 (0.43–0.82)                      Santiago (2020) (39)                      0.97 (0.84–1.00)
      Sclafani (2017) (42)                       0.62 (0.41–0.80)                       Sclafani (2017) (42)                     0.57 (0.49–0.65)
       Horvat (2018) (28)                        0.57 (0.34–0.78)                        Horvat (2018) (28)                      0.73 (0.63–0.82)
        Nahas (2019) (38)                        0.55 (0.32–0.77)                         Nahas (2019) (38)                      0.87 (0.77–0.93)
          Kim (2009) (31)                        0.55 (0.23–0.83)                           Kim (2009) (31)                      0.76 (0.56–0.90)
    Lambregts (2011) (34)                        0.40 (0.21–0.61)                     Lambregts (2011) (34)                      0.92 (0.84–0.96)
       Sassen (2013) (40)                        0.30 (0.07–0.65)                        Sassen (2013) (40)                      0.87 (0.75–0.94)
          Aker (2018) (23)                       0.20 (0.06–0.44)                           Aker (2018) (23)                     0.99 (0.93–1.00)
         Zhan (2015) (45)                        0.18 (0.05–0.40)                          Zhan (2015) (45)                      1.00 (0.95–1.00)
          Kuo (2012) (33)                        0.16 (0.05–0.36)                           Kuo (2012) (33)                      0.94 (0.89–0.98)
          Wan (2019) (43)                        0.12 (0.01–0.36)                           Wan (2019) (43)                      0.52 (0.40–0.65)
        Hanly (2014) (27)                        0.05 (0.01–0.18)                         Hanly (2014) (27)                      0.96 (0.93–0.98)

                Combined                         0.49 (0.33–0.65)                                 Combined                       0.86 (0.74–0.93)
                                                 Q = 174.25, df = 16.00, p < 0.01                                                Q = 641.85, df = 16.00, p < 0.01
                                                 I2 = 90.82 (87.54–94.10)                                                        I2 = 97.51 (96.91–98.10)
                             0.0         1.0                                                                   0.2         1.0
                               Sensitivity                                                                       Specificity
A

                    Study ID                         Sensitivity (95% CI)                             Study ID                     Specificity (95% CI)

             Cai (2014) (25)                         1.00 (0.81–1.00)                          Cai (2014) (25)                     0.81 (0.67–0.91)
             Cai (2014) (25)                         0.96 (0.80–1.00)                          Cai (2014) (25)                     0.80 (0.66–0.89)
    Sathyakumar (2016) (41)                          0.82 (0.48–0.98)                 Sathyakumar (2016) (41)                      0.94 (0.84–0.99)
          Horvat (2018) (28)                         0.63 (0.38–0.84)                       Horvat (2018) (28)                     0.63 (0.52–0.73)
        Santiago (2020) (39)                         0.60 (0.39–0.79)                     Santiago (2020) (39)                     0.76 (0.58–0.89)

                   Combined                          0.86 (0.63–0.96)                                Combined                      0.80 (0.69–0.88)
                                                     Q = 21.01, df = 4.00, p < 0.01                                                Q = 22.70, df = 4.00, p < 0.01
                                                     I2 = 80.96 (64.84–97.09)                                                      I2 = 82.38 (67.73–97.03)
                               0.4             1.0                                                               0.5         1.0
                                   Sensitivity                                                                     Specificity
B
Fig. 3. Coupled forest plots of sensitivity and specificity of MRI for diagnosing pCR.
A. T2. B. DWI. Cai (2014) (25) is included twice as it contains separate results for two independent patient groups, each of which was considered
separately for meta-analysis. CI = confidence interval

sensitivity and specificity of T2 for diagnosing pCR (23,                             p = 0.056). The summary sensitivity and specificity were
24, 27-34, 38-40, 42-45) are summarized in Figure 3A as                               0.49 (95% CI, 0.33–0.65) and 0.86 (95% CI, 0.74–0.93),
coupled forest plots. There was a large study heterogeneity                           respectively.
both for the sensitivity and the specificity (I2 = 90.82                                The meta-analytic results of the five studies reporting the
[95% CI, 87.54–94.10] for sensitivity and I2 = 97.51 [95%                             sensitivity and specificity of DWI for diagnosing pCR (25,
CI, 96.91–98.10] for specificity). The coupled forest plots                           28, 39, 41) are summarized in Figure 3B as coupled forest
revealed a mild inverse relationship between sensitivity and                          plots. There was a large study heterogeneity both for the
specificity, although the Spearman’s rho between sensitivity                          sensitivity and the specificity (I2 = 80.96 [95% CI, 64.84–
and 1-specificity was not statistically significant (0.472,                           97.09] for sensitivity and I2 = 82.38 [95% CI, 67.73–97.03]

kjronline.org           https://doi.org/10.3348/kjr.2020.0483                                                                                                 817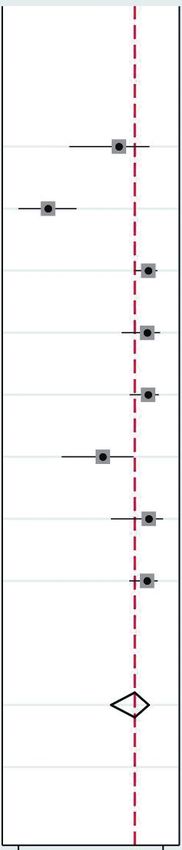
Park et al.

              Study ID                              Sensitivity (95% CI)                          Study ID                              Specificity (95% CI)

       Kim (2009) (31)                              0.91 (0.59–1.00)                       Kim (2009) (31)                              0.83 (0.64–0.94)
    Horvat (2018) (28)                              0.84 (0.60–0.97)                    Horvat (2018) (28)                              0.56 (0.45–0.67)
 Lambregts (2018) (35)                              0.77 (0.66–0.86)                 Lambregts (2018) (35)                              0.94 (0.88–0.97)
    Sassen (2013) (40)                              0.70 (0.35–0.93)                    Sassen (2013) (40)                              0.93 (0.84–0.98)
 Lambregts (2011) (34)                              0.56 (0.35–0.76)                 Lambregts (2011) (34)                              0.94 (0.87–0.98)
    Gollub (2019) (26)                              0.42 (0.20–0.67)                    Gollub (2019) (26)                              0.77 (0.61–0.88)
      Maas (2015) (37)                              0.35 (0.14–0.62)                      Maas (2015) (37)                              0.94 (0.80–0.99)
        Liu (2018) (36)                             0.25 (0.09–0.49)                        Liu (2018) (36)                             0.93 (0.87–0.97)

             Combined                               0.62 (0.43–0.77)                             Combined                               0.89 (0.80–0.94)
                                                    Q = 36.08, df = 7.00, p < 0.01                                                      Q = 94.73, df = 7.00, p < 0.01
                                                    I2 = 80.60 (67.85–93.35)                                                            I2 = 92.61 (88.90–96.32)
                          0.1                 1.0                                                             0.5                 1.0
                                Sensitivity                                                                         Specificity
C
Fig. 3. Coupled forest plots of sensitivity and specificity of MRI for diagnosing pCR.
C. Combined T2 and DWI. CI = confidence interval

for specificity). The threshold effect was not apparent                              Systematic Review of the Criteria for the MRI Diagnosis of
(Spearman’s rho between sensitivity and 1-specificity =                              Complete Tumor Response
-0.600, p = 0.285). The summary sensitivity and specificity                             The criteria for diagnosing complete tumor response on
were 0.86 (95% CI, 0.63–0.96) and 0.80 (95% CI, 0.69–                                either T2 or DWI and the methods of combining the results
0.88), respectively.                                                                 of T2 and DWI, as reported in the 23 eligible articles (23-
  The meta-analytic results of the eight studies reporting                           45), are summarized in Table 3. For the T2, most studies
the sensitivity and specificity of combined T2 and DWI for                           used the absence of visible tumor signal as the criteria.
diagnosing pCR (26, 28, 31, 34-37, 40) are summarized in                             Meanwhile, the exact definitions and strictness for the
Figure 3C as coupled forest plots. There was a large study                           absence of visible tumor varied among studies, ranging
heterogeneity both for the sensitivity and the specificity                           from complete normalization to hypointense thickening
(I2 = 80.60 [95% CI, 67.85–93.35] for sensitivity and I2 =                           (i.e., dense fibrosis) of the wall in the tumor bed. For DWI,
92.61 [95% CI, 88.90–96.32] for specificity). The threshold                          most articles adopted the absence of a hyperintense signal
effect was not apparent (Spearman’s rho between sensitivity                          on high b-value (≥ 800 sec/mm2) DWI in the former tumor
and 1-specificity = 0.333, p = 0.420). The summary                                   location. The methods of combining the results of T2 and
sensitivity and specificity were 0.62 (95% CI, 0.43–0.77)                            DWI were obscure in half of the studies. Those studies
and 0.89 (95% CI, 0.80–0.94), respectively.                                          that specifically reported the rules to combine T2 and DWI
  Four studies reported the sensitivity and specificity for                          considered the absence of residual tumor on both T2 and
pCR both for T2 and for combined T2 and DWI in the same                              DWI as complete tumor response or primarily followed
group of patients (28, 31, 34, 40). The details are provided                         T2 findings and referred to DWI when T2 findings were
in Table 2. None of the individual studies explicitly reported                       equivocal.
statistical comparisons regarding sensitivity and specificity
between T2 and combined T2 and DWI. The meta-analytic                                Issue 2: Comparison of MRI Alone (T2 with or without
comparison revealed a significant difference between the                             DWI) and MRI Combined with Other Test(s) Regarding
two imaging techniques (p = 0.01). According to the sample                           Sensitivity and Specificity for pCR
values alone reported in the individual studies (i.e., without                         Four studies reported the sensitivity and specificity for pCR
regard to statistical comparison), three studies reported an                         both for MRI alone and for MRI combined with other test(s)
increase in both sensitivity and specificity with combined                           in the same group of patients (32, 33, 36, 37). The details
T2 and DWI compared with T2 alone (31, 34, 40).                                      are provided in Table 4. The meta-analytic comparison
                                                                                     revealed a significant difference between MRI alone and
                                                                                     MRI combined with other test(s) (p = 0.02). According to
                                                                                     the sample values alone reported in the individual studies,

818                                                                                               https://doi.org/10.3348/kjr.2020.0483                 kjronline.org
Complete Response on MRI after CRT for Rectal Cancer

Table 2. Studies Reporting Sensitivity and Specificity for Diagnosing pCR both for T2 and for Combined T2 and DWI in Same Group
of Patients
 First Author                                 Sensitivity, Specificity,                                       Method to Combine T2
                  Study Type    MR Method                                       Comparative Result
    (Year)                                       %*           %*                                                and DWI Results
Kim (2009)      Retrospective T2                 54.5          75.9       Significantly higher overall  T2 findings as primary results,
 (31)                                           (6/11)       (22/29)       accuracy for combined T2     with DWI to override T2 when
                               Combined T2        90.9         82.8         and DWI compared with T2      T2 findings are equivocal or to
                                and DWI         (10/11)      (24/29)        (p = 0.0313 by McNemar test) increase reader confidence if T2
                                                                                                          and DWI findings are consistent
Lambregts    Retrospective T2                     40.0         91.6       No statistical comparisons     Obscure
 (2011) (34)                                    (10/25)      (87/95)       regarding binary
                               Combined T2        56.0         93.7        interpretations. Area under
                                and DWI         (14/25)      (89/95)       ROC curve was 0.8 for
                                                                           combined T2 and DWI and
                                                                           0.76 for T2 (p = 0.39)
Sassen (2013) Retrospective T2                   30.0          86.7       No statistical comparisons     Obscure
 (40)                                           (3/10)       (52/60)       regarding binary
                               Combined T2       70.0          93.3        interpretations. Area under
                                and DWI         (7/10)       (56/60)       ROC curve was 0.89 for
                                                                           combined T2 and DWI and
                                                                           0.77 for T2 (p = 0.005)
Horvat (2018) Retrospective T2                    57.1         73.1       No statistical comparisons     Obscure†
 (28)                                           (12/21)      (68/93)
                            Combined T2           84.2         56.3
                             and DWI            (16/19)      (49/87)
Meta-analytic NA               T2                 47           84    p = 0.01 from joint-model           NA
 summary                                       (95% CI,     (95% CI, b ivariate meta-regression
                                                30–63)       72–95)   analysis
                               Combined T2        74           85
                                and DWI        (95% CI,     (95% CI,
                                                60–88)       74–96)
*Numbers in parentheses are number of patients unless specified otherwise, †Article states complete tumor response on MRI when both
T2 and DWI were negative for residual tumor. However, reported results are more compatible with combined MRI result of complete tumor
response when T2 or DWI was negative for residual tumor. CI = confidence interval, DWI = diffusion-weighted imaging, MR = magnetic
resonance, NA = not applicable, pCR = pathologic complete response, ROC = receiver operating characteristic, T2 = T2-weighted imaging

three studies showed higher specificity but lower sensitivity             DISCUSSION: KSAR GUIDE
for pCR when MRI was combined with other test(s) (32,
33, 36), whereas one study reported an increase in both                   Sensitivity and Specificity of MRI for Diagnosing pCR
sensitivity and specificity when endoscopy and digital rectal               There is a limitation in interpreting the meta-analytic
examination were also used combined with MRI (37).                        summary sensitivity and specificity of T2 or DWI for
                                                                          diagnosing pCR due to the large heterogeneity in the
Issue 3: Tests Used to Select Patients for the Watch-and-                 published results. Study heterogeneity is common for
Wait Management                                                           systematic review and meta-analysis of diagnostic test
   Twenty-nine original research articles (6, 48-65, 67-76)               accuracy (77). Determining the specific causes for the
and three reports of research protocols (46, 47, 66) were                 heterogeneity is difficult because, in general, various
eligible. There was no overlap between them. The details                  factors are intertwined. Within the limitations, MRI using
are summarized in Table 5. Almost all studies adopted MRI                 visual assessment of T2 overall had low sensitivity and
and endoscopy as the tests to select patients for the watch-              moderately high specificity for diagnosing pCR after CRT
and-wait management despite some small variations among                   for rectal cancer. Adding DWI to T2 seems beneficial as it
studies.                                                                  increased the diagnostic performance to some extent.

kjronline.org      https://doi.org/10.3348/kjr.2020.0483                                                                              819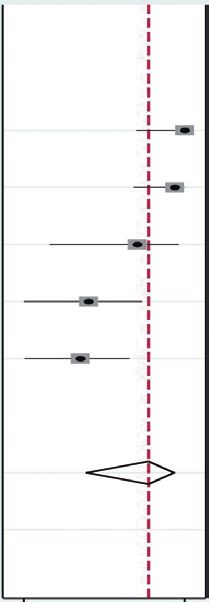
Park et al.
Table 3. Criteria for MRI Diagnosis of Complete Tumor Response
MR Method Criterion Number of Articles*
T2 Visible tumor signal is absent.
- Normalization of wall in tumor bed; no detectable mass, nodular intermediate signal, or wall 4
thickening (with individual layers of wall identified again)
- mrTRG1†: linear/crescentic thin scar in mucosa/submucosa or apparent normalization of wall in 5
tumor bed
-R
egular, hypointense scar in inner layer without bulging or breach by intermediate signal and 1
homogeneous intermediate signal in underlying layer of wall in tumor bed
- Normalization of wall or hypointense wall (with thickening) without intermediate signal in tumor bed 5
†
- mrTRG1–2 : mrTRG1 or dense fibrosis with no obvious residual tumor 4
Visible tumor signal may be present in small amount.
- mrTRG1–3†: mrTRG1–2 or > 50% fibrosis or mucin and visible residual intermediate tumor signal 1
- Residual intermediate tumor signal in ≤ 25% of tumor bed 1
Obscure 3
2
DWI No hyperintense signal on high b-value (≥ 800 sec/mm ) DWI in tumor bed 8
Hyperintense signal in ≤ 25% in tumor bed 1
Obscure 2
Combined When both T2 and DWI are negative for residual tumor 1
T2 and When both T2 and DWI are negative for residual tumor, with DWI being decisive if T2 findings are 2
DWI‡ equivocal
T2 findings as primary results, with DWI to override T2 when T2 findings are equivocal or DWI to increase 1
reader confidence if T2 and DWI findings are consistent
Obscure 4
†
*One article may present more than one criterion, mrTRG is magnetic resonance tumor regression grade system proposed by MERCURY
study group (24). Descriptions for mrTRG categories are according to most recent relevant papers (9, 24, 29), ‡Rules to combine T2 and
DWI results.
The diagnostic performance of MRI was moderate despite Interpretation of Complete Tumor Response on T2
the combined use of T2 and DWI, and the lack of visible A noteworthy finding is the somewhat heterogeneous
residual tumor on these imaging examinations does not criteria adopted by studies to diagnose complete tumor
necessarily mean pCR. This is primarily because of the response on T2. Despite mild diversity, most of them have
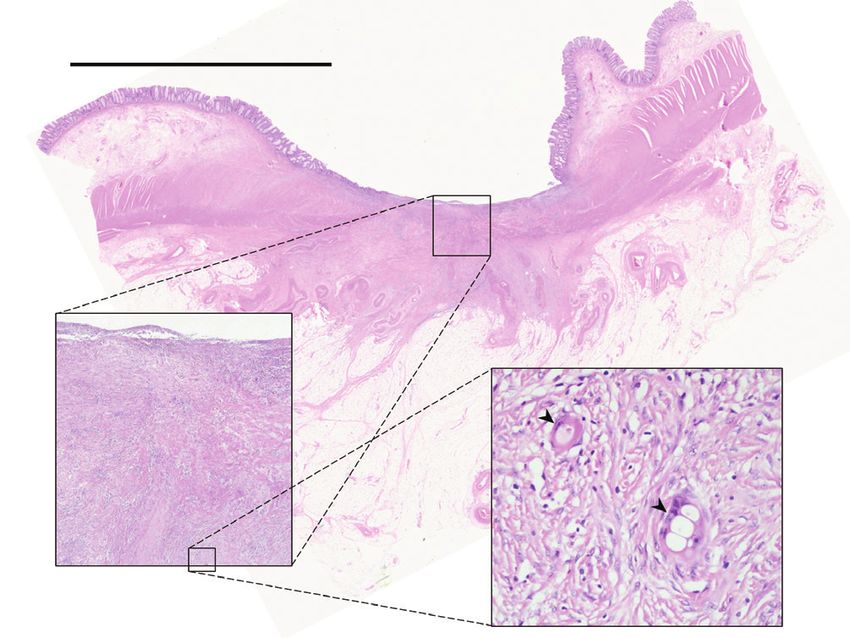
pathologic nature of the tumor response to CRT (Fig. 4) the commonality of a remarkable decrease of the tumor to
(78). Rectal cancer is known to respond to CRT through the absence of mass-like or nodular intermediate signals
fragmentation and shrinkage (78). Besides, a small minority (which would be perceived on T2 as residual tumor areas)
of originally non-mucinous rectal cancers may develop in the tumor bed. Post-CRT changes in rectal cancer, as
mucin lakes (8, 78). This mucinous transformation is seen on T2, as well as pathologically are more complex
considered a good prognostic sign, like fibrosis, and should than the simple characterization of normalization, fibrosis
be distinguished from the primarily mucinous subtype that (hypointense signal on T2), and residual tumor (intermediate
tends to show a poor response to CRT (8). Fragmentation, signal on T2) (8, 80). Complete normalization of the
i.e., the destruction of the main tumor mass and formation wall on MRI in the former tumor location is rare (8).
of small nests of tumor cells, is reported to occur in about Additionally, post-CRT changes without a residual tumor
40–80% of relevant cases and typically leaves microscopic tissue can create an intermediate signal that can mimic the
tumor fragments that are below the resolution of imaging intermediate signal of a residual tumor (80). Therefore, the
examinations (Figs. 5, 6) (78, 79). Consequently, if patients heterogeneous criteria adopted by the published studies
without visible residual tumor on MRI after CRT for rectal list the varied T2 appearances of post-CRT state without
cancer are offered the watch-and-wait management, a apparent residual cancer (Fig. 7, Supplementary Materials).
careful regular surveillance for tumor regrowth is crucial. The findings of (near) normalization of the wall and regular,
thin, hypointense scaring in the luminal side with (near)
820 https://doi.org/10.3348/kjr.2020.0483 kjronline.orgComplete Response on MRI after CRT for Rectal Cancer
Table 4. Studies Reporting Sensitivity and Specificity for Diagnosing pCR both for MRI Alone and for MRI Combined with Other
Test(s) in Same Group of Patients
First Author Sensitivity, Specificity, Method to Combine Results
Study Type Method Comparative Result
(Year) %* %* of MRI and Other Test(s)
Kuo (2012) Retrospective MRI (T2) 16.0 94.3 No meaningful Complete tumor response
(33) (4/25) (133/141) statistical comparisons if both MRI and other
MRI combined with 8.0 100 due to low statistical tests are negative for
endoscopy and routine (2/25) (141/141) power residual tumor
superficial re-biopsy
Maas (2015) Prospective MRI (combined T2 and 35.3 93.9 No statistical Obscure
(37) DWI) (6/17) (31/33) comparisons
MRI combined with 70.6 97.0
endoscopy and digital (12/17) (32/33)
rectal examination
Liu (2018) Prospective MRI (combined T2 and 25.0 93.3 No statistical Obscure
(36) DWI) (5/20) (97/104) comparisons
MRI combined with 10.0 100
endoscopy (2/20) (104/104)
Ko (2019) Retrospective MRI (T2) 70.6 95.3 No significant difference Obscure
(32) (12/17) (81/85) in sensitivity
MRI combined with 52.9 96.5 (p = 0.250) and
endoscopy (9/17) (82/85) specificity (p = 1.000)
Meta-analytic NA MRI 34 94 p = 0.02 from NA
summary (95% CI, (95% CI, joint-model bivariate
7–62) 91–97) meta-regression
MRI combined with 29 99 analysis
other test(s) (95% CI, (95% CI,
3–55) 98–100)
*Numbers in parentheses are number of patients unless specified otherwise.
normal-appearance or homogeneous intermediate signal false interpretations for T2 shine-through effects, a signal
in the underlying wall are reported to be less likely to from a different location than the former tumor site, and
harbor occult residual cancer compared to the finding of artefactual signals from susceptibility artifacts (8, 82).
hypointense thickening of the wall (39, 81). Considering
these factors, it would be desirable for the clinical reading Combining T2 and DWI
of a post-CRT MRI to describe not only the absence vs. Published studies suggest that combined use of T2
presence of visible residual tumor but also the specifics of and DWI is better than using T2 alone to diagnose pCR.
the MRI findings interpreted as the lack of visible residual Nonetheless, the exact algorithm to combine the results of
tumor. T2 and DWI was a bit obscure. If one places more emphasis
on the oncologic outcome of the patients, it is reasonable
Interpretation of Complete Tumor Response on DWI to use DWI to exclude patients suspicious of remaining
The interpretation of complete tumor response on DWI tumor after it was initially ruled out on T2. However, it is
was more uniform in the published studies as the absence yet uncertain if a simple intersection of the two results in
of a hyperintense signal on high b-value DWI in the former this manner, i.e., complete tumor response on MRI when
tumor location. Nevertheless, the lack of anatomical both T2 and DWI are negative for residual tumor, is ideal
details and the greater vulnerability to artifacts of DWI can as it would increase the specificity probably at the cost
introduce inaccuracy and variability in interpreting DWI of some decrease in sensitivity for pCR (i.e., increased
according to the level of experience of the readers (8, 82). likelihood of sending patients with pCR for radical surgery).
The readers should be particularly careful to avoid making The studies that reported both increased sensitivity and
kjronline.org https://doi.org/10.3348/kjr.2020.0483 821Park et al.
Table 5. Tests Used to Select Patients for Watch-and-Wait Management
Test Used* (+ = Used)
First Author (Year) Article Type
MRI Endoscopy EUS CT CEA PET EUA
Habr-Gama (1998) (50) Original research + + + +
Lambregts (2011) (59) Original research + + +
Maas (2011) (62) Original research + +
Dalton (2012) (48) Original research + +
Habr-Gama (2013) (52) Original research + + + +
Habr-Gama (2014) (51) Original research + + + +
Li (2015) (60) Original research + + + +
Smith (2015) (71) Original research + + +
Lai (2016) (58) Original research + + + +
Martens (2016) (63) Original research + +
Renehan (2016) (6) Original research + +
Rupinski (2016) (67) Original research + +
Sanchez Loria (2016) (68) Original research + +
Habr-Gama (2017) (54) Original research + +
Hupkens (2017) (57) Original research + +
Hupkens (2018) (56) Original research + +
Lin (2018) (61) Original research + + + +
Oh (2018) (65) Original research + + + + + +
São Julião (2018) (69) Original research + + + +
Sposato (2018) (74) Original research + +
Habr-Gama (2019) (53) Original research + +
Habr-Gama (2019) (55) Original research + + + + +
Nasir (2019) (64) Original research + +
São Julião (2019) (70) Original research + + + +
Smith (2019) (72) Original research +
Spiegel (2019) (73) Original research + + +
Strode (2019) (75) Original research + + + +
Yeom (2019) (76) Original research +
Dizdarevic (2020) (49) Original research + +
Barina (2017) (46) Study protocol† + + + +
Battersby (2017) (47) Study protocol† +
Rombouts (2017) (66) Study protocol† + +
*Evaluations that belong to basic physician assessment and physical examination such as digital rectal examination are not included. PET
includes PET, PET-CT, and PET-MR, †Corresponding research results have not been published yet. CEA = carcinoembryonic antigen, EUA =
examination under anesthesia, EUS = endorectal ultrasound
increased specificity for diagnosing pCR with the addition of This systematic review shows that the combination of MRI
DWI suggest that improved diagnostic performance without and endoscopy is the approach that is most favored by the
sacrificing any of both parameters is achievable (31, 34, experts in the field. This is consistent with the statistics
40), likely by combining the two results in some obscure collected by the International Watch and Wait Database
tailored manners. Therefore, further studies are needed to Consortium from 47 participating institutions in 15
explicitly determine the optimal algorithms to combine countries (7). Published studies show that false diagnosis
T2 and DWI. Hence, all readers can use the two imaging of pCR in patients who had a residual tumor could be
methods together more reliably and more effectively. reduced by combining MRI with other tests. However, it was
at the cost of reduced sensitivity for pCR. These results are
Combining MRI and other Tests expected with the approach of deciding a complete tumor
One approach to deal with the limited accuracy of MRI response if both MRI and other tests are all negative for
in diagnosing pCR would be to combine it with other tests. the residual tumor. This approach would be appropriate if
822 https://doi.org/10.3348/kjr.2020.0483 kjronline.orgComplete Response on MRI after CRT for Rectal Cancer
After CRT 1 cm
Fragmentation
Before CRT
1:1 scan view
Residual cancer
Radiation change
Shrinkage
Rectum
Cancer
x 40
x 400
Fig. 4. Schematic representation of patterns of rectal cancer Fig. 5. Microscopic size of residual tumor in case of near total
response to CRT. Fragmentation is destruction of main tumor mass regression after CRT for rectal cancer. Tiny nests of residual cancer
and formation of small nests of tumor cells, whereas shrinkage is cells are marked by arrowheads in most magnified (x 400) view. H&E
tumor reduction in direction of mucosa. CRT = chemoradiation therapy stain (Courtesy of Dr. Hee Sang Hwang in Department of Pathology, Asan
Medical Center, University of Ulsan College of Medicine, Seoul, Korea).
H&E = hematoxylin and eosin
1 cm
1:1 scan view
x 100
A B
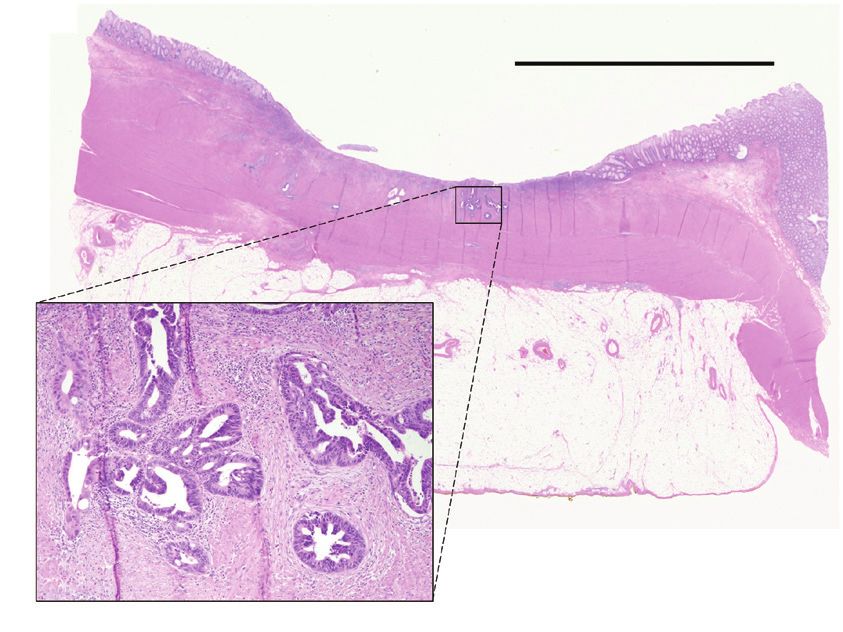
Fig. 6. Microscopic size of residual tumor in case of moderate regression after CRT for rectal cancer.
A. Small glands of residual cancer cells are noted in tumor bed. H&E stain (Courtesy of Dr. Hee Sang Hwang in Department of Pathology, Asan
Medical Center, University of Ulsan College of Medicine, Seoul, Korea). B. Residual tumor is still too small to be seen on MRI, albeit larger than
that of near total regression as shown in Figure. 5. Therefore, wall in tumor bed (arrowheads) appears essentially normal on MRI after CRT.
oncologic outcome and safety are the concern. However, complete tumor response on MRI with respect to the
compared with the use of a single test, this approach would primary tumor, the entire clinical decision of complete
deprive an opportunity for less invasive management in tumor response requires the same evaluation for nodal
more patients who have achieved pCR. There are yet limited metastasis and tumor deposits. To our knowledge, there
data to confirm if and how a multi-test approach could is not enough data in the literature to draw an evidence
increase the performance for diagnosing pCR and avoid synthesis on the evaluation for nodal metastasis and tumor
sacrificing the sensitivity or the specificity. Therefore, deposits. Nevertheless, ESGAR has recently proposed as an
further investigations are needed to determine the most expert consensus opinion that all nodes with a short-axis
effective strategy to combine different tests to select diameter < 5 mm and ≥ 5 mm on post-CRT MRI should be
patients for the watch-and-wait management. considered benign and suspicious, respectively (16).
Issues Uncovered Summary
Although this guide focuses on the interpretation of This systematic review and meta-analysis provide an
kjronline.org https://doi.org/10.3348/kjr.2020.0483 823Park et al. A B C D Fig. 7. Exemplary cases of complete tumor response, i.e., no visible residual tumor on T2 after CRT. A. Complete normalization of wall in tumor bed (arrowheads) after CRT. Pathology was total regression. B. Regular, thin, hypointense scar in luminal side and normalization of underlying wall in tumor bed (arrowheads) after CRT. Pathology was total regression. C. Regular, thin, hypointense scar in luminal side and a homogeneous, intermediate signal of underlying wall with mild thickening in tumor bed (arrowheads) after CRT. Pathology was total regression. D. Dense, hypointense thickening of wall in tumor bed (arrowheads) after CRT. Pathology was total regression. evidence-based practical guide for MRI assessment of Supplementary Materials complete tumor response after CRT for rectal cancer. Within the limitation of considerable heterogeneity in the The Data Supplement is available with this article at published results, with visual assessment, combined T2 and https://doi.org/10.3348/kjr.2020.0483. DWI seems more favorable than T2 alone in diagnosing pCR after CRT for rectal cancer and showed modest summary Conflicts of Interest sensitivity and moderately high summary specificity. The The authors have no potential conflicts of interest to criteria for complete tumor response on T2 may include disclose. (near) normalization of the wall; regular, thin, hypointense scar in the luminal side with (near) normal-appearance or ORCID iDs homogeneous intermediate signal in the underlying wall; Seong Ho Park and hypointense thickening of the wall in the former tumor https://orcid.org/0000-0002-1257-8315 location. The criterion for complete tumor response on DWI Seung Hyun Cho should be the absence of a hyperintense signal on high https://orcid.org/0000-0001-7617-7302 b-value DWI in the former tumor location. The optimal Sang Hyun Choi algorithms to combine the results of T2 and DWI have yet https://orcid.org/0000-0002-6898-6617 to be defined more explicitly. The use of MRI and endoscopy Jong Keon Jang was the most utilized means to select patients for the https://orcid.org/0000-0002-2938-6635 watch-and-wait management. However, the evidence is yet Min Ju Kim scarce regarding if a multi-test approach is beneficial and https://orcid.org/0000-0002-5431-6321 what combinations of the tests are most effective. 824 https://doi.org/10.3348/kjr.2020.0483 kjronline.org
Complete Response on MRI after CRT for Rectal Cancer

Seung Ho Kim                                                            2019;10:15
  https://orcid.org/0000-0002-9402-9642                              9. Seo N, Kim H, Cho MS, Lim JS. Response assessment with MRI
                                                                        after chemoradiotherapy in rectal cancer: current evidences.
Joon Seok Lim
                                                                        Korean J Radiol 2019;20:1003-1018
  https://orcid.org/0000-0002-0334-5042
                                                                    10. Gollub MJ, Arya S, Beets-Tan RG, dePrisco G, Gonen M,
Sung Kyoung Moon                                                        Jhaveri K, et al. Use of magnetic resonance imaging in rectal
  https://orcid.org/0000-0003-4831-3439                                 cancer patients: Society of Abdominal Radiology (SAR) rectal
Ji Hoon Park                                                            cancer disease-focused panel (DFP) recommendations 2017.
  https://orcid.org/0000-0002-6794-4909                                 Abdom Radiol (NY) 2018;43:2893-2902
                                                                    11. Cho SH, Cho YS, Choi IY, Ha HI, Huh J, Hur BY, et al.;
Nieun Seo
                                                                        KSAR Study Group for Rectal Cancer. Essential items for
  https://orcid.org/0000-0001-8745-6454
                                                                        structured reporting of rectal cancer MRI: 2016 consensus
                                                                        recommendation from the Korean Society of Abdominal
REFERENCES                                                              Radiology. Korean J Radiol 2017;18:132-151
                                                                    12. Kennedy ED, Milot L, Fruitman M, Al-Sukhni E, Heine G,
 1. Smith FM, Cresswell K, Myint AS, Renehan AG. Is “watch-and-         Schmocker S, et al. Development and implementation of a
    wait” after chemoradiotherapy safe in patients with rectal          synoptic MRI report for preoperative staging of rectal cancer
    cancer? BMJ 2018;363:k4472                                          on a population-based level. Dis Colon Rectum 2014;57:700-
 2. Maas M, Nelemans PJ, Valentini V, Das P, Rödel C, Kuo LJ,           708
    et al. Long-term outcome in patients with a pathological        13. Tudyka V, Blomqvist L, Beets-Tan RG, Boelens PG, Valentini
    complete response after chemoradiation for rectal cancer:           V, van de Velde CJ, et al. EURECCA consensus conference
    a pooled analysis of individual patient data. Lancet Oncol          highlights about colon & rectal cancer multidisciplinary
    2010;11:835-844                                                     management: the radiology experts review. Eur J Surg Oncol
 3. Dattani M, Heald RJ, Goussous G, Broadhurst J, São Julião           2014;40:469-475
    GP, Habr-Gama A, et al. Oncological and survival outcomes       14. Beets-Tan RG, Lambregts DM, Maas M, Bipat S, Barbaro
    in watch and wait patients with a clinical complete                 B, Caseiro-Alves F, et al. Magnetic resonance imaging
    response after neoadjuvant chemoradiotherapy for rectal             for the clinical management of rectal cancer patients:
    cancer: a systematic review and pooled analysis. Ann Surg           recommendations from the 2012 European Society of
    2018;268:955-967                                                    Gastrointestinal and Abdominal Radiology (ESGAR) consensus
 4. Dossa F, Chesney TR, Acuna SA, Baxter NN. A watch-and-wait          meeting. Eur Radiol 2013;23:2522-2531
    approach for locally advanced rectal cancer after a clinical    15. Taylor F, Mangat N, Swift IR, Brown G. Proforma-based
    complete response following neoadjuvant chemoradiation:             reporting in rectal cancer. Cancer Imaging 2010;10 Spec no
    a systematic review and meta-analysis. Lancet Gastroenterol         A:S142-S150
    Hepatol 2017;2:501-513                                          16. Beets-Tan RGH, Lambregts DMJ, Maas M, Bipat S, Barbaro B,
 5. Chadi SA, Malcomson L, Ensor J, Riley RD, Vaccaro CA, Rossi         Curvo-Semedo L, et al. Magnetic resonance imaging for clinical
    GL, et al. Factors affecting local regrowth after watch and         management of rectal cancer: updated recommendations
    wait for patients with a clinical complete response following       from the 2016 European Society of Gastrointestinal and
    chemoradiotherapy in rectal cancer (InterCoRe consortium):          Abdominal Radiology (ESGAR) consensus meeting. Eur Radiol
    an individual participant data meta-analysis. Lancet                2018;28:1465-1475
    Gastroenterol Hepatol 2018;3:825-836                            17. Bilgili MY. Reproductibility of apparent diffusion coefficients
 6. Renehan AG, Malcomson L, Emsley R, Gollins S, Maw A, Myint          measurements in diffusion-weighted MRI of the abdomen
    AS, et al. Watch-and-wait approach versus surgical resection        with different b values. Eur J Radiol 2012;81:2066-2068
    after chemoradiotherapy for patients with rectal cancer (the    18. Kim KW, Lee J, Choi SH, Huh J, Park SH. Systematic review
    OnCoRe project): a propensity-score matched cohort analysis.        and meta-analysis of studies evaluating diagnostic test
    Lancet Oncol 2016;17:174-183                                        accuracy: a practical review for clinical researchers–Part I.
 7. van der Valk MJM, Hilling DE, Bastiaannet E, Meershoek-             General guidance and tips. Korean J Radiol 2015;16:1175-
    Klein Kranenbarg E, Beets GL, Figueiredo NL, et al. Long-term       1187
    outcomes of clinical complete responders after neoadjuvant      19. Higgins JP, Thompson SG, Deeks JJ, Altman DG. Measuring
    treatment for rectal cancer in the International Watch & Wait       inconsistency in meta-analyses. BMJ 2003;327:557-560
    Database (IWWD): an international multicentre registry study.   20. Lee J, Kim KW, Choi SH, Huh J, Park SH. Systematic review
    Lancet 2018;391:2537-2545                                           and meta-analysis of studies evaluating diagnostic test
 8. Lambregts DMJ, Boellaard TN, Beets-Tan RGH. Response                accuracy: a practical review for clinical researchers–Part
    evaluation after neoadjuvant treatment for rectal cancer            II. Statistical methods of meta-analysis. Korean J Radiol
    using modern MR imaging: a pictorial review. Insights Imaging       2015;16:1188-1196

kjronline.org      https://doi.org/10.3348/kjr.2020.0483                                                                          825
Park et al.
21. Devillé WL, Buntinx F, Bouter LM, Montori VM, de Vet HC, endoscopy and magnetic resonance imaging. Ann Coloproctol
van der Windt DA, et al. Conducting systematic reviews of 2019;35:202-208
diagnostic studies: didactic guidelines. BMC Med Res Methodol 33. Kuo LJ, Chiou JF, Tai CJ, Chang CC, Kung CH, Lin SE, et al.
2002;2:9 Can we predict pathologic complete response before surgery
22. Reitsma JB, Glas AS, Rutjes AW, Scholten RJ, Bossuyt for locally advanced rectal cancer treated with preoperative
PM, Zwinderman AH. Bivariate analysis of sensitivity and chemoradiation therapy? Int J Colorectal Dis 2012;27:613-621
specificity produces informative summary measures in 34. Lambregts DM, Vandecaveye V, Barbaro B, Bakers FC,
diagnostic reviews. J Clin Epidemiol 2005;58:982-990 Lambrecht M, Maas M, et al. Diffusion-weighted MRI for
23. Aker M, Boone D, Chandramohan A, Sizer B, Motson R, selection of complete responders after chemoradiation for
Arulampalam T. Diagnostic accuracy of MRI in assessing tumor locally advanced rectal cancer: a multicenter study. Ann Surg
regression and identifying complete response in patients with Oncol 2011;18:2224-2231
locally advanced rectal cancer after neoadjuvant treatment. 35. Lambregts DMJ, Delli Pizzi A, Lahaye MJ, van Griethuysen
Abdom Radiol (NY) 2018;43:3213-3219 JJM, Maas M, Beets GL, et al. A pattern-based approach
24. Bhoday J, Smith F, Siddiqui MR, Balyasnikova S, Swift RI, combining tumor morphology on MRI with distinct signal
Perez R, et al. Magnetic resonance tumor regression grade and patterns on diffusion-weighted imaging to assess response
residual mucosal abnormality as predictors for pathological of rectal tumors after chemoradiotherapy. Dis Colon Rectum
complete response in rectal cancer postneoadjuvant 2018;61:328-337
chemoradiotherapy. Dis Colon Rectum 2016;59:925-933 36. Liu S, Zhong GX, Zhou WX, Xue HD, Pan WD, Xu L, et al. Can
25. Cai PQ, Wu YP, An X, Qiu X, Kong LH, Liu GC, et al. endorectal ultrasound, MRI, and mucosa integrity accurately
Simple measurements on diffusion-weighted MR imaging predict the complete response for mid-low rectal cancer after
for assessment of complete response to neoadjuvant preoperative chemoradiation? A prospective observational
chemoradiotherapy in locally advanced rectal cancer. Eur study from a single medical center. Dis Colon Rectum
Radiol 2014;24:2962-2970 2018;61:903-910
26. Gollub MJ, Blazic I, Felder S, Knezevic A, Gonen M, Garcia- 37. Maas M, Lambregts DM, Nelemans PJ, Heijnen LA, Martens
Aguilar J, et al. Value of adding dynamic contrast-enhanced MH, Leijtens JW, et al. Assessment of clinical complete
MRI visual assessment to conventional MRI and clinical response after chemoradiation for rectal cancer with digital
assessment in the diagnosis of complete tumour response to rectal examination, endoscopy, and MRI: selection for organ-
chemoradiotherapy for rectal cancer. Eur Radiol 2019;29:1104- saving treatment. Ann Surg Oncol 2015;22:3873-3880
1113 38. Nahas SC, Nahas CSR, Cama GM, de Azambuja RL, Horvat
27. Hanly AM, Ryan EM, Rogers AC, McNamara DA, Madoff RD, N, Marques CFS, et al. Diagnostic performance of magnetic
Winter DC, et al. Multicenter Evaluation of Rectal cancer resonance to assess treatment response after neoadjuvant
ReImaging pOst Neoadjuvant (MERRION) therapy. Ann Surg therapy in patients with locally advanced rectal cancer.
2014;259:723-727 Abdom Radiol (NY) 2019;44:3632-3640
28. Horvat N, Veeraraghavan H, Khan M, Blazic I, Zheng J, Capanu 39. Santiago I, Barata M, Figueiredo N, Parés O, Henriques V,
M, et al. MR imaging of rectal cancer: radiomics analysis Galzerano A, et al. The split scar sign as an indicator of
to assess treatment response after neoadjuvant therapy. sustained complete response after neoadjuvant therapy in
Radiology 2018;287:833-843 rectal cancer. Eur Radiol 2020;30:224-238
29. Jang JK, Lee JL, Park SH, Park HJ, Park IJ, Kim JH, et al. 40. Sassen S, de Booij M, Sosef M, Berendsen R, Lammering G,
Magnetic resonance tumour regression grade and pathological Clarijs R, et al. Locally advanced rectal cancer: is diffusion
correlates in patients with rectal cancer. Br J Surg weighted MRI helpful for the identification of complete
2018;105:1671-1679 responders (ypT0N0) after neoadjuvant chemoradiation
30. Kim S, Han K, Seo N, Kim HJ, Kim MJ, Koom WS, et al. T2- therapy? Eur Radiol 2013;23:3440-3449
weighted signal intensity-selected volumetry for prediction 41. Sathyakumar K, Chandramohan A, Masih D, Jesudasan MR,
of pathological complete response after preoperative Pulimood A, Eapen A. Best MRI predictors of complete
chemoradiotherapy in locally advanced rectal cancer. Eur response to neoadjuvant chemoradiation in locally advanced
Radiol 2018;28:5231-5240 rectal cancer. Br J Radiol 2016;89:20150328
31. Kim SH, Lee JM, Hong SH, Kim GH, Lee JY, Han JK, et al. 42. Sclafani F, Brown G, Cunningham D, Wotherspoon A, Mendes
Locally advanced rectal cancer: added value of diffusion- LST, Balyasnikova S, et al. Comparison between MRI and
weighted MR imaging in the evaluation of tumor response pathology in the assessment of tumour regression grade in
to neoadjuvant chemo- and radiation therapy. Radiology rectal cancer. Br J Cancer 2017;117:1478-1485
2009;253:116-125 43. Wan L, Zhang C, Zhao Q, Meng Y, Zou S, Yang Y, et al.
32. Ko HM, Choi YH, Lee JE, Lee KH, Kim JY, Kim JS. Combination Developing a prediction model based on MRI for pathological
assessment of clinical complete response of patients complete response after neoadjuvant chemoradiotherapy
with rectal cancer following chemoradiotherapy with in locally advanced rectal cancer. Abdom Radiol (NY)
826 https://doi.org/10.3348/kjr.2020.0483 kjronline.orgYou can also read