TCYSL3, A MEMBER OF THE YSL GENE FAMILY FROM THE HYPER-ACCUMULATOR THLASPI CAERULESCENS, ENCODES A NICOTIANAMINE- NI/FE TRANSPORTER
←
→
Page content transcription
If your browser does not render page correctly, please read the page content below
The Plant Journal (2006) 49, 1–15                                                                 doi: 10.1111/j.1365-313X.2006.02937.x

TcYSL3, a member of the YSL gene family from the hyper-
accumulator Thlaspi caerulescens, encodes a nicotianamine-
Ni/Fe transporter
Delphine Gendre, Pierre Czernic, Geneviève Conéjéro, Katia Pianelli, Jean-François Briat, Michel Lebrun and Stéphane Mari*
Biochimie et Physiologie Moléculaire des Plantes, Centre National de la Recherche Scientifique (UMR 5004), Institut National de
la Recherche Agronomique, Université Montpellier 2, École Nationale Supérieure d’Agronomie, 2 Place Viala, F-34060
Montpellier Cedex 2, France

Received 7 February 2006; revised 29 July 2006; accepted 24 August 2006.
*For correspondence (fax þ33 467 525 737; e-mail mari@ensam.inra.fr).

       Summary
       The two main features of plant hyper-accumulator species are the massive translocation of heavy metal ions to
       the aerial parts and their tolerance to such high metal concentrations. Recently, several lines of evidence have
       indicated a role for nicotianamine (NA) in metal homeostasis, through the chelation and transport of NA–metal
       complexes. The function of transport of NA–metal chelates, required for the loading and unloading of vessels,
       has been assigned to the Yellow Stripe 1 (YSL)-Like family of proteins. We have characterized three YSL genes
       in Thlaspi caerulescens in the context of hyper-accumulation. The three YSL genes are expressed at high rates
       compared with their Arabidopsis thaliana homologs but with distinct patterns. While TcYSL7 was highly
       expressed in the flowers, TcYSL5 was more highly expressed in the shoots, and the expression of TcYSL3 was
       equivalent in all the organs tested. In situ hybridizations have shown that TcYSL7 and TcYSL5 are expressed
       around the vasculature of the shoots and in the central cylinder in the roots. The exposure to heavy metals (Zn,
       Cd, Ni) does not affect the high and constitutive expression of the TcYSL genes. Finally, we have demonstrated
       by mutant yeast complementation and uptake measurements that TcYSL3 is an Fe/Ni–NA influx transporter.
       This work provides therefore molecular, histological and biochemical evidence supporting a role for YSL
       transporters in the overall scheme of NA and NA–metal, particularly NA–Ni, circulation in a metal hyper-
       accumulator plant.

       Keywords: Thlaspi caerulescens, nicotianamine, nickel, metal transporter, yellow stripe 1-like.

Introduction

Heavy metals such as Pb, Ni, Cu or Cd are highly toxic for                 1999). Thlaspi caerulescens is an example of such a poly-
most plants when present at high concentrations in some                    metal hyper-accumulator plant, and is known to overload
soils due to human activities including mining, industry and               Zn, Cd and Ni. It belongs to the Brassicaceae family
some agricultural practices (Briat and Lebrun, 1999). How-                 and is phylogenetically close to Arabidopsis thaliana.
ever, some plants have the ability to grow under these very                T. caerulescens has become one of the model plants for the
adverse conditions. Even better, some of them have evolved                 study of Zn, Cd and Ni hyper-accumulation (Assunçao et al.,
hyper-accumulating mechanisms enabling them to extract                     2001; Lasat et al., 2000; Marquès et al., 2004; Pence et al.,
metals from the soil and to translocate them to their shoots               2000; Reeves and Brooks, 1983; Schat et al., 2000).
where they can be concentrated at a range of 100- to 1000-                    The mechanisms of metal hyper-accumulation could be
fold more than measured in non-hyper-accumulating plants                   potentially controlled at three levels: uptake from the soil by
(Baker and Brooks, 1989; Brooks et al., 1977). About 400                   the root system, translocation to the aerial parts through the
plant species have been recognized as metal hyper-accu-                    xylem, and accumulation in the leaves in non-toxic forms
mulators, including 300 for Ni and 16 for Zn (Küpper et al.,              (Briat and Lebrun, 1999; Clemens, 2001; Clemens et al., 2002;

ª 2006 The Authors                                                                                                                      1
Journal compilation ª 2006 Blackwell Publishing Ltd
2 Delphine Gendre et al.
Mari and Lebrun, 2005). From these general principles, it can complex being thereafter transported within roots through
be easily hypothesized that metal chelates and their trans- an active transport mechanism. The transporter involved
port across various plant membranes are likely to be key in this FeIII–MA root uptake has been molecularly charac-
determinants of the hyper-accumulation behavior. Metal terized in maize, in which it is encoded by the YS1 gene
sequestration and compartmentation through chelation (Curie et al., 2001). The ZmYS1 protein does not only
have been observed both at cellular and sub-cellular levels, mediate transport of Fe– and other metal–MA complexes
in leaf epidermal cells or in cell wall and vacuoles from (Schaaf et al., 2004; von Wirèn et al., 1994; von Wirèn
Thlaspi goesingense (Küpper et al., 2001; reviewed in Mari et al., 1996), but also FeII–, FeIII– and NiII–NA complexes as
and Lebrun, 2005). At a molecular level, amino and organic shown by heterologous expression in yeast and Xenopus
acids have been proposed to play major roles in the heavy oocytes (Schaaf et al., 2004). The molecular cloning of
metal hyper-accumulation or tolerance phenotype. A Ni– ZmYS1 led to the intriguing observation that eight YSL
histidine complex has been shown to participate to Ni (for YS1-like) genes were encoded in the A. thaliana
transport in the xylem of Alyssum lesbiacum (Krämer et al., genome, although this non-grass plant does not contain
1996). However, histidine does not appear to be involved in MAs. It was then hypothesized that the AtYSLs could be
the hyper-accumulation of Ni in T. goesingense, and the involved in the trafficking of NA–metal complexes within
modulation of histidine content has no effect on Ni tolerance the plant (Curie et al., 2001). This hypothesis was recently
(Persans et al., 1999). Citrate has been demonstrated to be challenged using AtYSL2, and conflicting results were
the major ligand binding Ni in the latex of Sebertia acumi- reported. DiDonato et al. (2004) concluded that AtYSL2
nata, a New Caledonian tree whose latex dry mass is shows FeII–NA transport activity, based on a complemen-
composed of 20% Ni (Jaffré et al., 1976; Mari and Lebrun, tation assay of the fet3fet4 yeast mutant strain that is
2005). defective in both low- and high-affinity iron uptake. In
Recently, we have shown that heterologous expression contrast, Schaaf et al. (2005) reached the conclusion that
of a T. caerulescens nicotianamine (NA) synthase cDNA in the growth complementation observed by Didonato et al.
yeast confers resistance to Ni. Using analytical approa- (2004) occurred independently of the Fe supply and in the
ches combining size-exclusion HPLC and capillary elec- absence of NA. Therefore, the question of whether or not
tropheresis coupled to inductively coupled plasma mass YSL transporters are able to transport metal–NA com-
spectrometry (ICP-MS), followed by electrospray MS and plexes remains open.
collision-induced dissociation MS, we have demonstrated In a recent report, we showed that the over-expression of
that the Ni resistance is achieved through the direct TcNAS in A. thaliana transgenic plants also confers resist-
chelation, in vivo, of Ni ions to NA (Vacchina et al., 2003). ance to Ni, at the whole-plant and cellular levels (Pianelli
NA is a non-proteinogenic amino acid synthesized in all et al., 2005), strengthening the role that NA could play in the
plants by the condensation of three S-adenosyl methion- metal hyper-accumulation phenotype of T. caerulescens.
ine molecules through the activity of the enzyme nico- The role of NA in heavy metal tolerance and hyper-accumu-
tianamine synthase (NAS; Higuchi et al., 1999). The role of lation has also been suggested for Arabidopsis halleri, a Zn
NA in metal homeostasis in plants has mainly been and Cd hyper-accumulator. The NA content in the roots of
determined for iron, in the case of the tomato mutant A. halleri is three times higher than that in A. thaliana, and
chloronerva that is depleted in NA. This mutant displays this increase in NA may be tentatively attributed to the high
the characteristics of Fe deficiency, in particular interve- and constitutive expression of NAS2, as well as a high NA
inal chlorosis, although the leaf Fe content is comparable synthase protein accumulation (Weber et al., 2004). In this
with the wild-type, illustrating the role of NA in the context, it is therefore of primary importance to characterize
remobilization of Fe from the xylem vessels (Scholz et al., the transporters responsible for the trafficking of NA–metal
1992; Stephan et al., 1996). The unexpected high kinetic chelates in T. caerulescens. In this work, we have cloned
stability of FeII–NA and the low Fenton activity of FeII–NA three cDNAs and genes of the TcYSL family, and character-
and FeIII–NA complexes suggest that NA has an important ized their expression under various Ni concentrations in the
function in scavenging iron and protecting cells from culture medium, or at different stages of development. Also,
oxidative damage (von Wirèn et al., 1999). NA is also a in situ hybridizations have provided an insight into the
strong chelator for metals other than Fe, and it is also tissues where these genes are expressed. Furthermore,
able to bind Cu, Zn, Mn and Ni in vitro (Benes et al., 1983; based on 55Fe–NA and 63Ni–NA uptake kinetics experiments,
Stephan and Scholz, 1993; Stephan et al., 1996; Vacchina we have been able to demonstrate that TcYSL3 acts as a
et al., 2003). Furthermore, in grasses only, NA is the metal–NA influx transporter when expressed in yeast.
precursor of the mugineic acid (MA) family, a class of However, this result could not be extended to TcYSL5 and
metal chelators that are structurally closely related to NA. 7, for which no metal transport activity was measured when
MAs are secreted in the rhizosphere under iron deficiency expressed in yeast. These data are discussed in the context
conditions where they strongly chelate FeIII, the FeIII–MA of metal homeostasis in plants, and in particular with regard
ª 2006 The Authors
Journal compilation ª 2006 Blackwell Publishing Ltd, The Plant Journal, (2006), 49, 1–15TcYSL3, a nicotianamine Ni/Fe transporter 3
to the role that Ni–NA trafficking could play in the Ni hyper- After in vivo excision and sequencing, the inserts were
accumulation phenotype of T. caerulescens. found to be identical to TcYSL7 or TcYSL3 sequences,
respectively. TcYSL5 was not found after this library
screening. After comparison of these cDNAs sequences with
Results
their corresponding AtYSL cDNA homologs, it appeared that
the TcYSL7 cDNA was cloned full-length whereas TcYSL3
Identification of TcYSL genes
lacked 72 bp of its 5¢ extremity. The missing fragments, i.e.
Degenerated primers were designed from the most con- the 5¢ end of the TcYSL3 cDNA, and the 5¢ and 3¢ ends of
served regions between the eight AtYSL and ZmYS1 cDNAs. TcYSL5 cDNA, were then recovered by RACE PCR, using
These primers, named YSLfwd1 and 2 and YSLrev1 and 2 cDNAs synthesized from 25 lg mRNA from roots and shoots
(Table 1) were used in various combinations on different of T. caerulescens grown in the presence of Ni. The acces-
types of templates, i.e. genomic DNA or cDNA from roots sion numbers of the cDNA sequences deposited in the
and leaves of hydroponically grown plants, in order to GenBank database are DQ268827 (TcYSL7), DQ268828
maximize the probability of successful amplification. Two (TcYSL5) and DQ268829 (TcYSL3).
DNA fragments were amplified using the YSLfwd1/YSLrev1 The deduced amino acid sequences of the three TcYSLs
primer combination on genomic DNA, and subsequently cloned from T. caerulescens were compared with those of
cloned. Sequence analyses revealed that the 791 bp frag- maize ZmYS1, the founder member of this family (Curie
ment was 85% identical to AtYSL7, at both the nucleotide et al., 2001), which is also the best characterized for its
and amino acid levels, and the gene from which this partial transport activity of metal chelates (Schaaf et al., 2004). The
sequence derived was named TcYSL7. The 700 bp fragment, closest homolog of ZmYS1, TcYSL3, shared 59.2% identity
89% identical to AtYSL5 at the nucleotide and amino acid with the maize sequence, whereas TcYSL5 and TcYSL7 were
levels, was derived from a different gene to TcYSL7 and was 48.2% and 46.5% identical to ZmYS1, respectively (Fig-
named TcYSL5. A 988-bp fragment was further amplified ure 1a). Multiple sequence alignments (Figure 1a, and other
using cDNAs as template and the YSLfwd1/YSLrev2 primer YSL sequences available within databases, not shown)
combination. This third DNA fragment was 88% and 85% enabled identification of a conserved sequence within the
identical to AtYSL3 at the nucleotide and amino acid levels, YSL amino acid sequences, K(F/R)L(T/P/A)(Y/F)PSG(T/L/
respectively, and the gene from which it arose was named S)ATA(V/M/H)LIN, which is proposed as a YSL signature.
TcYSL3. The three isolated DNA fragments were then used The position of the TcYSL proteins in a similarity tree
as probes to screen a T. caerulescens cDNA library con- constructed with the eight AtYSL proteins from A. thaliana
taining 3 · 105 primary transformants before amplification. (Figure 1b) revealed that the TcYSL proteins from T. cae-
Eleven cDNAs clones were isolated from the primary screen. rulescens belong to two out of the three subfamilies
Table 1 Primers used for PCR amplifica-
tion of TcYSL cDNAs, 5¢ and 3¢ RACE and Name Sequence (5¢ fi 3¢)
cloning in the Gateway vectors.
YSLfwd1 ATGTKGGWGBTGGNATGATHTG
K=G or T; W=A or T; B=C, G or T; D=A, G or
YSLfwd2 TCTCTTGGGGDHTHMTGTGGCC
T; Y=C or T; N=A, C, G or T; H=A, C or T;
YSLrev1 TRDCCHGTYTTGAARTCBTGC
M=A or C.
YSLrev2 GCCATTGCCATBGGRAGHGG
AP1 GGATCCTAATACGACTCACTATAGGGC
AP2 CTATAGGGCTCGAGCGGC
TcYSL3 RACE3 CTCGGATATGTTAGCTTGTAGTCTAT
TcYSL3 RACE4 TCCCAGCTTTGGTTGTTTGGAC
TcYSL5 5¢RACE2 CCTTGTACGGCGTTGGTCATCATAA
TcYSL5 5¢RACE3 GTGCCTCGGAGCTGTACAAATA
TcYSL5 5¢RACE4 GGGGTGTGAAAGCTGTTGAT
TcYSL5 5¢RACE5 AGAAGCAACAACGCAGGTCT
TcYSL5 3¢RACE1 TTATGATGACCAACGCCGTA
TcYSL5 3¢RACE2 GAGGCACTGCATCTGTTTCA
GTW-TcYSL7 start CAAAAAAGCAGGCTCCATGGAGGTGGAACGAGCAAAG
GTW-TcYSL5 start CAAAAAAGCAGGCTCCATGAGAAAGGGAGTTCTGAAT
GTW-TcYSL3 start CAAAAAAGCAGGCTCCATGAGGAACTCGATGGTGGGG
GTW-TcYSL7 stop CAAGAAAGCTGGGTCTTAAGCTCAAGAAGGGTTTAAGAAAG
GTW-TcYSL5 stop CAAGAAAGCTGGGTCTTAAGCTTAAGAGGGTCTTTGCAGG
GTW-TcYSL3 stop CAAGAAAGCTGGGTCTTAAGCCTATCTACTCGACATGAAGC
attB1 GGGGACAAGTTTGTACAAAAAAGCAGGCTCC
attB2 GGATTTGGGGACCACTTTGTACAAGAAAGCTGGGTC
ª 2006 The Authors
Journal compilation ª 2006 Blackwell Publishing Ltd, The Plant Journal, (2006), 49, 1–154 Delphine Gendre et al.
(a) (b)
Figure 1. Comparison and evolution of various YSLs sequences.
(a) Sequence alignment between the three TcYSLs and ZmYS1 proteins. CLUSTAL W (version 1.8) alignment of deduced amino acid sequences from the three cloned
TcYSLs and ZmYS1. Amino acids are numbered from the initiator ATG. Identical residues are boxed in black, and homologous residues are in gray.
(b) Unrooted phylogenetic tree of TcYSL, AtYSL and ZmYS1 proteins. Calculations were performed using the CLUSTAL W neighbor-joining method, and the tree
was visualized with Phylodendron (http://crisceb.unina2.it/angelo/PHYLODENDRON/treeprint-form.html). Bootstrap values >50 are indicated.
Accession numbers are: AAG17016 (ZmYS1), NP_567694 (AtYSL1), NP_197826 (AtYSL2), NP_200167 (AtYSL3), NP_198916 (AtYSL4), NP_566584 (AtYSL5),
NP_566806 (AtYSL6), NP_176750 (AtYSL7), NP_546525 (AtYSL8), DQ268827 (TcYSL7), DQ268828 (TcYSL5), DQ268829 (TcYSL3).
previously identified by Schaaf et al. (2005). TcYSL7 and AtYSL7 with the exception of the first and second introns
TcYSL5 belong to the AtYSL5,7,8 subfamily, and TcYSL3 to predicted for AtYSL7, which were absent in TcYSL7 (Fig-
the AtYSL1,2,3 /ZmYS1 cluster. The AtYSL4,6 subfamily is ure 2a). From these results it could be concluded that the
not represented in the T. caerulescens genome, or alternat- TcYSL genes identified so far covered two of the three YSL
ively such a member was missed by our cloning strategy. subfamilies characterized. The remaining one corresponds
Overall, it appeared that each T. caerulescens TcYSL was to AtYSL4 and 6, and is the least documented so far in terms
more closely related to an A. thaliana AtYSL than to another of gene expression and function. In order to assess the
TcYSL protein. overall number of TcYSL gene copies present in the genome
In order to further characterize the structure of the TcYSL of T. caerulescens and to check whether or not our cloning
gene family, we cloned and sequenced the genomic DNA of strategy could have missed member(s) of the family,
the three gene members of this family. The close identity genomic Southern blot hybridizations using TcYSL7 and
between the A. thaliana and T. caerulescens YSL sequences TcYSL3 full-length cDNAs as probes were performed
mentioned above was also observed at the gene organiza- (Figure 2b,c). Dot blot experiments were previously
tion level. Indeed, not only the coding sequence but also the performed, and showed that the TcYSL7 and TcYSL3 probes
position and number of introns were conserved between crosshybridized with the TcYSL7, TcYSL5 and TcYSL3
TcYSL5 and AtYSL5, TcYSL3 and AtYSL3, and TcYSL7 and cDNAs under low-stringency conditions (data not shown).
ª 2006 The Authors
Journal compilation ª 2006 Blackwell Publishing Ltd, The Plant Journal, (2006), 49, 1–15TcYSL3, a nicotianamine Ni/Fe transporter 5
hybridized DNA fragments could be detected. The absence
of a fourth fragment could be explained either by the lack of
signal due to the small size of the digested fragment (485 bp)
or by an overlap of two bands of comparable size, which
could in turn explain the higher intensity of the lower size
fragment (3500 bp) in the corresponding lane (Figure 2b,c).
Finally, we used AtYSL1, 2, 6 and 8 cDNAs as heterologous
probes for Southern hybridizations, to look for the presence
of the corresponding genes in the genome of T. caerules-
cens. Although AtYSL1 and AtYSL8 probes did not yield any
signal (data not shown), the AtYSL2 and AtYSL6 probes
were able to hybridize to single DNA fragments of approxi-
mately 2.5 and 2.3 kbp, respectively (Figure 2d,e). This result
revealed that the YSL family in T. caerulescens contains
more than three members, in fact at least five, representative
of all the subgroups identified in A. thaliana.
Organ- and tissue-specific expression of TcYSL3, TcYSL5
and TcYSL7
The expression of the three TcYSL genes was studied by
real-time RT-PCR, using the expression of four reference
genes for standardization, i.e. clathrin, ef1-a, cap binding
protein (cbp20) and ubiquitin-conjugating enzyme (ubc).
The primer sequences used to measure expression levels of
these standards were deduced from the previously deter-
mined cDNA sequences of these four genes from T. cae-
rulescens after amplification using A. thaliana primers (not
shown). The expression of TcYSL7, 5 and 3 was monitored
by real-time RT-PCR using gene-specific primers. Deter-
mination of the spatial regulation of TcYSL expression was
performed on plants harvested in their natural habitat, the
Figure 2. Identification of T. caerulescens YSL gene family members.
(a) Schematic representation of the structure of various YSL genes. TcYSL7, 5
contaminated site of Saint-Laurent-le-Minier (Ganges,
and 3 genes were cloned and sequenced. Their intron (white boxes)/exon France). The organs considered in this study were the roots,
structure is compared with that of their A. thaliana homologs, AtYSL7, root crown (which represents the transition zone between
AtYSL5 and AtYSL3, respectively. Black and gray bars represent the exons of
the genes for T. Caerulescens and A. thaliana respectively. The positions of
the root and the aerial parts), leaves, floral stem and flowers.
the EcoRI and EcoRV restriction sites on TcYSL5 and 3 are indicated. Although expression of the three genes could be detected in
(b–e) Southern blot analyses of the T. caerulescens genomic DNA with all the organs tested, some specificity was observed
TcYSL7 (b), TcYSL3 (c), AtYSL2 (d) and AtYSL6 (e) cDNA probes: 15 lg of
T. caerulescens genomic DNA were digested with EcoRI or EcoRV, separated
(Figure 3a). Indeed, TcYSL7 was mainly expressed in the
by electrophoresis onto a 0.8% agarose gel, and blotted onto nylon flowers and in the leaves, 14- and 4–5-fold more than in the
membrane. roots, respectively. The expression of TcYSL5 was higher in
above-ground organs, whereas TcYSL3 was almost equally
expressed, irrespective of the organ considered.
As deduced from the genomic sequences, the two restriction In situ hybridizations were then performed for further
enzymes used would only cut at one site: EcoRI would cut identification of the TcYSL expression patterns. For this
TcYSL5 at 485 bp from the ATG, and EcoRV would cut purpose, specific probes were chosen as follows: for
TcYSL3 at 1578 bp from the ATG (Figure 2a), theoretically TcYSL7, a 229 bp probe in the 3¢ UTR; for TcYSL5, a 280 bp
producing four DNA fragments that will hybridize with the probe in the 5¢ UTR; for TcYSL3, a 270 bp probe in the coding
TcYSLs probes. The hybridizations obtained with the EcoRV- region, between 928 and 1206 bp. The specificity of each
digested DNA were consistent with the expected number of probe was verified against the three cDNAs on dot blot
DNA fragments: three major fragments of 5, 6.5 and 8 kbp experiments (data not shown, see Table S1). Sense-oriented
were recognized by the two probes, plus an additional faint probes for each gene were used as a negative control
signal corresponding to a 9 kbp fragment (Figure 2b,c). On (Figure 4, right column). In young roots from hydroponic
the other hand, for the DNA digested with EcoRI, only three cultures of T. caerulescens plants, the expression of both
ª 2006 The Authors
Journal compilation ª 2006 Blackwell Publishing Ltd, The Plant Journal, (2006), 49, 1–156 Delphine Gendre et al.
Figure 3. Tissue-specific expression of TcYSL3,
TcYSL5 and TcYSL7.
Total RNA was prepared from roots, root crown,
floral stem, floral leaves and flowers from adult
plants grown on polluted soil, and reverse-tran-
scribed to cDNA. The data represent the mean
(SD) relative abundance of each TcYSL mRNA,
calculated from the expression of three house-
keeping genes as indicated in Experimental
procedures, taking the abundance in the roots
as a standard.
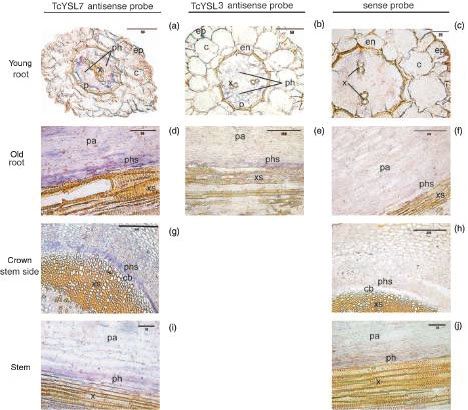
TcYSL7 and TcYSL3, revealed by a purple staining, was expressed, with TcYSL3 being three or four times more
visible in the central cylinder (Figure 4). In the case of highly expressed than TcYSL7 or TcYSL5, respectively. The
TcYSL7, the staining was more intense in the pericycle comparative analyses between TcYSL and AtYSL gene
(Figure 4). At this developmental stage, the vascular tissues, expression revealed that the three TcYSL genes were con-
i.e. the xylem and the phloem, are not fully differentiated sistently expressed at a higher level than the corresponding
which made it difficult to deduce more precisely a specific AtYSL genes (Figure 5). This higher level of expression of
association of the TcYSL genes with a type of vessel. In older the TcYSL genes ranged from 2.75-fold for TcYSL7 in the
roots, it appeared that both TcYSL7 and TcYSL3 were roots compared with AtYSL7, to 51-fold for TcYSL3 in the
expressed in a thin layer of elongated cells, surrounding leaves compared with AtYSL3. Furthermore, the observed
the xylem and located on the external side of the longitud- differences in gene expression between the two plants were
inal cut corresponding to the phloem (Figure 4). The phloem more pronounced in the shoots than in the roots, with 30-
localization was further confirmed in cross-sections of the fold and 51-fold higher expression levels for TcYSL7 and
root crown with the TcYSL7 antisense probe, where the TcYSL3, respectively, when compared with AtYSL7 and
staining was visible in a layer of cells surrounding the central AtYSL3 expression in the aerial parts.
cylinder, above the characteristic cambium region, corres- In culture conditions with high Zn or Cd concentrations,
ponding to the secondary phloem (Figure 4). In the aerial we found that the steady-state level of expression of the
parts of the plants, TcYSL7 expression was again visible in three TcYSL genes remained extremely stable over a 72 h
the phloem of longitudinal sections of the floral stem treatment period in both roots and shoots (data not shown).
(Figure 4). In the leaves, where TcYSL5 was predominant, However, exposure to Ni led to a 50% decrease in abundance
the very high background, probably due to non-specific of TcYSL7 and TcYSL5 transcripts in roots that was main-
hybridization and/or staining, did not allow accurate and tained for the 7 days of treatment, whereas TcYSL3 mRNA
conclusive observations (data not shown). abundance remained unchanged (Figure 6). The expression
of TcYSL5 and TcYSL3 was not modified in the leaves in
response to the Ni treatment. In the case of TcYSL7, a
High and constitutive expression of TcYSL3, TcYSL5 and
transient but significant increase in its expression was
TcYSL7 in T. caerulescens
observed, reaching a maximum after 24 h of treatment
Having established the patterns of expression at the organ (Figure 6).
and tissue levels, the expression of TcYSL3, 5 and 7 was
analyzed in two ways: first, by comparison with the corres-
Functional characterization of TcYSL3, TcYSL5 and TcYSL7
ponding A. thaliana homologous genes in roots and shoots,
by heterologous expression in yeast
and second, during exposure to heavy metal ions such as
Zn, Cd and Ni. Real-time RT-PCR analyses were performed A means to reveal the activity of potential transporters such
from plants cultivated in hydroponic conditions, in control as TcYSL proteins involves expression in heterologous
medium for the comparison with A. thaliana, and in medium systems such as Saccharomyces cerevisiae in order to per-
supplemented with 1.5 mM ZnSO4, 75 lM CdSO4 or 100 lM form growth complementation tests. For this purpose, the
NiSO4. These analyses revealed that TcYSL5 was the pre- yeast fet3fet4 double mutant that is impaired in low- and
dominantly expressed gene in T. caerulescens roots. Its high-affinity iron uptake, and is thus unable to grow in low
expression was threefold higher than that of TcYSL3 (Fig- Fe concentrations (Eide, 1998), was used to express the three
ure 5). In the shoots, the three genes were relatively highly TcYSL cDNAs subcloned into an expression vector under the
ª 2006 The Authors
Journal compilation ª 2006 Blackwell Publishing Ltd, The Plant Journal, (2006), 49, 1–15TcYSL3, a nicotianamine Ni/Fe transporter 7 Figure 4. Localization of TcYSL3 and TcYSL7 expression by in situ hybridization. The right column (c, f, h, j) represents hybridization with the sense probe (negative control). The left column (a, d, g, i) shows hybridization with the TcYSL7 antisense probe. The middle column (b, e) shows hybridization with the TcYSL3 antisense probe. (a–c) Young roots (2–3 cm from root tip) from 3-month-old plants grown in hydroponic culture. (d–f) Old roots (2 years) from contaminated soil. (g, h) Root crown from 2-year-old plants growing on contaminated soil. (i, j) Floral stem from 2-year-old plants growing on contaminated soil. c, cortex; p, pericycle; pa, parenchyma; x, xylem; xs, secondary xylem; ph, phloem; phs, secondary phloem; cb, cambium; ep, epidermis. The in situ hybridization signal is visualized by the purple color. control of a galactose-inducible promoter. Several media 2004). As expected, the expression of ZmYS1 specifically were used to grow the transformed yeast cells, differing in restored growth to the fet3fet4 yeast strain on medium the nature of their iron source: FeSO4 as an iron-limiting supplemented with 40 lM FeII–NA (Figure 7a). The three medium for the fet3fet4 mutant, FeII citrate as an iron source TcYSL cDNAs and the corresponding empty vector control for positive control of the viability of the yeast cells, and FeII– were then expressed in fet3fet4 under the same conditions. nicotianamine as an iron source that could only be used by In this experiment, the negative and positive control condi- yeast strains expressing a functional Fe–NA transporter. The tions were 40 lM FeSO4 and 40 lM Fe citrate, respectively. positive control of yeast complementation on the FeII–NA On medium supplemented with 40 lM FeSO4, the fet3fet4 medium consisted of fet3fet4 yeast cells expressing the mutant is not able to grow as the iron source is limiting. maize ZmYS1 cDNA (Roberts et al., 2004; Schaaf et al., When iron is supplemented as Fe citrate, the availability of ª 2006 The Authors Journal compilation ª 2006 Blackwell Publishing Ltd, The Plant Journal, (2006), 49, 1–15
8 Delphine Gendre et al.

                                                                                             Figure 5. Real-time RT-PCR expression ana-
                                                                                             lysis of TcYSL3, TcYSL5 and TcYSL7 and
                                                                                             their homologs in A. thaliana.
                                                                                             Transcript levels were measured in roots and
                                                                                             shoots of plants cultivated in hydroponic
                                                                                             medium in control conditions. The DCt val-
                                                                                             ues were calculated as follows: Ct of consti-
                                                                                             tutive control gene (Ef1a) – Ct of target gene,
                                                                                             where the Ct value is the cycle number at
                                                                                             which the PCR product reaches a set thresh-
                                                                                             old. The DCt values represent the mean of
                                                                                             three technical replicates (SD) of one
                                                                                             experiment representative of three inde-
                                                                                             pendent experiments. Relative transcript lev-
                                                                                             els (RTL) were calculated as follows:
                                                                                             RTL ¼ 100 · 2DCt. The Ct values for EF1a in
                                                                                             the roots were 22.41 and 22.21 for T. cae-
                                                                                             rulescens and A. thaliana, respectively;
                                                                                             those in the shoots were 22.63 and 23.38,
                                                                                             respectively.

iron is much higher, enabling normal growth of the fet3fet4         probably by the promotion of NA-dependent Fe uptake. The
yeast cells. This latter condition serves to verify that the        same growth tests performed with Zn or Cu instead of Fe,
various plasmid constructs introduced into the yeast cells do       with the appropriate yeast mutants, did not yield any posit-
not affect the viability under control conditions (Figure 7a).      ive results in terms of growth complementation (data not
When iron was introduced into the growth medium as an               shown).
Fe–NA chelate, the expression of TcYSL3, but not TcYSL7                 In order to demonstrate that TcYSL3 does indeed have a
and TcYSL5, conferred a higher growth rate than the empty           metal–NA complex uptake activity, uptake measurements
vector control. The growth of this yeast clone expressing           were performed using reconstituted metal–NA complexes
TcYSL3 was even higher than in positive control conditions          (Schaaf et al., 2005) in which the metal was either 63Ni or
                                                                    55
with Fe citrate as the iron source. This result shows that, like       Fe. Time-course experiments on 63Ni or 55Fe uptake by
ZmYS1, TcYSL3 can restore growth in the fet3fet4 mutant,            yeast cells, in a NA-dependent manner, are presented in

                                                                                                           ª 2006 The Authors
                                        Journal compilation ª 2006 Blackwell Publishing Ltd, The Plant Journal, (2006), 49, 1–15
TcYSL3, a nicotianamine Ni/Fe transporter 9
Figure 6. TcYSL gene expression in response to
100 lM NiSO4 treatment at various time points.
Roots and rosette leaves from three plants of 10–
12-week-old T. caerulescens grown hydroponi-
cally were harvested at each time point for Ni and
TcYSL transcript abundance determination. To-
tal RNA was prepared from the pooled roots and
shoots of three plants, and reverse-transcribed to
cDNA. Data shown are the mean (SD) of mRNA
levels normalized to three or four housekeeping
genes as indicated in Experimental procedures.
Figure 7(b,c). Only yeast transformants expressing TcYSL3 in A. thaliana, and up to five TcYSL genes have been
catalyzed an influx of Fe, compared with an empty vector potentially identified.
control or a 1428 bp deletion of the TcYSL3 cDNA. Likewise,
in the case of Ni, TcYSL3 catalyzed the uptake of Ni–NA,
Constitutive and overall expression of TcYSL3, TcYSL5 and
compared with the empty vector or TcYSL7 and TcYSL5.
TcYSL7 is not induced by nickel
Furthermore, the low uptake activity of TcYSL3 yeasts at 0C
was consistent with an active uptake, rather than passive The expression pattern of the TcYSL genes was studied by
loading (Figure 7b,c, open symbols). Calculations of net real-time PCR using samples from various organs. Although
influx (Figure 7b,c, inserts) revealed that TcYSL3 catalyzed the expression of the three genes could be detected in all
the uptake of approximately 60 pmol Ni/106 cells and organs analyzed, a specific pattern of expression for each
30 pmol Fe/106 cells after 20 min at 30C. gene was revealed. While TcYSL7 was mainly expressed in
the flowers, the expression of TcYSL5 was higher in all
above-ground organs. TcYSL3 was expressed at the same
Discussion
levels regardless of the organ tested (Figure 3a). Although
In this report, we have cloned and characterized three YSL the expression patterns of the corresponding AtYSL
genes from the hyper-accumulator T. caerulescens. The genes have not been published yet, microarray-based
screening of the cDNA library identified these genes, and expression data are available in several databases
they were the only YSL genes whose expression was rep- online (www.weigelworld.org/resources/microarray, www.
resented in this library. However, Southern blot hybridiza- genevestigator.ch). Interestingly, when comparing the
tions using heterologous probes of the remaining AtYSL expression patterns obtained for the three TcYSL genes with
members (AtYSL1, AtYSL2, AtYSL6 and AtYSL8) revealed the information available at http://www.genevestigator.ch,
the presence of two more genes, corresponding potentially it appeared that the organ specificity of YSL expression
to homologs of AtYSL2 and AtYSL6. It can thus be concluded was considerably conserved between the two species.
that the YSL family in T. caerulescens may be as extended as Indeed, the expression of AtYSL7 is almost restricted to the
ª 2006 The Authors
Journal compilation ª 2006 Blackwell Publishing Ltd, The Plant Journal, (2006), 49, 1–1510 Delphine Gendre et al.
flowers (carpel, sepal, petal, stamen) and young seeds.
AtYSL5 expression can be detected in almost all the organs,
but with higher representation in aerial organs. Finally,
AtYSL3 is expressed at comparable levels in Arabidopsis
organs similar to those investigated in the present study
(roots, stem, leaves, flowers). Although this cannot be con-
sidered as a direct evidence, the conservation of the primary
sequence and of the organ-specific expression pattern
between the two species are strong arguments in favor of a
conservation of the physiological role of these YSL genes.
An important finding of this study is the very high level of
expression of the three TcYSL genes we have looked at
regardless of the treatment, compared with their AtYSL
homologs, and the lack of induction of these genes during
the time course of Ni exposure (Figure 5). Several other
treatments such as Fe and Zn excess or deficiency or Cd
exposure did not yield any modulation of the constitutive
expression of the TcYSL genes (data not shown). Interest-
ingly, several reports related to the molecular dissection of
metal tolerance and hyper-accumulation have described
that one major difference between hyper-accumulators and
non-accumulator relative species concerns the deregulation
and constitutive high expression of genes involved in metal
homeostasis, particularly those involved in uptake and
chelation events.
For example, in T. caerulescens, the high and constitutive
uptake of Zn by the roots (Lasat et al., 1996) is mediated by
the corresponding expression of the zinc transporter ZNT1
(Pence et al., 2000). This transporter is expressed at high
levels in the roots and the shoots in both Zn-deficient and
Zn-replete conditions. In contrast, the pattern of ZNT1
expression in the non-tolerant relative Thlaspi arvense is
typical of a micronutrient transporter induced under Zn
deficiency (Pence et al., 2000). One metallothionein (MT)
gene (TcMT3) behaves the same way in T. caerulescens, as it
is highly expressed in the roots and shoots of the more Cd-
tolerant ecotype (Roosens et al., 2004). In Silene vulgaris
Figure 7. Functional complementation and NA-dependent uptake of Ni or Fe
by yeast cells expressing TcYSL3, TcYSL5 and TcYSL7.
(a) Functional complementation of fet3fet4 yeast mutant by TcYSLs. DEY1453-
derived yeast strains transformed with constructs expressing ZmYS1,
TcYSL7, TcYSL5, TcYSL3 or empty vector pYPGE15 or pYES DEST52 were
grown on synthetic defined medium containing 40 lM FeSO4, 40 lM FeII
citrate or 40 lM FeII–NA at pH 7. Plates were incubated for 1 week at 30C.
(b) Uptake of 55Fe–NA by Saccharomyces cerevisiae fet3fet4 expressing
TcYSL3 at pH 7. Time course of 55Fe–NA at uptake at 30C for cells
transformed with pYES DEST52 ( ), pYES DEST52-TcYSL3 ( ) or TcYSLD3
(•). TcYSLD3 represents a 1428 bp deletion in the TcYSL3 ORF. The open
symbols represent control incubations performed at 0C for 40 min.
(c) Uptake of 63Ni–NA by the BY4741 Hisþ yeast strain expressing TcYSL7, 5 or
3 at pH 5. Time course of 63Ni–NA uptake at 30C for cells transformed with
pYES DEST52 empty vector (•), pYES DEST52-TcYSL7 ( ), pYES DEST52-
TcYSL5 ( ) or pYES DEST52-TcYSL3( ). Open symbols correspond to 40 min
incubation at 0C.
Uptake is expressed in pmol Fe or Ni per 106 cells. Data are the mean ( SD) of
three replicates. The inserts represent the net influx of metals in the TcYSL3-
expressing yeasts.
ª 2006 The Authors
Journal compilation ª 2006 Blackwell Publishing Ltd, The Plant Journal, (2006), 49, 1–15TcYSL3, a nicotianamine Ni/Fe transporter 11
populations growing on metal-polluted soils, a type 2b MT Fe is provided as FeII–NA or FeIII–NA (not shown), in a
is highly expressed in shoots and roots, irrespective of the medium buffered to pH 7, with appropriate growth of the
Cu exposure (van Hoof et al., 2001). With regard to metal various yeast clones under negative and positive control Fe
storage, the A. halleri AhMTP1 gene, encoding a functional supply conditions (Figure 7a). This result is in good agree-
Zn vacuolar transporter, is highly and constitutively ex- ment with the complementation obtained with ZmYS1
pressed in the shoots, in contrast to A. thaliana and Arabid- (Schaaf et al., 2004). The complementation is more efficient
opsis lyrata (non-tolerant related species), for which MTP1 with FeII–NA, which is consistent with the higher kinetic
gene expression is induced in response to Zn treatment stability of this complex, compared with FeIII–NA, at pH 7 in
(Dräger et al., 2004). A more global transcriptome approach, aerobic conditions (von Wirèn et al., 1999). Second, TcYSL3
performed on roots and shoots of A. halleri and A. thaliana, catalyses the active, NA-dependent and temperature-
using cross-species microarray hybridizations, has recently dependent uptake of Fe as a FeII–NA chelate in yeast at pH 7
shown that several genes potentially involved in metal (Figure 7b). Third, under slightly acidic conditions, when the
uptake, chelation and storage are highly expressed in uptake medium is buffered to pH 5, TcYSL3 mediates the
various organs of A. halleri (Becher et al., 2004; Weber uptake of Ni as an Ni–NA complex (Figure 7c) at rates com-
et al., 2004). parable with those reported for ZmYS1 (Schaaf et al., 2004).
Although direct evidence from reverse genetics experi- Under such conditions, the transport of FeII–NA was not
ments is lacking, there are now several lines of evidence detectable. This is consistent with, and reinforces, the
indicating that the tolerance and the hyper-accumulation computer simulations of the pH dependence of formation of
mechanisms can be explained, at least in part, by the high and the FeII–NA complex described by von Wirèn et al. (1999),
constitutive expression of genes involved in metal ion which indicated that this complex would be stable only for
uptake, chelation and storage in subcellular compartments. pH values above 6. The absence of Ni–NA uptake at pH 7 by
This general picture is reinforced by our observation that TcYSL3 could be due to low kinetic constants for this sub-
metal–nicotianamine transporters belonging to the TcYSL strate (i.e. high Km and low Vmax), combined with pH con-
family in T. caerulescens exhibit very high expression in ditions far from the optimal pH. In contrast with these
shoots and roots, to a much higher level than their A. thaliana results, under the conditions of yeast complementation and
homologs (Figure 5), and are not induced in response to uptake used in this study, the two other proteins, TcYSL7
metal exposure. and TcYSL5, did not yield any transport activity. The lack of
uptake activity for TcYSL7 and TcYSL5 could have several
reasons: (i) mis-targeting or mis-processing in yeast cells, (ii)
TcYSL3 is an FeII–NA and NiII–NA chelate transporter
catalysis by TcYSL7 and TcYSL5 of the efflux of NA–metal
From a functional point of view, the only YSL proteins complexes rather than influx (indeed both activities are
shown to transport NA- and phytosiderophore-bound metal expected to occur for the loading and subsequent unloading
ions, OsYSL2 and ZmYS1, belong to monocotyledons (Koike of vascular tissues); and (iii) NA–metal complexes not being
et al., 2004; Schaaf et al., 2004). In dicotyledons that do not the substrates of these two transporters.
produce phytosiderophores, YSL proteins have been pro-
posed to transport NA–metal chelates, although unequivo-
Preferential YSL expression in vascular tissues
cal proof of function remains to be obtained. The first yeast
complementation assays performed with AtYSL2 were TcYSL7 and TcYSL3 are expressed in the vasculature of
reported by DiDonato et al. (2004). They suggested the T. caerulescens plants as observed by in situ hybridization
transport of Fe–NA and Cu–NA, based on a growth restor- (Figure 4). The expression of TcYSL7 and TcYSL3 is localized
ation phenotype. Actually, this phenotype appeared to be in the central cylinder of young roots and apparently in the
the consequence of a bias due to the expression vector used phloem of older roots, and, in the case of TcYSL7, in the
in the complementation test, namely pFL61. Indeed, it was phloem of the stem. This specific pattern of expression is in
further shown that the pFL61 vector alone induced a strong good agreement with the data obtained by promoter::GUS
reduction of the yeast cell viability and growth, irrespective fusion analyses of AtYSL1, AtYSL2 and OsYSL2. In A. thali-
of the iron source (Schaaf et al., 2005). The insertion of any ana, AtYSL1 is expressed in the xylem parenchyma in the
cDNA in this vector restored normal growth. Using a differ- aerial parts (leaves, sepals, petals) and in the chalazal in
ent expression vector, pDR195, Schaaf et al. (2005) showed developing seeds, where it is required for iron and nico-
that AtYSL2 was not able to complement the fet3fet4 yeast tianamine loading (Le Jean et al., 2005). AtYSL2 expression
mutant on a Fe–NA medium, nor was it competent in the is found in the central cylinder of young roots and in the
transport of Fe–NA or Cu–NA. Here we provide several lines xylem-associated cells of the leaves, and might be involved
of evidence showing that TcYSL3 is able to transport metal in the lateral transport of Fe, Cu and Zn (Didonato et al.,
ions as NA complexes. First, the expression of TcYSL3 re- 2004; Schaaf et al., 2005). In rice, the activity of the OsYSL2
stores the growth of the fet3fet4 yeast double mutant when promoter is localized in the companion cells and phloem of
ª 2006 The Authors
Journal compilation ª 2006 Blackwell Publishing Ltd, The Plant Journal, (2006), 49, 1–1512 Delphine Gendre et al.
leaves and in the embryo and outer layer of the endosperm chamber (day/night period 10 h/14 h, day/night temperature 22/
(Koike et al., 2004). The capacity of OsYSL2 to transport FeII– 17C). Two-week-old seedlings were transferred for hydroponic
culture in a nutrient solution containing 1.25 mM KNO3, 1.5 mM
NA and MnII–NA in vitro is a strong argument in favor of a
Ca(NO3)2Æ4 H2O, 0.75 mM MgSO4Æ7 H2O, 0.5 mM KH2PO4, 50 lM
role in the phloem transport of these metals, particularly for H3Bo3, 19 lM MnCl2, 1 lM CuSO4, 10 lM ZnSO4, 0.2 lM MoO4
the seed loading. Na2Æ2 H2O, 100 lM NaFe-EDTA, renewed every week. After 10 weeks,
three plants were placed in a 2.5 l vessel containing the nutrient
solution and the various treatments were applied. A. thaliana plants
The potential role of TcYSLs in the hyper-accumulation of used for the comparison of YSL gene expression between the species
metals were cultivated for 3–4 weeks in the hydroponic solution described
above, except that the concentration of ZnSO4 was 1 lM.
Recently, several indirect lines of evidence have suggested a
potential role of nicotianamine in heavy metal tolerance and
hyper-accumulation. The roots of A. halleri accumulate Plasmids, yeast strains and growth conditions
threefold more NA than A. thaliana, probably due to the Saccharomyces cerevisae strains BY4741 Hisþ (derived from the
higher expression of the NAS2 gene (Weber et al., 2004). yeast BY4741 Mata; hisD31; leuD20; metD150; uraD30 by HIS3
Heterologous expression of AtNAS2 in Schizosaccharomy- homologous recombination) and the fet3fet4 mutant that is defect-
ive in low- and high-affinity Fe uptake (DEY1453 Mata ade2 can1 his3
ces pombe cells confers Zn tolerance (Weber et al., 2004). In
leu2 trp1 ura3 fet3-2::HIS3 fet4-1::LEU2) were used. All strains were
Saccharomyces cerevisiae, the expression of TcNAS leads to transformed with URA3-containing plasmids expressing the speci-
the accumulation of NA and confers Ni tolerance (Vacchina fied cDNA under the control of the yeast PMA1 promoter (pDR195
et al., 2003). In this case, it has been shown that the tolerance Gateway with reading frame cassette C; Invitrogen, Cergy-Pontoise,
to Ni is achieved through the direct binding and formation of France) or the pGAL1 promoter (pYES DEST52; Invitrogen) using
competent cell transformation (Dohmen et al., 1991).
a stable Ni–NA complex in vivo. In the same report and using
Yeast functional complementation plate assays were performed
the same analytical techniques, an Ni–NA complex was also on solid YNB medium which was then supplemented with appro-
identified in T. caerulescens roots exposed to NiSO4. Finally, priate levels of each metal depending on the assay being per-
the over-expression of NAS genes in A. thaliana and tobacco formed. Media were prepared using ultrapure water and were
(Nicotiana tabacum) results in an increased accumulation of buffered using MES to pH 5 or BES to pH 7. The YNB medium
contained YNB (USBIOlogical, Swampscott, MA, USA), the appro-
NA and a higher tolerance to Ni (Douchkov et al., 2005; Kim
priate concentration of each amino acid, 2% glucose, galactose and
et al., 2005; Pianelli et al., 2005), but is not sufficient to confer Noble agar (Sigma, Lyon, France). For growth tests, a single colony
the capacity to hyper-accumulate the metal in the leaves. In was grown on liquid YNB medium supplemented with 50 lM FeSO4/
these transgenic plants, the transport activity of NA–metal 200 lM citrate (fet3fet4). Fe–NA chelate was prepared as described
complexes may be a limiting step in achieving the hyper- by Schaaf et al. (2004). FeII uptake assays were performed in the
presence of 1 mM ascorbate. After overnight growth, the culture
accumulation phenotype. In T. caerulescens, we have shown
was washed in 10x TE and rinsed twice with sterile water to obtain
that the expression of three TcYSL genes is always much an OD at 600 nm of 0.1.
higher than in A. thaliana (Figure 5). On the basis of this up-
regulation and the localization of the expression of these
TcYSL genes around the vascular tissues, the transport Gene and cDNA cloning and sequencing
activity of NA–metal chelates is likely to be high and efficient Genomic DNA and cDNA from leaves and roots of T. caerulescens
in all organs. This feature of the YSL genes studied in were PCR-amplified with degenerated primers designed from con-
T. caerulescens is potentially crucial for the long-distance served AtYSL sequences. Three fragments were cloned into the
pGEM-T vector (Promega, Madison, WI, USA), sequenced (Genome
transport of metal ions, particularly Ni, to the aerial parts of
Express, Meylan, France) and were identified as AtYSL orthologs by
the plants. The capacity of TcYSL3 to catalyze the influx of Ni– BLASTX using the TAIR database. These fragments were 32P-labe-
NA makes it a good candidate for two functions in the plant: (i) led (High Prime; Roche, Neuilly-sur-Seine, France) and used to
the entry of Ni–NA into the symplastic transport in the root for screen a cDNA library constructed in a phagemide vector. The lib-
delivery to the xylem, which is consistent with the localization rary was prepared from foliar cDNA of T. caerulescens (Universal
Rioboclone cDNA Synthesis System; Promega) according to the
of its expression in the central cylinder; and (ii) the unloading
manufacturer’s protocol with some minor modifications (ZAP
of the Ni–NA complexes from the xylem in the leaves and Express cDNA Gigapack III Gold cloning; Stratagene, La Jolla, CA,
subsequent delivery to the final storage sites. USA). If not stated otherwise, all the DNA fragments obtained were
cloned in the pGEMT vector (Stratagene, San Diego, CA, USA) and
sequenced (Genome Express).
Experimental procedures RACE PCR (5¢ and 3¢) were performed in order to obtain full-length
sequences from uncomplete cDNA fragments (see Table 1 for
Plant growth conditions primer sequences). The TcYSL3 RACE4 and TcYSL3 RACE3 primers,
combined with the AP1 and AP2 primers (Table 1), were used in
Seeds of Thlaspi caerulescens J. & C. Presl, ‘Ganges’ ecotype, were nested PCR experiments, leading to the amplification of a 500 bp
placed at 4C in the dark for 4 days on filter papers moistened with fragment, matching TcYSL3 and containing the translation initiation
deionized water. Seeds were germinated on the filter in a climate codon (deduced from sequence alignment with the AtYSL3 cDNA
ª 2006 The Authors
Journal compilation ª 2006 Blackwell Publishing Ltd, The Plant Journal, (2006), 49, 1–15TcYSL3, a nicotianamine Ni/Fe transporter 13
sequence) and 154 bp of 5¢ UTR. The 5¢ RACE PCR of TcYSL5 was 1% galactose, pH 5 or 7, respectively) and resuspended in the same
achieved by a two-round nested amplification, first with TcYSL5 uptake buffer to an OD600 of 18. Before the experiment, cells were
5¢RACE2 and TcYSL5 5¢RACE3 (Table 1) and AP1 and AP2, and then incubated for 15 min at 30C. Uptake was started by addition of 9
with TcYSL5 RACE4 and TcYSL5 RACE5 primers, deduced from the volumes of a solution containing 1% galactose, 10 mM MES or BES,
sequence obtained from the previous amplifications. By sequence and 5 lM 63NiII–NA or 55FeII–NA (specific activity 600 cpm mol)1).
alignment with its AtYSL5 ortholog from A. thaliana, it was The reactions were stopped by addition of 20 ml of SSW buffer
observed that the sequence of the 5¢ region of the isolated TcYSL5 containing 1 mM EDTA, 20 mM Na3 citrate, 1 mM KH2PO4, 1 mM
cDNA contained the first initiating ATG codon and an additional CaCl2, 5 mM MgSO4, 1 mM NaCl, and filtered on membrane filters
100 bp of 5¢ UTR. Finally, the 3¢ RACE of the TcYSL5 cDNA, (Whatman GF/C 1822 025; Maidstone, UK). Radioactivity was
performed with TcYSL5 3¢RACE2 and TcYSL5 3¢RACE3 (Table 1) determined by scintillation counting in 5 ml cocktail (Ultima GoldTM;
and the AP1 and AP2 primers, enabled amplification of the missing Perkin-Elmer, Boston, MA, USA).
3¢ region containing the stop codon and the 3¢ UTR.
Quantitative PCR analysis of TcYSL and AtYSL expression
Sequence alignment and phylogenetic tree
Total RNA was isolated from roots or shoots of 6-week-old
TcYSL sequences were translated and their amino acids sequences A. thaliana and 10–12-week-old T. caerulescens. RNA was isolated
and the ZmYS1 protein sequence were aligned using the CLUSTAL using Trizol reagent (Invitrogen) as described by the manufacturer.
Wprogram, version 1.8 (Thompson et al., 1994). The boxshade A DNase treatment was performed to avoid contamination by
program was used to highlight conserved residues (black in Fig- genomic DNA. Of this isolated RNA, 5 lg was converted to cDNA
ure 1) and similar residues (gray in Figure 1). using MMLV reverse transcriptase (Promega) and anchored
Phylogenetic trees were constructed with the neighbor-joining oligo(dT)23. TE was used to stop the reaction. For quantitative PCR,
algorithm using the NEIGHBOR program in the Phylogeny Inference 2 ll of the diluted (1:5) cDNA products were used as templates with
Package (PHYLIP; Department of Genetics, University of Washing- 2 ll Q-PCR mix (Roche), 0.5 ll primers (20 lM each) and 5.5 ll water.
ton, Seattle, WA, USA). Evolutionary distances were estimated by the Calculation of the DCt values was performed as described by Becher
PHYLIP program PROTDIST using the Dayhoff and PAM matrices. et al. (2004) and Weber et al. (2004). Primers used were Tc7F (5¢-
The statistical significance of trees was tested by bootstrap analysis AACCGGCAGGGCCTAC-3¢), Tc7R (5¢-CGAGGTCCCTCACGCC-3¢),
with the SEQBOOT and CONSENSUS programs in PHYLIP (Felsen- Tc5F (5¢-TGCACCATTTGCTACCGTA-3¢), Tc5R (5¢-TCCAGAGACTA-
stein, 1992). Genomic DNA sequences were compared with cDNA TCTTTTACTAT-3¢), Tc3F (5¢-GAGAAGTTCGGGAAGTGGGT-3¢),
sequences in order to determine intron sizes and positions. Tc3R (5¢-AGAAGCGACGAAGGCAAAA-3¢), AtYSL3F (5¢-GA-
ATTGAGAGACTAGTTTATTC-3¢), AtYSL3R (5¢-CGAGTTTTTAC-
TTTTTGTGTAGCG-3¢), AtYSL5F (5¢-ATCTCAACCATGTGAAAGTG-
Southern blot 3¢), AtYSL5R (5¢-AATCATCAATCAGAGCCC-3¢), AtYSL7F (5¢-
TTGGAAGCCATGGACAAGAAC-3¢), AtYSL7R (5¢-GCTATACCC-
Genomic DNA from T. caerulescens was prepared by the CTAB TTCTACCTTGGAG-3¢), ClathrineF (5¢-AGCATACACTGCGTGC-
method as described by Ausubel et al. (1999). Samples (15 lg) of AAAG-3¢), ClathrineR (5¢-TCGCCTGTGTCACATATCTC-3¢), Ef1F (5¢-
DNA were digested with EcoRI or EcoRV for 3 h at 37C. Digested GTCGATTCTGGAAAGTCGGACC-3¢), Ef1R (5¢-AA-
DNA was then separated on to a TAE/0.8% agarose gel for 5 h at TGTCAATGGTGATACCACGC-3¢), TcUBCF (5¢-GGAGCCCCGCTTG-
55 V. After depurination by soaking the gel in 0.25 M HCl, denatur- GAC-3¢) and TcUBCR (5¢-CGGCGAGGCGAGTGTA-3¢).
ation in 0.5 M NaOH/1.5 M NaCl, and neutralization by 0.5 M Tris-HCl
pH 7/1.5 M NaCl, DNA was transferred to a nylon filter (Hybond Nþ;
Amersham, Little Chalfont, Buckinghamshire, UK) with 10x SSC. In situ hybridization
Membranes were hybridized with random-primed32P-labeled
probes corresponding to TcYSL7, TcYSL3, AtYSL1, AtYSL2, AtYSL6 Plants were taken from the contaminated site of Saint-Laurent-
and AtYSL8 full-length cDNAs (the AtYSL cDNAs were a gift from le-Minier, which contains 122 000 ppm Zn, 37 500 ppm Pb,
Catherine Curie, CNRS, Montpellier, France). TcYSL probes were 16 300 ppm Ba, 2800 ppm As and 436 ppm Cd (G. Delmot, personal
hybridized in Church buffer (0.5 M Na2HPO4/1% SAB/1% SDS communication). Plant material was fixed in 4% paraformaldehyde
adjusted to pH 7.2 with phosphoric acid) and AtYSL probes were in 10 mM of potassium phosphate buffer (pH 7.2) overnight at 4C,
hybridized in Denhardt’s buffer (5x SSC, 5x Denhardt’s solution, dehydrated in ethanol series and butanol, and embedded in Para-
0.5% SDS) overnight at 65C. The membranes were washed in 2x plast X TRA (Labonord, Templemars, France). Sections (8 lm) were
SSC/0.1% SDS at 65C, twice for 15 min in the case of the TcYSL transferred onto silanized slides (Dako Cytomation, Carpinteria, CA,
probes and twice for 45 min in the case of AtYSL probes. Autora- USA). Antisense and sense 229 bp TcYSL7, 280 bp TcYSL5 and
diography was performed for 4 days at )80C onto Kodak film, 269 bp TcYSL3 riboprobes were labeled after transcription with
using an intensifying screen. The membranes hybridized with biotine (BrightStar Psoralen-Biotin kit; Ambion, Austin, TX, USA).
AtYSL probes were exposed to Fujifilm BAS-500 screens for 36 h. Labeling efficiency was estimated by dot-blotting onto a Hybond Nþ
Analysis of the signal was performed using the Image Reader BAS- membrane.
500 software (Fuji). Slides were dewaxed and rehydrated prior to be incubated for
40 min in proteinase K (2 lg ml)1) at 37C. A probe concentration of
2 lg ml)1 was used for overnight hybridization of tissue sections at
Nicotianamine–metal uptake in yeast 45C in 10% dextran sulfate, 1x Denhardt’s solution, 50% forma-
mide, 1 lg ll)1 tRNA, 1 mM DTT and 2x SSC buffer.
For uptake experiments, single colonies of transformed BY4741 Hisþ Post-hybridization washings (15 min) at graded stringency (2x
or fet3fet4 were cultured in liquid YNB medium containing 2% SSC at 55C, 1x SSC at 50C, 0.5x SSC at 55C) were followed
galactose and the appropriate supplements. After overnight culture, by pre-treatment with the blocking solution (Roche) to prevent
cells were washed twice at 4C in uptake buffer (10 mM MES or BES, non-specific binding, then incubation with streptavidine–alkaline
ª 2006 The Authors
Journal compilation ª 2006 Blackwell Publishing Ltd, The Plant Journal, (2006), 49, 1–15You can also read