Poorly known 2018 floods in Bosra UNESCO site and Sergiopolis in Syria unveiled from space using Sentinel 1/2 and COSMO SkyMed - Nature
←
→
Page content transcription
If your browser does not render page correctly, please read the page content below
www.nature.com/scientificreports
OPEN Poorly known 2018 floods in Bosra
UNESCO site and Sergiopolis
in Syria unveiled from space using
Sentinel‑1/2 and COSMO‑SkyMed
Deodato Tapete* & Francesca Cigna
The instability situation affecting the Middle East poses threats to preservation of cultural heritage.
Mapping efforts based on satellite imagery currently concentrate more on recording human-induced
damage than impacts of unforeseen natural events (e.g. floods). In 2018, the UNESCO World Heritage
Site of Bosra and the landscape of Sergiopolis-Resafa in Syria were flooded after heavy rainfall.
While the first incident was reported by heritage organisations (although information was limited to
the main monument), the second event was completely unknown. Using optical and radar satellite
images from the European Commission’s Copernicus Sentinels fleet and the Italian Space Agency’s
COSMO-SkyMed constellation, we prove that these data are an enormous reservoir of information to
assess comprehensively the duration, extent and severity of such natural events. In Bosra, several key
assets were flooded besides the Roman Theatre, with waters taking from few days to several weeks to
evacuate and dry out. In Sergiopolis, while the main ruins were sheltered by the fortification walls, the
nearby floodplain was inundated. The floodwater-flow pattern resembled the simulations developed
by archaeologists to prove the existence of an ancient system of embankments and dam. Our results
suggest that many other events posing risk to heritage assets, otherwise unnoticed, may be unveiled
if current satellite imagery archives, yet to analyse, are systematically screened.
Cultural heritage sites are frequently exposed to natural hazards (e.g. floods, earthquakes, landslides)1. Research
is currently ongoing on how to address the challenges for conservation based on an improved understanding
of natural factors determining susceptibility, also in the context of climate change2,3. However, the impact of
natural hazards is given less attention where more pressing issues arise, such as threats from warfare and looting.
This unfortunately applies to various sites across the Middle East and North Africa region, given the widespread
situation of political instability. Several initiatives aiming to recording and cataloguing threats include “natural
impact” among the damage patterns that are documented using geospatial and satellite d ata4,5. Nevertheless,
incident reports and studies mostly focus on anthropogenic hazards. Given the published s tatistics5, we cannot
exclude that natural impacts might be under-represented in databases, and more events might have happened,
though not documented yet.
Given the constraints due to site inaccessibility in areas under conflict, users exploit satellite data as a reliable
source of objective information6. To substantiate incident reports collected from broadcast and social media,
or written based on direct observation on the ground, bespoke acquisitions at very high spatial resolution have
been preferably u sed5,7. However, more studies are increasingly demonstrating the value of high resolution satel-
lite imagery from open access catalogues (e.g. Landsat-8, Copernicus Sentinel-2) for condition a ssessment4,8,9.
These image archives are being built in the last 5–7 years through repeated acquisitions collected across the
globe, and thus now provide reservoirs of satellite images covering same locations of the Earth’s surface every
few days, regardless of specific image orders from users. Such archives become crucial in order to test the above
hypothesis that natural hazard events may have occurred, but were not investigated due to lack of reporting or
general unawareness.
To this purpose, this paper presents the reconstruction of two flooding events that in 2018 hit Bosra UNESCO
World Heritage Site (WHS) in the Daraa Governorate and the landscape surrounding the archaeological site of
Sergiopolis in the Ar‐Raqqah Governorate, in Syria (Figs. 1, 2). Both sites have unique historical significance and
Italian Space Agency (ASI), Via del Politecnico snc, 00133 Rome, Italy. *email: deodato.tapete@asi.it
Scientific Reports | (2020) 10:12307 | https://doi.org/10.1038/s41598-020-69181-x 1
Vol.:(0123456789)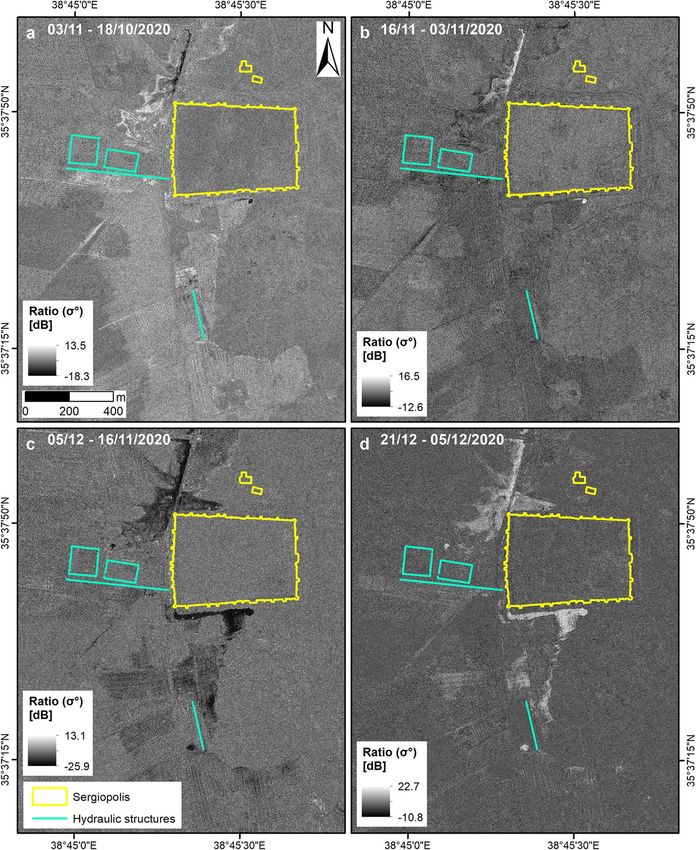
www.nature.com/scientificreports/
Figure 1. Bosra UNESCO World Heritage Site (WHS). (a) Location of Bosra in southern Syria. (b) Spatial
extent of satellite data analysed to reconstruct the flooding event occurred on 26–29/04/2018. Sentinel-1 and
Sentinel-2 footprints retrieved from the Copernicus Open Access Hub. Notation: ASC ascending orbit, DESC
descending orbit, H StripMap Himage mode, T track, R relative orbit. (c) Location of control points within the
WHS used for spectral analysis of flooding condition at the main monuments and urban sectors: (1) Roman
Theatre; (2) Birket al-Hajj (or Pilgrims’ Pool); (3–5) the Field (Hippodrome); (6) lot of bare land; (7) East
Pool; (8) water reservoir west; (9–10) roads around the theatre. WHS boundary digitised from Ref.12. All maps
were generated by the authors using ArcMap v.10.6.1 software (https://desktop.arcgis.com/en/). Background
satellite data in (b, c) are Esri basemaps within ArcMap v.10.6.1 and are credited to: Esri, DigitalGlobe, GeoEye,
Earthstar Geographics, CNES/Airbus DS, USDA, USGS, AeroGRID, IGN, and the GIS User Community.
cultural value and, as such, are highly representative of Syrian heritage to protect. Bosra is a major archaeological
site in southern Syria (32° 31′ 2.00ʺ N; 36° 28′ 47.00ʺ E; Fig. 1a,b) and is currently inhabited given that over the
centuries the namesake modern town has grown up amongst the monuments (Fig. 1c). Owing to the extensive
ruins of Nabataean, Roman, Byzantine and Umayyad buildings and the incorporation of the exceptionally intact
second century Roman theatre, in 1980 UNESCO recognised Bosra’s high degree of integrity and authenticity,
and the WHS was established and became one of the most famous touristic attractions of the country. To the
Roman periods also dates back the foundation of Sergiopolis-Resafa, as a fortified settlement of the Eastern
Limes, i.e. the Roman border defence system against the Parthian and later Sassanid Empires, 40 km south-west
of modern Raqqa (35° 37′ 44.00ʺ N; 38° 45′ 29.00ʺ E; Fig. 2). As the name recalls, the historical significance of
Sergiopolis is linked to Saint Sergius, the Roman officer martyred there during the Diocletianic Persecution, to
whom the so-called Basilica A was dedicated to mark his grave, thus making Sergiopolis one of the most impor-
tant Christian pilgrimage sites in the eastern Mediterranean.
Partial to no documentation was available for the two 2018 floods investigated in this paper, respectively.
In Bosra, flooding was caused by a severe thunderstorm in late April 2018. Two reports were issued by: (1) the
American School of Oriental Research (ASOR) collecting the photographs published in social media10; and
(2) The Day After Heritage Protection Initiative (TDA)11. However, these reports focused on the impact on
the Roman Theatre only, and did not include any satellite-based assessment. Therefore, no information was
provided to clarify the extent of the event across the WHS, and whether and how the site recovered afterwards.
With regard to Sergiopolis, no records of flooding were reported in late 2018 in any of the main information
Scientific Reports | (2020) 10:12307 | https://doi.org/10.1038/s41598-020-69181-x 2
Vol:.(1234567890)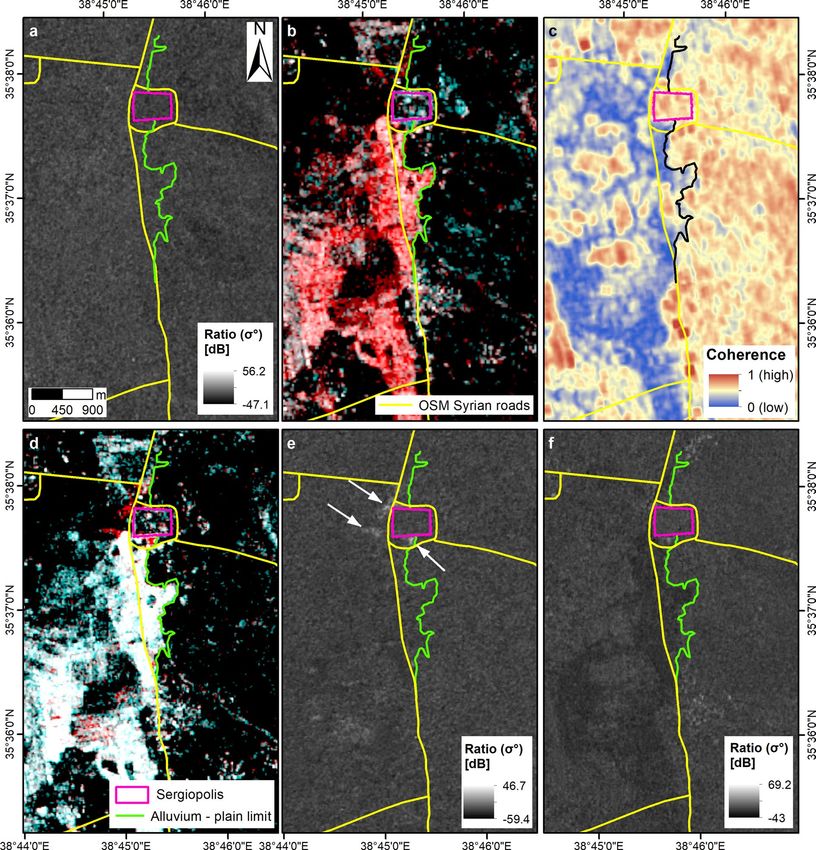
www.nature.com/scientificreports/
Figure 2. Archaeological site of Sergiopolis-Resafa. (a) Location of Sergiopolis in Syria. (b) Spatial extent of
satellite data analysed to reconstruct the flooding event occurred on 28–30/10/2018. Sentinel-1 and Sentinel-2
footprints retrieved from the Copernicus Open Access Hub. Notation: ASC ascending orbit, DESC descending
orbit, ES Enhanced Spotlight mode, T track, R relative orbit. (c) Topography of Resafa Basin based on NASA’s
1 arc-sec SRTM global DEM (30 m ground resolution) distributed by USGS via the LP DAAC Global Data
Explorer. (d) Situation on 30/10/2018 at the peak of the flooding event. Contains Copernicus Sentinel-2 data
2018. (e) Zoomed view of the archaeological site of Sergiopolis prior to the flooding event, with indication
of: (1) the fortress enclosing the main buildings, such as the Basilica A; (2) the Ghassanid praetorium; the
archaeological finds related to hydraulic structures, i.e. (3) an earthen embankment, (4) an earthen dam and
(5) two water basins. Archaeological findings and the alluvium—plain limit are based on maps published in
the literature13,14. Syrian roads are drawn based on the OpenStreetMap HOTOSM Syrian Arab Republic Roads
shapefile accessed through Open Database License at https://data.humdata.org/dataset/hotosm_syr_roads.
All maps were generated by the authors using ArcMap v.10.6.1 software (https://desktop.arcgis.com/
en/). Background satellite data in (b,e) are Esri basemaps within ArcMap v.10.6.1 and are credited to: Esri,
DigitalGlobe, GeoEye, Earthstar Geographics, CNES/Airbus DS, USDA, USGS, AeroGRID, IGN, and the GIS
User Community.
channels or social media, though evidence of floods was found by the authors through a regional screening of
satellite image archives.
The two events are here investigated by combining Synthetic Aperture Radar (SAR) and multispectral data
collected nearly in the same days by Copernicus Sentinel-1 and Sentinel-2 satellite constellations, respectively,
with time series acquired by the Italian Space Agency (ASI)’s COSMO-SkyMed SAR constellation (Figs. 1b, 2b,
Tables 1 and 2). The multi-sensor data analysis clarifies the spatial and temporal evolution of the two flooding
events, and proves how this combination could bring in new information, otherwise unknown, also with regard
to impacts on local heritage assets.
Scientific Reports | (2020) 10:12307 | https://doi.org/10.1038/s41598-020-69181-x 3
Vol.:(0123456789)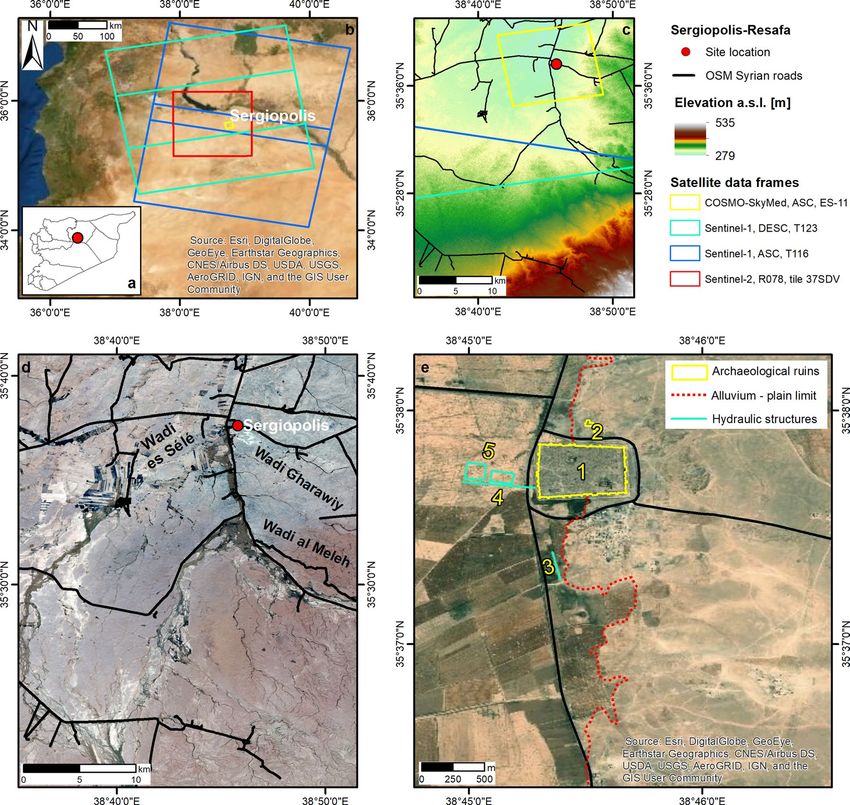
www.nature.com/scientificreports/
Satellite Acquisition mode Date Geometry Track/beam Polarization Processing level
30/04/2018
Ascending 14
06/05/2018
GRD
01/05/2018
Descending 21
07/05/2018
16/10/2018
22/10/2018
Sentinel-1 IW 28/10/2018 Ascending 116 VV, VH
03/11/2018
09/11/2018 GRD, SLCa
17/10/2018
23/10/2018
Descending 123
29/10/2018
04/11/2018
31/05/2017
11/11/2017
SM 01/12/2017 Ascending H4-01
21/07/2018
25/07/2018
31/08/2018
COSMO-SkyMed 13/09/2018 HH SCS
18/10/2018
03/11/2018
SP Ascending ES-11
16/11/2018
05/12/2018
21/12/2018
23/02/2019
Table 1. Satellite SAR data used to analyse the flooding events in Bosra (26–29/04/2018) and Sergiopolis (28–
30/10/2018), Syria. Notation: IW Interferometric Wide swath, SM StripMap Himage, SP Enhanced Spotlight,
H horizontal, V vertical, GRD level-1 ground range detected, SCS level 1A, single-look complex slant products,
SLC single look complex products. a SLC for the Sentinel-1 image pair (16–28/10/2018) only.
Date of acquisition Cloud coverage Relative orbit and tile
23/04/2018 Cloud-free
26/04/2018 Cloudy and dark
03/05/2018 Cloud-free
08/05/2018 Very cloudy
11/05/2018 Cloud-free Orbits R078 and R121
13/05/2018 Cloudy Tile 37SBS
16/05/2018 Cloud-free
18/05/2018 Cloud-free
21/05/2018 Cloud-free
02/06/2018 Cloud-free
05/10/2018 Cloud-free
15/10/2018 Hazed
Orbit R078
30/10/2018 Cloud-free
Tile 37SDV
14/12/2018 Cloud-free
19/12/2018 Partly cloudy
Table 2. Sentinel-2 multispectral data used to analyse the flooding events in Bosra (26–29/04/2018) and
Sergiopolis (28–30/10/2018), Syria. Cloud coverage is qualitatively assessed over the study areas only, and not
across the whole satellite image frame.
Scientific Reports | (2020) 10:12307 | https://doi.org/10.1038/s41598-020-69181-x 4
Vol:.(1234567890)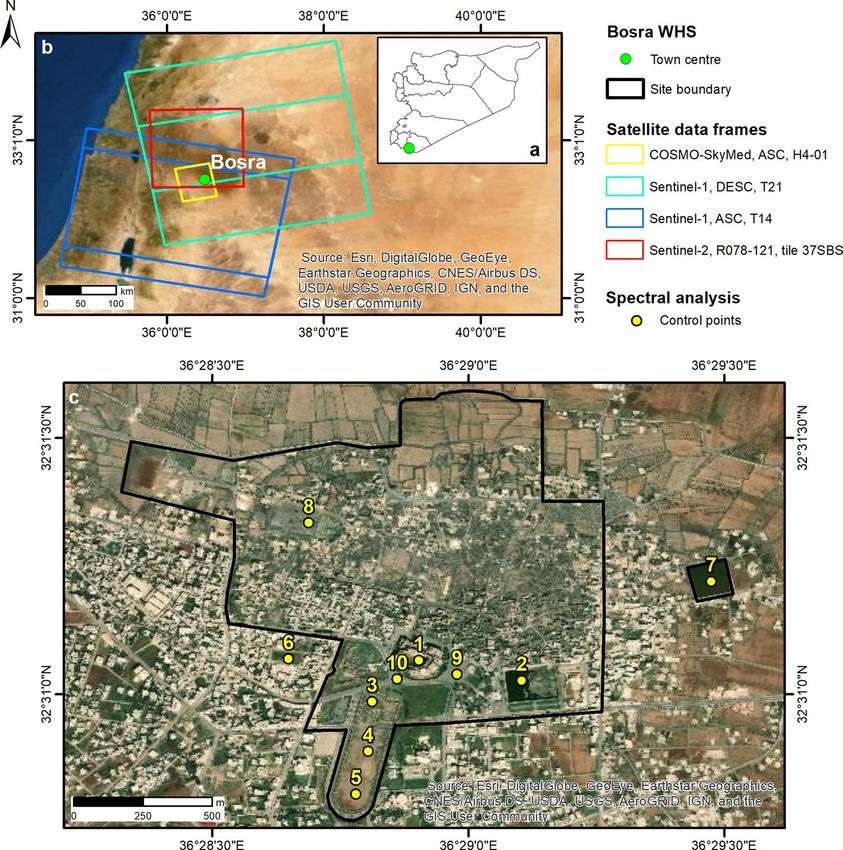
www.nature.com/scientificreports/
Results
Extent and timescale of the 2018 Bosra flood. To establish duration, extent and severity of the 2018
flood at the archaeological site of Bosra in the context of the modern urban layout it is embedded in (Fig. 1a,c),
we combined data mining from existing incident reports, with space-based evidence from the Sentinels and
COSMO-SkyMed (see “Methods”). Data mining revealed that weather-related threats to conservation of herit-
age assets at the site were specifically included in the earliest WHS periodic reporting document in 200015, but
until April 2018 no report referred to impact of natural hazards. Scholars have concentrated more on anthro-
pogenic hazards arising from looting, bombing, wall collapses, and earth movement6,16,17, i.e. those that in 2013
made the site to be included in the List of World Heritage in D anger18. The first incident report documenting
10
the flooding event in Bosra WHS is dated 29 April 2018 . ASOR collected photographs published by Aleppo
Archaeology showing the orchestra of the Roman Theatre flooded up to most of the stage and several rows of
seats. Waters also flooded the base of the Ayyubid-era ramparts surrounding the theatre. TDA issued another
report on 2 M ay11. Therein, the authors refer that a severe thunderstorm hit Bosra WHS on 26 April and lasted
for 3 days. Water quickly accumulated and rose over 3.5 m high, and photographic evidence shows the west and
east courtyards flooded up to nearly 1.5 m. Floods also caused sections of the outer walls surrounding the citadel
to collapse. This comes out evidently by comparing the photographs published in the ASOR and TDA reports.
No other information was available about this event. It was not mentioned either in the State of Conservation
Report issued in February 2019 by the Directorate General of Antiquities and Museums (DGAM)17. Therefore,
prior to analysing the available archive satellite data, it was not known whether other monuments of the WHS
were affected by flooding, and for how long the theatre remained flooded.
The analysis of Sentinel-2 multispectral data clearly testifies that the thunderstorm started on 26 April (see
Supplementary). Meteorological data and the CRU TS3.10 D ataset19 corroborate this observation, the former via
a peak of total daily precipitation recorded on 25–26 April at the King Hussein weather station in Jordan, nearly
27 km south-west of Bosra. Sentinel-2 spectral profiles extracted from control points and polygons located in the
main monuments and areas of Bosra WHS (Fig. 1b,c, Table 2), provide a detailed tracking of the whole flooding
event, from 23 April up to 2 June 2018.
With regard to the Roman Theatre (Fig. 3a), on 3 May the spectral profile confirms the presence of liquid
water (i.e. flooding) compared to the pre-event scenario on 23 April. On 8 May the monument was probably still
flooded, although it cannot be stated whether at the same depth as on 3 May. In the following days, waters started
progressively evacuating from the orchestra and the stage, as revealed by the shape of the spectral profiles that
turn back to those prior to the event (i.e. on 23 April), though with lower reflectance (Fig. 3a). Spectra differ at
Bands 5 to 7 (from 704 to 783 nm), probably due to the presence of mud left by waters.
The multi-temporal spectral analysis over the Birket al-Hajj and the East Pool shows that both remained
flooded under deep waters across the whole investigated period, as clearly highlighted by sun-glint-free spectra
(Fig. 4a). Same is found for the 100 m by 50 m bare land lot, located west of the Necropolis of Tell Aswad and
the Odeon (Fig. 4b). On the contrary, control points in the central and southern parts of the hippodrome were
almost dry and never flooded (Fig. 4c). Whereas, the northern part, initially covered by surface liquid water on
3 May, was mostly dried out on 11 May (Fig. 4c). Two days after, on 13 May, the spectral profile matched the
pre-event situation.
Driven by the spectral analysis, visual inspection of Sentinel-2 images was straightforwardly focused on
those areas of the WHS that were flooded. This examination confirms the above conclusions (Fig. 3c–f, Roman
Theatre; Fig. 4d,e, reservoirs, bare land and hippodrome). A wider view of the countryside around Bosra also
highlights that, outside the WHS, flooding sparsely affected fields and watercourses across the landscape, but
no wide areas were inundated.
Unfortunately, the Sentinel-1 SAR images (see Table 1), did not allow us to better refine the multi-temporal
analysis. This was due to the coarse Sentinel-1 spatial resolution and, more importantly, unforeseen signal inter-
ference affecting the SAR images.
More informative was, instead, the COSMO-SkyMed time series. The cross- and post-event images covering
up to 25 July confirm that the East Pool and Birket al-Hajj were still flooded, with the eastern half of the latter
already dried out (Fig. 4f). At that time, the bare land was completely dry and free from waters. Additionally,
the cross- and post-event ratio maps do not highlight change patterns due to permanent structural damages
(Fig. 4f). However, limitations due to the spatial resolution and visibility along the satellite line-of-sight could
have hampered the possibility to capture the outer wall collapse reported by T DA11.
Discovery of the 2018 Sergiopolis flood. To investigate the potential occurrence of flooding events
at Sergiopolis (Fig. 2a,b), we combined the analysis of the site conservation literature with thorough regional
screening of satellite image archives, by exploiting change detection approaches based on moisture and flood
indexes from multispectral imagery, as well as SAR amplitude changes and coherence (see “Methods”). In the
heritage conservation literature, Sergiopolis has been repeatedly reported for being affected by looting (mostly
occurred prior to the recent c onflict20,21 and distinctively visible in satellite imagery9), theft, v andalism22 and
militarization23 (in more recent times) that mostly affected the archaeological monuments within the massive
walls of the fortress (#1 in Fig. 2e). Neither the reports mention natural hazard events occurred at the site in the
last years, nor Sergiopolis was referred to in the news published online about the flash floods affecting various
areas across the Middle East between 20 and 31 October 201824.
Conversely, our regional screening of Sentinel-2 archives allowed the discovery of an unknown event affect-
ing the site during that month. The comparison between the two closest cloud-free Sentinel-2 images collected
on 5 and 30 October (Fig. 2d) highlighted an unequivocal flooding pattern across the Resafa hydrological basin
Scientific Reports | (2020) 10:12307 | https://doi.org/10.1038/s41598-020-69181-x 5
Vol.:(0123456789)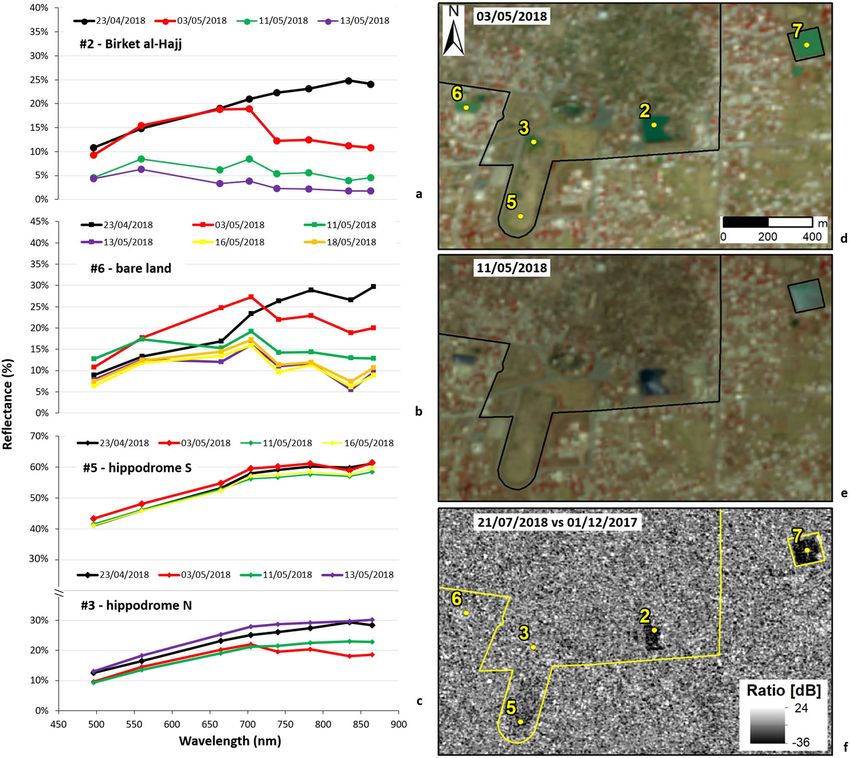
www.nature.com/scientificreports/
Figure 3. Spectral analysis and visual interpretation of the flooding condition and drying out process in the Roman Theatre
of Bosra UNESCO WHS. (a) Spectra extracted from Sentinel-2 time series prior to the event (23/04/2018), in the aftermath
(03–08/05/2018), and when waters evacuated (11/05–02/06/2018). Temporal evolution of the condition of the Roman Theatre
and surrounding roads based on (b,g) pre- and post-event very high resolution satellite images (less than 1 m) accessed
through Google Earth (image credits: 2020 Maxar Technologies), (c–d) pre- and (e–f) cross-event Sentinel-2 false-coloured
IR composites (R: Band 8—NIR; G: Band 4—red; B: Band 3—green; 10 m spatial resolution). Contains Copernicus Sentinel-2
data 2018. Numbered control points in (b) and (c) as per Fig. 1c. Yellow arrows in (g) indicate patches of brown mud partly
covering the orchestra, and the darker soil at the base of the western Ayyubid-era ramparts, while red ovals mark the areas
of the two collapsed sections of the outer walls surrounding the Ayyubid-era ramparts reported by T DA11. Plot in (a) was
generated by the authors using Microsoft Office Excel 365 (https://www.microsoft.com/en-us/microsoft-365/excel). Maps in
(b–g) were generated by the authors using ArcMap v.10.6.1 software (https://desktop.arcgis.com/en/).
Scientific Reports | (2020) 10:12307 | https://doi.org/10.1038/s41598-020-69181-x 6
Vol:.(1234567890)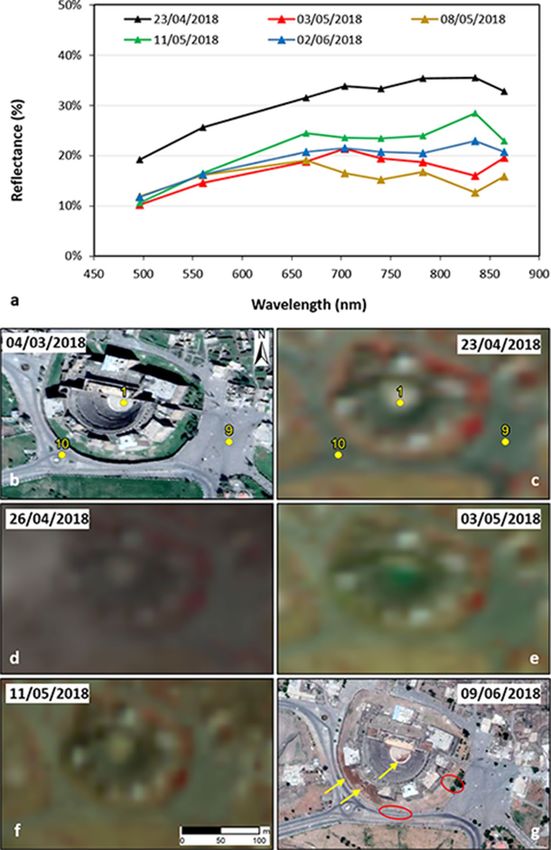
www.nature.com/scientificreports/
Figure 4. Spectral analysis of the flooding condition and drying out process in: (a) Birket al-Hajj (or Pilgrims’
Pool); (b) lot of bare land; (c) the Field (Hippodrome). Visual interpretation of site condition based on
Sentinel-2 false-coloured IR composites (R: Band 8—NIR; G: Band 4—red; B: Band 3—green; 10 m spatial
resolution) collected (d) in the aftermath (03/05/2018) and (e) a few days after the peak of the flooding event
(11/05/2018). Contains Copernicus Sentinel-2 data 2018. Numbered control points in (a) and (c) as per Fig. 1c.
(f) Cross-event SAR amplitude ratio map from COSMO-SkyMed StripMap Himage (3 m ground resolution)
scenes acquired in ascending mode on 01/12/2017 and 21/07/2018 (COSMO-SkyMed Products credits: ASI—
Italian Space Agency—2017–2018. All Rights Reserved). WHS boundary digitised from Ref.12. Plots in (a–c)
were generated by the authors using Microsoft Office Excel 365 (https://www.microsoft.com/en-us/microsoft-
365/excel). Maps in (d–f) were generated by the authors using ArcMap v.10.6.1 software (https://desktop.arcgi
s.com/en/).
which intersected the location of the ruins. This evidence suggested the opportunity to investigate more in detail
the spatial and temporal evolution of the event.
The Normalized Difference Flood Index (NDFI) map of the 30 October Sentinel-2 image delineates very
well the spatial extent of the flooded areas (Fig. 5b,c). A similar result is obtained with the Moisture Index map
(Fig. 5a), although other wetness patterns are observed due to soil moisture. The nearby of Sergiopolis was
flooded as a consequence of the inundation coming from the upper part of the Resafa basin, and particularly from
the Wadi al Meleh and its left bank tributaries (Fig. 5a,b). As visible in the SRTM DEM (Fig. 2c), Sergiopolis is
situated in the Syrian desert steppe at the eastern bank of the Wadi es Sélé (Fig. 2d), downstream of the conflu-
ence of several major tributaries, at an altitude ranging from 284 to 303 m a.s.l. Therefore, the topography is a key
predisposing factor for flooding. Furthermore, the October 2018 event was of wider regional character. The NDFI
map shows inundation of similar severity to the west, with waters overrunning some agricultural fields (Fig. 5a,b).
Scientific Reports | (2020) 10:12307 | https://doi.org/10.1038/s41598-020-69181-x 7
Vol.:(0123456789)www.nature.com/scientificreports/
Figure 5. Spatial extent of floods in Resafa Basin and Sergiopolis as highlighted by means of (a) Moisture Index and (b)
Normalized Difference Flood Index (NDFI) maps (20 m spatial resolution) generated from the Sentinel-2 image collected on
30/10/2018. Zoomed view of Sergiopolis to compare (c) the NDFI map and (d) the original true-colour image (R: Band 4—
red; G: Band 3—green; B: Band 2—blue; 10 m spatial resolution). Contains Copernicus Sentinel-2 data 2018. Archaeological
findings, the alluvium—plain limit and the extent of the simulated flood are based on maps published in Refs.13,14. Syrian roads
are drawn based on the OpenStreetMap HOTOSM Syrian Arab Republic Roads shapefile accessed through Open Database
License at https://data.humdata.org/dataset/hotosm_syr_roads. All maps were generated by the authors using ArcMap v.10.6.1
software (https://desktop.arcgis.com/en/).
Scientific Reports | (2020) 10:12307 | https://doi.org/10.1038/s41598-020-69181-x 8
Vol:.(1234567890)www.nature.com/scientificreports/
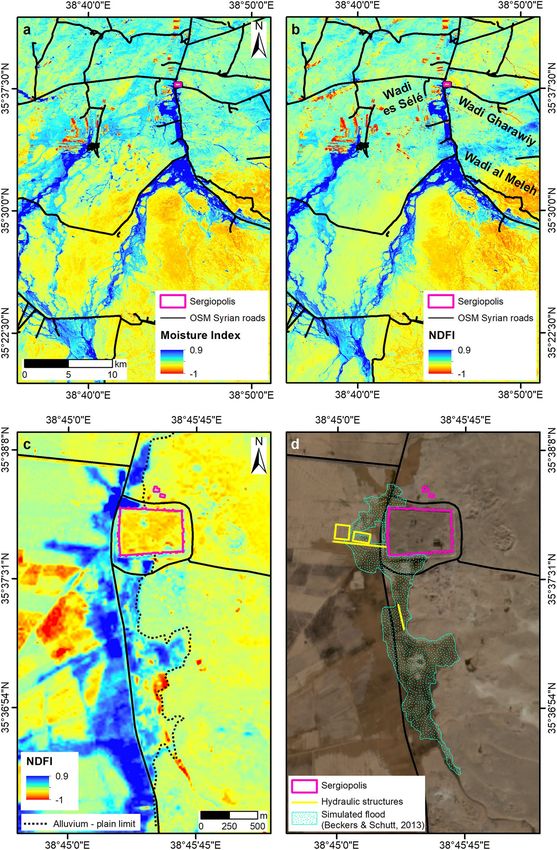
Figure 6. Multi-temporal analysis of the flooding event in Sergiopolis through the Sentinel-1 Interferometric
Wide swath (spatial resolution 20 m in azimuth by 5 m in range) time series. (a) SAR amplitude ratio map from
the pre-event pair acquired in ascending orbit, VV polarization, on 16/10/2018 and 22/10/2018. (b) RGB colour
composite of the cross-event pair, ascending, VV, R: 28/10/2018, G and B: 16/10/2018 and (c) the matching
interferometric coherence map. (d) RGB colour composite of the cross-event pair, ascending, VV, R: 03/11/2018,
G and B: 28/10/2018 and (e) the matching ratio map. White arrows indicate patterns of increased radar
backscatter in the nearby of Sergiopolis fortification walls and water basins. (f) Ratio map of the post-event
pair, descending, VV, 04/11/2018 and 29/10/2018. Contains Copernicus Sentinel-1 data 2018. Archaeological
findings and the alluvium—plain limit are based on maps published in Refs.13,14. Syrian roads are drawn based
on the OpenStreetMap HOTOSM Syrian Arab Republic Roads shapefile accessed through Open Database
License at https://data.humdata.org/dataset/hotosm_syr_roads. All maps were generated by the authors using
ArcMap v.10.6.1 software (https://desktop.arcgis.com/en/).
No other Sentinel-2 image provides a clear sky view of Sergiopolis just before or immediately after the event.
The 15 October scene is hazed (although the visibility is sufficient to infer that the area was not yet flooded at that
time) and the next cloud-free image was collected on 14 December 2018, when the event was already over. The
event can be further constrained temporally by using the Sentinel-1 time series, in both ascending and descend-
ing orbits and Vertical–Vertical (VV) and Vertical-Horizontal (VH) polarizations. The Sentinel-1 ratio maps 23
vs. 17 October (descending, VV) and 22 vs. 16 October (ascending, VH and VV; Fig. 6a) do not show any signs
Scientific Reports | (2020) 10:12307 | https://doi.org/10.1038/s41598-020-69181-x 9
Vol.:(0123456789)www.nature.com/scientificreports/
of flooding. Instead, the ascending Sentinel-1 image collected on 28 October pre-dates the start of the flooding
of at least 2 days, compared to the Sentinel-2 data stack. The red pattern in the RGB colour composite (Fig. 6b)
and the matching blue-coloured pattern in the coherence map (Fig. 6c) mark the extent of the flooded landscape
south and in the nearby of Sergiopolis. At larger scale, swollen rivers and flooded land appear as brighter areas
of increased radar backscatter in the VV polarized image better than in the VH one. This would suggest that
waters were generally not deep and the terrain soon became wet and muddy, thus matching the brownish tone
visible in the 10 m RGB composite of the 30 October Sentinel-2 image (Fig. 5d).
On 3 November the situation was likely more or less the same across the basin. The upper part of the basin
was still flooded on 3 and 4 November, and the RGB composite and the ratio map (3 November vs. 28 October,
ascending, VV) do not reveal evident change (Fig. 6d,e). The only exception is represented by some patterns of
increased radar backscatter localised south of the fortification walls, in front of their NW corner and south of
the water basins (see white arrows in Fig. 6e).
These patterns are very finely captured by the cross-event COSMO-SkyMed SAR Enhanced Spotlight image
collected at 1 m spatial resolution on 3 November (i.e. the same day as the Sentinel-1), and its ratio with the
pre-event 18 October image (Fig. 7a). In front of the NW corner of the fortress, the mixed radar backscatter
ratio patterns are compatible with land partly covered by nearly flat backwater (dark areas) and partly by muddy
waters (brighter areas). On the contrary, the basins of the ancient water harvesting system of Sergiopolis (#5 in
Fig. 2e and Fig. 5d) were dry (Fig. 7a), thus confirming the Sentinel-2 observations on 30 October (Fig. 5c,d).
Totally reverse patterns are, instead, found in the 16 November COSMO-SkyMed image (Fig. 7b), so by then,
presumably, waters should have already evacuated and the soil dried out. A confirmation, in this regard, is also
found in the Sentinel-1 ratio between 4 November and 29 October VV polarized scenes (Fig. 6f), where a clear
decrease in the radar backscatter is observed along the road leading to Sergiopolis and in the fields to the west
(to compare also with Fig. 6b,c). Curiously, on 5 December, when it is plausible that the flooding event was over,
the COSMO-SkyMed image shows wide marked patterns of decreased backscatter along the southern walls of
Sergiopolis, along the road opposite to the NW corner of the fortress and in some of the agricultural fields south
of the site (Fig. 7c). In absence of coeval multispectral image, it is difficult to interpret unequivocally what these
patterns in the ratio map were due to, though the marked decrease in the radar backscatter suggests that they
could be related to surface water. However, on 21 December they are replaced by reverse patterns and definitely
no signs of flooding are visible anymore (Fig. 7d). This matches with the evidence in the Sentinel-2 images col-
lected on 14 and 19 December, which show that inside Sergiopolis and in some of the fields the soil was greening.
Discussion: the value of digging into satellite archives
With regard to the Bosra flood, satellite data corroborated most of the information available in the few published
reports and, more importantly, expanded our knowledge about the spatial distribution and temporal evolution of
the event. It is confirmed that the intense rain causing the flood started on 26 April 2018, and that the orchestra
and stage of the Roman Theatre were flooded soon after. In absence of other on-the-ground evidence, satellite
data were essential to ascertain that other monuments were flooded, i.e. the Birket al-Hajj, the East Pool, as well
as the northern part and small areas in the centre of the hippodrome. This information could not have been
known otherwise. Given their focus on the key archaeological landmark, the published reports could not be used
alone to retrieve a full condition assessment of the whole WHS.
The site recovered relatively quickly from the event. Waters gradually left the Roman Theatre in the follow-
ing days, with at least the orchestra and stage evacuated by 11 May, when it appears that no water but mud was
still present (Fig. 3f). At the same time, the most affected portion of the hippodrome was already dry (Fig. 4e),
whereas, Birket al-Hajj and the East Pool were still under deep waters until July (Fig. 4f). At that time, the other
most evident area testifying that the town was hit by flooding (i.e. the bare land lot) was completely dried out
(Fig. 4f).
From a technical point of view, the identification of the flooded areas and tracking of the temporal evolution
were made agile owing to the semi-automatic spectral analysis of the check points. This approach overcame the
limitation of the visual inspection of the satellite time series, which was later carried out for validation more
expeditiously. Despite the limitations in the available datasets (i.e. signal interference affecting Sentinel-1 data;
lack of COSMO-SkyMed images during the event), the multi-sensor integration was effective to achieve an
overall understanding of the event, and proved the complementarity between Copernicus and Contributing
Missions data.
The examination of the Google Earth time lapse (i.e. one of the open tools mostly used by heritage science
researchers and p ractitioners4,5) suggests that in this case same (or better) reconstruction could not have been
made using very high resolution (i.e. less than 1 m) satellite imagery. Despite the availability of a pre-event
WorldView-2 (4 March 2018, 0.59 m ground sample distance—GSD; Fig. 3b) and a post-event WorldView-3
image (9 June 2018, 0.35 m GSD; Fig. 3g), the temporal interval of this image pair is much longer than the overall
timeframe of the flooding event. Suspicious signs that could have been observed would have been the brown
mud partly covering the orchestra and the darker soil at the base of the western Ayyubid-era ramparts (see yellow
arrows in Fig. 3g). However, with no prior knowledge that a flooding event occurred at the site, these features
may not have been necessarily attributed to flooding. No more informative could have been the fact that the
Birket al-Hajj and the East Pool appear under deep waters. In absence of images collected few days apart, this is
not an exceptional feature per se. These reservoirs are regularly filled in by waters. The only anomalous element
compared to the pre-event situation is, instead, the waterlogged bare land visible on the 9 June image, but this
evidence alone is far too limited to understand the overall impact of the 2018 flood across the WHS.
On the contrary, guided by the pictures reported by TDA11, in the post-event image it is possible to identify
the two collapsed sections of the outer walls surrounding the Ayyubid-era ramparts (see red polygons in Fig. 3g).
Scientific Reports | (2020) 10:12307 | https://doi.org/10.1038/s41598-020-69181-x 10
Vol:.(1234567890)www.nature.com/scientificreports/
Figure 7. Multi-temporal analysis of the flooding event in Sergiopolis through the COSMO-SkyMed Enhanced
Spotlight (~ 1 m ground resolution), ascending orbit, HH polarization, SAR amplitude ratio maps generated
from: (a) the cross-event pairs 18/10–03/11/2018 and (b) 03–16/11/2018; and the post-event pairs (c) 16/11–
05/12/2018 and (d) 05–21/12/2018 (COSMO-SkyMed Products credits: ASI—Italian Space Agency—2018. All
Rights Reserved). Archaeological findings are based on maps published in Refs.13,14. All maps were generated by
the authors using ArcMap v.10.6.1 software (https://desktop.arcgis.com/en/).
Although the observation is slightly hampered by the illumination and feature visibility, the higher resolution
of the WorldView-3 image proved beneficial to fill the gap in the analysis based on Sentinel-1, Sentinel-2 and
COSMO-SkyMed data. Such comparison with Google Earth would not have been possible in the case of Sergi-
opolis, given that the only pre-event image was collected on 5 April 2018 and no post-event scene since then is
available. This lack of satellite imagery also reflects the gap in the archives of very high resolution satellites (e.g.
Maxar DigitalGlobe fleet). Therefore, the Sentinel-1/2 and COSMO-SkyMed data analysed in this paper are
essential to record this event that, otherwise, would not have been known.
Scientific Reports | (2020) 10:12307 | https://doi.org/10.1038/s41598-020-69181-x 11
Vol.:(0123456789)www.nature.com/scientificreports/
The relevance and implications of such digital documentation to the conservation of Sergiopolis come out
more clearly when the 2018 flood is contextualised with regard to the topographical, environmental and archaeo-
logical setting of the site. As mentioned above, the downstream location within the river basin is a predisposing
factor (Fig. 2c, d), with the western part of the town lying in the floodplain and most of the ruins on the elevated
plain extending to the e ast13,14 (see the alluvium—plain limit in Fig. 2e). Therefore, the topographic position
definitely favours the accumulation of excess water during heavy rainfall. This natural process is believed to have
been intentionally exploited in ancient times by local inhabitants to counterbalance the absence of perennial
water sources. Two water-harvesting techniques were exploited14. First, the collection and storage of rainfall and
runoff waters in bottle-shaped cisterns (some are still visible inside the walls and others were found in the Wadi
es Sélé) were one of the ways to supply the town with drinking water. Second, a floodwater-harvesting system,
consisting of a series of embankments (of which a north–south running section, nearly parallel to the modern
road, is attested in the survived archaeological findings; structure #3 in Fig. 2e) facilitating the floodwater harvest-
ing up to an earthen dam (#4), located south of the water basins built west of the fortress walls (#5 in Fig. 2e)25.
The reliability of such system was recently proved by means of hydraulic modelling assuming the existence of
the enbankments13,14. This system should have worked well because of the geographic position of Sergiopolis,
close to the 200 m isohyet, at the margin of a climate region characterised by precipitation regime with strong
Mediterranean character (i.e. regular rainfall events and low variability)13.
No daily precipitation data to constrain the October 2018 flood were found. On the other side, the CRU
TS3.10 Dataset for the years 2017 and 201819 agrees with the climate diagram of Resafa (1983–2011)13, and
confirm that October is the month when precipitations start again after four month-long (June–September)
hot and dry season. October 2018 was not an exception and the trend was increasing in the following Novem-
ber–December. Therefore, it is not surprising that the regional character flooding event affecting Sergiopolis
occurred at the end of October.
As discussed above, Sentinel-2 NDFI and Moisture Index (Fig. 5a–c), the Sentinel-1 ratio maps and RGB
composites (Fig. 6), and the COSMO-SkyMed products (Fig. 7) mutually complement each other in delineating
the flooded areas at the peak of the event.
If these maps are compared with the results of the flow pattern analysis13 (Fig. 5d), a partial match can be
noted between the extent of the areas flooded in October 2018 and the scenario identified with the simulations.
Nevertheless, some differences exist. During the event, the majority of the water flow came from the Wadi al
Meleh and tributaries, and not from the Wadi Gharawiy as per the simulation (Fig. 5a–c). Therefore, the lateral
spreading of the inundation was much wider towards the west, with waters expanding across both sides of the
modern road (Fig. 5c, d). As per the hydraulic model (Fig. 5d), the main flow reached the valley embayment to the
east and inundated the small nearly-squared plain located east (Figs. 5c, 6b, c and 7a). Waters then flowed to the
north, reaching the southern walls of the town. There, they accumulated and the flood was likely retained south
of the two water basins. Differently from the model, the excess water was not channelled through the spillway
between the water basins, but flowed following the modern road, to reach the depression north of Sergiopolis.
Flooded areas are found about 600 m further north, but they did not include the Ghassanid praetorium, owing
to its higher topographic position.
It can be concluded that the 2018 event somehow validates the model, and demonstrates that flooding is a
likely natural hazard in Sergiopolis. Assuming that the archaeological hypothesis about the floodwater-harvesting
system is correct, and that this system was used in the past to transform a threat into a resource for the town, the
current situation by which this system is not functioning anymore and no maintenance or management measures
are undertaken at the site, leaves Sergiopolis much more exposed to flooding events than in ancient times. From
a technical point of view, the multi-sensor integration achieved in Sergiopolis not only strengthens the case to
investigate the available satellite image archives and to combine SAR and optical observations, but also proves
the benefit of creating bespoke and/or background acquisitions at high spatial and temporal resolution over
hotspot areas and key heritage assets (such as those tasked with COSMO-SkyMed over Sergiopolis). While in
this research we focused on Copernicus Sentinels and SAR Contributing Missions, other very high resolution
satellite imagery, e.g. PlanetScope, could be encompassed as part of the methodological approach, in order to
increase the observation capabilities, and move towards a more synergistic and coordinated use of satellite sen-
sors and their image archives (as per the novel concept of “Virtual Constellations”26). Such increased accessibility
to imagery (and processing tools) should also support more widely the applicability of the approach presented
in this paper and its exportability. Provided that satellite imagery is available to cover past events, the research
workflow also relies on ancillary information such as meteorological records and hazard event inventories, to be
browsed to find a temporal match with the evidence extracted from the satellite images or, vice versa, to identify
which geographic area to look at and, the temporal period when an event could have occurred.
It is very likely that many other natural hazard events than the two analysed in this paper occurred across
heritage sites in the Middle East and North Africa region, and they are still from poorly documented to com-
pletely unknown, with limited to no on-the-ground evidence available. Therefore, this research is novel in that
it demonstrates the feasibility, alongside limitations, of digging into the satellite archive data to enrich existing
database records, and thus fill the knowledge gap about natural processes of potential concern for site conser-
vation, in addition to anthropogenic processes that are currently much more documented. To this purpose, as
proved by recent and current initiatives4,5, such a systematic screening of satellite archives could contribute to
inform mitigation measures if a workflow was established to share the information gained from these geospatial
datasets with local stakeholders and authorities who are in charge of heritage protection and preservation. While
the results presented in this paper are outcomes of scientific research, they prove that, in case such integrated
satellite observations were embedded in an ad hoc workflow, they could provide the necessary evidence base for
mitigation measures, by: sensitizing stakeholders about hazards that are given less attention but anyway require
to be accounted for over a longer timescale; showing the impact that unknown (or poorly documented) events
Scientific Reports | (2020) 10:12307 | https://doi.org/10.1038/s41598-020-69181-x 12
Vol:.(1234567890)www.nature.com/scientificreports/
have had on local heritage and landscape; and consequently allowing the projection of the impacts that future
events of similar severity could cause if no actions were put in place.
Methods
Satellite data. The selection of input data used in this work aimed to demonstrate the complementarity
between the Sentinels and COSMO-SkyMed, according to the concept of the Copernicus Earth Observation
and Monitoring p rogramme27 and its Contributing Missions28. Tables 1–2 list the satellite SAR and multispectral
data used to analyse the two flooding events. Data frames and respective spatial coverage over Bosra and Sergi-
opolis are shown in Figs. 1b and 2b.
Sentinel-1 data are SAR images acquired by the namesake constellation of the Copernicus Programme in
Interferometric Wide swath mode, with spatial resolution of 20 m in azimuth by 5 m in range29. We mainly
used Level-1 Ground Range Detected (GRD) products, i.e. focused SAR data that were detected, multi-looked
and projected to ground range using an Earth ellipsoid model, and thus contain amplitude information only.
Sentinel-1 are increasingly being used for condition assessment of cultural l andscapes30.
Sentinel-2 data are acquired every 5 days by the Multispectral Instrument (MSI) on-board the two twin satel-
lites of the Copernicus Sentinel-2 constellation, in 13 bands spanning from 443 to 2,202 nm (i.e. visible—VIS,
Near InfraRed—NIR, Short-Wave InfraRed—SWIR)31. We used Bottom of Atmosphere (BOA) reflectance in
cartographic geometry, i.e. Level 2A products based on automated processing of Top-Of-Atmosphere (TOA)
reflectance in cartographic geometry (i.e. Level 1C) products with the Sen2Cor processor and PlanetDEM Digital
Elevation Model32. Images listed in Table 2 were selected from the available archive, by removing those totally
hampered by clouds over the study area. Sentinel-2 has been proved suitable for systematic condition assessment
of heritage a ssets8.
COSMO-SkyMed data are collected from the COnstellation of small Satellites for Mediterranean basin Obser-
vation (COSMO-SkyMed) mission of the Italian Space Agency (ASI)33,34, made of four identical space-crafts (i.e.
CSK1, CSK2, CSK3, and CKS4), each equipped with multimode SAR sensor operating in the X-band (9.6 GHz
frequency; 3.1 cm wavelength).
The dataset covering Bosra UNESCO WHS (Table 1; Fig. 1b) is a selection of the time series being collected
in StripMap Himage mode (3 m spatial resolution) along ascending orbits as part of the COSMO-SkyMed Back-
ground Mission, i.e. a low priority acquisition plan covering large and capital cities, populated areas, sensible
areas for geohazards and over 260 UNESCO WHS on a regular b asis35. Three pre-event and two post-event
scenes were selected from the available catalogue. The selection was constrained by the acquisition gap of nearly
six months from December 2017 to mid-July 2018.
The dataset covering Sergiopolis (Table 1; Fig. 2b) is instead a selection of the tailored time series tasked in
Enhanced Spotlight mode (1 m spatial resolution), in HH polarization, ascending orbit, since summer 2018.
These data were accessed through a license to use by ASI. One of the existing mechanisms for scholars and
users to access COSMO-SkyMed data to undertake similar research is ASI’s “Open Call for Science”36. While
restrictions and limitations may apply (e.g. in terms of geographical areas, total number of images that can be
requested), the call is open to international scientific investigators and offers the opportunity to access archive
imagery (including those already covering heritage s ites35), as well as to task a limited quota of new acquisitions.
Flooding condition assessment through Sentinel‑2 spectral analysis. In the case of Bosra WHS,
one of the main aims of the multi-temporal analysis was to assess which monuments and archaeological sec-
tors of the site were flooded and, if so, for how long. This could have been simply done by visual inspection of
Sentinel-2 images. However, such an approach could be time-consuming if several points need to be checked, is
subjective and dependent on the operator’s expertise and site knowledge. Therefore, control points and polygons
were located in the key areas of WHS (Fig. 1c): inside the stage and orchestra floor of the Roman Theatre; in the
roads nearby the Roman Theatre; along the longitudinal axis of the hippodrome; the Birket al-Hajj or Pilgrims’
Pool in the south-east; the East Pool; the water reservoir w est12. Additionally, some points and areas were located
in bare land sectors that could have been flooded given their land use and topography. To achieve an accurate
positioning, this was done by using the pre-event WorldView-2 image collected on 4 March 2018 and available in
Google Earth. Zonal statistics were then extracted for the control points and areas to derive the spectral profiles
from Band 2 (Blue, 492 nm) to Band 8A (Vegetation Red Edge, 865 nm). At each date of acquisition, the spectral
profile was classified as either “flooded” or “dry”, according to reference reflectance spectra of water, bare soil and
artificial surfaces from spectral libraries. The multi-temporal comparison of the spectral profiles highlights when
and where a monument or archaeological sector of Bosra WHS was flooded, for how long it remained flooded,
and the time-scale during which it progressively dried out.
Identification of flooded areas through Sentinel‑2 moisture and flood indexes. In the case of
Sergiopolis, the Moisture Index and the Normalized Difference Flood Index (NDFI) were calculated in ArcMap
v.10.6.1 as follows:
(Band8A − Band11)
MoistureIndex =
(Band8A + Band11)
where, for Sentinel-2, Band 8A is the Vegetation Red Edge centred at 865 nm, and Band 11 is the SWIR band
at 1614, both acquired at 20 m spatial resolution, thus resulting in a raster of moisture index map of equivalent
spatial resolution.
Scientific Reports | (2020) 10:12307 | https://doi.org/10.1038/s41598-020-69181-x 13
Vol.:(0123456789)www.nature.com/scientificreports/
(Band4 − Band12)
NDFI =
(Band4 + Band12)
according to the definition by Boschetti et al.37, where, for Sentinel-2, Band 4 is the Red band centred at 665 nm,
and Band 12 is the SWIR band at 2,202 nm. The NDFI raster of each Sentinel-2 image was obtained by using
the original 20 m Band 12 and the 20 m resampled Band 4 image layers accessed through the Copernicus Open
Access Hub.
Identification of flooded and drying out areas through SAR amplitude change. Sentinel-1
images were processed to extract patterns of radar backscatter change due to flooding and drying out in the
cross- and post-event SAR image pairs. The processing was performed using the SNAC—SNAP S-1 GRD Ampli-
tude Change processing t ool38 developed by the European Space Agency (ESA) and available in ESA’s Geohaz-
ards Exploitation Platform (GEP)39. The SNAC tool ingests pairs of Sentinel-1 images in GRD format and, after
co-registration, calibration and terrain correction, generates calibrated and terrain corrected [decibel, dB] slave
and master backscatter products (i.e. post- and pre-event data), and RGB composites based on backscatter values
in dB.
The slave and master products were then imported in ArcMap v.10.6.1 and used to generate the amplitude
change detection map through r atioing40:
σt0s (i)
R ts (i) =
tm σt0m (i)
where ts and tm are the acquisition times of the slave and master products respectively, σ0 is the normalised
radar backscatter (linear scale). Change detection products were generated for both polarizations, i.e. the “like-
polarization” VV and the “cross-polarization” VH.
Furthermore, the ascending SAR image pair (16–28/10/2018) was also processed with GEP’s COIN—Coher-
ence and Intensity change for Sentinel-1 s ervice41. In this case, Sentinel-1 images were processed starting from
Single Look Complex (SLC) format to generate the interferometric coherence map, the backscatter intensity
difference in dB, as well as the RGB composite (red channel: σ0 slave; green: σ0 master; blue: σ0 master; all in dB).
The same amplitude change detection approaches were applied to COSMO-SkyMed data. In this case, the
SAR processing and generation of ratio maps were undertaken according to the method described in35, using
GAMMA SAR and Interferometry Software and starting from Level 1A single-look complex slant (SCS) products.
Meteorological and climatic data. We referred to NOAA NCDC Climate Data for the year 2018. The
original total precipitation (rain and/or melted snow) record is reported during the day in inches and hun-
dredths. For the Bosra flood, data were taken from the time series of the King Hussein weather station (Station
ID: GHCND:JOM00040265; 32° 21′ 22.87ʺ N, 36° 15′ 33.05ʺ E) in Jordan. No precipitation data for the period
of interest were found for the Sergiopolis flood.
We used Climatic Research Unit (CRU) Time-Series (TS)42 for the years 2017–2018 to outline the climatic
setting of the regions where Bosra and Sergiopolis are located. Diagrams of monthly precipitation (mm/month)
were retrieved at the locations: LAT 32.25°, LON 36.25° and LAT 32.75°, LON 36.75° (Bosra); LAT 34.75°, LON
38.25°, LAT 35.25°, LON 38.75° and LAT 35.75°, LON 39.25° (Sergiopolis).
Topographic, geological and heritage asset data. Location and name of the monuments of Bosra
WHS were sourced from maps and documents published in the UNESCO w ebpage12,43. Information about local
geology, position and name of heritage and hydraulic structures based on archaeological findings in Sergiopolis
was derived from13,14. Figures were georeferenced to the WGS84 datum, and shapefile polygons were digitised
in ArcMap v.10.6.1. The topographic setting was based on NASA’s 1 arc-sec SRTM global DEM (30 m ground
resolution).
Data availability
Copernicus Sentinel-1 and Sentinel-2 data are available through the Copernicus Open Access Hub. COSMO-
SkyMed data can be accessed through a license to use by ASI. Google Earth images (credits: 2020 Maxar Tech-
nologies) can be consulted through Google Earth Pro. Global Summary of the Day data for the year 2018 can be
accessed from NOAA NCDC Climate Data Portal (https://www.ncdc.noaa.gov/cdo-web/). Climatic Research
Unit (CRU) Time-Series (TS) can be accessed through CEDA Archive (https://archive.ceda.ac.uk/). NASA’s 1
arc-sec SRTM global DEM is distributed by USGS via the LP DAAC Global Data Explorer.
Received: 2 March 2020; Accepted: 7 July 2020
References
1. Pavlova, I., Makarigakis, A., Depret, T. & Jomelli, V. Global overview of the geological hazard exposure and disaster risk awareness
at world heritage sites. J. Cult. Herit. 28, 151–157 (2017).
2. Cigna, F., Tapete, D. & Lee, K. Geological hazards in the UNESCO World Heritage sites of the UK: From the global to the local
scale perspective. Earth Sci. Rev. 176, 166–194 (2018).
3. Cazenave, A. Anthropogenic global warming threatens world cultural heritage. Environ. Res. Lett. 9, 1–3 (2014).
4. Rayne, L. et al. From above and on the ground: geospatial methods for recording endangered archaeology in the middle East and
North Africa. Geosci. 7, 1–31 (2017).
Scientific Reports | (2020) 10:12307 | https://doi.org/10.1038/s41598-020-69181-x 14
Vol:.(1234567890)www.nature.com/scientificreports/
5. Danti, M., Branting, S. & Penacho, S. The American schools of oriental research cultural heritage initiatives: monitoring cultural
heritage in Syria and Northern Iraq by geospatial imagery. Geoscience 7, 1–21 (2017).
6. Cunliffe, E. et al. Satellite-based Damage Assessment to Cultural Heritage Sites in Syria Contributors. (UNITAR/UNOSAT, 2014).
7. Danti, M. D. Ground-based observations of cultural heritage incidents in Syria and Iraq. Near East. Archaeol. 78, 132–141 (2015).
8. Tapete, D. & Cigna, F. Appraisal of opportunities and perspectives for the systematic condition assessment of heritage sites with
copernicus Sentinel-2 high-resolution multispectral imagery. Remote Sens. 10, 1–22 (2018).
9. Tapete, D. & Cigna, F. Detection of archaeological looting from space: methods, achievements and challenges. Remote Sens. 11,
1–43 (2019).
10. ASOR cultural heritage initiatives. CHI-April 2018 Report-NEA-PSHSS-14-001 Weekly Report 185–188—April 1–30, 2018.SHI
18-0091. (2018).
11. The-day-after-heritage-protection-initiative. The Day After | Damage Report on Roman Amphitheater in Bosra Al-Sham: May 2,
2018. (2018).
12. DGAM. Ancient city of Bosra. Application document for minor boundary modification. (2016).
13. Beckers, B. & Schütt, B. The elaborate floodwater harvesting system of ancient Resafa in Syria: construction and reliability. J. Arid
Environ. 96, 31–47 (2013).
14. Beckers, B., Berking, J. & Schutt, B. The elaborated ancient water supply system of Resafa: risk and uncertainty of water harvesting
in the Syrian Desert Steppe. ETopoi. J. Anc. Stud. 3, 149–153 (2012).
15. DGAM. Bosra WHS Periodic Reporting Cycle 1, Section II / Convention du Patrimoine mondial culturel et naturel Exercice de suivi
périodique des sites arabes inscrits sur la liste du Patrimoine mondial. (2000).
16. AAAS. Ancient history, modern destruction: assessing the current status of Syria’s world heritage sites using high-resolution satel-
lite imagery | AAAS. The World’s Largest General Scientific Society. (2014). Available at: https://www.aaas.org/page/ancient-histo
ry-modern-destruction-assessing-current-status-syria-s-world-heritage-sites-using.
17. DGAM. State Party Report on the State of Conservation of the Syrian Cultural Heritage Sites (Syrian Arab Republic). (2019).
18. UNESCO-World-Heritage-Committee. UNESCO World Heritage Centre: Decision: 37 COM 8C.1. (2013).
19. Harris, I., Jones, P. D., Osborn, T. J. & Lister, D. H. Updated high-resolution grids of monthly climatic observations: the CRU TS310
Dataset. Int. J. Climatol. 34, 623–642 (2014).
20. Casana, J. Satellite imagery-based analysis of archaeological looting in Syria. Near East. Archaeol. 78, 142–152 (2015).
21. Danti, M. D., Ali, C., Casana, J. & Prescot, K. W. ASOR Syrian Heritage Initiative (SHI): Planning for Safeguarding Heritage
Sites in Syria NEA-PSHSS14001 Weekly Report 9: October 6, 2014. (2014). Available at: https://www.asor.org/wp-content/uploa
ds/2019/09/ASOR_CHI_Weekly_Report_09r.pdf.
22. Danti, M. D., Casana, J., Paulette, T., Franklin, K. & Ali, C. ASOR cultural heritage initiatives (CHI): planning for safeguarding
heritage sites in Syria and Iraq NEA-PSHSS‐14-001 Weekly Report 25: January 26, 2015. (2015).
23. Danti, M. D. et al. ASOR cultural heritage initiatives (CHI): planning for safeguarding heritage sites in Syria and Iraq NEA—
PSHSS-14001 Weekly Report 28: February 16, 2015. (2015). Available at: https://www.asor.org/wp-content/uploads/2019/09/
ASOR_CHI_Weekly_Report_28r.pdf.
24. Floodlist. Middle East—over 20 dead, hundreds displaced after floods in Syria, Iran and Jordan—FloodList. (2018). Available at:
https://floodlist.com/asia/syria-iran-jordan-floods-october-2018.
25. Brinker, W. Zur Wasserversorgung von Resafa-Sergiupolis. Damaszener Mitteilungen 5, 119–146 (1991).
26. Agapiou, A., Alexakis, D. D. & Hadjimitsis, D. G. Potential of virtual earth observation constellations in archaeological research.
Sensors 19, 1–14 (2019).
27. European-Commission. Copernicus in brief | Copernicus. (2015). Available at: https://www.copernicus.eu/en/about-copernicus
/copernicus-brief.
28. European-Commission. Contributing Missions | Copernicus. Available at: https://www.copernicus.eu/en/contributing-missions.
29. European Space Agency. Sentinel-1: ESA’s Radar Observatory Mission for GMES Operational Services. (ESA CommunicationsESTEC,
PO Box 299, 2200 AG Noordwijk, The Netherlands, 2012).
30. Tapete, D. & Cigna, F. Trends and perspectives of space-borne SAR remote sensing for archaeological landscape and cultural
heritage applications. J. Archaeol. Sci. Rep. 14, 716–726 (2017).
31. Sentinel-2-Data products: sentinel handbook. Available at: https: //sentin els.copern
icus. eu/web/sentin
el/missio
ns/sentin
el-2/data-
products.
32. Sinergise. Sentinel-2 L2A products available on Sentinel Hub-Sentinel Hub Blog-Medium. (2017). Available at: https://mediu
m.com/sentinel-hub/sentinel-2-l2a-products-available-on-sentinel-hub-beab58903285.
33. Covello, F. et al. COSMO-SkyMed an existing opportunity for observing the Earth. J. Geodyn. 49, 171–180 (2010).
34. Caltagirone, F. et al. The COSMO-SkyMed dual use earth observation program: Development, qualification, and results of the
commissioning of the overall constellation. IEEE J. Sel. Top. Appl. Earth Obs. Remote Sens. 7, 2754–2762 (2014).
35. Tapete, D. & Cigna, F. COSMO-SkyMed SAR for detection and monitoring of archaeological and cultural heritage sites. Remote
Sens. 11, 1–25 (2019).
36. Battagliere, M. L., Virelli, M., Lenti, F., Lauretta, D. & Coletta, A. A review of the exploitation of the operational mission COSMO-
SkyMed: global trends (2014–2017). Sp. Policy 48, 60–67 (2019).
37. Boschetti, M., Nutini, F., Manfron, G., Brivio, P. A. & Nelson, A. Comparative analysis of normalised difference spectral indices
derived from MODIS for detecting surface water in flooded rice cropping systems. PLoS ONE 9, 1–21 (2014).
38. Terradue. SNAC—SNAP S-1 GRD amplitude change—geohazards thematic exploitation platform 2.1 documentation. Available
at: https://terradue.github.io/doc-tep-geohazards/tutorials/rss_snap_s1_snac.html.
39. Foumelis, M. et al. Monitoring Geohazards using on-demand and systematic services on Esa’s Geohazards exploitation platform.
in International Geoscience and Remote Sensing Symposium (IGARSS) 5457–5460 (IEEE, 2019). https://doi.org/10.1109/IGARS
S.2019.8898304
40. Cigna, F., Tapete, D., Lasaponara, R. & Masini, N. Amplitude change detection with ENVISAT ASAR to image the cultural land-
scape of the Nasca Region Peru. Archaeol. Prospect. 20, 117–131 (2013).
41. Terradue. COIN—Coherence and Intensity change for Sentinel-1—Geohazards Thematic Exploitation Platform 2.1 documenta-
tion. Available at: https://terradue.github.io/doc-tep-geohazards/tutorials/rss_snap_s1_coin.html.
42. University of East Anglia Climatic Research Unit, Harris, I.C.; Jones, P. D. Dataset Record: CRU TS4.03: Climatic Research Unit
(CRU) Time-Series (TS) version 4.03 of high-resolution gridded data of month-by-month variation in climate (Jan. 1901–Dec.
2018). Available at: https://catalogue.ceda.ac.uk/uuid/10d3e3640f004c578403419aac167d82.
43. UNESCO. Ancient City of Bosra: Maps-UNESCO World Heritage Centre. Available at: https://whc.unesco.org/en/list/22/multi
ple=1&unique_number=2209.
Acknowledgements
Research carried out using COSMO-SkyMed Products, credits: Italian Space Agency (ASI), delivered under a
license to use by ASI (Project “Multi-SAR”, led by Deodato Tapete) and processed by the authors using GAMMA
SAR and Interferometry Software licensed to ASI. Copernicus Sentinel-1 IW SAR data were processed by the
authors in ESA’s Geohazards Thematic Exploitation Platform (Geohazards TEP, or GEP), in the framework of
Scientific Reports | (2020) 10:12307 | https://doi.org/10.1038/s41598-020-69181-x 15
Vol.:(0123456789)You can also read