Snowmobile impacts on snowpack physical and mechanical properties - The Cryosphere
←
→
Page content transcription
If your browser does not render page correctly, please read the page content below
The Cryosphere, 12, 1121–1135, 2018
https://doi.org/10.5194/tc-12-1121-2018
© Author(s) 2018. This work is distributed under
the Creative Commons Attribution 3.0 License.

Snowmobile impacts on snowpack physical and
mechanical properties
Steven R. Fassnacht1,2,3,4 , Jared T. Heath1,5 , Niah B. H. Venable1,3 , and Kelly J. Elder6
1 Department   of Ecosystem Science and Sustainability – Watershed Science, Colorado State University,
Fort Collins, 80523-1476 CO, USA
2 Cooperative Institute for Research in the Atmosphere, Fort Collins, 80523-1375 CO, USA
3 Natural Resources Ecology Laboratory, Fort Collins, 80523-1499 CO, USA
4 Geographisches Institut, Georg-August-Universität Göttingen, 37077 Göttingen, Germany
5 City of Fort Collins, Water Resources & Treatment, Fort Collins, 80521 CO, USA
6 Rocky Mountain Research Station, US Forest Service, Fort Collins, 80526 CO, USA

Correspondence: Steven R. Fassnacht (steven.fassnacht@colostate.edu)

Received: 21 February 2017 – Discussion started: 18 April 2017
Revised: 20 February 2018 – Accepted: n 6 March – Published: 28 March 2018

Abstract. Snowmobile use is a popular form of winter recre-      1   Introduction
ation in Colorado, particularly on public lands. To examine
the effects of differing levels of use on snowpack properties,   In the United States snowmobiling accounts for between
experiments were performed at two different areas, Rabbit        USD 7 billion (American Council of Snowmobile Associa-
Ears Pass near Steamboat Springs and at Fraser Experimen-        tions, 2014) and USD 26 billion (International Snowmobile
tal Forest near Fraser, Colorado USA. Differences between        Manufacturers Association, 2016) in annual revenue, and
no use and varying degrees of snowmobile use (low, medium        much of the snowmobile use occurs on public land. The
and high) on shallow (the operational standard of 30 cm) and     United States National Forest System records about 6 million
deeper snowpacks (120 cm) were quantified and statistically      snowmobile visits annually, accessing about 327 000 km2
assessed using measurements of snow density, temperature,        of land (US Forest Service, 2010, 2013a). With continued
stratigraphy, hardness, and ram resistance from snow pit pro-    increases in the number of people participating in winter
files. A simple model was explored that estimated snow den-      recreation (Cook and Borrie, 1995; Winter Wildlands Al-
sity changes from snowmobile use based on experimental re-       liance, 2006; US Forest Service, 2010, 2013a; Nagler et al.,
sults. Snowpack property changes were more pronounced for        2012; Colorado Off-Highway Vehicle Coalition, 2016; Os-
thinner snow accumulations. When snowmobile use started          terberg, 2016), activities including increased snowmobile use
in deeper snow conditions, there was less difference in den-     may influence snowpack properties in these seasonally snow-
sity, hardness, and ram resistance compared to the control       covered environments. Of additional concern, is that climate
case of no snowmobile use. These results have implications       change will result in reduced land available for snowmobil-
for the management of snowmobile use in times and places         ing (Tercek and Rodman, 2016), likely increasing the impact
of shallower snow conditions where underlying natural re-        of snowmobile traffic.
sources could be affected by denser and harder snowpacks.           There have been limited studies regarding the influence of
                                                                 snowmobile use on snowpack properties (Keddy et al., 1979;
                                                                 Thumlert et al., 2013; Thumlert and Jamieson, 2015). Stud-
                                                                 ies have, however, examined how the snowpack changes due
                                                                 to snow grooming at ski resorts (Fahey et al., 1999; Keller et
                                                                 al., 2004; Spandre et al., 2016a), or to traction and mobility of
                                                                 wheeled vehicles across a snowpack (Abele and Gow, 1975;
                                                                 Shoop et al., 2006; Pytka, 2010). One of the few studies on

Published by Copernicus Publications on behalf of the European Geosciences Union.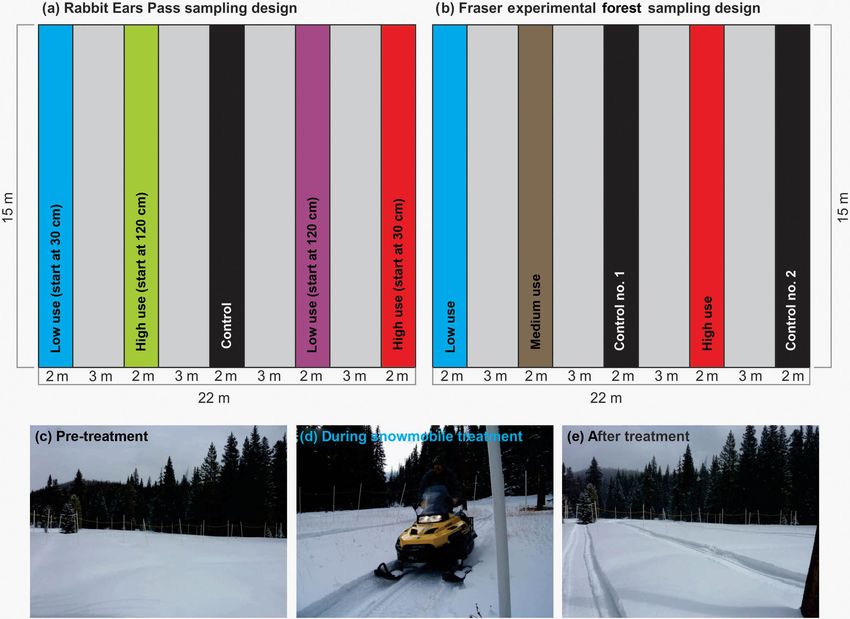
1122 S. R. Fassnacht et al.: Snowpack changes due to snowmobile use
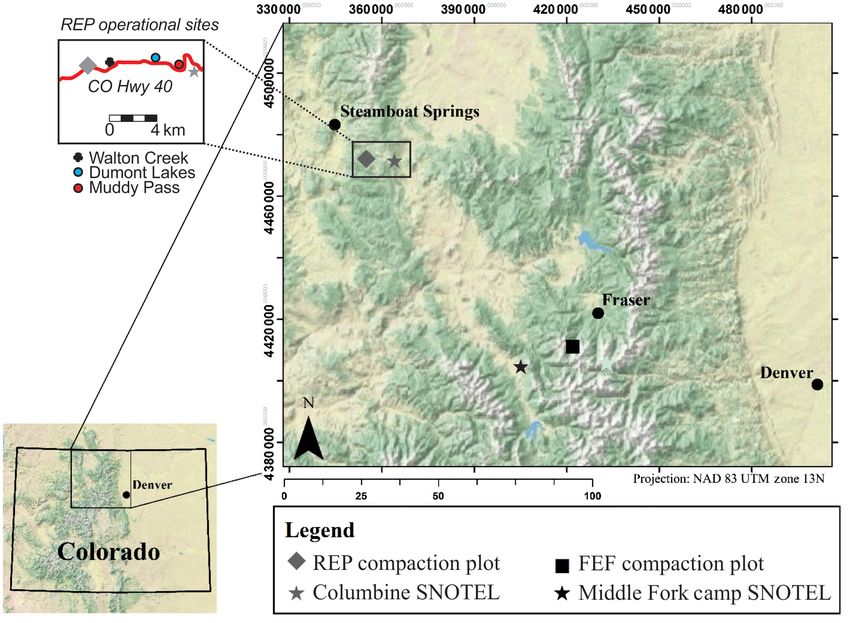
Figure 1. The snow compaction study plots are located in north-central Colorado. The Rabbit Ears Pass (REP) site is within the Routt
National Forest near the town of Steamboat Springs, as are the three operational (non-experimentally manipulated) sites (Walton Creek
with no use, Dumont Lakes with low to medium use, and Muddy Pass with high use based on field observations). The Columbine snow
telemetry (SNOTEL) station was used to identify the amount of annual snowfall in 2009–2010 compared to the long-term average. The
Fraser Experimental Forest (FEF) site is within the Arapaho–Roosevelt National Forest near the town of Fraser. The Middle Fork Camp
SNOTEL site was used to represent the year’s snowfall.
snowmobile use examined effects on very shallow snow (10– by snowmobiles; (2) to evaluate these changes based on the
20 cm deep) (Keddy et al., 1979). The authors found a dou- amount of use, depth of snow when snowmobile use begins,
bling of fresh snow density and a compression of the natural and the snowfall environment where snowmobiles operate;
vegetation below the snow (Keddy et al., 1979). Examining and (3) to create a simple model to estimate the change in
deeper snow cover (> 20 cm deep), Thumlert et al. (2013) snowpack density due to snowmobile use. This work ex-
and Thumlert and Jamieson (2015) examined the distribu- amines not only changes to the basal snowpack layer, but
tion of stresses through the snowpack due to type of loading, also to the entire snowpack. The positive economic impact
depth and snowpack stratigraphy (Thumlert et al., 2013). of snowmobiling and increasing winter recreation use from
Changing snowpack conditions from snowmobile use will non-motorized activities (such as backcountry skiers, snow-
have other impacts. Aside from the work done by Keddy shoers, and those on fat bikes) dictates a need to better un-
et al. (1979), there is limited research on how snowmobile derstand impacts to snow and underlying natural resources
activity influences underlying vegetation. The addition of in multi-use areas, especially when the information may be
snow due to snowmaking provides an indication of possible used by managers to reduce conflict among recreationists and
changes. Changes from snowmaking include a greater occur- protect the resource.
rence of soil frost, ice layers may form at the base of the
snowpack, and there is often a delay in vegetative growth
due to extended snow cover (Rixen et al., 2003). Snowmelt 2 Study sites
can occur later due to compaction and there is greater heat
loss from the densified snowpack and underlying soil, keep- During the 2009–2010 snow season a set of snow compaction
ing soil temperatures colder longer (Fassnacht and Soulis, plots were located near Rabbit Ears Pass (REP) in the Rocky
2002; Rixen et al., 2003). Mountains of northern Colorado to the southeast of the town
In our research, we specifically examined the effect of of Steamboat Springs. REP is within the Medicine Bow-
snowmobile use on the physical and material properties of Routt National Forest (NF; Fig. 1) along the Continental Di-
the snowpack. The objectives were as follows: (1) to quantify vide encompassing over 9400 km2 of land in Colorado and
changes to physical snowpack properties due to compaction Wyoming. Rabbit Ears Pass is especially popular during the
winter season and is heavily used by snowmobilers and other
The Cryosphere, 12, 1121–1135, 2018 www.the-cryosphere.net/12/1121/2018/
S. R. Fassnacht et al.: Snowpack changes due to snowmobile use                                                             1123

winter recreationists due to the ease of access to backcoun-     meadow at an elevation of 2851 m surrounded by lodgepole
try terrain from Colorado Highway 40. Due to heavy use and       pine (Pinus contorta) forest. The Fraser Experimental Forest
conflict among users during the winter season, the Forest Ser-   is closed to snowmobile use, but is used to access backcoun-
vice manages Rabbit Ears Pass for both non-motorized and         try terrain by snowshoers, skiers, and snowboarders. The
motorized uses. The west side of the pass is designated for      Middle Fork Camp SNOTEL station, located at an elevation
non-motorized use and prohibits motorized winter recreation      of 2725 m, was used to characterize the 2009–2010 winter at
while the east side of the pass is a mixed-use area and is       FEF.
open to motorized use (Fig. 1). This study area was selected
to determine if differences in snowpack properties will be ob-
served between the non-motorized and motorized use areas         3     Methods
(e.g., Walton Creek versus Dumont Lakes and Muddy Pass
                                                                 3.1    Experimental snow compaction plots
in Fig. 1).
   Two REP experimental snow compaction study plots were         Snow compaction study plots were established in undis-
located adjacent to one another within an open meadow            turbed areas at the REP and FEF study areas. Each plot was
north of Colorado Highway 40 at an elevation of approx-          22 m wide and 15 m long (Fig. 2a and b). Plots were di-
imately 3059 m (Fig. 1). The snow compaction sites were          vided into equal width transects (2 m) and treated with low,
established within an area that prohibits motorized use to       medium (FEF only), or high snowmobile use, including a no
protect the study sites from unintended impacts of snow-         treatment control transect representing an undisturbed snow-
mobilers. Data from the Columbine snow telemetry (SNO-           pack. Two control transects were used at FEF to represent
TEL) station, located at an elevation of 2792 m, was used        the undisturbed snowpack (Fig. 2b). Integrating two controls
to show how the 2009–2010 winter compared to other win-          in the FEF study plot allowed for replication and determina-
ters at REP. The SNOTEL network was established in the           tion of variability. The location of control and treatment plots
late 1970s across the western United States by the Natural       across each study site were randomly selected. Each transect
Resources Conservation Service to monitor snowpack prop-         was separated by a 3 m buffer to eliminate the influence of
erties. Initially snow water equivalent and precipitation were   compaction treatments on adjacent transects (Fig. 2a and b).
monitored, however, temperature and snow depth were added           Transects were treated by driving a Ski-Doo brand snow-
in the 1990s–2000s to aid in operational runoff volume fore-     mobile weighing about 300 kg including the rider (Fig. 2d) at
casting (see https://www.wcc.nrcs.usda.gov/).                    10 km h−1 over the length of each transect 5, 25 (FEF only),
   Three sites were not experimentally manipulated, i.e., the    or 50 times, representing low, medium (FEF only), and high
specific amount of snowmobile use was unknown, and were          snowmobile use, respectively. Treatments began (Fig. 2c)
identified as operational sites along Colorado Highway 40 on     when non-compacted snow depths were approximately
REP (Fig. 1 left inset). The ”natural” control site was Walton   30 cm (12 inches) for both locations, and when unpacked
Creek, located west of Rabbit Ears Pass in an open meadow        snow depths equaled approximately 120 cm (48 inches) for
at an elevation of 2895 m within a managed area that pro-        REP only (Fig. 2a). Treatments were implemented (Fig. 2e)
hibits motorized use. Snowshoers, skiers, and snowboarders       monthly thereafter, until peak accumulation (Fig. 3). Snow-
primarily use this area in the winter to access backcountry      pack sampling was usually performed within a week after
terrain. Two sites, Dumont Lakes and Muddy Creek, were           each treatment (Figs. 2 and 3). At FEF, snowpack sampling
located east of REP at an elevation of about 2900 m within       was performed prior to the first treatment to illustrate range
an area managed for motorized and mixed uses; the sites          of spatial variability across the plots (first set of points in
were located in open meadows near their respective trail-        Fig. 4b).
heads (Fig. 1). These trailheads provide backcountry access
to snowmobilers. Snowmobile use in the meadows near the          3.2    Snow pit analyses and data collection
trailheads is medium to high, especially on weekends and
over holidays (Robert Skorkowsky, personal communication,        Snow pit profiles were used to examine the physical prop-
2010). The meadow near the Muddy Creek trailhead is more         erties of the snowpack at both the experimental and oper-
heavily used by snowmobiles than the meadow near the Du-         ational sites. A vertical snow face was excavated by dig-
mont Lakes trailhead.                                            ging a pit from the snow surface to the ground. Measure-
   Another experimental snow compaction plot was estab-          ments of snow density, temperature, stratigraphy, hardness,
lished during the same winter snow season of 2009–2010           and ram resistance were taken vertically along the snowpack
at the Fraser Experimental Forest (FEF) near the town of         profile. Total snow depth was measured from the ground up,
Fraser, Colorado in the Rocky Mountains of central Colorado      and combined with density to yield snow water equivalent
(Fig. 1). The 93 km2 experimental forest is a research unit      (SWE). Physical snowpack properties were compared be-
of the United States Forest Service (USFS) Rocky Moun-           tween non-snowmobile (control) and varying degrees (low,
tain Research Station (RMRS) located within the Arapaho          medium (FEF), and high) of snowmobile use (treatment).
NF. The FEF snow compaction site was located in a small

www.the-cryosphere.net/12/1121/2018/                                                  The Cryosphere, 12, 1121–1135, 2018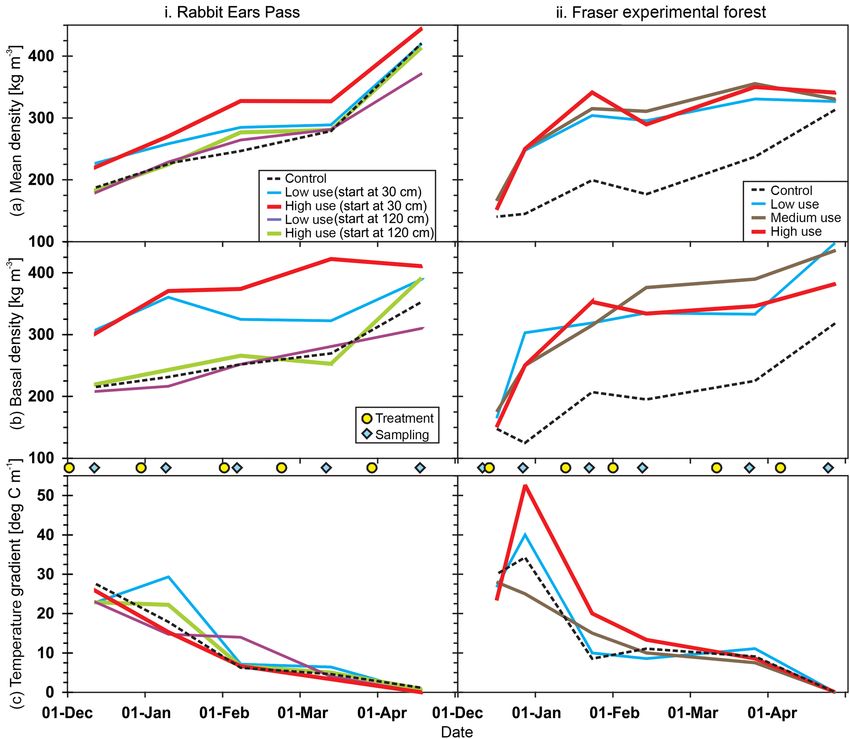
1124                                                              S. R. Fassnacht et al.: Snowpack changes due to snowmobile use

Figure 2. The sampling design for the snow compaction plots at (a) Rabbit Ears Pass, (b) Fraser Experimental Forest, and photographs of
the study plots (c) pre-treatment, (d) during treatment, and (e) after treatment. The colors used for the control and treatment plots are used in
Figs. 5–8.

   Density was measured at 10 cm intervals, from the sur-                  bulk temperature gradient were compared. The temperature
face of the snowpack to the ground, by extracting a 250                    gradient (TG in ◦ C m−1 ) was calculated as the ratio of the
or 1000 mL snow sample using a stainless-steel wedge cut-                  change in temperature (1T in ◦ C) with the distance (d in m)
ter (http://snowmetrics.com/) and measuring the mass on an                 over which the change in temperature occurred. The snow-
electronic scale with a resolution of 1 g. At least two sam-               pack temperature gradient was approximated as linear from
ples were taken per 10 cm interval. With the 1000 mL wedge                 an upper boundary that was 25–30 cm below the surface to
cutter, the density of the snow (ρs in kg m−3 ) was read di-               the lower boundary at 0 cm. For this study, the depth below
rectly from the scale as the volume of the cutter is 1/1000                the snow surface where temperature did not fluctuate diur-
of a cubic meter and a gram is 1/1000 of a kilogram. For                   nally was used as the upper boundary to remove bias from
the 250 mL cutter, the mass measurement results were mul-                  diurnal fluctuations (Pomeroy and Brun, 2001). Basal layer
tiplied by four to obtain density. Snowpack density profiles               temperatures taken at 0 cm were used to compare tempera-
were created from samples extracted at discrete 10 cm inter-               ture changes near the snow–ground interface.
vals vertically along the working face of the snow pit. The                   Stratigraphic measurements were used to illustrate the
bulk snowpack density was determined by averaging den-                     evolution of the snowpack over time through characteriza-
sity measurements over the entire depth of the snowpack. A                 tion of the shape, size, and layering of snow crystals within
mean of the density measurements for the bottom 10 cm of                   the snowpack. Classification of grain morphology was based
the snowpack was used to evaluate changes near the snow                    on The International Classification for Seasonal Snow on the
and ground interface (basal layer).                                        Ground (Fierz et al., 2009) and mean grain size was mea-
   Temperature measurements were obtained at 5 cm inter-                   sured and recorded to the nearest 0.5 mm using a hand lens
vals from the top to the bottom of the snowpack using a                    and a crystal card. The crystal forms were identified as pre-
dial stem thermometer with ±1 ◦ C accuracy. Temperature                    cipitation particles, rounded grains, faceted grains, and ice
gradients are well represented by this instrument, and the                 layers.
repeatability of temperature measurements are better than                     Hardness is the penetration resistance of the snowpack
±1 ◦ C (Elder et al., 2009; American Avalanche Association,                (Fierz et al., 2009), and is reported as the force per unit
2016). Snowpack temperature profiles and the corresponding                 area required to penetrate the structure of the snowpack

The Cryosphere, 12, 1121–1135, 2018                                                              www.the-cryosphere.net/12/1121/2018/
S. R. Fassnacht et al.: Snowpack changes due to snowmobile use                                                                                              1125

Table 1. Statistical differences (p values) between no snowmobile use (control) and varying snow compaction treatments on snowpack
properties at the study plots located at Rabbit Ears Pass (REP) and Fraser Experimental Forest (FEF), Colorado during the 2009–2010 winter
season for (a) density, (b) temperature, (c) hardness, and (d) ram resistance.

                                                                                                              Shallow initiation depth (30 cm)
                   (a) Density                                                                 Control
                                                                                                                   Low         Medium               High
                                                                             Low             < 0.01∗∗                                         < 0.01∗∗
                             Shallow initiation depth (30 cm)
                                                                             High            < 0.01∗∗        < 0.01∗∗
                   REP
                                                                             Low                   0.44      < 0.01∗∗                         < 0.01∗∗
                             Deep initiation depth (120 cm)
                                                                             High                  0.24      < 0.01∗∗                         < 0.01∗∗
                                                                             Low             < 0.01∗∗                               0.29             0.30
                   FEF       Shallow initiation depth (30 cm)                Medium          < 0.01∗∗               0.29                             0.98
                                                                             High            < 0.01∗∗               0.30            0.98
                   (b) Temperature                                                             No use
                                                                             Low                   0.22                                              0.11
                             Shallow initiation depth (30 cm)
                                                                             High                  0.70             0.11
                   REP
                                                                             Low                   0.77             0.34                             0.50
                             Deep initiation depth (120 cm)
                                                                             High                  1.00             0.22                             0.70
                                                                             Low                   0.12                             0.89             0.10
                   FEF       Shallow initiation depth (30 cm)                Medium                0.14             0.89                             0.13
                                                                             High                  0.64             0.10            0.13
                   (c) Hardness                                                                No use
                                                                             Low             < 0.01∗∗                                                0.16
                             Shallow initiation depth (30 cm)
                                                                             High            < 0.01∗∗               0.16
                   REP
                                                                             Low                   0.42      < 0.01∗∗                         < 0.01∗∗
                             Deep initiation depth (120 cm)
                                                                             High                  0.06         0.02∗                         < 0.01∗∗
                                                                             Low             < 0.01∗∗                               0.36           0.01∗
                   FEF       Shallow initiation depth (30 cm)                Medium          < 0.01∗∗              0.36                             0.08
                                                                             High            < 0.01∗∗             0.01∗             0.08
                   (d) Ram resistance                                                          No use
                                                                             Low             < 0.01∗∗                                                0.08
                             Shallow initiation depth (30 cm)
                                                                             High            < 0.01∗∗               0.08
                   REP
                                                                             Low                   0.32      < 0.01∗∗                         < 0.01∗∗
                             Deep initiation depth (120 cm)
                                                                             High                  0.07         0.01∗                         < 0.01∗∗
                                                                             Low             < 0.01∗∗                               0.33      < 0.01∗∗
                   FEF       Shallow initiation depth (30 cm)                Medium          < 0.01∗∗            0.33                         < 0.01∗∗
                                                                             High            < 0.01∗∗        < 0.01∗∗         < 0.01∗∗
                 Statistically significant differences at the p < 0.05 confident level are denoted with an asterisk, and highly significant (p < 0.01)
                 difference are denoted with two asterisks.

(McClung and Schaerer, 2006); it is affected by snow-                                     required to penetrate the snow was recorded. The snow hard-
pack microstructure and bonding characteristics of the snow                               ness (hi in N m−2 ) for each stratigraphic layer was calcu-
grains (Shapiro et al., 1997). Hardness measurements were                                 lated as the force required to penetrate the snow (F in N)
taken horizontally with a force gauge in each stratigraphic                               per unit area of the circular metal plate (A in m2 ). All layers
layer using a Wagner Instruments Force Dial gauge (http:                                  thicker than 5 cm were identified using the 5 cm diameter of
//wagnerinstruments.com) with maximum force measure-                                      the plate. The bulk snowpack hardness (HB in N m−2 ) was
ments of 25 and 100 N, and fabricated circular metal plate                                determined by weighting each stratigraphic layer hardness
attachments of 20 cm2 in area. For each measurement, the                                  measurement by the stratigraphic layer thickness. The hard-
circular metal plate was pushed into the snow and the force                               ness associated with the bottom stratigraphic layer for each

www.the-cryosphere.net/12/1121/2018/                                                                                     The Cryosphere, 12, 1121–1135, 2018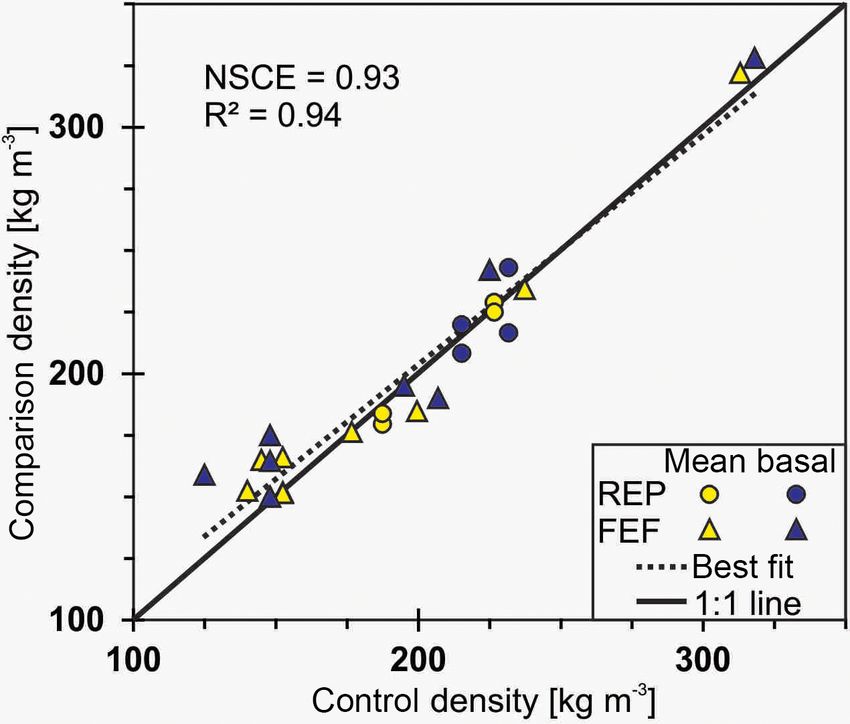
1126                                                       S. R. Fassnacht et al.: Snowpack changes due to snowmobile use

transect was used to describe hardness changes in the basal
layer of the snowpack.
   The standard ram penetrometer is an instrument with a
cone on the end of a rod onto which a hammer of defined
weight is dropped from a given height and the depth of pen-
etration is recorded; it was used here to vertically measure
the resistance of snow layers to assess the change in ram re-
sistance due to compaction (American Avalanche Associa-
tion, 2016). A ram profile measurement was taken 0.5 m from
the edge of the snow pit wall subsequent to snow pit profile
measurements. The mean ram resistance (SB in N) was de-
termined by weighting each ram resistance value obtained
from the standard ram penetrometer measurement with the
depth sampled. The ram resistance value associated with the
bottom layer was measured to describe changes in ram resis-
tance in the basal layer of the snowpack.

3.3    Statistical analyses

Data were analyzed using the Mann–Whitney–Wilcoxon               Figure 3. Mean snow depth from 2003–2017, and for the 2010 wa-
                                                                 ter year (WY2010) measured at (a) the Columbine SNOTEL site
rank sum test (Wilcoxon, 1945; Mann and Whitney, 1947).
                                                                 near Rabbit Ears Pass (REP), Colorado and (b) the Middle Fork
This statistical test is non-parametric and determines whether
                                                                 Camp SNOTEL near Fraser Experimental Forest (FEF), Colorado,
two independent samples were selected from populations           illustrating the dates of treatment and dates of sampling. Data were
having the same distribution. For this work, the sets of sam-    obtained online from the Natural Resource Conservation Service
ples compared were density, temperature, hardness, and ram       (NRCS) National Water and Climate Center (http://www.wcc.nrcs.
resistance profiles for the five different monthly measure-      usda.gov/).
ments and the controls (Table 1). A statistical significance
was determined for the 95 % (significant) and 99 % (highly
significant) confidence interval (p < 0.05, and p < 0.01) and    at the REP snow compaction study plot was approximately
noted with an asterisk in Table 1.                               1.5 m and represents a deeper snow cover environment for
                                                                 Colorado. From the Middle Fork SNOTEL data, the 2009–
3.4    Bulk snowpack density change model                        2010 winter snow depth at FEF was also below the 15-year
                                                                 historical average (Fig. 3b). The measured snow depth at the
A multi-variate non-linear model was created to estimate the
                                                                 FEF snow compaction study plot never exceeded 1 m, similar
change in bulk snowpack density for various treatments com-
                                                                 to the Middle Fork Camp, and therefore was used to repre-
pared to the control (no use) using the following snowpack
                                                                 sent a shallower snow cover environment.
properties: depth, bulk density, and the number of passes
(Fig. 8). The cross-correlation between variables was consid-
                                                                 4.2     Snowpack properties
ered to reduce model over-fitting. The model was calibrated
with the experimental data from REP and FEF, and evalu-
                                                                 4.2.1    Density
ated using data from the operational sites with Walton Creek
as the control, Dumont Lakes as medium use, and Muddy
                                                                 The natural variability in density was small at the test sites
Creek as high use. The Nash–Sutcliffe coefficient of effi-
                                                                 (Fig. 4). At REP, deep snow (120 cm) compaction treat-
ciency (NSCE, Nash and Sutcliffe, 1970) was used to evalu-
                                                                 ments were not initiated until after the second sampling date
ate the fit of the model.
                                                                 (Fig. 3a), so density for the deep snow low and high use
                                                                 treatments could then be compared to the control; these show
4     Results                                                    minimal difference (Fig. 4). At FEF, there were two sets of
                                                                 control snow pits, and sampling occurred before treatment at
4.1    The measurement winter                                    all plots (Fig. 3b). These differences in density were greater
                                                                 than those at REP but were still small (Fig. 4).
The 2009–2010 winter at REP had slightly below aver-                The mean density values at the FEF plots were almost the
age snow depth compared to the 15-year mean, based on            same at the end of the sampling period in April (Fig. 5a, col-
the Columbine SNOTEL data averaged from 2003–2017                umn ii). The mean snowpack density increased over the snow
(Fig. 3a). A peak SWE value of 556 mm on 9 April was 93 %        season (Fig. 5a), with the exception of the FEF control and
of the historical average. Maximum snow depth measured           at the high use site on 12 February 2010 due to fresh snow

The Cryosphere, 12, 1121–1135, 2018                                                   www.the-cryosphere.net/12/1121/2018/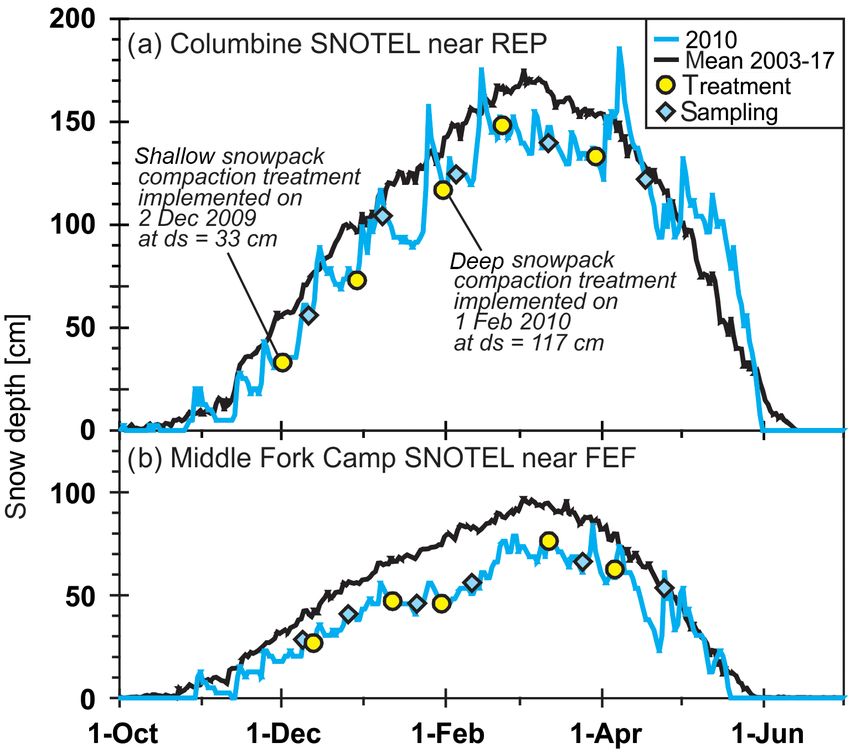
S. R. Fassnacht et al.: Snowpack changes due to snowmobile use                                                                    1127

                                                                         pack of 30 cm and on a deep snowpack of 120 cm did not re-
                                                                         sult in significant changes in temperature gradient. The max-
                                                                         imum temperature gradients were observed on the earliest
                                                                         sampling date (12 December, Fig. 5c), while they were al-
                                                                         most the same for the control, low use, and high use com-
                                                                         paction treatments that began on a deep snowpack. Temper-
                                                                         ature gradients for all treatments decreased throughout the
                                                                         winter season, and were isothermal at 0 ◦ C m−1 by mid to
                                                                         late April (Fig., 5c, columns i and ii), since the snow had
                                                                         stared to melt (Fig. 3). Overall, temperature gradients were
                                                                         not very different (Fig. 5c) and the variations among treat-
                                                                         ments were not found to be significant (Table 1b). At FEF,
                                                                         gradients in the high use were greatest after the first treat-
                                                                         ment and the temperature gradients were essentially the same
                                                                         by March (Fig. 5c, column ii).
Figure 4. Spatial variability of mean (yellow) and basal (blue)
snowpack density. At the Rabbit Ears Pass (REP shown with circles)       4.2.3   Hardness
the deep snow (120 cm) compaction treatments (low and high use)
are compared to the control on the first two sampling dates (pre-        The snowpack was harder for snowmobile use starting on
treatment, Fig. 3a). At the Fraser Experiment Forest (FEF shown          30 cm than the control (no use) for both sites (Fig. 5d and e).
with triangles) the two sets of control snow pits were compared,         Mean snowpack hardness did not change much over time
and all plots were sampled prior to the initial treatment and are com-
                                                                         (Fig. 5d), except once high use treatments started (6 Febru-
pared (see Fig. 5a and b, columns i and ii, respectively).
                                                                         ary) on a deeper snowpack. However, basal layer hardness
                                                                         did decline at REP for both high and low use starting on
deposition. At the REP snow compaction study site, mean                  30 cm (Fig. 5e, column i). With treatments at FEF, the hard-
density for high use compaction treatments starting on 30 cm             ness was always much higher than the control (Fig. 5d, col-
of snow was greater throughout the measurement period than               umn ii). Hardness initially increased at the REP snow com-
the no use treatment (Fig. 5a, column i, Fig. 6a, columns i,             paction study site following low and high use compaction
and ii), while the density from low and high use starting on             treatments that began on 30 cm of snow (Fig. 5d, column i),
the deeper snowpack of 120 cm was very similar to that mea-              but these were about the same as the control by 17 April,
sured for no use. The snowpack was more dense for low                    when melt had started. Significant increases in hardness were
use on the shallower snowpack (start at 30 cm) than the con-             observed between treatments that began on 30 cm of snow
trol for all sampling dates, with the exception of 13 March              and the control (Table 1c). There was also a significant dif-
(Fig. 5a, column i). Density differences are more pronounced             ference in hardness for deep and shallow initiation depths
for the basal layer (Fig. 5b); for compaction treatments start-          (Table 1c). In contrast, mean snowpack hardness was not sig-
ing at 30 cm, the lowest layers were much more dense than                nificantly impacted by snow compaction treatments that be-
the control (Fig. 6a). Densities for the compaction treatments           gan on 120 cm of snow (Table 1c). Mean snowpack hardness
starting at 30 cm were significantly different than the con-             increased following the initial snow compaction treatments
trol and compaction treatments beginning at 120 cm of snow               for low starting on 30 cm and high use for starting on both
(Table 1a). The density differences between the treatments               30 and 120 cm (Fig. 5d, column i). Subsequent compaction
on the deep snow (120 cm) and the control were not signifi-              treatments did not appear to have a large effect (Fig. 5d, col-
cantly different (Table 1a).                                             umn ii). There were minimal differences by the last sampling
   Density increases due to snowmobile use were much                     date (Fig. 5e, column i).
greater at Fraser (Fig. 5a, column i and Fig. 5b, column ii)                Snow compaction treatments that began on 30 cm of snow
than Rabbit Ears. All treatments at FEF were significantly               increased basal layer hardness (Fig. 5e, column i), but treat-
different than the control, but the difference among treat-              ments that began on 120 cm of snow did not impact basal
ments was not significant (Table 1a). The density differ-                layer hardness (Fig. 5e, column i). For both controls and
ences among treatments are highlighted in the 10 cm indi-                all treatments that began on 120 cm of snow (Fig. 5e, col-
vidual density measurements (Fig. 6a) and in the basal layer             umn i), the maximum basal layer hardness was about 6 kPa.
(Fig. 5b, column ii).                                                    Increased hardness due to snowmobile use showed similar
                                                                         temporal patterns to densification (Fig. 5a and d). At REP,
4.2.2   Temperature                                                      snowmobile use compacted the second layer below the sur-
                                                                         face, and high use (50 passes) made that layer about 10 times
Low and high use compaction treatments at the REP snow                   harder than the low use (five passes) snowpack (Fig. 6b,
compaction study site that began on both a shallow snow-                 columns i and ii).

www.the-cryosphere.net/12/1121/2018/                                                          The Cryosphere, 12, 1121–1135, 2018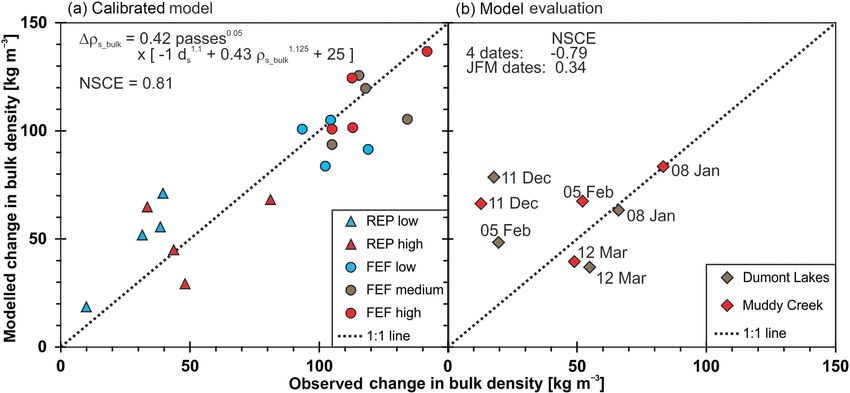
1128                                                       S. R. Fassnacht et al.: Snowpack changes due to snowmobile use

Figure 5.

   There was more spatial variability in snowpack hardness       that began on both 30 and 120 cm of snow. Snow compaction
(NSCE of 0.50; results not shown graphically) than differ-       treatments at the FEF snow compaction study site caused a
ences in density (NSCE of 0.93 in Fig. 4) for low and high       significant increase in mean snowpack ram resistance (Ta-
use compaction treatments versus the control on the first two    ble 1d, e.g., Fig. 6c, column iii for the February sampling
sampling dates at REP and for the control snow pits at FEF       dates). Basal layer ram resistance increased following the ini-
on the pre-treatment date. These larger differences are both     tial snow compaction treatments and continued to increase
attributed to spatial variability, but mostly to the low range   throughout the duration of the winter season.
of non-treatment hardness values from 0.4 to 5.8 kPa com-
pared to the range of treatment hardness values from 30 to
1157 kPa (Fig. 5d and e).                                        4.2.5   Grain size

4.2.4   Ram resistance                                           Smaller crystals in the basal layer were observed for snow-
                                                                 mobile use starting on a shallow snowpack compared to the
Low and high use compaction treatments at REP caused an          control or starting on a deeper snowpack (Fig. 5f). Rounded
increase in mean snowpack ram resistance, but the differ-        grains were observed during the first sampling at REP shal-
ence was not significant for treatments that began on deep       low depth snowmobile start, with faceted grains for the fol-
snow (120 cm; Table 1d). After the initial snow compaction       lowing three sampling dates (Fig. 5f, column i). Rounding
treatments mean snowpack ram resistance for low and high         facets were observed on the last sampling day at both sites.
use was greater than the control for the entire study period,    At FEF, there were 3 to 4 mm faceted crystals prior to the
but by the end of the study period minimal differences were      treatments; fragmentation was noted in the faceted crystals
observed between treatments. Basal layer ram resistance in-      found in the basal layer of the treated plots, which began
creased as a result of low and high use compaction treatments    rounding by the last sampling date (Fig. 5f, column ii). The

The Cryosphere, 12, 1121–1135, 2018                                                   www.the-cryosphere.net/12/1121/2018/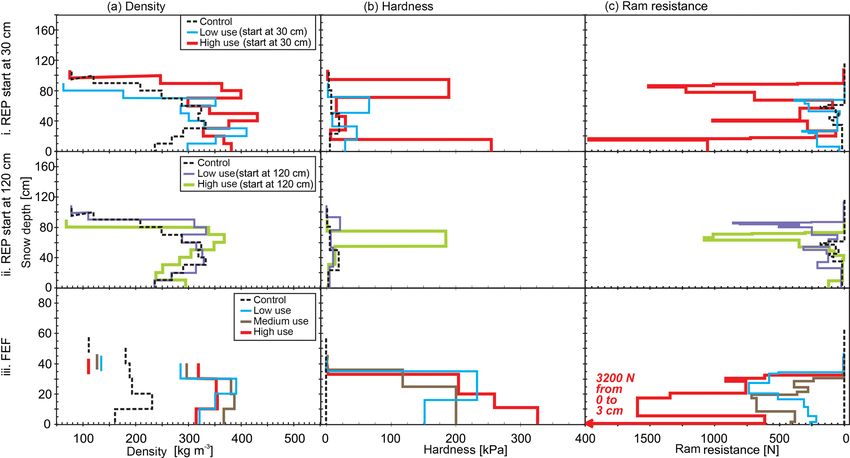
S. R. Fassnacht et al.: Snowpack changes due to snowmobile use 1129
Figure 5. Time series for (i) Rabbit Ear Pass (REP) and (ii) Fraser Experimental Forest (FEF) at the different sampling dates of (a) mean
snowpack density, (b) basal snowpack density, (c) snowpack temperature gradient, (d) mean snowpack hardness, (e) basal layer hardness,
and (f) mean basal crystal size and shape. The crystal shape is included as per Fierz et al. (2009), with the exception of faceted crystals
that were fragmented. Note that the snowpack at the low and high use start at 30 cm could not be adequately tested for hardness on the first
sampling date at the REP treatment plots.
shallower snow at FEF enabled large faceted crystals to grow highest density throughout the winter, and the hardest snow-
in the basal layer, up to 9 mm in size (Fig. 5f, column ii). pack for mid-winter (Fig. 7b), but at times the results for Du-
mont Lakes were similar.
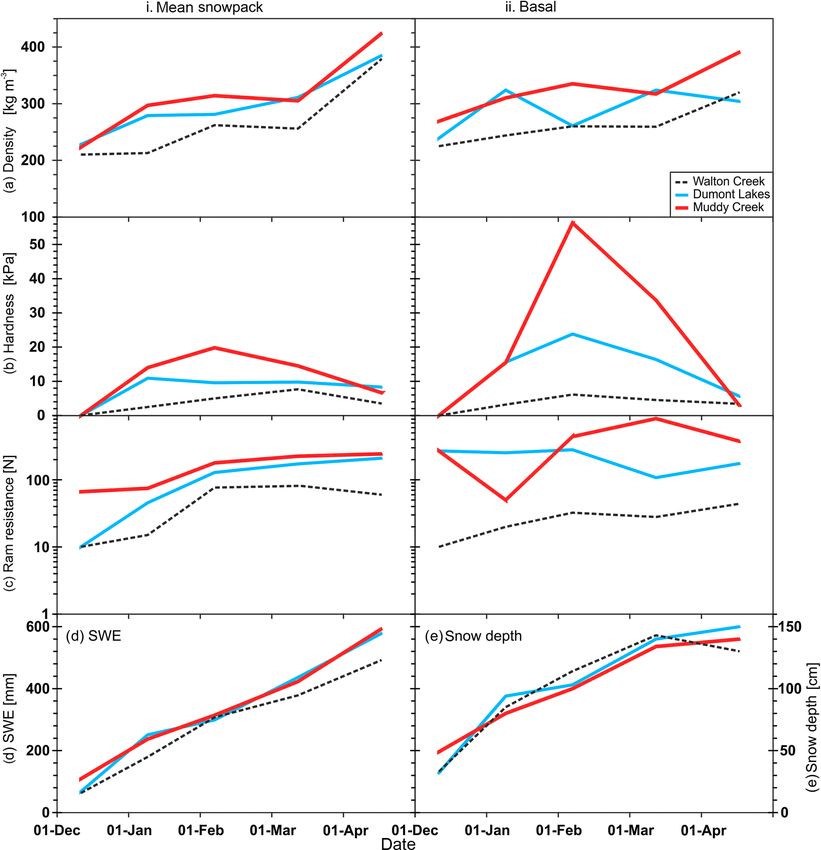
4.3 Operational sites
4.4 Bulk snowpack density change model
As illustrated by SWE (Fig. 7d) and snow depth (Fig. 7e), the
amount of snow was comparable for the snow pits dug at the A non-linear bulk snowpack density change model was cre-
three operational sites, even though they were located up to ated using data from the experiments prior to onset of melt
6 km apart (Fig. 1). Also since these were operational sites, conditions (Fassnacht et al., 2010); before the last sampling
the amount of treatment was not controlled and was based date (Fig. 3) and prior to when the difference in density be-
solely on permitted snowmobile use. Generally, patterns of tween the control and treatments was small (Fig. 5a). Ad-
increased density (Fig. 7a), hardness (Fig. 7b), and ram resis- ditionally, treatments starting on a deep snowpack at REP
tance (Fig. 7c) seen at the REP operational sites were similar were not significantly different than the control (Fig. 5a, Ta-
to the overall patterns seen in the previously presented ex- ble 1) and were not used in fitting the model. The variables of
periments from REP and FEF (Figs. 5, and 6) with the non- number of passes per treatment, depth, and bulk density were
snowmobile impacted snow pits being less dense (Fig. 7a) tested for correlations that might result in model over-fitting.
and having layers that were less hard (Fig. 7b). From visual Cross-correlation results were small (R 2 < 0.04), so these
inspection of the sites and the measurement results, Muddy variables were used to create the model. Difference in bulk
Creek had the most snowmobile use and thus exhibited the density compared to the control due to snowmobile use is a
www.the-cryosphere.net/12/1121/2018/ The Cryosphere, 12, 1121–1135, 20181130 S. R. Fassnacht et al.: Snowpack changes due to snowmobile use
Figure 6. (a) Density, (b) hardness, and (c) ram resistance profiles for the February sampling dates (6 February at REP and 12 February at
FEF) measured at the REP snow compaction study plot for no (control), low, and high use treatments beginning on (i) 30 cm and (ii) 120 cm
of snow, and (iii) the FEF snow compaction study plot for no (control), low, medium, and high use treatments beginning on 30 cm of snow.
Note that free floating measurements represent overlapping density measurements. The ground is at zero snow depth.
function of the number of passes per treatment and bulk den- and hardness from snowmobile use is greatest compared to
sity, but it is inversely related to snow depth (Fig. 8a). The an untreated snowpack in early to mid-season (January) for
optimal model had a NSCE of 0.81 (Fig. 8a), which is con- a deeper snowpack at REP, with density increases of 7–33 %
sidered very good (Moriasi et al., 2007). The model was cal- and hardness 4 to 13 times greater than the control (Fig. 5a
ibrated on the experimental data (Fig. 8a) and applied to the and d, column i). For a shallower snowpack at FEF, den-
operational sites (Fig. 8b), with no passes occurring equiva- sity increased by 64–76 % and hardness was 500–2000 times
lent to a density change of 0 kg m−3 . The evaluation results greater than the control (Fig. 5a and d, column i).
were less optimal, with a NSCE of −0.79 for the four dates Similar differences were found from ski run grooming in
tested in December through March (Fig. 8b). The poorer an Australia snowpack with a 400 % increase in hardness
performance of the model at the operational sites is due to early in the snow season but only about a 40 % increase later
an unknown number of snowmobile passes at each site and in the winter (Fahey et al., 1999). Snow grooming increased
from limited snowmobile use early in the season (Decem- the average density by up to 36 % compared to non-groomed
ber), resulting in minimal differences between compaction ski slopes (Fahey et al., 1999; Rixen et al., 2001).
levels at that time (Figs. 7 and 8b). Removing the December At rest, a snowmobile and its rider exert 4 to 10 kPa of
data points and using only the January through March dates pressure on the underlying snowpack. This assumes a track
improved the model fit to a NSCE of 0.34 (Fig. 8b). length from 0.9 to 1.4 m, width of 0.50 m, a snowmobile
weight of 200 to 350 kg, and a rider weight of about 100 kg
(data from http://www.polaris.com/). There is an increase of
5 Discussion less than an order of magnitude due to snowmobile move-
ment. Thumlert et al. (2013), measured stresses of about 10
5.1 Observed changes to snowpack properties to 20 kPa at a depth of 30 cm below the surface of a deep
snowpack. At 20 cm below the snow surface, the induced
Snowpack changes were observed for varying snowmobile stress from a snowmobile is already much less than 10 cm
use beginning with two different snow depths (REP only in below the surface (Thumlert et al., 2013). Grooming vehi-
Fig. 5 or 6, columns i and ii) and for two different snow- cles add a force similar to snowmobiles (Pytka, 2010) based
covered environments (Figs. 5 and 6). A total of 101 snow on mass and track size. The snowpack property changes we
pits (50 at REP, 15 at the operational sites, and 36 at FEF) observed could, therefore, also be representative of impacts
were dug and sampled for this work. The increase in density from both types of vehicles. Snowpack loading by wheeled
The Cryosphere, 12, 1121–1135, 2018 www.the-cryosphere.net/12/1121/2018/S. R. Fassnacht et al.: Snowpack changes due to snowmobile use 1131
Figure 7. Snow-pit data for Walton Creek (no snowmobile use), Dumont Lakes (moderate snowmobile use), and Muddy Creek (high snow-
mobile use) in the Rabbit Ears Pass recreational use areas illustrating (a) density, (b) hardness, (c) ram resistance, (d) SWE, and (e) snow
depth. For (a)–(c), column (i) is the mean snowpack value and column (ii) is the basal layer value.
vehicles on a shallow snowpack was much greater than that shallow snowpack (Keddy et al., 1979). The snowpack prop-
of a snowmobile, peaking at about 350 kPa (Pytka, 2010). In erties of a shallow snow environment can be more greatly
comparison, fresh snow with a density of 100 kg m−3 exerts a affected by compaction from snowmobile use than those for
pressure of 0.003 kPa on the underlying snowpack (Moynier, an area that receives more snow (e.g., Fig. 3b vs. Fig. 3a).
2006). With more snow accumulation, density also increases, but
Compaction due to snowmobile use increased density high levels of snowmobile use will tend to increase the den-
of the snowpack which influenced snow hardness (Fig. 5d sity above what is observed with non-snowmobile impacted
and e) and ram resistance (Fig. 6c). Compaction altered snow (Figs. 5–7).
snow characteristics (Figs. 5–7), fragmented faceted grains
(Fig. 5f, column ii), and reduced the growth of faceted grains 5.2 Limitations of the measurements
(Fig. 5f). Density measurements for fresh snow (Fassnacht
and Soulis, 2002) and/or uncompacted snow (López-Moreno Although snowpack variability over space was limited
et al., 2013) vary spatially and temporally (Fig. 4), these val- (Fig. 4), the properties of the snowpack change from site to
ues can double with just one pass of a snowmobile on a very site and through time. For example, the mean snowpack den-
sity was less in February (Fig. 6) than January at FEF (Fig. 5,
www.the-cryosphere.net/12/1121/2018/ The Cryosphere, 12, 1121–1135, 20181132 S. R. Fassnacht et al.: Snowpack changes due to snowmobile use
Figure 8. Bulk snowpack density change model for different amounts of use compared to the control of no use (a) calibrated for the two
experiment sites (Rabbit Ears Pass, REP and Fraser Experimental Forest, FEF), and (b) applied to the operational sites (Dumont Lakes and
Muddy Creek), compared to the no use Walton Creek site. The calibrated model is presented in (a) with the Nash–Sutcliffe coefficient of
efficiency (NSCE). The NSCE is presented in (b) for two different time periods: the four pre-melt dates (December–March – 4 dates) and
the later three pre-melt dates (January–March – JFM).
column ii). From the operational sites, specific hard layers 5.3 Significance of the changes to snowpack properties
and high values of ram resistance were measured that did not from snowmobile use
persist until the next monthly sampling (observed in the ex-
perimental treatments – not shown graphically). These varia-
tions were possibly a combination of naturally occurring spa- Snowmobile use was found to have a highly significant effect
tiotemporal snowpack variability and sampling errors; it can upon natural vegetation below the snow (Keddy et al., 1979),
be difficult to obtain reliable hardness measurements in snow and by extension from snowmaking as well (Rixen et al.,
disturbed by snowmobiles. Future investigations could focus 2003). Ski grooming has been shown to delay the blooming
on specific aspects of this study, such as using a finer tempo- of alpine plants (Rixen et al., 2001) due to later snowmelt and
ral resolution, but with fewer treatments. significantly cooler soil temperatures (Fassnacht and Soulis,
Another source of variability or bias is the type of equip- 2002). Deeper snowpacks were found to not have cooler soil
ment used for sampling. Density and temperature were mea- temperatures under the snowpack (Keller et al., 2004), but
sured at 10 cm intervals using the Snowmetrics wedge cutter melted out four weeks later than thinner snowpacks (Keller
and dial gauge thermometers. A different sampler could be et al., 2004). Since the changes due to snowmobile traffic on
used to measure the density over each layer and other types a shallow snowpack were significant (Table 1), the effects of
of thermometers could be used. Snow-hardness gauges and snowmobile use on the soil and vegetation underlying a shal-
circular metal plates of known area were used for hardness low snowpack should be further investigated.
testing (McClung and Schaerer, 2006), rather than the more Snowmobile use, starting with a shallow or thin (30 cm)
simplistic in situ hand hardness test (American Avalanche snowpack, resulted in a denser and harder snowpack with a
Association, 2016). However, the hardness of thin layers decrease in grain size throughout the season, and rounded
could not be measured as the circular metal plate used for crystals or facets observed with the last measurements
measurements had a diameter of 5 cm, omitting the possible (Fig. 5f). If compaction penetrates deep enough into the
measurement of these thin layers. Thus, bulk hardness was snowpack, it could affect weak layers that cause avalanches
possibly underestimated. Also, due to the compaction of the (Saly et al., 2016), which are typically composed of soft lay-
snow grains by the high use 30 cm start treatment at REP the ers consisting of large facetted grains (e.g., Schweizer and
hardness could not be measured (Fig. 5, column ii). Different Jamieson, 2003; van Herwijnen and Jamieson, 2007). While
equipment may resolve this issue. this may be useful in very limited and small areas, such as
that performed in boot packing programs (e.g., Sahn, 2010)
to strengthen snowpacks likely to fail on basal facets, it is
very difficult to properly align and reproduce the intensity of
repetitive tracks, as done experimentally here (Fig. 2). The
effects of snowmobile use for avalanche hazard reduction
The Cryosphere, 12, 1121–1135, 2018 www.the-cryosphere.net/12/1121/2018/S. R. Fassnacht et al.: Snowpack changes due to snowmobile use 1133
through changing snow stability properties requires more in- Where the experiments for this study were undertaken, on
vestigation. public lands in Colorado, there are 1.1 to 1.6 million an-
Other factors acting in concert with snowmobile traf- nual snowmobile visits, with an increase from 580 thou-
fic to affect snowpack properties include wind, snowmak- sand to 690 thousand between 2010 to 2013 in north-
ing/grooming, and a changing climate. Without the effects ern Colorado (Routt NF and Arapaho–Roosevelt NF) and
of wind, snow depth will generally be lower for areas with southern Wyoming (Medicine Bow NF) (US Forest Service,
snowmobile traffic (Figs. 2d, e, and 7; Rixen et al., 2001; 2010, 2013a) alone. The annual economic impact of snow-
Spandre et al., 2016a). However, wind is often present in mobile use is more than USD 125 million to each state (Na-
open areas where snowmobiling occurs. Local terrain fea- gler et al., 2012; Colorado Off-Highway Vehicle Coalition,
tures and position and extent of canopy cover influence how 2016). Snowmobile use is likely to continue to increase, and
the wind interacts with the snowpack (Pomeroy and Brun, economic gains need to be balanced with potential impacts
2001). In an Australian case study, SWE increased by 45 % to the landscape, particularly in those times and places where
in groomed areas (Fahey et al., 1999); at the Rabbit Ears snowpacks are shallow.
Pass recreational use areas, SWE also increased through time
(Fig. 7d) likely due to snow blowing into the depressions
created by snowmobile tracks (Fig. 2d); this increased load 6 Conclusion
could further impact the underlying snowpack properties.
Further, snowmaking (Spandre et al., 2016a) to supplement Snowmobiling is a multimillion dollar industry that impacts
natural snow conditions and /or grooming (Fahey et al., 1999; local and regional economies and public recreation lands.
Rixen et al., 2001; Spandre et al., 2016a) compacts the snow- There have been limited studies regarding the influence of
pack below it, and alters the underlying snowpack properties snowmobile use on snowpack properties. We examined the
(Howard and Stull, 2014; Spandre et al., 2016a, b). Also, effect of snowmobile use on the physical and material prop-
a changing climate will likely reduce the extent of snow- erties of the snowpack at sites with varying snowmobile
covered terrain and decrease the length of the winter recre- use and seasonal snow conditions. Low, medium, and high
ation season (Lazar and Williams, 2008; Steiger, 2010; Daw- snowmobile use was simulated on experimental transects and
son and Scott, 2013; Marke et al., 2015; Schmucki et al., snowpack sampling results from the treated sites were com-
2015; Tercek and Rodman, 2016; Marty et al., 2017). In addi- pared to the snowpack properties observed at undisturbed
tion to possible effects from a changing climate, inter-annual control sites, and at operational sites with varying levels of
variability of snowpack patterns can be large in Colorado use. A non-linear bulk snowpack density change model was
(Fassnacht and Hultstrand, 2015; Fassnacht and Records, developed relating changes in bulk density to snowmobile
2015; Fassnacht et al., 2017). The effects of this variability use as a function of the number of passes, snow depth (in-
should be included in long term motorized use land manage- verse relation), and bulk density. The largest differences in
ment considerations. snowpack properties occur with snowmobile use beginning
on a shallow snowpack (30 cm) compared to no use, which
The significant change to snowpack properties by snow-
mobiles, except when treatments/use were initiated on a deep increases snowpack density, hardness, and ram resistance.
snowpack (Table 1), could impact land management deci- These increases are directly related to increasing snowmo-
sions for multi-use public lands. The measured depth of in- bile use (from low to medium to high). Conversely, snow-
fluence for a snowmobile is about 90 cm according to work mobile use that begins on a deep snowpack (120 cm) has a
done by Thumlert et al. (2013), but additional work could test limited effect on the snowpack properties of density, temper-
starting depths such as 30, 60, and 90 cm in differing snow ature, hardness, and ram resistance as compared to an undis-
conditions to identify the depth when snowmobile use has turbed snowpack. These results suggest that from a manage-
no significant impact. Most ski resorts in the French Alps re- ment standpoint, it may be desirable to limit snowmobile use
quired a minimum snow depth of 40 cm to offer skiing, with in shallower snow conditions to avoid increases in density,
a range from 60 cm in February to 40 cm in April (Spandre hardness, and ram resistance that could possibly impact land
et al., 2016b). The US Forest Service (2013b) recommends a resources below the snowpack.
minimum of 30 cm before the use of snowmobiles. Increas-
ing the minimum snow depth before allowing snowmobile
Data availability. The experimental data are available in
traffic will reduce changes to the snowpack due to snow-
Heath (2011). The snow depth time series data are available from
mobile use (Table 1). Additionally, the non-linear bulk den- the US Department of Agriculture Natural Resources Conservation
sity change model developed here and applied to operational Service at https://www.wcc.nrcs.usda.gov/snow/.
sites could be used predictively for management needs. This
model may be useful in terms of estimating when to limit
snowmobile use given changes in specific snow depth and Author contributions. The experiments were designed by JTH and
density conditions. SRF with input from KJE. JTH performed the experiments with
assistance from KJE at the Fraser site. The initial manuscript was
www.the-cryosphere.net/12/1121/2018/ The Cryosphere, 12, 1121–1135, 20181134 S. R. Fassnacht et al.: Snowpack changes due to snowmobile use
written by JTH, SRF, and KJE. The final version of the manuscript Fassnacht, S. R. and Hultstrand, M.: Snowpack variability and
was written by SRF and NBHV. SRF generated the figures and cre- trends at long-term stations in northern Colorado, USA, Proc.
ated the density model. IAHS, 371, 131–136, https://doi.org/10.5194/piahs-371-131-
2015, 2015.
Fassnacht, S. R. and Records, R. M.: Large snowmelt versus rainfall
Competing interests. The authors declare that they have no conflict events in the mountains, J. Geophys. Res.-Atmos., 120, 2375–
of interest. 2381, https://doi.org/10.1002/2014JD022753, 2015.
Fassnacht, S. R. and Soulis, E. D.: Implications during transitional
periods of improvements of snow processes in the Land Surface
Acknowledgements. Appreciation goes to Robert Skorkowsky, Scheme – Hydrological Model WATCLASS, Atmos.-Ocean, 40,
Kent Foster and Becky Jones of the Hahns Peak/Bears Ears 389–403, 2002.
Ranger District of the US Forest Service for their help and support Fassnacht, S. R., Heun, C. M., López-Moreno, J. I., and Latron, J. B.
with compaction treatments at the Rabbit Ears Pass study site. P.: Variability of Snow Density Measurements in the Rio Esera
Additional thanks goes to James zum Brunnen of the Colorado Valley, Pyrenees Mountains, Spain, Cuadernos de Investigación
State University Statistics Department for his assistance with Geográfica, J. Geogr. Res., 36, 59–72, 2010.
statistical interpretation. Jared Heath would also like to recognize Fassnacht, S. R., López-Moreno, J. I., Ma, C., Weber, A. N.,
the Colorado Mountain Club for their help supporting this project Pfohl, A. K. D., Kampf, S. K., and Kappas, M.: Spatio-
with a generous grant. Jim Halfpenny, Ned Bair, and two anony- temporal Snowmelt Variability across the Headwaters of the
mous reviewers provided insight into clarifying this paper. One Southern Rocky Mountains, Front. Earth Sci., 11, 505–514,
TC Discussion anonymous reviewer provided very thorough and https://doi.org/10.1007/s11707-017-0641-4, 2017.
thoughtful comments that greatly improved this paper, and resulted Fahey, B., Wardle, K., and Weir, P.: Environmental effects associ-
in the creation of new figures. While the comments from this ated with snow grooming and skiing at Treble Cone Ski Field,
reviewer provided a challenge, they were appreciated after they had Part 2. Snow properties on groomed and non-groomed slopes,
been addressed. TC editor Guillaume Chambon provided additional Science for Conservation, 120, 49–62, 1999.
comments and an important citation that helped reformulate the Fierz, C., Armstrong, R. L., Durand, Y., Etchevers, P., Greene, E.,
discussion. McClung, D. M., Nishimura, K., Satyawali, P. K., and Sokra-
tov, S. A.: The International Classification for Seasonal Snow on
This open-access publication was funded the Ground, IHP-VII Technical Documents in Hydrology No. 83,
by the University of Göttingen. IACS Contribution No. 1, UNESCO-IHP, Paris, 2009.
Heath, J. T.: Motorized winter recreation impacts on snowpack
Edited by: Guillaume Chambon properties, Order No. 1497962, Colorado State University,
Reviewed by: Edward Bair and one anonymous referee available at: https://search.proquest.com/docview/889112499?
accountid=10223, 2011.
Howard, R. and Stull, R.: Piste: A snow-physics model incorporat-
ing human factors for groomed ski slopes, J. Hydrometeor., 15,
2429–2445, https://doi.org/10.1175/JHM-D-14-0013.1, 2014.
References International Snowmobile Manufacturers Association: Snowmobil-
ing Fact Book, ISMA, available at: http://www.snowmobile.org/
Abele, G. and Gow, A.: Compressibility Characteristics of Undis- (last access: 4 April 2017), 2016.
turbed Snow, Research Report 336, US Army Cold Regions Re- Keddy, P., Spavold, A., and Keddy, C.: Snowmobile impact
search and Engineering Laboratory, Hanover, New Hampshire, on old field and marsh vegetation in Nova Scotia, Canada
1975. : An experimental study, Environ. Manage. 3, 409–415,
American Avalanche Association: Snow, Weather and Avalanches: https://doi.org/10.1007/BF01866580, 1979.
Observation Guidelines for Avalanche Programs in the United Keller, T., Pielmeier, C., Rixen, C., Gadient, F., Gustafsson, D., and
States, 3rd edn., Victor, ID, 104 pp., 2016. Stähl, M.: Impact of artificial snow and ski-slope grooming on
American Council of Snowmobile Associations: Economic Im- snowpack properties and soil thermal regime in sub-alpine ski
pact of the Snowmobiling Industry, available at: http://www. area, Ann. Glaciol., 38, 314–318, 2004.
snowmobilers.org/ (last access: 4 April 2017), 2014. Lazar, B. and Williams, M. W.: Climate change in western ski ar-
Colorado Off-Highway Vehicle Coalition: Economic Contribution eas: Potential changes in the timing of wet avalanches and snow
of Off-Highway Vehicle Recreation in Colorado, Report by quality for the Aspen ski area in the years 2030 and 2100, Cold
Pinyon Environmental, Lakewood, CO USA, available at: http: Reg. Sci. Technol., 51, 219–228, 2008.
//www.cohvco.org/ (last access: 4 April 2017), 2016. López-Moreno, J. I., Fassnacht, S. R., Heath, J. T., Musselman, K.,
Cook, B. and Borrie, W.: Trends in Recreation Use and Manage- Revuelto, J., Latron, J., Morán, E., and Jonas, T.: Spatial vari-
ment of Wilderness, Int. J. Wilderness, 1, 30–34, 1995. ability of snow density over complex alpine terrain: implications
Dawson, J. and Scott, D.: Managing for climate change in the alpine for estimating snow water equivalent, Adv. Water Resour., 55,
ski sector, Tourism Manage., 35, 244–254, 2013. 40–52, https://doi.org/10.1016/j.advwatres.2012.08.010, 2013.
Elder, K., Cline, D., Liston, G. E., and Armstrong, R.: NASA Cold Mann, H. B. and Whitney, D. R.: On a Test of Whether
Land Processes Experiment (CLPX 2002/03): Field Measure- one of Two Random Variables is Stochastically
ments of Snowpack Properties and Soil Moisture, J. Hydrome-
teor., 10, 320–329, 2009.
The Cryosphere, 12, 1121–1135, 2018 www.the-cryosphere.net/12/1121/2018/S. R. Fassnacht et al.: Snowpack changes due to snowmobile use 1135 Larger than the Other, Ann. Math. Stat., 18, 50–60, Schweizer, J. and Jamieson, J. B.: Snowpack properties for snow https://doi.org/10.1214/aoms/1177730491, 1947. profile analysis, Cold Reg. Sci. Technol., 37, 233–241, 2003. Marke, T., Strasser, U., Hanzer, F., Stötter, J., Wilcke, R. Shapiro, L. H., Johnson, J. B., Sturm, M., and Blaisdell, G. L.: Snow A. I., and Gobiet, A.: Scenarios of future snow conditions Mechanics: Review of the State of Knowledge and Applications, in Styria (Austrian Alps), J. Hydrometeor., 16, 261–277, USA Cold Regions Research and Engineering Laboratory (CR- https://doi.org/10.1175/JHM-D-14-0035.1, 2015. REL), Research Report 97-3, 1997. Marty, C., Schlögl, S., Bavay, M., and Lehning, M.: How much Shoop, S. A., Richmond, P. W., and Lacombe, J.: Overview of cold can we save? Impact of different emission scenarios on fu- regions mobility modeling at CRREL, Jo. Terramechanics, 43, ture snow cover in the Alps, The Cryosphere, 11, 517–529, 1–26, 2006. https://doi.org/10.5194/tc-11-517-2017, 2017. Spandre, P., Morin, S., Lafaysse, M., Lejeune, Y., François, H., and McClung, D. and Schaerer, P.: The Avalanche Handbook, 3rd edn., Lejeune, Y.: Integration of snow management processes into a The Mountaineers Books, Seattle, Washington, 342 pp., 2006. detailed snowpack model, Cold Reg. Sci. Technol., 125, 48–64, Moriasi, D. N., Arnold, J. G., Liew, M. W., Bingner, R. L., Harmel, https://doi.org/10.1016/j.coldregions.2016.01.002, 2016a. R. D., and Veith, T. L.: Model Evaluation Guidelines for Sys- Spandre, P., François, H., George-Marcelpoil, E., and Morin, tematic Quantification of Accuracy in Watershed Simulations, S.: Panel based assessment of snow management operations T. ASABE, 50, 885–900, https://doi.org/10.13031/2013.23153, in French ski resorts, J. Outdoor Rec. Tour., 16, 24–36, 2007. https://doi.org/10.1016/j.jort.2016.09.002, 2016b. Moynier, J.: Avalanche Aware: The Essential Guide to Avalanche Steiger, R.: The impact of climate change on ski season length and Safety, Morris Book Publishing, LLC, Guilford, Connecticut, snowmaking requirements in Tyrol, Austria, Clim. Res., 43, 251– 90 pp., 2006. 262, https://doi.org/10.3354/cr00941, 2010. Nagler, A. M., Bastian, C. T., Taylor, D. T., and Foulke, T. K.: 2011– Tercek, M. and Rodman, A.: Forecasts of 21st Century Snow- 2012 Wyoming Comprehensive Snowmobile Recreation Report, pack and Implications for Snowmobile and Snowcoach Use Report to the State of Wyoming, Department of State Parks in Yellowstone National Park, PLoS ONE, 11, e0159218, and Cultural Resources, prepared by Department of Agricultural https://doi.org/10.1371/journal.pone.0159218, 2016. and Applied Economics, University of Wyoming, Laramie WY, Thumlert, S. and Jamieson, B.: Stress measurements from common 172 pp., 2012. snow slope stability tests, Cold Reg. Sci. Technol., 110, 38–46, Nash, J. E. and Sutcliffe, J. V.: River flow forecasting through con- https://doi.org/10.1016/j.coldregions.2014.11.005, 2015. ceptual models part I – A discussion of principles, J. Hydrol., 10, Thumlert, S., Exner, T., Jamieson, B., and Bellaire, S.: 282–290, https://doi.org/10.1016/0022-1694(70)90255-6, 1970. Measurements of localized dynamic loading in a moun- Osterberg, J. N.: American Valhalla, in: Post Punk Depression, tain snow cover, Cold Reg. Sci. Technol., 85, 94–101, edited by: Homme, J., Caroline International, Loma Vista, Bev- https://doi.org/10.1016/j.coldregions.2012.08.005, 2013. erly Hills, California, 2016. US Forest Service: National Visitor Use Monitoring Results, USDA Pomeroy, J. W. and Brun, E.: Physical properties of snow, chap. 2, Forest Service National Summary Report Data collected FY in: Snow Ecology: An Interdisciplinary Examination of Snow- 2005 through FY 2009, US Department of Agriculture, available Covered Ecosystems, edited by: Jones, H. G., Pomeroy, J. W., at: http://www.fs.fed.us/recreation/programs/nvum/ (last access: Walker, D. A., and Hoham, R. W., Cambridge, Cambridge Uni- 4 April 2017), 2010. versity Press, 45–126, 2001. US Forest Service: National Visitor Use Monitoring Results, USDA Pytka, J.: Determination of snow stresses under ve- Forest Service National Summary Report Data collected FY hicle loads, Cold Reg. Sci. Technol., 60, 137–145, 2008 through FY 2012, US Department of Agriculture, available https://doi.org/10.1016/j.coldregions.2009.10.002, 2010. at: http://www.fs.fed.us/recreation/programs/nvum/ (last access: Rixen, C., Stoeckli, V., Huovinen, C., and Huovinen, K.: The phe- 4 April 2017), 2013a. nology of four subalpine herbs in relation to snow cover char- US Forest Service: Modifications Made to Medicine Bow Na- acteristics, Soil-Vegetation-Atmosphere Transfer Schemes and tional Forest Winter Travel Special Order – Release date Large-Scale Hydrological Models, IAHS Pub., 270, 359–362, 15 November 2013, Medicine Bow National Forest, avail- 2001. able at: https://www.fs.usda.gov/detail/mbr/news-events/?cid= Rixen, C., Stoeckli, V., and Ammann, W.: Does artificial snow pro- STELPRDB5440798 (last access: 7 April 2017), 2013b. duction affect soil and vegetation of ski pistes? A review, Per- van Herwijnen, A. and Jamieson, J. B.: Snowpack properties asso- spect. Plant Ecol., 5, 219–230, 2003. ciated with fracture initiation and propagation resulting in skier- Sahn, K.: Avalanche risk reduction in the continental climate: How triggered dry snow slab avalanches, Cold Reg. Sci. Technol., 50, to implement an effective boot packing program, Proceedings of 13–22, 2007. the 2010 International Snow Science Workshop, Squaw Valley, Wilcoxon, F.: Individual comparisons by ranking methods, Biomet- CA, USA, 17–22 October 2010, 296–301, 2010. rics Bull., 1, 80–83, https://doi.org/10.2307/3001968, 1945. Saly, D., Hendrikx, J., Birkeland, K., Challender, S., and Leonard, Winter Wildlands Alliance: Winter Recreation on Western National T.: The Effects of Compaction Methods on Snowpack Stability, Forest Lands: A Comprehensive Analysis of Motorized and Non- Proceedings of the 2016 International Snow Science Workshop, Motorized Opportunity and Access, Winter Wildlands Alliance, Breckenridge, CO, USA, 3–7 October 2016, 716–720, 2016. Boise, Idaho, 44 pp., 2006. Schmucki, E., Marty, C., Fierz, C., and Lehning, M.: Simulations of 21st century snow response to climate change in Switzerland from a set of RCMs, Int. J. Climatol., 35, 3262–3273, 2015. www.the-cryosphere.net/12/1121/2018/ The Cryosphere, 12, 1121–1135, 2018
You can also read