Dice-XMBD: Deep Learning-Based Cell Segmentation for Imaging Mass Cytometry
←
→
Page content transcription
If your browser does not render page correctly, please read the page content below
METHODS
                                                                                                                                          published: 15 September 2021
                                                                                                                                        doi: 10.3389/fgene.2021.721229

                                              Dice-XMBD: Deep Learning-Based
                                              Cell Segmentation for Imaging Mass
                                              Cytometry
                                              Xu Xiao 1,2† , Ying Qiao 1† , Yudi Jiao 1 , Na Fu 1 , Wenxian Yang 3 , Liansheng Wang 1*,
                                              Rongshan Yu 1,2,3* and Jiahuai Han 2,4*
                                              1
                                               Department of Computer Science, School of Informatics, Xiamen University, Xiamen, China, 2 National Institute for Data
                                              Science in Health and Medicine, Xiamen University, Xiamen, China, 3 Aginome Scientific, Xiamen, China, 4 School of
                                              Medicine, Xiamen University, Xiamen, China

                                              Highly multiplexed imaging technology is a powerful tool to facilitate understanding
                                              the composition and interactions of cells in tumor microenvironments at subcellular
                                              resolution, which is crucial for both basic research and clinical applications. Imaging mass
                                              cytometry (IMC), a multiplex imaging method recently introduced, can measure up to
                            Edited by:        100 markers simultaneously in one tissue section by using a high-resolution laser with a
                               Min Wu,
      Institute for Infocomm Research
                                              mass cytometer. However, due to its high resolution and large number of channels, how
                   (A∗STAR), Singapore        to process and interpret the image data from IMC remains a key challenge to its further
                        Reviewed by:          applications. Accurate and reliable single cell segmentation is the first and a critical step to
                           Mengwei Li,
                                              process IMC image data. Unfortunately, existing segmentation pipelines either produce
      Singapore Immunology Network
                 (A∗STAR), Singapore          inaccurate cell segmentation results or require manual annotation, which is very time
                            Yuan Zhu,         consuming. Here, we developed Dice-XMBD1 , a Deep learnIng-based Cell sEgmentation
      China University of Geosciences
                        Wuhan, China
                                              algorithm for tissue multiplexed imaging data. In comparison with other state-of-the-art
                    *Correspondence:
                                              cell segmentation methods currently used for IMC images, Dice-XMBD generates more
                        Liansheng Wang        accurate single cell masks efficiently on IMC images produced with different nuclear,
                   lswang@xmu.edu.cn
                                              membrane, and cytoplasm markers. All codes and datasets are available at https://
                           Rongshan Yu
                      rsyu@xmu.edu.cn         github.com/xmuyulab/Dice-XMBD.
                             Jiahuai Han
                      jhan@xmu.edu.cn         Keywords: imaging mass cytometry, multiplexed imaging, single cell segmentation, U-net, knowledge distillation,
                                              digital pathology
     † These   authors have contributed
                    equally to this work
                                              1. INTRODUCTION
                    Specialty section:
          This article was submitted to       Analysis of the heterogeneity of cells is critical to discover the complexity and factuality
            Computational Genomics,           of life system. Recently, single-cell sequencing technologies have been increasingly used in
                a section of the journal      the research of developmental physiology and disease (Stubbington et al., 2017; Papalexi and
                   Frontiers in Genetics
                                              Satija, 2018; Potter, 2018; Lähnemann et al., 2020), but the spatial context of individual
            Received: 06 June 2021            cells in the tissue is lost due to tissue dissociation in these technologies. On the other
             Accepted: 30 July 2021           hand, traditional immunohistochemistry (IHC) and immunofluorescence (IF) preserve spatial
      Published: 15 September 2021
                                              context but the number of biomarkers is limited. The development of multiplex IHC/IF
                             Citation:        (mIHC/mIF) technologies has enabled the simultaneous detection of multiple biomarkers
 Xiao X, Qiao Y, Jiao Y, Fu N, Yang W,        and preserves spatial information, such as cyclic IHC/IF and metal-based multiplex imaging
      Wang L, Yu R and Han J (2021)
                                              technologies (Zrazhevskiy and Gao, 2013; Angelo et al., 2014; Giesen et al., 2014; Tan et al.,
   Dice-XMBD: Deep Learning-Based
 Cell Segmentation for Imaging Mass
                                              2020). Imaging mass cytometry (IMC) (Giesen et al., 2014; Chang et al., 2017), one of
 Cytometry. Front. Genet. 12:721229.
                                              1 XMBD: Xiamen Big Data, a biomedical open software initiative in the National Institute for Data Science in Health and
    doi: 10.3389/fgene.2021.721229
                                              Medicine, Xiamen University, China.

Frontiers in Genetics | www.frontiersin.org                                          1                                      September 2021 | Volume 12 | Article 721229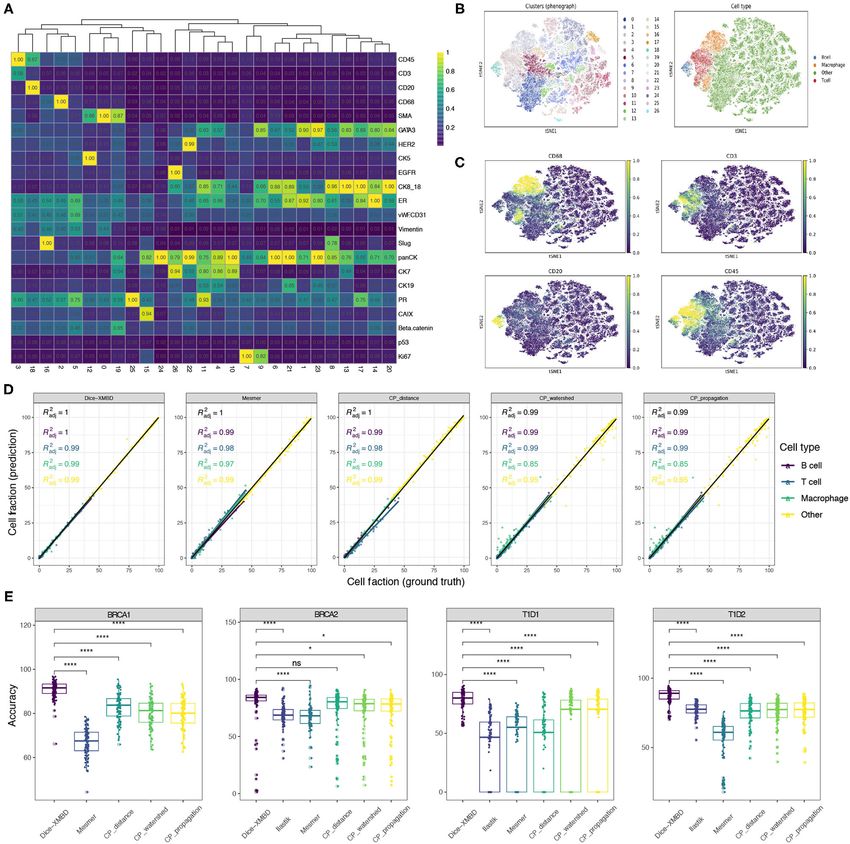
Xiao et al.                                                                                                          Dice-XMBD: IMC Cell Segmentation

metal-based mIHC technologies, uses a high-resolution laser                   annotation process still needs to be performed by experienced
with a mass cytometer and makes the measurement of 100                        staff repeatedly for each IMC study, which is very inconvenient.
markers possible.                                                             In addition, the reproducibility of the experimental results
    IMC has been utilized in studies of cancer and autoimmune                 obtained from this approach can be an issue due to the per-study,
disorders (Giesen et al., 2014; Damond et al., 2019; Ramaglia                 interactive training process used in creating the single cell masks.
et al., 2019; Wang et al., 2019; Böttcher et al., 2020). Due to               Hence, a more efficient, fully automated single cell segmentation
its high resolution and large number of concurrent marker                     method for IMC data without compromising the segmentation
channels available, IMC has been proven to be highly effective in             accuracy is necessary for IMC to gain broader applications in
identifying the complex cell phenotypes and interactions coupled              biomedical studies.
with spatial locations. Thus, it has become a powerful tool to                   Convolutional neural networks (CNNs) have been
study tumor microenvironments and discover the underlying                     successfully used for natural image segmentation and recently
disease-relevant mechanisms (Brähler et al., 2018; Ali et al.,                applied in biomedical image applications (Shen et al., 2017;
2020; Aoki et al., 2020; de Vries et al., 2020; Dey et al., 2020;             Zhang et al., 2018; Andrade et al., 2019; Vicar et al., 2019). CNN-
Jackson et al., 2020; Zhang et al., 2020; Schwabenland et al.,                based U-Net was developed for pixel-wise cell segmentation
2021). Apart from using IMC techniques alone, several other                   of mammalian cells (Ronneberger et al., 2015). It has been
technologies, such as RNA detection in situ and 3D imaging, have              demonstrated that the U-Net architecture and its variants such
been combined with IMC to expand its applicability and utility                as Unet++ (Zhou et al., 2018), 3D Unet (Çiçek et al., 2016),
(Schulz et al., 2018; Bouzekri et al., 2019; Catena et al., 2020; Flint       and V-Net (Milletari et al., 2016) can obtain high segmentation
et al., 2020).                                                                accuracy. Motivated by the good performance of U-Nets in cell
    The IMC data analysis pipeline typically starts with single               segmentation (Van Valen et al., 2016; Hollandi et al., 2020; Salem
cell segmentation followed by tissue/cell type identification                 et al., 2020), we developed Dice-XMBD, a deep neural network
(Carpenter et al., 2006; Sommer et al., 2011; Liu et al., 2019). As           (DNN)-based cell segmentation method for multichannel IMC
the first step of an IMC data processing pipeline, the accuracy of            images. Dice-XMBD is marker agnostic and can perform cell
single cell segmentation plays a significant role in determining              segmentation for IMC images of different channel configurations
the quality and the reliability of the biological results from an             without modification. To achieve this goal, Dice-XMBD first
IMC study. Existing IMC cell segmentation methods include                     merges multiple-channel IMC images into two channels, namely,
both unsupervised and supervised algorithms. Unsupervised cell                a nuclear channel containing proteins originated from cell
segmentation, such as the watershed algorithm implemented in                  nucleus, and a cell channel containing proteins originated
CellProfiler (Carpenter et al., 2006), does not require user inputs           from cytoplasm and cell membrane. Channels of proteins
for model training. However, the segmentation results are not                 with ambiguous locations are ignored by Dice-XMBD for
precise in particular when cells are packed closely or they are               segmentation as they contribute little to the segmentation
in complicated shapes. To achieve better segmentation results,                results. Furthermore, to mitigate the annotation workload,
supervised methods use a set of images annotated with pixel-                  we adopted the knowledge distillation learning framework
level cell masks to train a segmentation classifier. However, the             (Hinton et al., 2015) in training Dice-XMBD, where the training
manual annotation task is very time consuming and expensive                   labels were generated using Ilastik with interactive manual
as well since it is normally done by pathologists or experienced              annotations as a teacher model. We used four IMC datasets of
staff with necessary knowledge in cell annotation. Particularly,              different channel configurations to evaluate the performance of
for multiplexing cellular imaging methods such as IMC, their                  Dice-XMBD and the results show that it can generate highly
channel configurations including the total number of markers                  accurate cell segmentation results that are comparable to those
and markers selection are typically study dependent. Therefore,               from manual annotation for IMC images from both the same
manual annotation may need to be performed repeatedly for each                and different datasets to the training dataset, validating its
study to adapt the segmentation model to different IMC channel                applicability for generic IMC image segmentation tasks.
configurations, which can be impractical.
    To overcome this limitation, a hybrid workflow combining
                                                                              2. MATERIALS AND METHODS
unsupervised and supervised learning methods for cell
segmentation was proposed (Ali et al., 2020). This hybrid                     2.1. Overview of the Pipeline
workflow uses Ilastik (Sommer et al., 2011), an interactive                   In Dice-XMBD, we used a U-Net-based pixel classification model
image processing tool, to generate a probability map based                    to classify individual pixels of an IMC image to their cellular
on multiple rounds of user inputs and adjustments. In each                    origins, namely, nuclei, cytoplasm/membrane, or background.
round, a user only needs to perform a limited number of                       The classification model outputs pixel-level probability values for
annotations on regions where the probability map generated                    each class, which were then input to CellProfiler (version 3.1.0)
based on previous annotations is not satisfactory. CellProfiler               to produce the final cell segmentation masks (Figure 1).
is then used to perform the single cell segmentation based on                    The ground truth cell segmentation of IMC images is
the probability map once the result from Ilastik is acceptable.               in general not available. To obtain the training labels, we
This hybrid workflow significantly reduces manual annotation                  generated pixel probability maps using an iterative manual
workload and has gained popularity in many recent IMC studies                 annotation process with Ilastik on the training IMC dataset.
(Damond et al., 2019; Böttcher et al., 2020; de Vries et al., 2020;           Furthermore, the same iterative manual annotation process was
Jackson et al., 2020; Schwabenland et al., 2021). However, the                performed on the testing IMC datasets to produce the ground

Frontiers in Genetics | www.frontiersin.org                               2                                 September 2021 | Volume 12 | Article 721229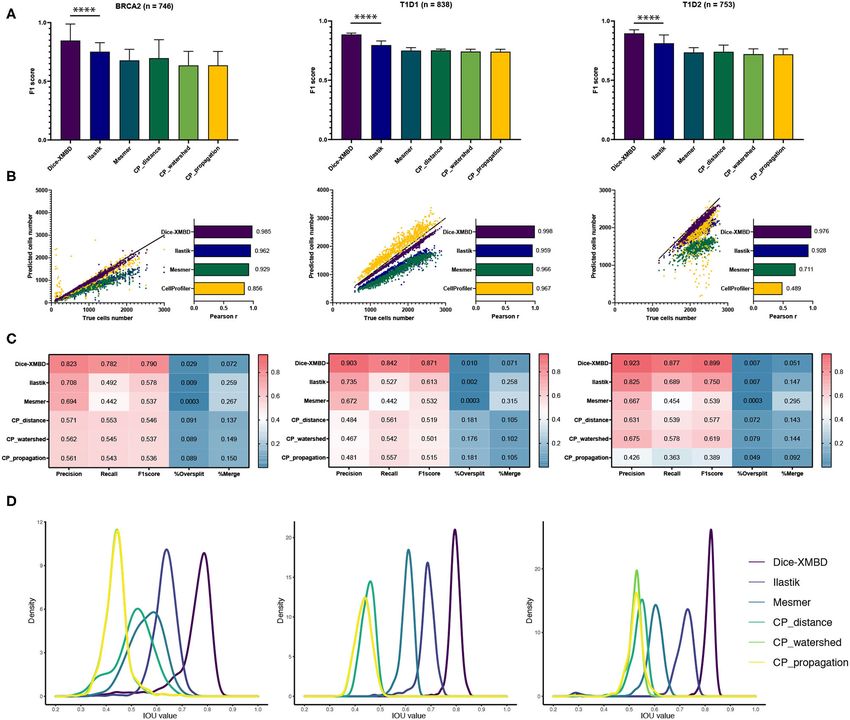
Xiao et al.                                                                                                                          Dice-XMBD: IMC Cell Segmentation

  FIGURE 1 | Dice-XMBD workflow. Imaging mass cytometry (IMC) images are combined into 2-channel images containing nuclear and membrane/cytoplasm proteins
  expression information. In stage 1, the pixel probability maps of the input 2-channel images are predicted using a semi-supervised learning model based on U-Net
  architecture. The training data were generated from Ilastik by an iterative interactive annotation process. In stage 2, the cell segmentation masks are generated from
  the pixel probability maps using the propagation method in CellProfiler.

truth pixel probability maps, which were used by CellProfiler                           contain 839 and 754 images from patients with type I diabetes
to produce the ground truth cell segmentation masks for                                 with 34 markers. Dice-XMBD was trained on a subset of BRCA1
performance evaluation.                                                                 dataset (n = 348) with 200 held-out images reserved for
   Note that to obtain a generic pixel classifier that can be                           validation and testing. To test the generalization ability of Dice-
used across IMC datasets of different channel configurations,                           XMBD, we also tested the trained model on the other three
channels of different proteins were combined based on their                             independent IMC datasets (BRCA2, T1D1, and T1D2).
cellular origins into two channels, namely, nuclear and cell
(membrane/cytoplasmic) channels. Channels of proteins without
specific cellular locations were ignored by Dice-XMBD. The pixel                        2.3. Generating Ground Truth Cell Masks
classification model was trained using the combined two-channel                         The ground truth pixel probability maps and the cell masks used
images as input. Likewise, the same preprocessing was used at                           for model training and evaluation were generated using Ilastik
the prediction stage to produce the two-channel (nuclear/cell)                          and CellProfiler. We used the smallest brush size (1 pixel) in
images as input to the pixel classification model. Of note,                             annotating the image to avoid annotating a group of neighboring
although the prediction may be performed on images with                                 pixels of different classes. To mitigate the manual workload, the
different markers, the channels were always combined based on                           annotation was performed in an interactive manner, where the
their origins so that pixel classification was performed based                          random forest prediction model of Ilastik was updated regularly
on the two channels of putative protein locations rather than                           during annotation to produce an uncertainty map indicating
channels of individual proteins.                                                        the confidence level of the classification results produced by
                                                                                        the prediction model. The annotation was then guided by the
                                                                                        uncertainty map to focus on the regions with high uncertainty
2.2. Training and Evaluation Datasets                                                   iteratively, until the overall uncertainty values were low except for
We used four IMC image datasets in this study. BRCA1 and                                regions of which the boundaries were visually indistinguishable.
BRCA2 (Ali et al., 2020) contain 548 and 746 images from                                    The initial annotation was performed on a randomly selected
patients with breast cancer with 36 and 33 markers, respectively.                       subset of the dataset. After the initial annotation, we loaded
T1D1 (Damond et al., 2019) and T1D2 (Wang et al., 2019)                                 all the images from the dataset into Ilastik to calculate their

Frontiers in Genetics | www.frontiersin.org                                         3                                      September 2021 | Volume 12 | Article 721229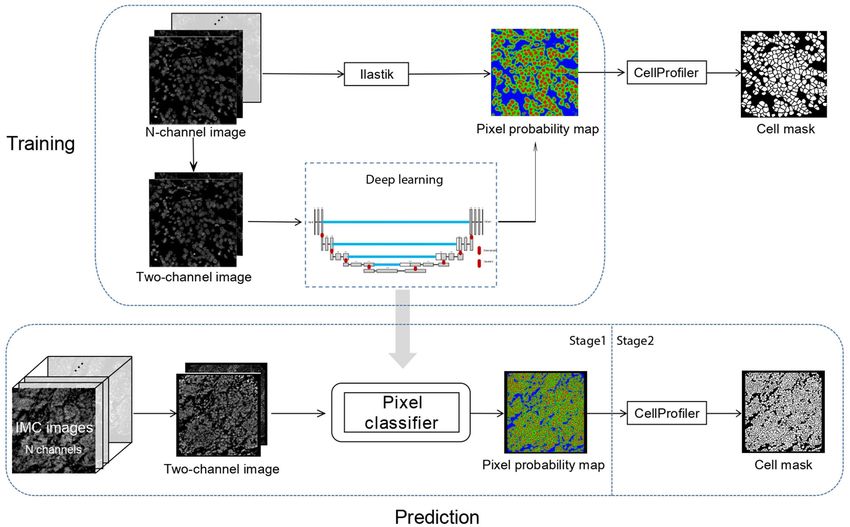
Xiao et al.                                                                                                         Dice-XMBD: IMC Cell Segmentation

uncertainty maps, and then selected those with the highest               pixels, we set the pixel values of both channels to 0 and the pixel
average uncertainty values for further annotation. This process          type as background.
was iterated until the uncertainty values of all images converged,
that is, the average uncertainty value over all images did not           2.4.2. Data Augmentation
decrease significantly for three consecutive iterations.                 Data augmentation is an effective strategy to reduce overfitting
   In the end, we annotated 49 images in BRCA1 to train                  and enhance the robustness of the trained models, especially
the model in Ilastik. We then imported all the images of the             when training data are insufficient. We applied the following data
BRCA1 dataset into Ilastik for batch processing and export               augmentation methods on the input images before feeding to our
their corresponding pixel classification probability maps for            U-Net-based pixel classification network.
training Dice-XMBD. The probability maps were further input                  First, photometric transformations including contrast
to CellProfiler to produce the ground truth cell segmentation.           stretching and intensity adjustments were used. For contrast
In CellProfiler, we used the “IdentifyPrimaryObjects” module to          stretching, we changed the level of contrast by multiplication with
segment the cell nuclei and used the “IdentifySecondaryObjects”          a factor randomly drawn from the range of [0.5, 1.5]. Similarly,
to segment the cell membranes using the propagation method.              for intensity adjustments we changed the level of intensities by
The output masks from CellProfiler are regarded as ground truth          multiplication with a factor randomly drawn from the range of
cell segmentation of the dataset for performance evaluation.             [0.5, 1.5]. Geometric transformations including image flipping
   We also generated the ground truth cell masks of the other            and rotation were used. For flipping, we implemented random
three datasets by the same iterative procedure separately for            horizontal or vertical flipping. For rotation, the rotating angle
testing the generalization ability of Dice-XMBD. During the              is randomly distributed in the range of [−180, 180]. Note that
process, 72 images in BRCA2, 39 images in T1D1, and 67 images            geometric transformations were applied to pairs of input and
in T1D2 were manually annotated.                                         output images of the network. We also injected random Gaussian
                                                                         noise to the two input channels of the input images. Examples of
2.4. Training the U-Net Cell Segmentation                                data augmentation are shown in Supplementary Figures 1, 2.
Model
2.4.1. Image Preprocessing                                               2.4.3. Constructing a Pixel Classification Model
The multiplexed IMC images were first merged into two channels           The U-Net pixel classification network is an end-to-end fully
by averaging the per-pixel values from the selected membrane             convolutional network and contains two paths. The contracting
and nuclear channels. After merging channels, the input IMC              path (or the encoder) uses a typical CNN architecture. Each
images were then preprocessed by hot pixel removal, dynamic              block in the contracting path consists of two successive 3 × 3
range conversion, normalization, and image cropping/padding              convolution layers followed by a Rectified Linear Unit (ReLU)
into fix-sized patches. First, we applied a 5 × 5 low-pass filter        activation and a 2 × 2 max-pooling layer. This block is repeated
on the image to remove hot pixels. If the difference between an          four times. In the symmetric expansive path (or the decoder),
image pixel value and the corresponding filtered value was larger        at each stage the feature map is upsampled using 2 × 2 up-
than a preset threshold (50 in our experiments), the pixel would         convolution. To enable precise localization, the feature map from
be regarded as a hot pixel and its value would be replaced by            the corresponding layer in the contracting path is cropped and
the filtered value. As the dynamic range of pixels values differs        concatenated onto the upsampled feature map, followed by two
among IMC images of different batches and different channels,            successive 3 × 3 convolutions and ReLU activation. At the final
we further min-max normalized all images to [0,255] to remove            stage, an additional 1 × 1 convolution is applied to reduce the
such batch effect as:                                                    feature map to the required number of output channels. Three
                                                                         output channels are used in our case for nuclei, membrane,
                           ′      xij − Xmin                             and background, respectively. As we output the probability map,
                         xij =               ∗ 255,            (1)
                                 Xmax − Xmin                             the values are converted into the range of [0, 1] using the
                                                                         Sigmoid function.
where xij denotes the pixel value in one channel, and Xmax and
Xmin denote the maximum and minimum values in the channel.               2.4.4. Loss Function
Of note, as the pixel values in IMC images have a high dynamic
                                                                         We take the binary cross-entropy (BCE) as the loss function,
range, transforming the pixel values from its dynamic range to
                                                                         which is defined as:
[0, 255] would suffer from detail suppression by one or few
extremely large values. Therefore, we thresholded the image pixel
values at 99.7% percentile for each image before normalization.                             1 XN
                                                                          loss(y, ŷ) = −      i=0 (yi ∗ log(ŷi ) + (1 − yi ) ∗ log(1 − ŷi )), (2)
   Finally, we merged all the nuclear channels into one                                     N
consolidated nuclear channel, and membrane/cytoplasmic
channels into one cell channel, by averaging on all channel              where N represents the total number of pixels in an image, yi
images with pre-selected sets of protein markers, respectively.          denotes the ground truth pixel probability, and ŷi denotes the
We converted the merged two-channel images into patches of               predicted pixel probability. The cross-entropy loss compares the
512 × 512 pixels. Image boundary patches that are smaller than           predicted probabilities with the ground truth values. The loss is
the target patch size are padded to target size. For the padded          minimized during the training process.

Frontiers in Genetics | www.frontiersin.org                          4                                     September 2021 | Volume 12 | Article 721229
Xiao et al. Dice-XMBD: IMC Cell Segmentation
2.5. Model Evaluation 3. RESULTS
In a binary cell mask, “1” represents cell boundary and “0”
denotes cell interior or exterior. For every pixel in an image, true 3.1. Dice-XMBD Enables Automatic Cell
positive (TP) and true negative (TN) mean that the predicted Segmentation
pixel classification is the same as its label in the labeled (i.e., the We trained our U-Net cell segmentation model using the BRCA1
ground truth) mask, while false positive (FP) and false negative dataset with 348 images as the training set and 100 images as
(FN) mean that a pixel is misclassified. To evaluate pixel-level the validation set. A complete held out test set with 100 images
accuracy, we calculated the number of TP pixels and FP pixels was used to test model performance within one dataset. We
based on the predicted and labeled binary masks. further applied the trained model directly on the other three
We further evaluated model performance at the cell level. IMC image datasets to evaluate the cross-dataset performance of
We calculated the intersection over union (IOU) on cells from the model. For performance evaluation, we computed standard
predicted and labeled cell masks to determine if they are the same indices (Recall, Precision, F1-score, and Jaccard index) for both
cell, and then counted the TP and FP cells. First, we filtered out pixel-level and cell-level accuracies (see section 2).
all cells with IOU below 0.1 from the predicted cells. These cells We compared Dice-XMBD with a generic whole-cell
are identified as FPs. The other cells from the predicted cell mask segmentation method across six imaging platforms, Mesmer
could be either TP or FP. If a predicted cell only overlaps with one (Greenwald et al., 2021), which used a deep learning-based
true cell (i.e., a cell from the labeled cell mask), we assume that algorithm trained on a large, annotated image dataset to segment
the cell is segmented accurately (TP). If a true cell cannot find a single cells and nuclei separately. A trained Mesmer model was
predicted cell, the “missing” cell is denoted as FN. When multiple tested with combined nuclear and cell channels, which is the
predicted cells are assigned to the same true cell, we consider this same as the input to Dice-XMBD. Meanwhile, we compared
as a split error. If multiple true cells are matched to the same with three commonly used segmentation methods implemented
predicted cell, we consider those predicted cells as merge errors. in CellProfiler with default parameters: distance, watershed,
For simplicity, split errors and merge errors are counted as FPs. and propagation. These methods first locate nuclei as primary
Four standard indices are measured as follows: objects, and then the membrane proteins are added together
into an image as input to recognize cells. The distance method
does not use any membrane proteins information and simply
TP defines cell membrane by expanding several pixels around
Recall = , (3)
TP + FN nuclei. The watershed method computes intensity gradients on
TP the Sobel transformed image to identify boundaries between
Precision = , (4)
TP + FP cells (Vincent and Soille, 1991), while the propagation method
2 ∗ Precision ∗ Recall defines cell boundaries by combining the distance of the nearest
F1score = , (5) primary object and the intensity gradients of cell membrane
Precision + Recall
TP image (Jones et al., 2005). Hereafter, we refer to these three
Jaccard = . (6) CellProfile-based methods as CP_distance, CP_watershed, and
TP + FP + FN
CP_propagation, respectively.
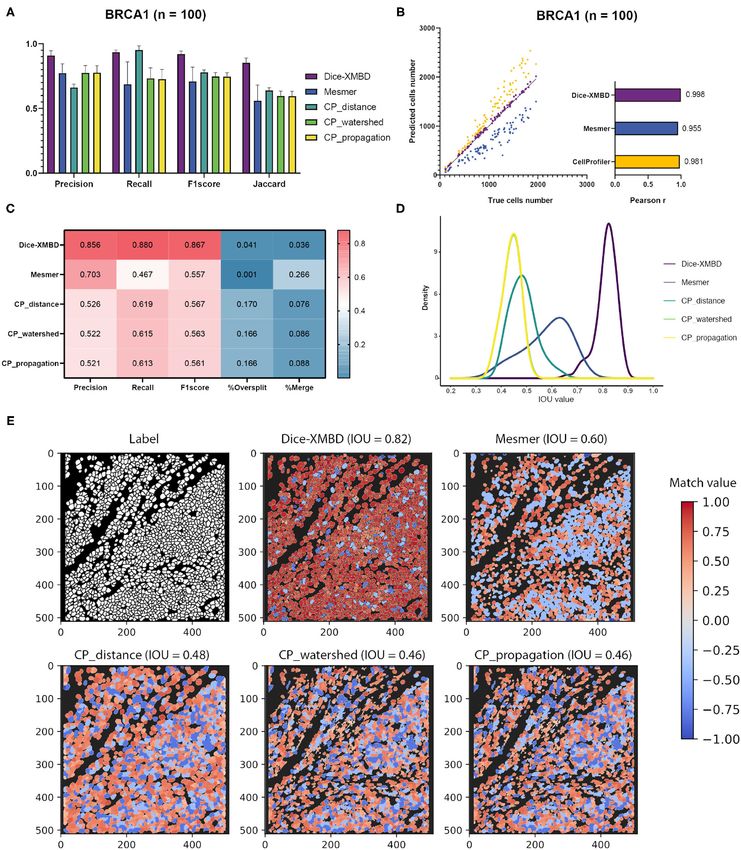
To investigate the effect of different segmentation methods Results show that Dice-XMBD outperformed all other
on downstream analysis, an unsupervised clustering method benchmarked methods with highest accuracy on pixel level
(Phenograph Levine et al., 2015, Python package, v1.5.7) was (F1 score = 0.92, Jaccard index = 0.85) (Figure 2A). We also
applied to the high-dimensional single cell expression data observed that CP_distance obtained the highest recall (Recall =
processed from each different method under comparison, and 0.95) but lowest precision (Precision = 0.66), which means that it
the labeled ground truth cell mask, separately. Prior to clustering, can identify almost every pixel correctly in the labeled mask but
single cell protein expressions were quantified by the mean pixel only 66% of predicted pixels were accurate.
values, and then these values were censored at 99th percentile In terms of cell-level performance, we first counted cells per
and transformed with arcsinh function. Scaled high-dimensional image from predicted and labeled cell masks. The prediction
single cells were clustered into several groups based on selected result from Dice-XMBD showed highest correlation with the
markers as from the original publication of each individual ground truth (Pearson correlation = 0.998) among all methods
dataset. Based on the expressions of cell-specific markers, the cell tested. Mesmer (Pearson correlation = 0.955) and CellProfiler
types of the clusters were identified among T cells (CD3), CD4 (Pearson correlation = 0.981) also achieved high correlation with
T cell (CD4), CD8 T cell (CD8a), B cell (CD20), macrophage the ground truth. However, Mesmer tended to predict less cells
(CD68), endothelial cell (CD31), and so on. By comparing the cell while CellProfiler was more likely to over-split cells, as shown in
annotation from different segmentation methods (predicted cell Figures 2B,C. Moreover, Figure 2C shows that Dice-XMBD had
mask) and the labeled cell mask, the cell annotation accuracy was the best prediction performance (F1-score = 0.867) considering
calculated as nsame /Ntotal . Here, nsame is the number of correctly precision (Precision = 0.856, percent of cells that were correctly
predicted cells, which are cells that correctly overlapped with predicted) and recall (Recall = 0.880, percent of true cells that are
the corresponding cells in the labeled mask (i.e., TP cells), and predicted) than Mesmer (F1-score = 0.557) and CellProfiler (F1-
annotated to the same cell types, Ntotal is the total number of cells score = 0.567, 0.563, and 0.561 for CP_distance, CP_watershed,
from the predicted mask. and CP_propagation, respectively). We further checked the IOU
Frontiers in Genetics | www.frontiersin.org 5 September 2021 | Volume 12 | Article 721229Xiao et al. Dice-XMBD: IMC Cell Segmentation FIGURE 2 | Dice-XMBD enables automatic single cell segmentation. (A) Pixel prediction performance comparison of Dice-XMBD, Mesmer, and CellProfiler (CP_distance, CP_watershed, CP_propagation). All data in bar plots are presented as mean ±SD. (B) Pearson correlations between the number of predicted cells and labeled cells per image. Note that the number of cells predicted from three CellProfiler methods are the same (here denoted as CellProfiler). (C) Cell prediction performance comparison. %Oversplit and %Merge denote the percentage of oversplits and merge errors in predictions. (D) Density plots showing the distribution of mean IOU values of matched cells per image. Note that the plots for CP_watershed and CP_propagation overlapped. (E) An example of labeled and predicted single cell masks from benchmarked methods. The title of each subfigure shows the method and the mean IOU value of all matched cell pairs in the predicted mask with regard to the labeled cell mask. Match value represents the IOU value for one-to-one cell pairs identified in the labeled and predicted cell masks. Note that computed IOU values are in the range of [0,1]. To better visualize FP cells, we use –0.4 and –0.8 to represent merged cells (multiple true cells matched to one predicted cell) and split cells (multiple predicted cells matched to one true cell), and –1 to represent all other FP cells in the predicted mask. Frontiers in Genetics | www.frontiersin.org 6 September 2021 | Volume 12 | Article 721229
Xiao et al.                                                                                                        Dice-XMBD: IMC Cell Segmentation

distribution of all one-to-one cell pairs (predicted and true cells),       fraction results in macrophage while Dice-XMBD still achieved
Figure 2D demonstrates that most matched cell pairs predicted               an R2 = 0.99 in this cell types. CP_distance delivered reasonable
from Dice-XMBD were highly overlapping (mean = 0.815,                       performance in macrophage, but was still inferior to Dice-XMBD
median = 0.821), followed by Mesmer where most matched pairs                on T cell. Similar results can be observed on other datasets
are only half area of overlap (mean = 0.579, median = 0.595).               as well. For example, for the T1D1 dataset, CD4 T cells were
An example of BRCA1 shown in Figure 2E demonstrates that                    poorly predicted by Ilastik (R2 = 0.043) and CP_distance
Dice-XMBD prediction was far superior to other benchmarked                  (R2 = 0.055) (Supplementary Figure 6A). For the T1D2 dataset,
methods since it contained most cells with high matched values.             endothelial cells were poorly predicted by Ilastik (R2 = 0.58) and
                                                                            macrophage cells were poorly predicted by Mesmer (R2 = 0.033).
3.2. Dice-XMBD Enables Generic IMC                                          On the other hand, Dice-XMBD delivered highly consistent
                                                                            prediction results across all cell types in all datasets except for T
Image Segmentation                                                          cell in BRCA2 dataset, where all methods did not perform well.
The key idea of this study was to generate an IMC-specific
                                                                               In addition to cell fraction, we also evaluated the annotation
single cell segmentation model across different datasets with
                                                                            accuracy of individual cells for each method (Figure 4E and
multiple proteins. We selected three independent IMC datasets
                                                                            Supplementary Figures 4B–7B), which is important for spatially
generated from different labs to test the generalization ability of
                                                                            related analysis of single cell data such as neighborhood analysis.
Dice-XMBD. Apart from the benchmarked methods mentioned
                                                                            Dice-XMBD achieved the highest cell annotation accuracies
above, we also included the Ilastik model trained from BRCA1
                                                                            among all segmentation methods on overall results (Figure 4E),
annotations in our comparison. Figure 3A shows that Dice-
                                                                            and performed as well as or better than other methods on all
XMBD outperformed all the other methods, followed by Ilastik.
                                                                            individual cell types in all datasets (Supplementary Figures 4B–
Moreover, the performance of cells prediction from Dice-XMBD
                                                                            7B).
was the best and the most stable for all three datasets, while
Ilastik and Mesmer tended to under-predict cells. CellProfiler              3.4. Generalization Ability of Dice-XMBD
predicted less cells in BRCA2 and over-predicted cells in two T1D           To investigate the impact of the training data on the
datasets, as shown in Figures 3B,C. Furthermore, Dice-XMBD                  segmentation performance of Dice-XMBD, we trained Dice-
predictions contained most of the cells with IOU value higher               XMBD using different training datasets, and evaluated the
than 0.8 (Figure 3D and Supplementary Figure 3).                            performance of the resulting models on other IMC datasets used
                                                                            in this study. Results show that segmentation performance in
3.3. Dice-XMBD Enables Accurate                                             terms of pixel-level accuracy were in fact very similar among
Downstream Biological Analysis                                              these models (Supplementary Tables 1–4). We further asked if
To investigate the influence of segmentation accuracy on                    the performance of Dice-XMBD could be improved by training
downstream analysis, we clustered single cells resulting from               on multiple datasets. Interestingly, the model did not consistently
different segmentation methods separately using Phenograph                  perform better when more than one datasets were combined
and compared the clustering results. Taking the result from single          as the training set (Supplementary Tables 1–4). All together,
cells obtained from Dice-XMBD segmentation on BRCA1 dataset                 these results suggest that by using location specific channels,
as an example, these cells can be clustered into 26 distinct clusters       Dice-XMBD were highly robust to different training datasets,
[Figure 4A, t-distributed stochastic neighbor embedding (t-SNE)             and a Dice-XMBD model trained on one dataset can be well
visualization in Figure 4B]. Based on the scaled mean expression            generalized to segmentation tasks on other IMC datasets.
for each cluster, we were able to annotate Cluster 3 as T cells,               Of note, in our approach, the channels of same locations
Cluster 18 as B cells, Cluster 16 as macrophage, and the remaining          were simply averaged without applying any weighting scheme
clusters to other cell types which may include tumor cells, stromal         to produce the location specific channels. We tried to min-
cells, or endothelial cells (Figure 4C). We performed the same              max-normalize the selected channels before averaging so that
clustering and annotation process on single cells obtained from             all selected channels contributed equally to the combined
other segmentation methods and the ground truth segmentation                channels. However, the pixel-level accuracy dropped on all
on all three datasets separately as well. For two T1D datasets              datasets, albeit at different levels of degradation on different
[T1D1 (Damond et al., 2019) and T1D2 (Wang et al., 2019)], CD4              datasets (Supplementary Tables 1–4). As different channels may
T cells, CD8 T cells, and CD31+ endothelial cells were identified           contain different levels of information to the final segmentation
based on their selected markers.                                            results, combining them with equal weights may not be the
   We compared the concordance of cell fractions based on                   optimal approach. However, how to find the optimal weighting
annotations from different segmentation methods (prediction)                combination of different channels remains an open question that
versus those from ground truth segmentation (ground truth)                  deserves further exploration.
(Figure 4D and Supplementary Figures 4A–7A). On BRCA1
dataset, Dice-XMBD performed better compared with all other                 4. DISCUSSION
segmentation methods on overall results and results of certain
cell types (Figure 4D). Significantly, two CellProfiler-based               Highly multiplexed single cell imaging technologies such as
methods (CP_watershed, R2 = 0.85 and CP_propagation,                        IMC are becoming increasingly important tools for both basic
R2 = 0.85) showed inferior performance in reproducing cell                  biomedical and clinical research. These tools can unveil complex

Frontiers in Genetics | www.frontiersin.org                             7                                 September 2021 | Volume 12 | Article 721229
Xiao et al. Dice-XMBD: IMC Cell Segmentation FIGURE 3 | Dice-XMBD enables generic imaging mass cytometry (IMC) image segmentation. Left: BCRA2, middle: T1D1, right: T1D2. (A) Pixel prediction performance comparison of Dice-XMBD, Ilastik, Mesmer, and CellProfiler (CP_distance, CP_watershed, CP_propagation). All data in bar plots are presented as mean ±SD. (B) Pearson correlations between the number of predicted cells and labeled cells per image. Note that the number of cells predicted from three CellProfiler methods are the same (here denoted as CellProfiler). (C) Heatmaps of cells prediction performance of six benchmarked methods. %Oversplit and %Merge denote the percentage of oversplits and merge errors in predictions. (D) Density plots showing the distribution of mean IOU values of matched cells per image. Note that the plots for CP_watershed and CP_propagation overlapped for BRCA2 and T1D1. single-cell phenotypes and their spatial context at unprecedented On the other hand, high-order visual features including spatial details, providing a solid base for further exploration in distribution of markers, textures, and gradients are relevant to cancer, diabetes, and other complex diseases. Nevertheless, cell visually identify subcellular structures by human. However, these segmentation has become a major bottleneck in analyzing features are not considered in conventional methods to improve multiplexed images. Conventional approaches rely on intensities the cell segmentation results. of protein markers to identify different cellular structures such as The DNN-based image segmentation approaches provide an nuclei, cytoplasm, and membrane. Unfortunately, the intensity opportunity to leverage high-order visual features at cellular level values of these markers are strongly cell type-specific and may for better segmentation results. Unfortunately, they require a vary from cells to cells. In addition, the staining also shows significant amount of annotation data that are in general difficult variability across images or datasets. As a result, the accuracy to acquire. In addition, the highly variable channel configurations and robustness of the segmentation results are far from optimal. of multiplexed images impose another important obstacle to Frontiers in Genetics | www.frontiersin.org 8 September 2021 | Volume 12 | Article 721229
Xiao et al.                                                                                                                        Dice-XMBD: IMC Cell Segmentation

  FIGURE 4 | Dice-XMBD enables accurate downstream biological analysis. (A) Heatmap showing median values of normalized markers expression in each
  Phenograph cluster. (B) tSNE map representing high-dimensional single cells colored by Phenograph clusters (left) and cell types (right). (C) tSNE map representing
  single cells colored by cell-type-specific markers expression (CD68 for macrophage, CD45 and CD3 for T cells, CD45 and CD20 for B cells). Single cells on (A–C)
  were from BRCA1 dataset and segmented by Dice-XMBD. (D) Scatter plots of cell fraction obtained from ground truth (x-axis) and five segmentation methods (y-axis),
  colored by different cell types identified from BRCA1 dataset. (E) Cell annotation accuracy from Dice-XMBD and other benchmarked methods in four datasets.
  Pairwise comparisons of Dice-XMBD and other methods: *P < 0.05; ****P < 0.0001; n.s., not significant (Student’s t-test).

the usability of these methods as most of them lack the ability                       with manual input of human as a teacher model. Moreover,
to adapt to different channel configurations after models are                         by consolidating multiple channels of different proteins into
trained. In this study, we develop Dice-XMBD, a generic solution                      two cellular structure-aware channels, Dice-XMBD provides an
for IMC image segmentation based on U-Net. Dice-XMBD                                  effective off-the-shelf solution for cell segmentation tasks across
overcomes the limitation of training data scarcity and achieves                       different studies without retraining that can lead to significant
human-level accuracy by distilling expert knowledge from Ilastik                      delay in analysis. Importantly, our evaluation results further

Frontiers in Genetics | www.frontiersin.org                                       9                                      September 2021 | Volume 12 | Article 721229
Xiao et al.                                                                                                                                  Dice-XMBD: IMC Cell Segmentation

demonstrate Dice-XMBD’s good generalization ability to predict                                AUTHOR CONTRIBUTIONS
single cells for different IMC image datasets with minimum
impact to downstream analysis, suggesting its values as an generic                            WY, LW, RY, and JH discussed the ideas and supervised
tool for hassle-free large-scale IMC data analysis. Finally, to                               the study. YQ and YJ implemented and conducted
facilitate the analysis of large amount of IMC data currently                                 experiments in deep network cell segmentation. XX
being generated around the world, we made Dice-XMBD publicly                                  performed the model evaluation and biological analysis
available as an open-source software on GitHub (https://github.                               on segmentation results. XX, WY, and RY wrote the
com/xmuyulab/Dice-XMBD).                                                                      manuscript. All authors discussed and commented on
                                                                                              the manuscript.
DATA AVAILABILITY STATEMENT
                                                                                              FUNDING
All datasets used for this study can be found at
GitHub (https://github.com/xmuyulab/Dice-XMBD). These                                         This study was funded by National Natural Science Foundation
datasets are downloaded from: BRCA1 (https://idr.                                             of China (grant no. 81788101 to JH).
openmicroscopy.org/search/?query=Name:idr0076ali-metabric/
experimentA), BRCA2 (https://zenodo.org/record/3518284#.                                      SUPPLEMENTARY MATERIAL
YLnmlS8RquU), T1D1 (https://data.mendeley.com/datasets/
cydmwsfztj/1), T1D2 (part1: https://data.mendeley.com/                                        The Supplementary Material for this article can be found
datasets/9b262xmtm9/1, part2: https://data.mendeley.com/                                      online at: https://www.frontiersin.org/articles/10.3389/fgene.
datasets/xbxnfg2zfs/1), respectively.                                                         2021.721229/full#supplementary-material

REFERENCES                                                                                        in International Conference on Medical Image Computing and Computer-
                                                                                                  Assisted Intervention (Cham: Springer), 424–432.
Ali, H. R., Jackson, H. W., Zanotelli, V. R. T., Danenberg, E., Fischer, J.                   Damond, N., Engler, S., Zanotelli, V. R., Schapiro, D., Wasserfall, C.
    R., Bardwell, H., et al. (2020). Imaging mass cytometry and multiplatform                     H., Kusmartseva, I., et al. (2019). A map of human type 1 diabetes
    genomics define the phenogenomic landscape of breast cancer. Nat. Cancer 1,                   progression by imaging mass cytometry. Cell Metab. 29, 755–768.
    163–175. doi: 10.1038/s43018-020-0026-6                                                       doi: 10.1016/j.cmet.2018.11.014
Andrade, A. R., Vogado, L. H., de, M. S., Veras, R., Silva, R. R., Araujo, F.                 de Vries, N. L., Mahfouz, A., Koning, F., and de Miranda, N. F. (2020).
    H., et al. (2019). Recent computational methods for white blood cell nuclei                   Unraveling the complexity of the cancer microenvironment with
    segmentation: a comparative study. Comput. Methods Programs Biomed. 173,                      multidimensional genomic and cytometric technologies. Front. Oncol.
    1–14. doi: 10.1016/j.cmpb.2019.03.001                                                         10:1254. doi: 10.3389/fonc.2020.01254
Angelo, M., Bendall, S. C., Finck, R., Hale, M. B., Hitzman, C., Borowsky, A. D.,             Dey, P., Li, J., Zhang, J., Chaurasiya, S., Strom, A., Wang, H.,
    et al. (2014). Multiplexed ion beam imaging of human breast tumors. Nat. Med.                 et al. (2020). Oncogenic kras-driven metabolic reprogramming
    20, 436–442. doi: 10.1038/nm.3488                                                             in pancreatic cancer cells utilizes cytokines from the tumor
Aoki, T., Chong, L. C., Takata, K., Milne, K., Hav, M., Colombo, A., et al. (2020).               microenvironment. Cancer Discov. 10, 608–625. doi: 10.1158/2159-8290.CD-1
    Single-cell transcriptome analysis reveals disease-defining t-cell subsets in the             9-0297
    tumor microenvironment of classic hodgkin lymphoma. Cancer Discov. 10,                    Flint, L. E., Hamm, G., Ready, J. D., Ling, S., Duckett, C. J., Cross, N. A., et al.
    406–421. doi: 10.1158/2159-8290.CD-19-0680                                                    (2020). Characterization of an aggregated three-dimensional cell culture model
Böttcher, C., van der Poel, M., Fernández-Zapata, C., Schlickeiser, S., Leman,                    by multimodal mass spectrometry imaging. Anal. Chem. 92, 12538–12547.
    J. K., Hsiao, C.-C., et al. (2020). Single-cell mass cytometry reveals                        doi: 10.1021/acs.analchem.0c02389
    complex myeloid cell composition in active lesions of progressive multiple                Giesen, C., Wang, H. A., Schapiro, D., Zivanovic, N., Jacobs, A., Hattendorf,
    sclerosis. Acta Neuropathol. Commun. 8, 1–18. doi: 10.1186/s40478-020-                        B., et al. (2014). Highly multiplexed imaging of tumor tissues with
    01010-8                                                                                       subcellular resolution by mass cytometry. Nat. Methods 11, 417–422.
Bouzekri, A., Esch, A., and Ornatsky, O. (2019). Multidimensional profiling of                    doi: 10.1038/nmeth.2869
    drug-treated cells by imaging mass cytometry. FEBS Open Bio. 9, 1652–1669.                Greenwald, N. F., Miller, G., Moen, E., Kong, A., Kagel, A., Fullaway, C. C.,
    doi: 10.1002/2211-5463.12692                                                                  et al. (2021). Whole-cell segmentation of tissue images with human-level
Brähler, S., Zinselmeyer, B. H., Raju, S., Nitschke, M., Suleiman, H., Saunders, B.               performance using large-scale data annotation and deep learning. bioRxiv.
    T., et al. (2018). Opposing roles of dendritic cell subsets in experimental GN. J.            doi: 10.1101/2021.03.01.431313
    Am. Soc. Nephrol. 29, 138–154. doi: 10.1681/ASN.2017030270                                Hinton, G., Vinyals, O., and Dean, J. (2015). “Distilling the knowledge in a
Carpenter, A. E., Jones, T. R., Lamprecht, M. R., Clarke, C., Kang, I.                            neural network,” in NIPS Deep Learning and Representation Learning Workshop
    H., Friman, O., et al. (2006). Cellprofiler: image analysis software                          Montreal.
    for identifying and quantifying cell phenotypes. Genome Biol. 7:R100.                     Hollandi, R., Szkalisity, A., Toth, T., Tasnadi, E., Molnar, C., Mathe, B.,
    doi: 10.1186/gb-2006-7-10-r100                                                                et al. (2020). nucleAIzer: a parameter-free deep learning framework for
Catena, R., Oezcan, A., Kuett, L., Pluess, A., Schraml, P., Moch, H.,                             nucleus segmentation using image style transfer. Cell Syst. 10, 453.e6–458.e6.
    et al. (2020). Highly multiplexed molecular and cellular mapping of                           doi: 10.1016/j.cels.2020.04.003
    breast cancer tissue in three dimensions using mass tomography. bioRxiv.                  Jackson, H. W., Fischer, J. R., Zanotelli, V. R., Ali, H. R., Mechera,
    doi: 10.1101/2020.05.24.113571                                                                R., Soysal, S. D., et al. (2020). The single-cell pathology landscape
Chang, Q., Ornatsky, O. I., Siddiqui, I., Loboda, A., Baranov, V. I., and                         of breast cancer. Nature 578, 615–620. doi: 10.1038/s41586-019-1
    Hedley, D. W. (2017). Imaging mass cytometry. Cytometry A 91, 160–169.                        876-x
    doi: 10.1002/cyto.a.23053                                                                 Jones, T. R., Carpenter, A., and Golland, P. (2005). “Voronoi-based segmentation
Çiçek, Ö., Abdulkadir, A., Lienkamp, S. S., Brox, T., and Ronneberger, O. (2016).                 of cells on image manifolds,” in International Workshop on Computer Vision for
    “3D U-Net: learning dense volumetric segmentation from sparse annotation,”                    Biomedical Image Applications (Berlin; Heidelberg: Springer), 535–543.

Frontiers in Genetics | www.frontiersin.org                                              10                                        September 2021 | Volume 12 | Article 721229
Xiao et al. Dice-XMBD: IMC Cell Segmentation
Lähnemann, D., Köster, J., Szczurek, E., McCarthy, D. J., Hicks, S. C., Robinson, Van Valen, D. A., Kudo, T., Lane, K. M., Macklin, D. N., Quach,
M. D., et al. (2020). Eleven grand challenges in single-cell data science. Genome N. T., DeFelice, M. M., et al. (2016). Deep learning automates
Biol. 21, 1–35. doi: 10.1186/s13059-020-1926-6 the quantitative analysis of individual cells in live-cell imaging
Levine, J. H., Simonds, E. F., Bendall, S. C., Davis, K. L., El-ad, D. A., experiments. PLoS Comput. Biol. 12:e1005177. doi: 10.1371/journal.pcbi.10
Tadmor, M. D., et al. (2015). Data-driven phenotypic dissection of AML 05177
reveals progenitor-like cells that correlate with prognosis. Cell 162, 184–197. Vicar, T., Balvan, J., Jaros, J., Jug, F., Kolar, R., Masarik, M., et al.
doi: 10.1016/j.cell.2015.05.047 (2019). Cell segmentation methods for label-free contrast microscopy:
Liu, X., Song, W., Wong, B. Y., Zhang, T., Yu, S., and Lin, G. N. review and comprehensive comparison. BMC Bioinformatics 20:360.
(2019). A comparison framework and guideline of clustering methods for doi: 10.1186/s12859-019-2880-8
mass cytometry data. Genome Biol. 20, 1–18. doi: 10.1186/s13059-019-19 Vincent, L., and Soille, P. (1991). Watersheds in digital spaces: an efficient
17-7 algorithm based on immersion simulations. IEEE Comput. Arch. Lett. 13,
Milletari, F., Navab, N., and Ahmadi, S.-A. (2016). “V-net: fully convolutional 583–598. doi: 10.1109/34.87344
neural networks for volumetric medical image segmentation,” in 2016 Fourth Wang, Y. J., Traum, D., Schug, J., Gao, L., Liu, C., Atkinson, M. A., et al. (2019).
International Conference on 3D Vision (3DV) (Stanford, CA: IEEE), 565–571. Multiplexed in situ imaging mass cytometry analysis of the human endocrine
Papalexi, E., and Satija, R. (2018). Single-cell RNA sequencing to explore immune pancreas and immune system in type 1 diabetes. Cell Metab. 29, 769–783.
cell heterogeneity. Nat. Rev. Immunol. 18: 35. doi: 10.1038/nri.2017.76 doi: 10.1016/j.cmet.2019.01.003
Potter, S. S. (2018). Single-cell RNA sequencing for the study of Zhang, M., Li, X., Xu, M., and Li, Q. (2018). “RBC semantic segmentation for
development, physiology and disease. Nat. Rev. Nephrol. 14, 479–492. sickle cell disease based on deformable U-Net,” in International Conference
doi: 10.1038/s41581-018-0021-7 on Medical Image Computing and Computer-Assisted Intervention (Cham:
Ramaglia, V., Sheikh-Mohamed, S., Legg, K., Park, C., Rojas, O. L., Zandee, S., Springer), 695–702.
et al. (2019). Multiplexed imaging of immune cells in staged multiple sclerosis Zhang, Y., Gao, Y., Qiao, L., Wang, W., and Chen, D. (2020). Inflammatory
lesions by mass cytometry. Elife 8:e48051. doi: 10.7554/eLife.48051.028 response cells during acute respiratory distress syndrome in patients with
Ronneberger, O., Fischer, P., and Brox, T. (2015). “U-net: convolutional networks coronavirus disease 2019 (COVID-19). Ann. Intern. Med. 173, 402–404.
for biomedical image segmentation,” in International Conference on Medical doi: 10.7326/L20-0227
Image Computing and Computer-Assisted Intervention (Springer, Munich), Zhou, Z., Siddiquee, M. M. R., Tajbakhsh, N., and Liang, J. (2018). “Unet++: a
234–241. nested u-net architecture for medical image segmentation,” in Deep Learning in
Salem, D., Li, Y., Xi, P., Cuperlovic-Culf, M., Phenix, H., and Kaern, M. (2020). Medical Image Analysis and Multimodal Learning for Clinical Decision Support
Yeastnet: deep learning enabled accurate segmentation of budding yeast cells (Cham: Springer), 3–11.
in bright-field microscopy. bioRxiv. doi: 10.1101/2020.11.30.402917 Zrazhevskiy, P., and Gao, X. (2013). Quantum dot imaging platform for
Schulz, D., Zanotelli, V. R. T., Fischer, J. R., Schapiro, D., Engler, S., Lun, X.-K., single-cell molecular profiling. Nat. Commun. 4, 1–12. doi: 10.1038/ncomm
et al. (2018). Simultaneous multiplexed imaging of mrna and proteins with s2635
subcellular resolution in breast cancer tissue samples by mass cytometry. Cell
Syst. 6, 25–36. doi: 10.1016/j.cels.2017.12.001 Conflict of Interest: RY and WY are shareholders of Aginome Scientific.
Schwabenland, M., Salié, H., Tanevski, J., Killmer, S., Lago, M. S.,
Schlaak, A. E., et al. (2021). Deep spatial profiling of human COVID- The remaining authors declare that the research was conducted in the absence of
19 brains reveals neuroinflammation with distinct microanatomical any commercial or financial relationships that could be construed as a potential
microglia-T-cell interactions. Immunity 54, 1594.e11–1610.e11. conflict of interest.
doi: 10.1016/j.immuni.2021.06.002
Shen, D., Wu, G., and Suk, H.-I. (2017). Deep learning in
Publisher’s Note: All claims expressed in this article are solely those of the authors
medical image analysis. Annu. Rev. Biomed. Eng. 19, 221–248.
doi: 10.1146/annurev-bioeng-071516-044442 and do not necessarily represent those of their affiliated organizations, or those of
Sommer, C., Straehle, C., Köthe, U., and Hamprecht, F. A. (2011). “Ilastik: the publisher, the editors and the reviewers. Any product that may be evaluated in
interactive learning and segmentation toolkit,” in 2011 IEEE International this article, or claim that may be made by its manufacturer, is not guaranteed or
Symposium on Biomedical Imaging: From Nano to Macro (Chicago, IL: IEEE), endorsed by the publisher.
230–233.
Stubbington, M. J., Rozenblatt-Rosen, O., Regev, A., and Teichmann, S. A. (2017). Copyright © 2021 Xiao, Qiao, Jiao, Fu, Yang, Wang, Yu and Han. This is an
Single-cell transcriptomics to explore the immune system in health and disease. open-access article distributed under the terms of the Creative Commons Attribution
Science 358, 58–63. doi: 10.1126/science.aan6828 License (CC BY). The use, distribution or reproduction in other forums is permitted,
Tan, W. C. C., Nerurkar, S. N., Cai, H. Y., Ng, H. H. M., Wu, D., Wee, Y. T. F., et al. provided the original author(s) and the copyright owner(s) are credited and that the
(2020). Overview of multiplex immunohistochemistry/immunofluorescence original publication in this journal is cited, in accordance with accepted academic
techniques in the era of cancer immunotherapy. Cancer Commun. 40, 135–153. practice. No use, distribution or reproduction is permitted which does not comply
doi: 10.1002/cac2.12023 with these terms.
Frontiers in Genetics | www.frontiersin.org 11 September 2021 | Volume 12 | Article 721229You can also read