A New Window Loss Function for Bone Fracture Detection and Localization in X-ray Images with Point-based Annotation
←
→
Page content transcription
If your browser does not render page correctly, please read the page content below
A New Window Loss Function for Bone Fracture Detection and Localization
                                                           in X-ray Images with Point-based Annotation
                                               * †   Xinyu Zhang1 , * Yirui Wang1 , Chi-Tung Cheng2 , Le Lu1 , Adam P. Harrison1 , Jing Xiao3 ,
                                                                               Chien-Hung Liao2 , Shun Miao1
                                                                                          1
                                                                                            PAII Inc., Bethesda, Maryland, USA
                                                                               2
                                                                                   Chang Gung Memorial Hospital, Linkou, Taiwan, ROC
                                                                                        3
                                                                                           Ping An Technology, Shenzhen, China

                                                                    Abstract
arXiv:2012.04066v2 [cs.CV] 4 Jan 2021

                                          Object detection methods are widely adopted for computer-
                                          aided diagnosis using medical images. Anomalous findings
                                          are usually treated as objects that are described by bound-
                                          ing boxes. Yet, many pathological findings, e.g., bone frac-
                                          tures, cannot be clearly defined by bounding boxes, owing to
                                          considerable instance, shape and boundary ambiguities. This
                                          makes bounding box annotations, and their associated losses,
                                          highly ill-suited. In this work, we propose a new bone fracture
                                          detection method for X-ray images, based on a labor effective
                                          and flexible annotation scheme suitable for abnormal findings      Figure 1: Fractures in PXRs where the numbers of instances
                                          with no clear object-level spatial extents or boundaries. Our      and their spatial extents are extremely ambiguous. The anno-
                                          method employs a simple, intuitive, and informative point-         tations of fractures can be represented by small/tight bound-
                                          based annotation protocol to mark localized pathology infor-
                                                                                                             ing boxes on fracture lines (green boxes), or relatively
                                          mation. To address the uncertainty in the fracture scales anno-
                                          tated via point(s), we convert the annotations into pixel-wise     big bounding boxes containing the entire fractured region
                                          supervision that uses lower and upper bounds with positive,        (yellow boxes). To skirt this inherent subjectivity, we adopt
                                          negative, and uncertain regions. A novel Window Loss is sub-       and learn from point-based annotations (red dots).
                                          sequently proposed to only penalize the predictions outside
                                          of the uncertain regions. Our method has been extensively
                                          evaluated on 4410 pelvic X-ray images of unique patients.             Spurred by the public release of large-scale datasets, chest
                                          Experiments demonstrate that our method outperforms previ-
                                                                                                             X-ray (CXR) CAD has received a great deal of recent at-
                                          ous state-of-the-art image classification and object detection
                                          baselines by healthy margins, with an AUROC of 0.983 and           tention, with many prominent methods treating the prob-
                                          FROC score of 89.6%.                                               lem as a multi-label image classification problem (Rajpurkar
                                                                                                             et al. 2017; Wang et al. 2017; Baltruschat et al. 2019). These
                                                                                                             works typically report area under receiver operating charac-
                                                             1    Introduction                               teristic curve (AUROC) scores, e.g., 0.817 (Baltruschat et al.
                                                                                                             2019) on the NIH-ChestXray14 dataset (Wang et al. 2017)
                                        Due to its efficiency, accessibility, and low cost, X-ray imag-      and 0.930 (Pham et al. 2020) on the CheXPert dataset (Irvin
                                        ing is one of the most commonly performed diagnostic ex-             et al. 2019). Yet, in clinical diagnostic workflows, localiza-
                                        aminations in clinical practice. Conventional computer vi-           tion of the detected anomalies is also needed both to inter-
                                        sion techniques have been extensively researched in the past         pret the results and for verifiable decision making. While
                                        few decades to develop computer aided diagnosis (CAD) so-            class activation maps (CAMs) can provide a degree of local-
                                        lutions, aiming to increase image reading efficiency and re-         ization under classification setups, they have limited local-
                                        duce misdiagnoses risks. Current state-of-the-art CAD sys-           ization power and tend to miss abnormal sites when multiple
                                        tems widely adopt generic principles of image classification         pathological findings occur concurrently in an image.
                                        and object detection to identify and localize the anomalies.
                                        However, to provide both robust classification and localiza-            To improve localization performance, several methods
                                        tion in applications where pathologies have ambiguously de-          use additional box-level annotations to facilitate the training
                                        fined extents, such as for pelvic X-rays (PXRs), alternative         of image classifiers (Li et al. 2018; Liu et al. 2019a; Huang
                                        solutions are needed. This is the topic of our work.                 et al. 2020). For other CAD applications where localization
                                                                                                             performance is more central, such as lung nodule and breast
                                           * X. Zhang and Y. Wang—Equal contribution.                        mass/calcification detection, explicit object detection frame-
                                           †
                                             This work was done when X. Zhang was intern at PAII Inc.        works are widely adopted (Yan et al. 2018b, 2019; Jiang
                                        Copyright © 2021, Association for the Advancement of Artificial      et al. 2020). However, compared to image classifiers, object
                                        Intelligence (www.aaai.org). All rights reserved.                    detection methods focus predominantly on localization and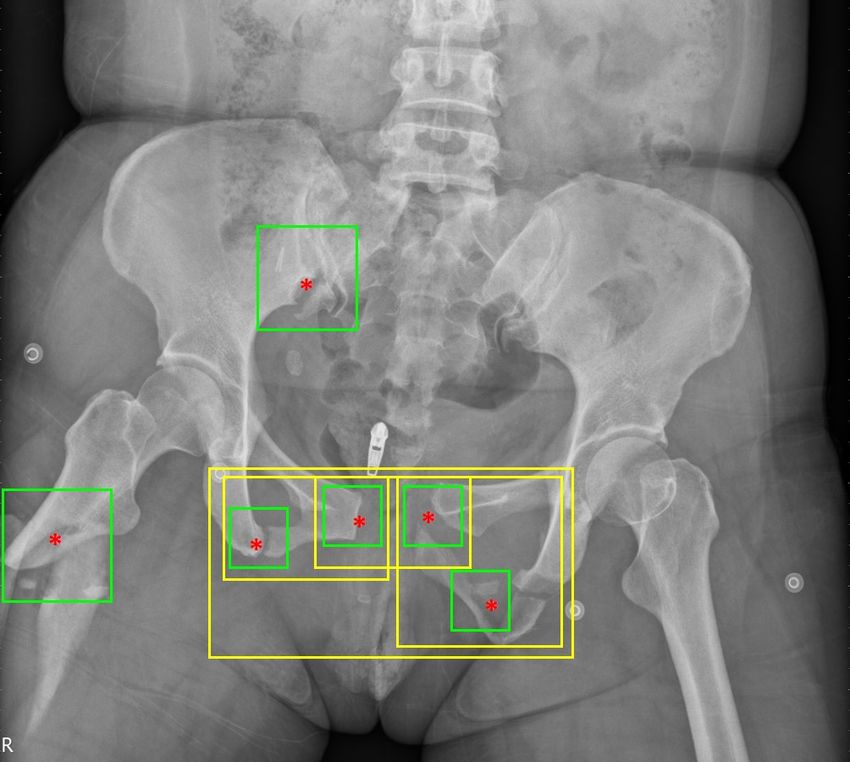
may struggle to produce robust image-level diagnoses, e.g.,       on CXR classification. Typically, these methods train
by triggering undesirable false positives.                        deep neural networks that output per-image classification
   Another critical downside to object detectors is their re-     scores and calculate losses against the image-level la-
liance on bounding boxes. Besides being prohibitively labo-       bels. CheXNet (Rajpurkar et al. 2017) trains a DenseNet-
rious, bounding boxes (or any explicit defining boundary)         121 (Huang et al. 2017) with global average pooling (GAP)
are not always suitable for all types of medical anomalies,       performed on the penultimate feature maps before being
particularly when pathological findings cannot be easily de-      inputted into a fully connected layer, and Wang et al.
lineated as discrete instances with definite boundaries. Frac-    (2017) replaced the GAP with log-sum-exp (LSE). Yao et al.
tures in PXRs serve as excellent exemplar, as they usually        (2018); Wang et al. (2019); Li et al. (2018); Liu et al. (2019a)
involve multiple anatomical sites with complex morphol-           take a different approach by regarding the convolutional
ogy and curvilinear fragments that make defining the bor-         feature maps as local appearance descriptors of spatially
der, extent, and number of the bounding boxes extraordi-          sliced blocks. The features maps are then processed with
narily difficult and ambiguous (as shown in Fig. 1). There-       a 1x1 convolution to produce class-wise probability maps
fore, an anomaly diagnosis and localization method with 1)        and globally pooled to produce the image-level classifica-
a cost-effective and flexible annotation scheme and 2) simul-     tion probabilities. Choices of pooling methods include LSE
taneously high classification and localization performance is     pooling (Yao et al. 2018; Wang et al. 2019) or the product of
critical and highly desirable.                                    the probabilities (Li et al. 2018; Liu et al. 2019a), where the
   In this work, we present a trauma PXR bone fracture diag-      latter assumes that probability values are independent and
nosis and localization system with a cost-effective and flex-     identically distributed.
ible annotation scheme that is suitable for detecting abnor-         Methods with global feature pooling (Yan et al. 2018a)
mal findings with no clear object boundaries. Interpreting        typically rely on spatial attention mechanisms like CAMs
trauma PXRs in an emergency room environment requires             or Grad-CAM to localize the underlying anomalies. In con-
timely image-level diagnoses and fracture localizations. The      trast, methods with class-wise probability maps (Yao et al.
image-level diagnosis determines the downstream actions in        2018; Wang et al. 2019) can directly produce localizations
the clinical workflow, e.g., further examination, hospitaliza-    without any add-on components. Either way, deep models
tion, or hospital discharge. Robust fracture localization can     trained with only image-level labels may not always pro-
help physicians avoid missed diagnoses that must be treated       duce plausible localizations with high reliability. Other ap-
in a timely manner, otherwise serious complications can oc-       proaches (Li et al. 2018; Liu et al. 2019a) have addressed
cur. Due to the geometrical complexities of bone fractures        this issue by developing strategies to exploit the small num-
and the perspective projection distortions of PXRs, diagno-       ber/percentage of images with bounding box annotations.
sis and localization of fractures in PXR is a challenging task       Similar to prior work (Chen et al. 2020), our method uses
where even experienced physicians can make considerable           a 1x1 convolution on the last feature map to produce a frac-
diagnostic errors (Chellam 2016).                                 ture class probability map. Different from the above classi-
   To cope with the inherent geometrical complexity of            fication based methods, our method is trained using point-
pelvic fractures, our model use annotated points as super-        based labels. In this way, we share a similar motivation
visory signals. This point-based annotation is labor efficient    with Li et al. (2018); Liu et al. (2019a) to leverage addi-
and allows ambiguous fracture conditions to be adequately         tional low cost localization annotations. However, we apply
represented as one point or multiple points (on the fracture      a fundamentally different conceptual framework, using 1)
sites). To account for the uncertainties in the scale and shape   point-based annotations to account for the intrinsic ambigu-
of the annotated fracture sites, we propose to convert the        ity on visually defining/depicting bone fractures in X-rays as
points to pixel-wise supervision signals, which consist of        spatially-bounded objects and 2) designing a new Window
lower and upper bounds of the expected network prediction         Loss to naturally handle and learn from these annotations.
with an allowed region between the bounds. A novel Win-
dow Loss is proposed that only penalizes predictions outside      Object Detection Methods
of the bounds, which encourages the model to learn from the       Substantial progress has been made in recent years in the
reliable information without being distracted by the inherent     development of deep learning based object detection meth-
uncertainties in the annotations. We evaluated our proposed       ods. These include anchor-based solutions (Ren et al. 2015;
method on 4410 PXRs collected from a primary trauma cen-          Lin et al. 2017b) and recent anchor-free solutions (Tian et al.
ter representing real clinical situations. Our method reports     2019; Law and Deng 2018), which repeatedly break the ac-
an AUROC of 0.983 and FROC score of 89.6%, significantly          curacy records on benchmarks like MS-COCO (Lin et al.
outperforming previous state-of-the-art image classification      2014a). The success and popularity of object detection in
and object detection methods by at roughly 1% or more on          natural imagery has motivated research on adopting them
AUROC and 1.5% on FROC score, respectively.                       for a wide spectrum of medical image anomaly localiza-
                                                                  tion problems, such as distal radius fractures in hand X-
                   2    Related Work                              rays (Yahalomi, Chernofsky, and Werman 2019), pneumonia
                                                                  in CXR (Sirazitdinov et al. 2019), masses in mammogra-
Image Classification Methods                                      phy (Al-Masni et al. 2018) and general lesions in computed
The availability of large-scale public CXR datasets with          tomography (CT) (Yan et al. 2018b, 2019). Many domain
image-level labels has catalyzed a large body of work             specific enhancements have been proposed, including incor-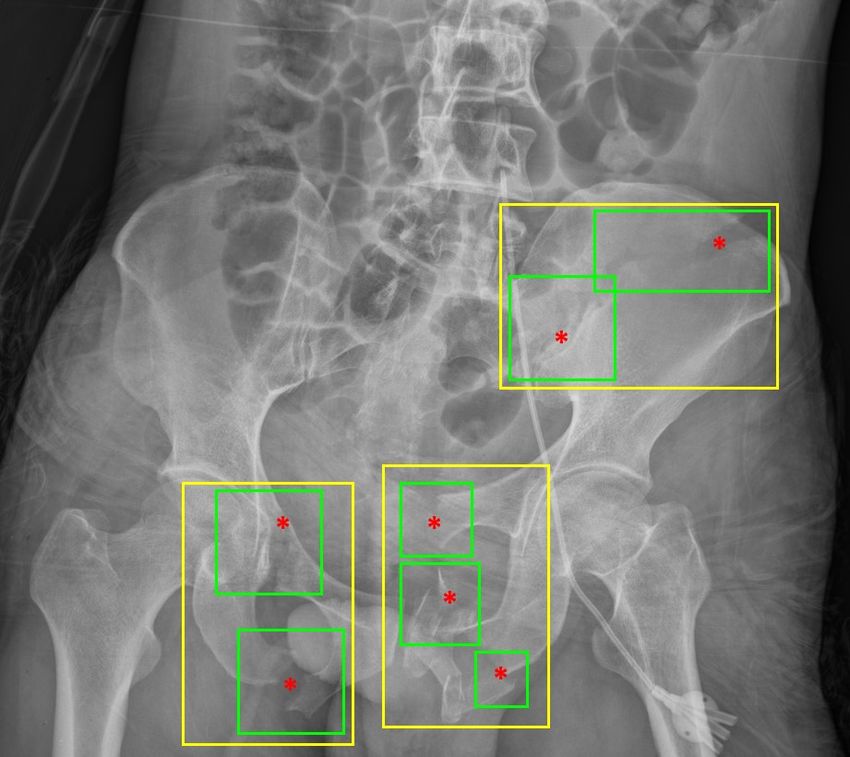
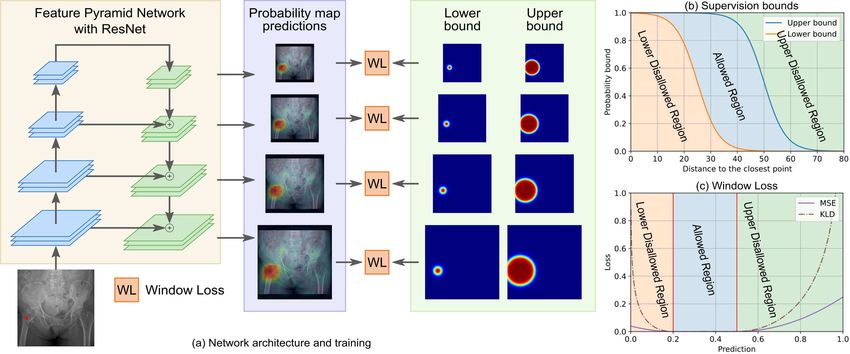
Figure 2: Framework of the proposed method. (a) Network architecture and training mechanism of the proposed method.
(b) Lower and upper bounds of the generated pixel-level supervision. (c) Profiles of the proposed Window Loss using MSE or
KLD as the divergence measure.

porating symmetry cues for breast mammography (Liu et al.         to look?). Fig. 2 illustrates an overview of our framework.
2019b); exploiting the anatomical prior of vertebraes via
self-calibration (Zhao et al. 2019); and addressing missing       Point-based Annotation
annotations, hard negatives, and/or heterogeneous datasets        The complex morphology of pelvic fractures challenges the
for universal lesion detection (Yan et al. 2020; Cai et al.       collection of reliable and consistent localization annotations.
2020). Like object detectors, our work explicitly learns from     Due to the difficulties in defining the border, extent, and
localization annotations, but the inherent visual ambiguity of    number of bounding boxes, the commonly adopted bound-
pelvic fractures makes our problem fundamentally different.       ing box annotation suffers from high inter-annotator varia-
To address this, we propose a point-based annotation scheme       tions, which can cause conflicting supervisory signals. For
and Window Loss for such challenging ambiguities.                 instance, the pelvic fractures shown in Fig. 1 can be an-
                                                                  notated using multiple small boxes or one larger box. We
                       3    Method                                propose to use point-based annotations to provide the lo-
There are two critical metrics to measure a CAD solution’s        calization information. The pin-pointing annotation protocol
effectiveness in clinical settings: generality (handling of un-   is flexible and naturally fits our complex scenario: we ask
seen patients) and precision (generating good accuracy ro-        the annotators/physicians to place points on visible fracture
bustly for the given task). Naturally, incorporating as many      sites. For complex scenarios where the instance of fractures
patients as possible for training is desirable, but patient       cannot be clearly defined, the annotators decide to place one
data often cannot be fully annotated at scale, precluding ap-     or multiple points at their own discretion. Two challenges
proaches seen in natural images (Lin et al. 2014b). In med-       arise when using point-based annotation to supervise net-
ical imaging, the labor costs are always paramount. Even          work training: 1) unknown scales of fracture sites, and 2)
more intractably, for many applications, e.g., PXR fracture       inter-rater variability in point placements. We address this
detection, there are inherent perceptual uncertainties and        with our proposed Window Loss.
challenges in annotating precise bounding boxes of patho-
logical findings. Alternative strategies are needed. A promis-    Window Loss
ing inspiration can be found in extreme points for object an-     Despite any uncertainties in scale and inter-annotator vari-
notation (Papadopoulos et al. 2017), which are found to be        ability, point-based annotations provide the following infor-
a quicker and easier visual perception protocol by human          mation: 1) regions in close proximity to the annotated points
annotators. Similarly, in this work, we use only point-based      are likely abnormal; 2) regions far away from all points
annotations to localize bone fractures in PXRs (i.e., where       are highly likely to be normal; 3) for in-between regions it
to look?) so we can execute the annotation process at scale       is difficult, if not possible, to specify any particular confi-
to cover as many as thousands of patients to achieve gen-         dence value. We encode this by calculating an allowed con-
erality. To achieve precision, we propose a Window Loss           fidence range at every point in the image. Any prediction
that can robustly cope with the aforementioned ambiguities        that falls into the allowed range is deemed acceptable, re-
in defining the extents and scales of fracture sites (i.e., how   gardless of where it falls. This aligns with the inherent am-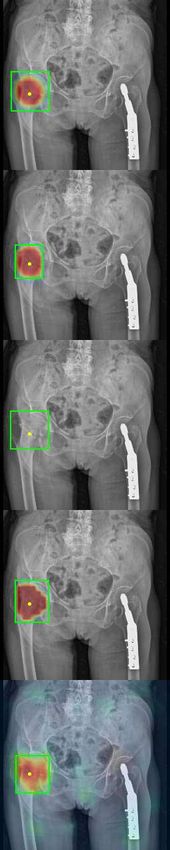
biguities of fracture localization, where many image regions with a feature pyramid network (FPN) backbone (Lin et al.
do not permit the specification of any particular value. On 2017a). The ResNet-50 portion has a bottom-up path that en-
the other hand, if any prediction violates the allowed confi- codes the input PXR using four sequential blocks, with each
dence range, it is penalized. down-sampling the image size by 2. The FPN adds a top-
To calculate an allowed confidence range, we create two down path that upsamples and fuses the bottom-up feature
heatmaps to represent the upper confidence and lower con- maps. The feature maps are then processed by a 1x1 con-
fidence bounds at every pixel location. Both heatmaps are volution to produce dense probability maps at four different
set to 1 at any point annotation and their values decline scales for the input PXR image. The output probability maps
toward 0 at points further away. However, the lower con- can be interpreted as the confidence of presence of fractures
fidence bound reduces rapidly as the distance to the point at the corresponding locations in the PXR.
increases, whereas the upper bound reduces more gradually. FPNs have been widely adopted in object detection to
We construct both heatmaps using the sigmoid of the dis- cope with the variance in object scales using multiple pyra-
tance to the annotation points: mid levels of feature maps with respect to different spatial
resolutions. With bounding box annotations, objects are as-
r` − Dijk signed to different pyramid levels according to their size. For
`(i, j) = max σ( ), (1) fracture detection in PXR with point-based annotations, the
k τ size of the fracture is inherently ambiguous (from perspec-
k
ru − Dij tives of both the complexity of the fractures and the form of
u(i, j) = max σ( ), (2)
k τ annotation). Therefore, we assign every fracture annotation
where σ is the sigmoid function, Dij k
denotes the distance point to all FPN pyramid levels to encourage the network to
recognize the fractures at different spatial resolutions. Dur-
from pixel (i, j) to the k-th annotation point, and τ controls
ing training, losses are calculated on all pyramid levels. Dur-
the softness of the confidence decline. Here the rate of the
ing inference, the probability maps from the four levels are
confidence bound decline is controlled by ru and r` for the
ensembled and merged by averaging. The total training loss
upper and lower bounds, respectively. Importantly, ru > r` .
is the sum of the Window Loss on the four-level FPN out-
Example profiles of the two confidence bounds are shown in
puts, written as:
Fig. 2b. Regions above the upper bound or below the lower
bound are disallowed regions, whereas regions between the X
two bounds are allowed ranges. L= E W L Pk (i, j), `k (i, j), uk (i, j) , (6)
i,j
The Window Loss aims to discourage confidence predic- k=1,2,3,4
tions in any of the disallowed regions, while allowing any where Pk is the probability map output at the k-th pyramid
prediction within the allowed range. Dropping the pixel in- level, `k and uk are the confidence bounds resized to the
dexing for simplicity, we formulate the Window Loss as spatial resolution of Pk .
D(p, `) if p ≤ `, Implementation Details
W L(p, `, u) = 0 if ` < p ≤ u , (3) We trained our model on a workstation with a single In-
D(p, u) if p > u tel Xeon E5-2650 v4 CPU @ 2.2 GHz, 128 GB RAM, 4
where D(·, ·) is a chosen divergence measure. Formulated NVIDIA Quadro RTX 8000 GPUs. All methods are imple-
this way, the Window Loss encouraged predictions violating mented in Python 3.7, and PyTorch v1.4. We use the Im-
the upper bound (resp., lower) to be lower (resp., higher), ageNet pre-trained weights to initialize the backbone net-
while not penalizing any predictions falling within the al- work. The Adam optimizer with a learning rate of 4e − 5,
lowed regions. In term of divergence measures, we eval- a weight decay of 0.001 and a batch size of 48 is used to
uate two options: mean squared error (MSE) and Kull- train the model for 100 epochs. All images are padded to
back–Leibler divergence (KLD), written as square and resized to 1024 × 1024 for network training and
inference. We randomly perform rotation, horizontal flip-
ping, intensity and contrast jittering to augment the training
DM SE (x, y) = kx − yk2 , (4) data. The supervision bounds are generated using parame-
y 1−y ters r` = 50, ru = 200 and τ = 2. The trained model is
DKLD (x, y) = y log( ) + (1 − y) log( ). (5)
x 1−x evaluated on the validation set after every training epoch,
Examples of the Window Loss using MSE and KLD are and the one with the highest validation AUROC is selected
shown in Fig. 2c. The Window Loss can garner signifi- as the best model for inference.
cant improvements in performance where ambiguities are
unavoidable. Its simple formulation allows it to be easily 4 Experiments
plugged into any existing deep learning framework. Dataset: We retrieved 4410 PXR images of unique patients
that were recorded from 2008 to 2016 in the trauma reg-
Network Architecture istry of anonymous hospital. Trauma-related findings are
The radiographic appearances of pelvic fractures can vary identified by a board consisting of a radiologist, a trauma
considerably in both scale and shape. To represent the patho- surgeon, and an orthopedic surgeon who had fifteen years,
logical patterns at different scales, we employ a ResNet-50 seven years, and three years of experience, respectively. The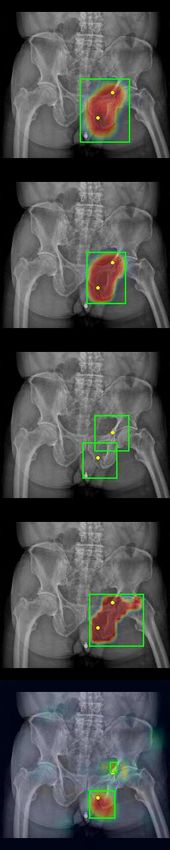
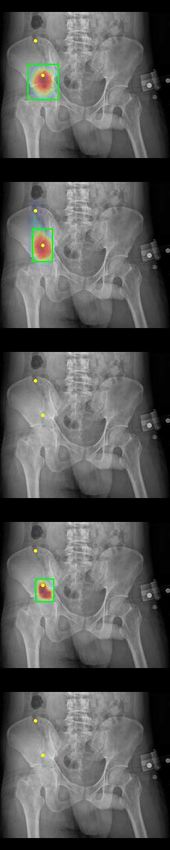
Figure 3: Visualization of fracture localization results. The proposed methods, WL-MSE and WL-KLD, achieve higher
localization performances than the previous state-of-the-art methods. The localization performance of WL-MSE is qualitatively
better than that of WL-KLD, which is in line with the FROC metrics.

best available information was provided, including the orig-     ating characteristic (FROC) curve. To quantify FROC, we
inal images, radiologist reports, clinical diagnoses, surgical   calculate an FROC score as the average recall at five false
reports, and advanced imaging modality findings, if avail-       positive (FP) rates: (0.1, 0.2, 0.3, 0.4, 0.5) FPs per image.
able. A total of 2776 images with acute trauma-related radio-    We also separately report the recall at FP=0.1 (Recall@0.1),
graphic findings (1975 and 801 hip and pelvic fractures, re-     the most clinically relevant setting. Given an operating point
spectively) are identified, resulting in 4066 annotated points   of the FROC, the predicted heatmap is binarized using the
(range 0-7). All experiments are conducted using five-fold       operating point to produce a mask. Connected component
cross-validation with a 70%/10%/20% training, validation,        analysis is performed on the mask and each connected com-
and testing split, respectively.                                 ponent is regarded as one detected fracture finding. A bound-
                                                                 ing box is then generated on each connected component. An
Evaluation Metrics                                               annotation point is considered to be recalled if it is inside
Classification metric We evaluate the image-level frac-          any bounding box. To define false positives, a ground truth
ture classification performance using the receiver operat-       mask is first generated with disks of radius 50 centered on
ing characteristic (ROC) curve and the widely used AU-           the annotation points, which indicates areas that are certainly
ROC classification metric. For methods predicting probabil-      affected by the anomalies. A bounding box is considered as
ity map (e.g., the proposed method), the maximum response        false positive if its intersection with the mask is less than
of the probability map is taken as the image-level classifica-   10% of its own region.
tion score. For object detection methods predicting bound-
ing box, the maximum classification score of all predicted       Comparison with baseline methods
boxes is taken as the image-level classification score.
Localization metric We evaluate the fracture localization        Image classification methods We evaluate three state-of-
performance of different methods using free-response oper-       the-art X-ray CAD methods based on image classification,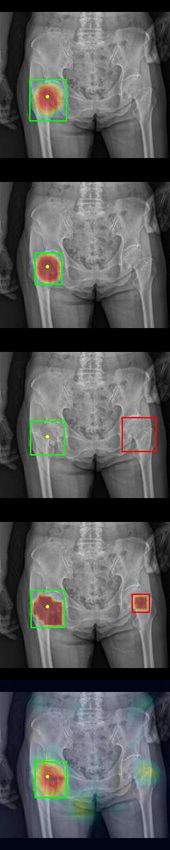
1.000                                                                                0.92

         0.975                                                                                0.90

         0.950
                                                                                              0.88
         0.925
                                                                                              0.86
Recall

                                                 WL-KLD [ AUROC: 0.983]

                                                                                     Recall
         0.900
                                                 WL-MSE [ AUROC: 0.979]
                                                 WSPL [ AUROC: 0.974]                         0.84
         0.875
                                                 UFDet [ AUROC: 0.972]                                                            WL-MSE [ FROC score: 89.9%]
                                                 CheXNet [ AUROC: 0.971]                      0.82                                WL-KLD [ FROC score: 89.6%]
         0.850
                                                 Ret inaNet [ AUROC: 0.969]                                                       Ret inaNet [ FROC score: 88.1%]
         0.825                                   Fast erRCNN [ AUROC: 0.961]                  0.80                                Fast er-RCNN [ FROC score: 86.3%]
                                                 FCOS [ AUROC: 0.961]                                                             FCOS [ FROC score: 85.9%]
         0.800                                                                                0.78
              0.0         0.2       0.4            0.6         0.8             1.0               0.05   0.10   0.15    0.20   0.25     0.30    0.35   0.40   0.45   0.50
                                   False posit ive rat e                                                                False posit ive per im age

Figure 4: Comparison of receiver operating characteristic                            Figure 5: Comparison of free-response receiver operating
(ROC) curves (Recall scaled from 0.8 to 1.0).                                        characteristic (FROC) curves.

CheXNet (Rajpurkar et al. 2017), WSPL1 (Wang et al. 2017)                            achieves even stronger localization performance than WL-
and UFDet2 (Wang et al. 2019). CheXNet trains a classi-                              KLD, reporting a Recall@0.1 of 87.4% and a FROC score
fication network with a GAP layer on the last feature map                            of 89.9%. The AUROC of WL-MSE is lower than WL-KLD
followed by a fully connected layer. WSPL replaces the                               (97.9% vs. 98.3%), but it still outperforms all baseline meth-
GAP with a LSE pooling. UFDet estimates a dense proba-                               ods by more than a 0.5%-1.8% margin.
bility map and use LSE pooling to produce the classification                            An interesting observation is that although image classifi-
score. We evaluate the stage-1 of UFDet for a fair compar-                           cation methods do not use localization supervisory signals,
ison with CheXNet, WSPL and our method, which are all                                they achieve superior classification performances comparing
single-stage methods. Anomaly localization map is gener-                             to object detection methods trained using localization super-
ated using CAM (Zhou et al. 2016) for CheXNet and WSPL,                              vision signals. In particular, the highest AUROCs achieved
and the produced probability map for UFDet. The localiza-                            by image classification methods and object detection meth-
tion map is converted to bounding box for FROC evaluation                            ods are 0.974 and 0.969, respectively, measuring a gap of
using the same steps described above. ResNet-50 is used as                           0.005. This suggests that algorithms designed specifically
the backbone network for all image classification methods.                           for detecting objects may not be optimal for recognizing the
Object detection methods We evaluate three state-of-the-                             image-level existence of the object. On the other hand, im-
art object detection methods including two popular anchor-                           age classification methods in general result in poor local-
based detectors, Faster-RCNN (Ren et al. 2015) and Reti-                             ization performance, with FROC scores between 54.9% and
naNet (Lin et al. 2017b), and the latest anchor-less detector,                       75.4%, while all three object detection methods report sub-
FCOS (Tian et al. 2019). All compared methods use ResNet-                            stantially higher FROC scores between 85.9% and 88.1%.
50 with FPN as the backbone network. Since the actual scale                          The high AUROC and low FROC score indicate that without
of the fracture is unknown from the point-based annotation,                          localization supervision signals, the attention mechanism
a bounding box with a heuristically chosen size of 200×200                           of image classification methods can activate wrong regions
is placed on each annotation point. We empirically verified                          even when the image-level classification is correct. This is
that the size of the bounding box is appropriate for the ma-
jority of fractures observed in PXRs.
                                                                                     Table 1: Fracture classification and localization results.
Result analysis Table 1 summarizes the results of image                              Our method achieves the top performance, outperforming all
classification, object detection and the proposed methods.                           baseline methods by significant margins.
The proposed methods using both MSE and KLD as the
divergence metric outperform both image classification and                                    Method                  AUROC           Recall             FROC
object detection methods on both the classification (i.e., AU-                                                                       @FP=0.1             Score
ROC) and localization (i.e., Recall@0.1 and FROC score)
metrics by large margins. Specifically, WL-KLD achieves                                       CheXNet                 0.971            28.9%             54.9%
an AUROC of 0.983, outperforming the closest competitor,                                      WSPL                    0.974            56.0%             68.5%
WSPL (0.974), by a health gap of 0.009. On Recall@0.1 and                                     UFDet                   0.972            64.9%             75.4%
FROC score, WL-KLD leads the strongest baseline method,                                       Faster-RCNN             0.961            82.5%             86.3%
RetinaNet, by significant margins, i.e., 2.8% (85.4% vs.                                      RetinaNet               0.969            82.6%             88.1%
82.6%) and 1.5% (89.6% vs. 88.1%), respectively. WL-MSE                                       FCOS                    0.961            80.3%             85.9%
         1
             Weakly-Supervised Pathology Localization                                         WL-MSE                  0.979           87.4%              89.9%
         2
             Universal Fracture Detection                                                     WL-KLD                  0.983           85.4%              89.6%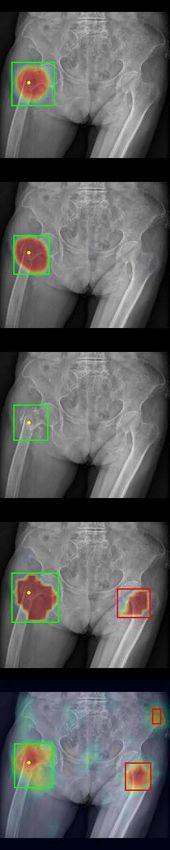
Table 2: Ablation study on the Window Loss with MSE.              Table 3: Ablation study on the Window Loss with KLD.

  τ     r`     ru     AUROC Recall@0.1 FROC Score                   τ     r`     ru    AUROC Recall@0.1 FROC Score
  2      50    200     0.979       87.4%          89.9%             2    50     200     0.983       85.4%          89.6%
  2     100    200     0.978       83.4%          86.4%             2    100    200     0.984       81.2%          85.4%
  2     150    200     0.979       80.5%          82.0%             2    150    200     0.984       82.8%          82.8%
 0.4    50     200     0.978       86.7%          89.3%            0.4    50    200     0.982       85.5%          89.7%
  2     50     200     0.979       87.4%          89.9%             2     50    200     0.983       85.4%          89.6%
  5     50     200     0.979       87.4%          88.2%             5     50    200     0.984       82.0%          86.6%
 10     50     200     0.982       69.6%          84.3%            10     50    200     0.986       69.2%          80.6%
  0     50     50      0.976       81.8%          86.1%             0     50     50     0.980       78.3%          85.4%
  2     50     50      0.975       83.9%          87.2%             2     50     50     0.981       83.0%          87.3%

also evidenced by the examples shown in Fig. 3.
                                                                  the lower disallowed region. The results show that the classi-
   While there is a trade-off between classification and local-
                                                                  fication performance remains very stable when r` increases,
ization performances using image classification and object
                                                                  i.e., the difference among the AUROC score is within 0.1.
detection methods, our method can simultaneously achieve
                                                                  However, the localization performance degrades noticeably
improved performance in both aspects comparing to meth-
                                                                  as the r increases, with the FROC score dropped by 7.9%
ods in both categories. Depending on whether MSE or KLD
                                                                  (resp., 6.8%) using MSE (resp., KLD). We posit that because
is used as the divergence measure in the Window Loss, our
                                                                  the larger positive region of a higher r` contains more nor-
method behaves slightly differently in classification and lo-
                                                                  mal areas, training the model to produce positive response
calization, i.e., KLD results in a slightly higher AUROC
                                                                  in these regions can lower its localization accuracy. On the
(98.3% vs. 97.9%), while MSE results in a slight higher
                                                                  other hand, the results show that with a smaller τ = 0.4,
FROC score (89.9% vs. 89.6%).
                                                                  the classification performance remains almost the same as
Ablation experiments                                              the τ = 2 using both MSE and KLD, while the localization
                                                                  performance dropped slightly (0.7% in the FROC score) us-
We conduct ablation experiments to analyze the effects of         ing MSE. When a larger τ = 5 is used, the localization
the parameters of the Window Loss. We evaluate our method         performance starts to degrade noticeably, i.e., FROC score
with varying parameters r` , ru and τ using both MSE and          from 89.9% to 88.2% (resp., from 89.6% to 86.6%) using
KLD as the divergence measure. The results are recorded in        MSE (resp., KLD). As τ further increases to 10, the local-
Table 2 (using MSE) and Table 3 (using KLD).                      ization performance degrades significantly, i.e., Recall@0.1
   We first evaluate two degenerate setting [r` , ru = 50, τ =    from 87.4% to 69.6% (resp., from 82.0% to 69.2%) using
0] and [r` , ru = 50, τ = 2]. In the first setting, the super-    MSE (resp., KLD). This is because the overly smoothed su-
vision bounds degenerate to a binary mask with disks of ra-       pervision bounds have high tolerance of false activations in
dius 50, and the Window Losses using MSE and KLD diver-           normal areas, preventing the training loss to provide suffi-
gence measures degenerate to MSE and binary cross entropy         cient guidance for localization.
(BCE), respectively. In the seconding setting, the supervi-
sion signal degenerate to a soft mask, similar to the Gaus-
sian ground truth map widely used in key point localization                            5   Conclusion
methods (Wei et al. 2016). As shown in Table 2, both settings
result in lower classification and localization performances      In this paper, we demonstrate that anomalies or pathologies
comparing to our default setting [r` = 50, ru = 200, τ = 2].      in X-ray imaging can have complex appearance and anatom-
It demonstrates the effectiveness of the proposed supervi-        ical nature, which makes the bounding annotation unreli-
sion bounds and the Window Loss. It is also worth noting          able. We present a disease detection method with a novel
that the degenerate setting, especially using KLD, still per-     Window Loss that utilizes more flexible and efficient point-
forms competitively comparing to image classification and         based annotations (capable of capturing anomaly findings
object detection methods, measuring an AUROC score of             in a nonparametric manner by point sampling). We validate
0.980 and a FROC score of 85.4%. It indicates the merit of        the merit of our point-based annotation and Window Loss
modeling the anomaly detection task as a pixel-wise classi-       on the pelvic X-ray fracture detection task. The proposed
fication task.                                                    method achieves substantially improved performance when
   To further analyze the effects of the parameters, we evalu-    comparing to state-of-the-art image classification and object
ate our method using r` = [50, 100, 150], τ = [0.4, 2, 5, 10]     detection methods. We also justify the usage of upper/lower
and ru = 200. We use fixed ru = 200 to simplify the analy-        bounds with allowed regions via our ablation study. Future
sis since it is empirically confirmed that areas more than 200    studies should aim to employ the point-base annotation and
pixels away from any annotation points never have anomaly.        Window Loss for detecting a broader range of anomalies in
As r` increases from 50 to 150, a bigger neighborhood of the      X-ray images from different body parts, as well as extending
annotation point will have a higher lower bound, increasing       the method to new imaging modalities (e.g., CT and MRI).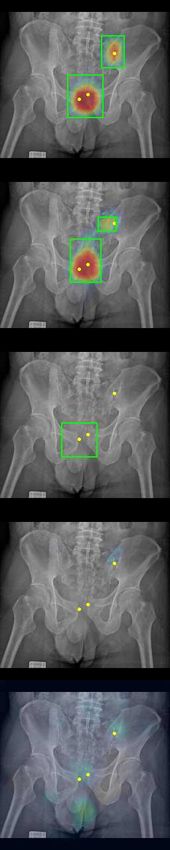
References                                of the IEEE international conference on computer vision,
Al-Masni, M. A.; Al-Antari, M. A.; Park, J.-M.; Gi, G.; Kim,      2980–2988.
T.-Y.; Rivera, P.; Valarezo, E.; Choi, M.-T.; Han, S.-M.; and     Lin, T.-Y.; Maire, M.; Belongie, S.; Hays, J.; Perona, P.; Ra-
Kim, T.-S. 2018. Simultaneous detection and classification        manan, D.; Dollár, P.; and Zitnick, C. L. 2014a. Microsoft
of breast masses in digital mammograms via a deep learn-          coco: Common objects in context. In European conference
ing YOLO-based CAD system. Computer methods and pro-              on computer vision, 740–755. Springer.
grams in biomedicine 157: 85–94.
                                                                  Lin, T.-Y.; Maire, M.; Belongie, S. J.; Hays, J.; Perona, P.;
Baltruschat, I. M.; Nickisch, H.; Grass, M.; Knopp, T.; and       Ramanan, D.; Dollár, P.; and Zitnick, C. L. 2014b. Microsoft
Saalbach, A. 2019. Comparison of deep learning approaches         COCO: Common Objects in Context. In ECCV, 5:740–755.
for multi-label chest X-ray classification. Scientific reports
                                                                  Liu, J.; Zhao, G.; Fei, Y.; Zhang, M.; Wang, Y.; and Yu,
9(1): 1–10.
                                                                  Y. 2019a. Align, attend and locate: Chest x-ray diagnosis
Cai, J.; Harrison, A. P.; Zheng, Y.; Yan, K.; Huo, Y.; Xiao,      via contrast induced attention network with limited supervi-
J.; Yang, L.; and Lu, L. 2020. Lesion Harvester: Iteratively      sion. In Proceedings of the IEEE International Conference
Mining Unlabeled Lesions and Hard-Negative Examples at            on Computer Vision, 10632–10641.
Scale. IEEE Transactions on Medical Imaging [Accepted] .
                                                                  Liu, Y.; Zhou, Z.; Zhang, S.; Luo, L.; Zhang, Q.; Zhang,
Chellam, W. 2016. Missed subtle fractures on the trauma-          F.; Li, X.; Wang, Y.; and Yu, Y. 2019b. From Unilateral
meeting digital projector. Injury 47(3): 674–676.                 to Bilateral Learning: Detecting Mammogram Masses with
Chen, H.; Wang, Y.; Zheng, K.; Li, W.; Chang, C.-T.; Harri-       Contrasted Bilateral Network. In International Conference
son, A. P.; Xiao, J.; Hager, G. D.; Lu, L.; Liao, C.-H.; et al.   on Medical Image Computing and Computer-Assisted Inter-
2020. Anatomy-aware siamese network: Exploiting seman-            vention, 477–485. Springer.
tic asymmetry for accurate pelvic fracture detection in x-ray     Papadopoulos, D.; Uijlings, J.; Keller, F.; and Ferrari, V.
images. In European Conference on Computer Vision, 239–           2017. Extreme clicking for efficient object annotation. In
255. Springer.                                                    ICCV.
Huang, G.; Liu, Z.; Van Der Maaten, L.; and Weinberger,           Pham, H. H.; Le, T. T.; Ngo, D. T.; Tran, D. Q.; and Nguyen,
K. Q. 2017. Densely connected convolutional networks. In          H. Q. 2020. Interpreting Chest X-rays via CNNs that Exploit
Proceedings of the IEEE conference on computer vision and         Hierarchical Disease Dependencies and Uncertainty Labels.
pattern recognition, 4700–4708.                                   arXiv preprint arXiv:2005.12734 .
Huang, Y.-J.; Liu, W.; Wang, X.; Fang, Q.; Wang, R.; Wang,        Rajpurkar, P.; Irvin, J.; Zhu, K.; Yang, B.; Mehta, H.; Duan,
Y.; Chen, H.; Chen, H.; Meng, D.; and Wang, L. 2020. Rec-         T.; Ding, D.; Bagul, A.; Langlotz, C.; Shpanskaya, K.;
tifying Supporting Regions with Mixed and Active Super-           et al. 2017. Chexnet: Radiologist-level pneumonia detec-
vision for Rib Fracture Recognition. IEEE Transactions on         tion on chest x-rays with deep learning. arXiv preprint
Medical Imaging .                                                 arXiv:1711.05225 .
Irvin, J.; Rajpurkar, P.; Ko, M.; Yu, Y.; Ciurea-Ilcus, S.;       Ren, S.; He, K.; Girshick, R.; and Sun, J. 2015. Faster r-cnn:
Chute, C.; Marklund, H.; Haghgoo, B.; Ball, R.; Shpan-            Towards real-time object detection with region proposal net-
skaya, K.; et al. 2019. Chexpert: A large chest radiograph        works. In Advances in neural information processing sys-
dataset with uncertainty labels and expert comparison. In         tems, 91–99.
Proceedings of the AAAI Conference on Artificial Intelli-
gence, volume 33, 590–597.                                        Sirazitdinov, I.; Kholiavchenko, M.; Mustafaev, T.; Yixuan,
                                                                  Y.; Kuleev, R.; and Ibragimov, B. 2019. Deep neural net-
Jiang, C.; Wang, S.; Liang, X.; Xu, H.; and Xiao, N. 2020.        work ensemble for pneumonia localization from a large-
ElixirNet: Relation-Aware Network Architecture Adapta-            scale chest x-ray database. Computers & Electrical Engi-
tion for Medical Lesion Detection. In AAAI, 11093–11100.          neering 78: 388–399.
Law, H.; and Deng, J. 2018. Cornernet: Detecting objects as       Tian, Z.; Shen, C.; Chen, H.; and He, T. 2019. Fcos: Fully
paired keypoints. In Proceedings of the European Confer-          convolutional one-stage object detection. In Proceedings
ence on Computer Vision (ECCV), 734–750.                          of the IEEE international conference on computer vision,
Li, Z.; Wang, C.; Han, M.; Xue, Y.; Wei, W.; Li, L.-J.; and       9627–9636.
Fei-Fei, L. 2018. Thoracic disease identification and local-      Wang, X.; Peng, Y.; Lu, L.; Lu, Z.; Bagheri, M.; and Sum-
ization with limited supervision. In Proceedings of the IEEE      mers, R. M. 2017. Chestx-ray8: Hospital-scale chest x-ray
Conference on Computer Vision and Pattern Recognition,            database and benchmarks on weakly-supervised classifica-
8290–8299.                                                        tion and localization of common thorax diseases. In IEEE
Lin, T.-Y.; Dollár, P.; Girshick, R.; He, K.; Hariharan, B.;     CVPR.
and Belongie, S. 2017a. Feature pyramid networks for ob-          Wang, Y.; Lu, L.; Cheng, C.-T.; Jin, D.; Harrison, A. P.;
ject detection. In Proceedings of the IEEE conference on          Xiao, J.; Liao, C.-H.; and Miao, S. 2019. Weakly Super-
computer vision and pattern recognition, 2117–2125.               vised Universal Fracture Detection in Pelvic X-Rays. In In-
Lin, T.-Y.; Goyal, P.; Girshick, R.; He, K.; and Dollár, P.      ternational Conference on Medical Image Computing and
2017b. Focal loss for dense object detection. In Proceedings      Computer-Assisted Intervention, 459–467. Springer.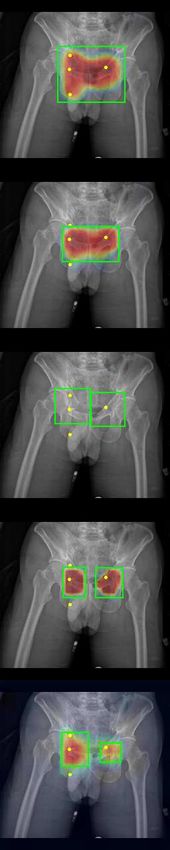
Wei, S.-E.; Ramakrishna, V.; Kanade, T.; and Sheikh, Y.
2016. Convolutional pose machines. In Proceedings of the
IEEE conference on Computer Vision and Pattern Recogni-
tion, 4724–4732.
Yahalomi, E.; Chernofsky, M.; and Werman, M. 2019.
Detection of distal radius fractures trained by a small
set of X-ray images and Faster R-CNN.         In Intelli-
gent Computing-Proceedings of the Computing Conference,
971–981. Springer.
Yan, C.; Yao, J.; Li, R.; Xu, Z.; and Huang, J. 2018a. Weakly
supervised deep learning for thoracic disease classification
and localization on chest x-rays. In Proceedings of the 2018
ACM International Conference on Bioinformatics, Compu-
tational Biology, and Health Informatics, 103–110.
Yan, K.; Cai, J.; Harrison, A. P.; Jin, D.; Xiao, J.; and Lu,
L. 2020. Universal Lesion Detection by Learning from
Multiple Heterogeneously Labeled Datasets. arXiv preprint
arXiv:2005.13753 .
Yan, K.; Tang, Y.; Peng, Y.; Sandfort, V.; Bagheri, M.; Lu,
Z.; and Summers, R. M. 2019. Mulan: Multitask universal
lesion analysis network for joint lesion detection, tagging,
and segmentation. In International Conference on Medi-
cal Image Computing and Computer-Assisted Intervention,
194–202. Springer.
Yan, K.; Wang, X.; Lu, L.; and Summers, R. M. 2018b.
DeepLesion: automated mining of large-scale lesion anno-
tations and universal lesion detection with deep learning. J.
Med Imaging 5(3).
Yao, L.; Prosky, J.; Poblenz, E.; Covington, B.; and Ly-
man, K. 2018. Weakly supervised medical diagnosis
and localization from multiple resolutions. arXiv preprint
arXiv:1803.07703 .
Zhao, S.; Wu, X.; Chen, B.; and Li, S. 2019. Automatic Ver-
tebrae Recognition from Arbitrary Spine MRI Images by a
Hierarchical Self-calibration Detection Framework. In In-
ternational Conference on Medical Image Computing and
Computer-Assisted Intervention, 316–325. Springer.
Zhou, B.; Khosla, A.; Lapedriza, A.; Oliva, A.; and Torralba,
A. 2016. Learning deep features for discriminative localiza-
tion. In Proceedings of the IEEE conference on computer
vision and pattern recognition, 2921–2929.
You can also read


