Point-in-Time Count Report - Calgary Homeless Foundation
←
→
Page content transcription
If your browser does not render page correctly, please read the page content below

Point-in-Time
Count Report    Fall 2016
Calgary Point-in-Time Count Report | Fall 2016

                Prepared by:

Rachel Campbell, Nick Falvo and Madison Smith

                                                                        2
Table of Contents
Executive Summary ....................................................................................................................................... 4
Background ....................................................................................................................................................... 5
Methods .............................................................................................................................................................. 6
Findings .............................................................................................................................................................. 7
    2014 vs. 2016: Year-to-year comparisons ........................................................................................  8
    Ethnicity ......................................................................................................................................................  11
    Indigenous Peoples .................................................................................................................................  12
    Ethnicity + Age distribution ................................................................................................................   13
    Youth ...........................................................................................................................................................   14
    Seniors and Children .............................................................................................................................   15
    Women ........................................................................................................................................................   16
    Sources of Income ...................................................................................................................................  17
    In-migration ..............................................................................................................................................   18
Conclusion ........................................................................................................................................................ 19
References ...................................................................................................................................................... 20
Appendices ...................................................................................................................................................... 21
    Appendix A – Detailed 2016 Count Methodology......................................................................... 21
    Appendix B – List of Facilities and Classifications ....................................................................... 27
    Appendix C – Data Collection Forms .............................................................................................   29
    Appendix D – Data Tables ..................................................................................................................   36
Thank you and Acknowledgements ...................................................................................................   39

                                                                                                                                                                   3
Calgary Point-in-Time Count Report | Fall 2016

Executive Summary
The Calgary Homeless Foundation, in conjunction with over one hundred volunteers and
countless community partners, successfully conducted its biennial Point-in-Time Count on
October 19, 2016. 3,430 people were counted as experiencing homelessness. This represents
approximately 1 in every 406 Calgarians. As promised in the preliminary report released in
November, the present report includes data that was not included in the preliminary report;
this includes data collected from Alberta Health Services and from persons unable or unwilling
to complete a survey, but still believed to be without a home. This data was not collected
across the province and therefore was not included in the provincially-coordinated
preliminary release.

                         Homelessness per Capita in Calgary
    0.0035

     0.003

    0.0025

     0.002

    0.0015

     0.001

    0.0005

            0
                   1992      1994     1996     1998 2000 2002 2004 2006 2008                            2011     2012     2013     2014     2016

Calgary has seen not only a curbing of the steep rise in homelessness through the 1990s and
early 2000s, but a reduction from the peak in 2008. This coincides with the creation of the
Calgary Homeless Foundation and the release of Calgary’s 10-Year Plan to End Homelessness.
In 2008, 1 in every 330 Calgarians experienced homelessness on a given night. Comparing this
to data from the 2016 count, we have seen a 19%1 reduction in homelessness per capita.

Indigenous peoples continue to be overrepresented among this population, while women
continue to be underrepresented.

The seniors population has grown since the 2014 count.

1   A 26% reduction was reported in Calgary’s preliminary results and the provincial PiT Count report. This reflects the difference in totals between the
    provincially-aligned methodology reported in those documents and Calgary’s methodology reported here.

                                                                                                                                                   4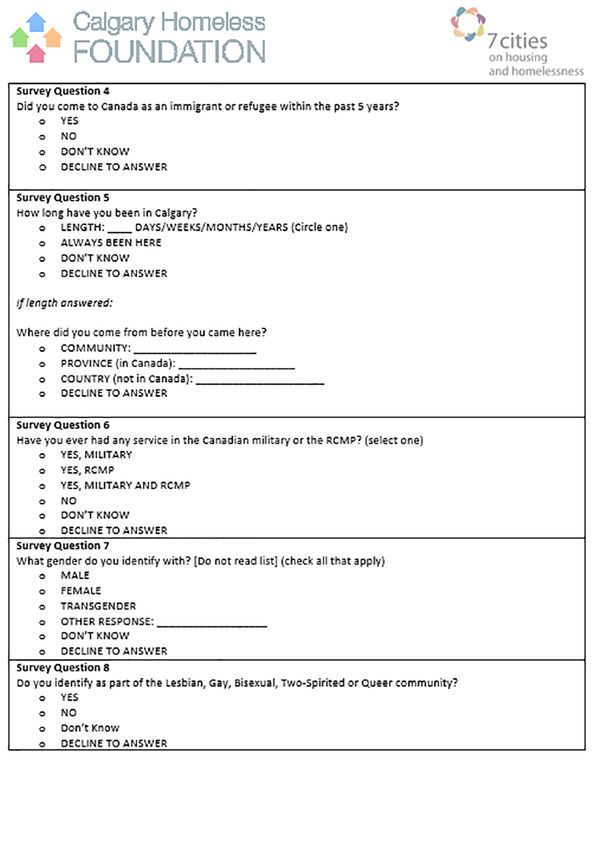
Background
For more than a decade, communities in                                     count is conducted, the time of day the count
Canada have been conducting counts of their                                happens, the people that are included as
homeless populations; these are generally                                  ‘homeless,’ and the questions that are asked in
referred to as Point-in-Time (PiT) Counts.  The first                      the survey” (ESDC, 2016). Another factor that
Count in Calgary was conducted in 1992.                                    can skew the results is the weather on the night
                                                                           of the count. Weather in Calgary, more so than
There are several reasons to conduct PiT Counts.                           weather in most Canadian cities, is prone to wild
First, unlike data on homeless people kept on                              fluctuations, so one cannot depend on consistency
a day-to-day basis by social workers and other                             from year to year even when conducted at the
front-line professionals, data gathered from PiT                           same time each year.
Counts captures information on rough sleepers                              (Jadidzadeh & Kneebone, 2015)
(i.e. persons sleeping outside on the night of the
count)—a group about whom not much data                                    In 2016, there was a national effort to coordinate
is usually collected.  PiT Counts therefore offer                          PiT Counts across Canada.2 However, Canada’s
a rare glimpse into the demographic profiles                               most populous cities (including Calgary) chose not
of an underserved subpopulation of persons                                 to participate in this nationally-coordinated effort.
experiencing homelessness. Second, PiT Counts                              One reason some cities chose not to participate
typically try to uncover demographic information                           was that the time of year chosen was not ideal
about recently-homeless persons now residing                               for them; many communities prefer to do PiT
at large institutions, such as correctional facilities                     Counts in either fall or spring because winter
and hospitals. A third strength of PiT Counts                              temperatures can prove to be too extreme. Also,
is that they can raise public awareness about                              some communities, having recently conducted
homelessness—indeed, PiT Counts tend to                                    counts of their own, did not wish to mobilize
encourage ‘community building.’ In Calgary,                                volunteers again so quickly. Cities choosing not
groups participating in the PiT Count often feel                           to participate in the recent national effort, in
better-connected and empowered when they join                              addition to Calgary, included: Toronto, Montreal,
together every two years to undertake the count.                           Vancouver, Edmonton, Ottawa and Winnipeg.
Lastly, Calgary’s PiT Count attempts to gather data
from all programs serving homeless persons,                                In Alberta, the 7 Cities on Housing and
regardless of how or by whom they are funded, in                           Homelessness (7 Cities) – a collaboration of the
order to create a snapshot of the whole picture.                           lead organizations in ending homelessness from
This breadth of data is not collected by a single                          Alberta’s seven major cities, including the Calgary
organization at any other time.                                            Homeless Foundation - decided to participate
                                                                           in a provincially-coordinated PiT Count for the
PiT Counts also have shortcomings. For example,                            second time—once again marking the only
each community adapts PiT methodology to their                             provincially-coordinated PiT Count effort in
own community, and that methodology often                                  Canada. Coordinating across the province allows
changes from year to year. According to a guide                            for comparability across cities which are subject
prepared by Employment and Social Development                              to similar taxation and benefit systems, cycles of
Canada: “Differences include the time of year the                          economic boom and bust, and other factors.

2   The report with findings from the 2016 national effort were released by ESDC in January 2017.

                                                                                                                             5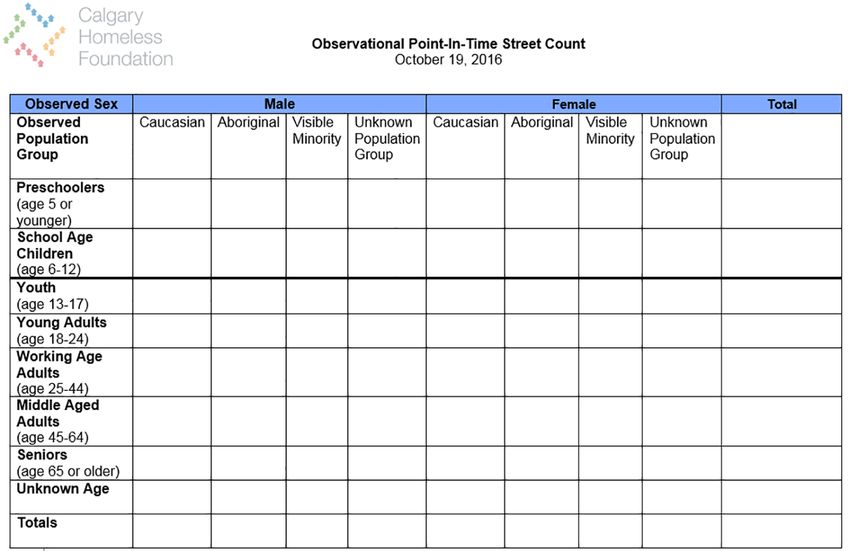
Calgary Point-in-Time Count Report | Fall 2016

Methods
The Calgary PiT Count utilizes several different    experiencing homelessness in Calgary. Many
approaches in an attempt to most fully              of these individuals are in shelter or short-
enumerate our city’s population experiencing        term supportive housing programs that do
homelessness.  Efforts were made in 2016 to         not receive funding through the Calgary
align with the methodology of past Calgary          Homeless Foundation.
counts to enable year-to-year comparisons.
Efforts were also made to align, where              For more detailed methodology, see
possible, with the 7 Cities in order to increase    Appendix A.
comparability across the province. Aiming for
both consistency and change, by definition,         Several sources of data were utilized in the
presents challenges.                                2016 Count:

The 2016 Calgary PiT Count attempted to               1.    Administrative data – this data was
enumerate homeless persons who, on the                      collected from emergency shelters,
night of the count, spent the night in an                   short-term supportive housing
emergency shelter, short-term supportive                    programs (transitional housing), and
housing facility, outdoors, or in another                   municipal correctional facilities. Data
public space.                                               collected includes age, gender,
                                                            and ethnicity.
In order to capture as fulsome a snapshot of          2.    Systems data – this data was collected
Calgary’s homeless population as possible,                  from Alberta Health Services facilities
two approaches were used. One was the                       (inpatient and emergency departments
collection of basic demographics for those                  of all 5 Calgary hospitals, urgent
who spent the night in shelter facilities, short-           care centres, and addiction recovery
term supportive housing facilities (transitional            centres) and provincial
housing), and public service agencies                       correctional facilities.
(collectively, the ‘sheltered homeless’). The
other was a street count and brief survey             3.    Survey data – surveys were
aimed at capturing the numbers and basic                    used by volunteers, outreach
demographics of homeless persons who were                   workers, and Calgary Police and
sleeping outdoors on downtown streets, in                   Community Standards officers to
residential and commercial areas, in parks,                 gather information from individuals
on river pathways, and in more remote                       encountered outside on the day and
natural areas (the ‘unsheltered homeless’).                 night of the count. Surveys were also
Most PiT Count efforts (including Calgary’s)                administered to a sample of clients
do not claim that their ‘street counts’ are                 in shelters and transitional housing
statistically representative of their rough-                programs on the evening of the count.
sleeper population. In other words, if 25% of         4.    Observational tally data –
those enumerated in the ‘street count’ are                  observational data was collected
female, the reader should not infer from this               by volunteers and various workers
that 25% of all rough sleepers in that city are             (Calgary Transit, Provincial Parks,
necessarily also female.                                    security at Stampede grounds and
                                                            university and college campuses, CP
Numbers were collected from all sources                     Rail). Volunteers used this method
within a 24-hour time period to reduce                      when individuals were unwilling or
potential duplication.                                      unable to complete a survey, but were
                                                            believed to be homeless. Workers used
It is also important to note that the Count                 this method because of
attempted to include all individuals                        time constraints.

                                                                                                    6
Findings
All data cited in this report includes a characteristics were only included once (from
combination of all available data. Over 200 one data source).
clients who completed surveys were also
accounted for in administrative data collected Using very similar methodology to Calgary’s
by staff working in shelters or transitional 2014 PiT Count, 3,430 people were counted
housing. In these cases, administrative data as experiencing homelessness in Calgary
for an individual is used for all available data on the night of October 19, 2016. Basic
points and supersedes the data collected demographics of this group are found below.
on that individual via survey. Each client’s
The Basics: Age, Gender, Ethnicity, Location
Age Gender
1,600 0% 0%
1,400
25%
1,200
1,000 Male
800 Female
Transgender
600
Unknown
400
200
75%
-
0 to 5 6 to 12 13 to 17 18 to 24 25 to 44 45 to 64 65+ Unknown
Ethnicity Where?
5% 6%
8%
16%
Caucasian Emergency Shelter
44%
Indigenous Transitional Housing
Other Systems
59% Unknown Unsheltered
20%
42%
* Options for ethnicity available on the 2016 PiT Count data collection tool were chosen in order to
preserve consistency with past Calgary counts.
7Calgary Point-in-Time Count Report | Fall 2016
2014 vs. 2016: Year-to-year comparisons
Notwithstanding methodological challenges discussed above, PiT Counts allow local officials
to track changes in the homeless population over time. Below are a few comparisons of data
from the two most recent counts.
Age
1600
1400
1200
1000
800
600
400
200
0
0 to 5 6 to 12 13 to 17 18 to 24 25 to 44 45 to 64 65+ Unknown
2014 2016
As seen in the chart above, age changes from of Calgary’s homeless population, where the
2014 to 2016 appear to be rather modest. proportion of persons aged 45-64 saw an
The proportion of individuals aged 25-44 increase of almost 7%, and the proportion of
saw the biggest change from count-to-count, persons aged 65 and over increased by
decreasing by nearly 13% between 2014 and nearly 16%.
2016. There also appears to be a slight aging
8As seen in the chart below, the proportion of clients in shelter decreased, while the proportion
of those in transitional housing increased. The decrease in emergency shelter use is
consistent with the overall trend of the 2016 PiT Count, which showed a modest decrease from
2014. The increase in transitional housing use is likely a result of an increase in the number of
transitional housing beds provided and funded by service providers, rather than a change
in demand.
Where
2000
1800
1600
1400
1200
1000
800
600
400
200
0
Emergency Sheltered Transitional Housing Systems (Health and Unsheltered
justice)
2014 2016
In addition, the scope of the PiT Count was this can be explained by refugees who are
widened to include some immigrant-serving currently housed in what is categorized as
transitional housing that was not included transitional housing for the homeless. Though
in the 2014 Count. The proportion of those members of this group are not what we might
in transitional housing whose ethnicity normally define as “homeless”, they were
was categorized as “Other”—meaning non- counted as part of the 2016 Count because
Caucasian and non-Indigenous—is notably they are technically in Calgary’s homeless-
high. (see p.11 for detailed chart) We do not serving system of care.
have precise numbers, but at least some of
9Calgary Point-in-Time Count Report | Fall 2016
Ethnicity
2,500
2,000
1,500
1,000
500
-
Caucasian Indigenous Other Unknown
2014 2016
Representation of the different ethnicities from Alberta Health Services (AHS), who
remained relatively constant from count to do not collect ethnicity information in this
count. The category “Other” refers to clients particular data set. An additional one-fifth of
whose ethnicity is known, and is neither these are due to the ethnicity data collected
Caucasian nor Indigenous. The category with the survey. Only Indigenous options
“Unknown” refers to clients whose ethnicity were given, meaning that anyone who did not
is not known. More than a third of the 161 identify as Indigenous fell into the
clients with unknown ethnicity in the 2016 “Unknown” category.
Count can be attributed to data collected
10Ethnicity
Where, by ethnicity
60%
50%
40%
30%
20%
10%
0%
Shelter Transitional Systems Rough
Caucasian Indigenous Other Unknown
Here we take a look at the distribution of provided “Indigenous” and “non-indigenous”
each ethnic group according to where they options for ethnicity. Therefore, every non-
spent the night (keeping in mind that ethnic Indigenous person enumerated by survey
groups for the 2016 PiT Count survey were only was categorized as “unknown” ethnicity.
selected in order to maintain consistency Additionally, some individuals included
with the 2014 PiT Count survey). The number via observational tally were of “unknown”
of individuals whose ethnicity is unknown ethnicity. As one might imagine, volunteers
was high in systems and the unsheltered and workers were careful in
population. This is due to data collection making assumptions.
methods. Within “Systems”, AHS does not
collect data on ethnicity in their registration We can also note from the chart above that
system, and so all 68 individuals enumerated Indigenous peoples are disproportionally
there are categorized as “unknown” ethnicity. represented in shelter (high) and transitional
In “Unsheltered”, the survey tool agreed housing (low). We will take another look at
upon and used across the province only this in the following section.
11Calgary Point-in-Time Count Report | Fall 2016
Indigenous Peoples
Indigenous peoples continue to be very overrepresented in the population experiencing
homelessness. While Indigenous peoples make up 3% of Calgary’s general population, they
accounted for 20% of those enumerated on the night of the count (Statistics Canada, 2016).
Indigenous Population - Where
35%
30%
25%
20%
15%
10%
5%
0%
% of Total Shelter % Transitional % Systems % Unsheltered %
Where enumerated Indigenous persons ancestry” as opposed to only 20%
spent the night is of note. They were most representation in the administrative data,
overrepresented among the population where the only option given was “Aboriginal”.
spending the night unsheltered, and most The difference could be due to selection bias
underrepresented in transitional housing. in sampling; it could also be due to the more
It is also noteworthy that 24% of survey inclusive options given in the survey than in
respondents identified as “First Nations”, the options provided when administrative
“Metis” or “Non-status or have Aboriginal data is gathered by service providers.
12Ethnicity + Age distribution
Ethnicity + Age
60.0%
50.0%
40.0%
30.0%
20.0%
10.0%
0.0%
0 to 5 6 to 12 13 to 17 18 to 24 25 to 44 45 to 64 65+ Unknown
ALL Caucasian Indigenous Other Unknown
If we dig down deeper into the age makeup total homeless population enumerated on the
of each ethic group, some interesting points night of the count,
emerge. This chart highlights the age make-
up for each ethnic group as compared to • The Indigenous child and youth population
the total homeless population. The blue bar was over represented (0-5, 6-12, and 18-
represents the entire enumerated population. 24 categories)
If all ethnicities were proportionally • The Indigenous seniors population was
represented, the other bars would be the under represented (65+ category)
same size as the blue bar. However, we can
see that is not the case. As compared to the • Caucasians in the 45-64 category were
over represented
13Calgary Point-in-Time Count Report | Fall 2016
Youth
Youth Population - Where
20%
18%
16%
14%
12%
10%
8%
6%
4%
2%
0%
% of Total Shelter % Transitional % Systems % Unsheltered %
In Calgary’s homeless-serving sector, youth 28% of the total incarcerated population from
are defined as 13 to 24 years old. Youth were Calgary on the same night.
overrepresented among those experiencing
homelessness in systems. Youth accounted Youth were also overrepresented among
for more than 22% of the homeless the unsheltered population. They were
population in prisons on the night of the underrepresented in shelter.
count. However, youth accounted for nearly
14Seniors and Children
Age distribution: Calgary population vs.
Count
45.0%
40.0%
35.0%
30.0%
25.0%
20.0%
15.0%
10.0%
5.0%
0.0%
0-24 25 to 44 45 to 64 65+
Calgary Census PiT Count
To add some context to the age distribution Additionally, children were underrepresented
of those enumerated in the Count, this among the homeless population compared
chart compares that distribution with the to Calgary’s total population. This could be
distribution of Calgary’s population (according due to several factors, including the Alberta
to results of the 2016 Calgary Civic Census). Child Benefit, Universal Child Care Benefit,
The younger age categories presented in the the Canada Child Tax Benefit and the new
Civic Census differ from those in the Count, so Canada Child Benefit. In addition, previous
children and youth have been aggregated so research has demonstrated high correlation
that age categories align. More detailed data between the state of a family’s housing
can be found in Appendix D. and admission to foster care (Falvo, 2012,
p.14) – meaning that in many cases, children
Compared to Calgary’s total population, are removed from a family if that family’s
pre-seniors (45-64) were overrepresented housing is very precarious and they may
in the homeless population, while seniors be entering homelessness. Other support
(65+) were underrepresented. Seniors may services provided specifically to families
have been underrepresented due to seniors’ may prevent families from entering absolute
benefits (CPP, OAS, GIS) aiding in keeping homelessness. These include Child Protective
seniors housed (Falvo, 2016). They also may Services, family violence support services, and
have been underrepresented due to shorter the like. Lastly, this could also be correlated
life expectancy for the homeless (Hwang et al., to the vast underrepresentation of women in
2009). Individuals experiencing homelessness the homeless population. See the following
in the 45-64 age range often experience section for further explanation.
similar health problems as seniors (65+) in the
housed population (Stergiopoulos & Herrmann
2003).
15Calgary Point-in-Time Count Report | Fall 2016
Women
Consistent with previous years, up.’ They have greater motivation to avoid
women continued to be significantly rough sleeping and shelters because of the
underrepresented in the count as compared astounding rates of physical and sexual
to Calgary’s general population. This is the violence faced by women experiencing
case in spite of the fact that poverty affects homelessness. Women may choose to avoid
more women than men. There are a number shelter for fear of losing custody of their
of factors which contribute to this. Women children. Women may also choose to stay in
are more likely to be part of the hidden a problematic relationship in order to avoid
homeless population – tapping into stronger the aforementioned dangers (Berkum &
social networks to ‘couch surf’ or ‘double Oudshoorn, 2015).
Where, by gender
60%
50%
40%
30%
20%
10%
0%
Emergency Shelter Transitional Housing Systems Unsheltered
Male Female
As is seen in the chart above, a greater proportion of the female homeless population was in
transitional housing compared to the male population. Availability of gender specific beds in
transitional housing may factor into this.
Women were proportionally underrepresented in the other three categories.
16Sources of Income
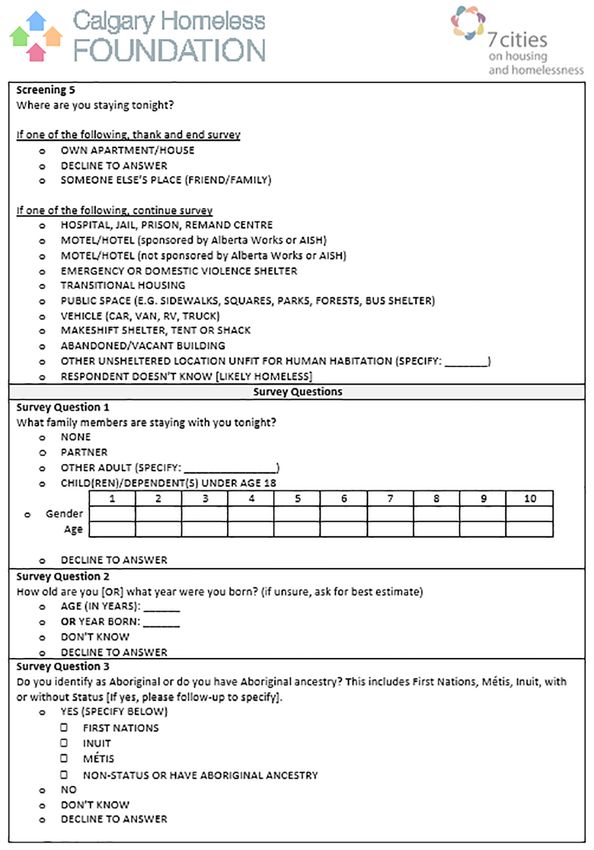
One of the questions in the 2016 PiT Count survey was: “Where do you get your money from?”
(see appendix C for full survey). This answer was collected from 286 of the 3450 individuals
enumerated as part of the count. The following chart shows the results of that question:
Sources of Income
0% 5% 10% 15% 20% 25% 30% 35%
Employment
Informal/Self-employment
Seniors Benefits
Disability Benefits
Welfare/Income Assistance
Other Source
Child and Family Tax Benefits
Employment Insurance
No income or not reported
It is interesting to note how few respondents indicated receiving these benefits. This calls
indicated receiving welfare or income for further investigation into this issue. If less
assistance. One would expect that number than 10% of Calgary’s homeless population is
to be higher than the 7% reported. Across accessing social assistance, why exactly is that
the province, 24% of PiT survey respondents the case?
17Calgary Point-in-Time Count Report | Fall 2016
In-migration
Calgary saw a negative net migration from 2015 to 2016. However, since the last count in
2014, Calgary saw a positive net migration of over 18,000 in addition to growth of over 21,000
in natural increase. Total population according to the city’s civic census in 2014 was 1,195,194
and total population in 2016 was 1,235,171 (City of Calgary, 2016). This represents an increase
of just over 3%.
According to the 2016 PiT Count, approximately 31% of survey respondents arrived from
outside of Calgary within the last 5 years: 8% from other parts of Alberta, 21% from elsewhere
in Canada, and 1% from outside of Canada. Only 12% of survey respondents reported having
always lived in Calgary.
All other things equal, negative net migration into Calgary is ‘good news’ for households
looking to rent an apartment. Indeed, when workers leave Calgary in an economic downturn,
the rental housing market ‘loosens up,’ and it becomes easier for low-income households to
find a rental unit (Kneebone et al., 2011). This was likely a factor that resulted in a lower overall
PiT Count number in 2016 compared with 2014.
18Conclusion
The 2016 Point-in-Time Count marked the second provincially coordinated Count in Alberta.
It has allowed us to once again look at the whole picture of absolute homelessness in our
city. Data gathered has allowed us to observe trends in the total growth and reduction of
homelessness in Calgary over time, as well as to explore demographic changes. We have
witnessed another reduction in homelessness, with a 4% reduction from the 2014 Count, and a
19% per capita reduction since 2008.
The information gathered in the 2016 Count will be used to make decisions around allocation
of resources, funding, and the creation of targeted programming. It will help us to better serve
Calgary’s homeless population. For example, we learned of a significant discrepancy between
the rate of those who reported receiving welfare or income assistance in Calgary as compared
to the rest of the province. This warrants further investigation.
The Calgary Homeless Foundation is committed to continuously looking for ways to improve
the completeness and accuracy of the Point-in-Time Count and will implement learnings from
2016’s count in future counts.
19Calgary Point-in-Time Count Report | Fall 2016
Reference List
City of Calgary, City Clerk’s Election and Information Services. (2016). 2016 Civic Census
Results (Rep.). Retrieved March 13, 2017, from http://www.calgary.ca/CA/city-clerks/
Documents/Election-and-information-services/Census2016/2016-Census-Results-Book.
pdf?noredirect=1
Employment and Social Development Canada. (2016). Guide to point-in-time counts in
Canada of the Homelessness Partnering Strategy. Retrieved from Employment and Social
Development Canada website:
http://www.esdc.gc.ca/eng/communities/homelessness/pit_countguide.shtml
Falvo, N. (2012). Poverty Amongst Plenty: Waiting for the Yukon Government to Adopt a
Poverty Reduction Strategy. (Toronto: The Canadian Homelessness Research Network
Press).
Falvo, N. (2016, September 01). Federal income support for seniors can help end
homelessness. Retrieved March 13, 2017, from http://calgaryhomeless.com/blog/federal-
income-support-for-seniors-can-help-end-homelessness/
Hwang, S. W., Wilkins, R., Tjepkema, M., O’campo, P. J., & Dunn, J. R. (2009). Mortality among
residents of shelters, rooming houses, and hotels in Canada: 11 year follow-up study. BMJ,
339:b4036. doi:10.1136/bmj.b4036
Jadidzadeh, A., & Kneebone, R. (2015). Shelter from the storm: Weather-induced patterns in the
use of emergency shelters. Retrieved from University of Calgary’s School of Public Policy
website: http://www.policyschool.ca/wp-content/uploads/2016/03/weather-and-homeless-
kneebone-jadidzadeh.pdf
Kneebone, R., Emery, H, & Grynishak, O. (2011, September). Homelessness in Alberta: The
Demand for Spaces in Alberta’s Homeless Shelters. SPP Research Papers, 4(13).
Statistics Canada. (2016, April 13). Calgary (CMA) - Focus on Geography Series - 2011 National
Household Survey (NHS). Retrieved March 15, 2017, from http://www12.statcan.gc.ca/nhs-
enm/2011/as-sa/fogs-spg/Pages/FOG.cfm?lang=E&level=3&GeoCode=825
Stergiopoulos, V., & Herrmann, N. (2003). Old and Homeless: A Review and Survey of Older
Adults Who Use Shelters in an Urban Setting. The Canadian Journal of Psychiatry, 48(6),
374-380. doi:10.1177/070674370304800603
Van Berkum, A., & Oudshoorn, A. (2015, April). Best Practice Guideline for Ending Women’s
Girl’s Homelessness (Rep.). Retrieved March 14, 2017, from Women’s Community House
and the Homeless Partnering Strategy website: http://londonhomeless.ca/wp-content/
uploads/2012/12/Best-Practice-Guideline-for-Ending-Womens-and-Girls-Homelessness.pdf
20Appendices
Appendix A – Detailed 2016 Count Methodology
The October 2016 Calgary Point-in-Time implemented after the Fall 2014 Count:
Count attempted to enumerate homeless
persons who, on the night of the count, spent • Reduce the length of survey questionnaire
the night in an emergency shelter, short-term for rough sleepers
supportive housing facility, outdoors, or in • Collapse several downtown street ‘zones’,
another public space. while increasing external zones
In order to capture as full a snapshot of • Condense hours of street count from
Calgary’s homeless population as possible, three to two, commencing at 10 pm and
two methods of enumeration were exercised. ending at 12 am. This new time frame also
One was the collection of basic demographics aligns with Homeward Trust Edmonton,
for those who spent the night in shelter the City of Grand Prairie, the City of
facilities, short-term supportive housing Lethbridge, Medicine Hat Community
facilities (transitional), and public service Housing Society, City of Red Deer, and the
agencies (collectively, sheltered homeless), Regional Municipality of Wood Buffalo
and the other was a street count and brief (7 Cities).
survey aimed at capturing the numbers and • Continue utilizing Calgary Community
basic demographics of homeless persons who Standards Peace Officers, Calgary Police
were sleeping outdoors on downtown streets, Service Vulnerable Persons Team (PACT),
in residential and commercial areas, in parks, and agency outreach groups to cover
on river pathways, and in more remote certain areas during the day of the count
natural areas (collectively, unsheltered that may be diffcult or dangerous to cover
homeless). Numbers were collected from at night. Conduct surveys with persons
all sources within a 24 hour time period to found at their camps, and make note of
reduce potential duplication. vacant camps to revisit during the hours
of the count.
Prior to the 2016 Count, CHF consulted with
staff from member organizations of Alberta’s After consulting with community groups,
7 Cities on Housing and Homelessness; 27 emergency shelter and short term
national experts; Calgary’s Homeless-Serving supportive housing providers were found to
System of Care; Calgary Police Service; be operating 56 different facilities. Further,
Community Standards Services(CSS); and five public service agencies were found to
outreach team staff. The consultation process be operating 11 different facilities which
helped solidify: the date and time of the included the Calgary Remand Centre, Alberta
Count; the questions that would be asked Health Services Acute Care Facilities, Renfrew
of facility-operators and rough sleepers; the Recovery Detoxification Centre, Calgary
mapping of ‘zones’ in Calgary where people Police Service Court Selection (Arrest and
experiencing homelessness were known Processing), the Calgary Young Offenders
to sleep; the classification of facilities as Centre, and Alberta Works Income Support –
emergency shelter, Short Term Supportive Contact centre and service delivery offices.
Housing (STSH), and permanent supportive
housing; and the formation of street teams.
The following recommendations were
21Calgary Point-in-Time Count Report | Fall 2016
In addition, officials at Calgary Transit, Calgary There was a focus to include individuals
Parking Authority, Fish Creek Park Wardens, with lived experience in facilitating the
Stampede Grounds Security, Campus security count, through consultation with the Client
for Southern Alberta Institute of Technology Action Committee at the Calgary Homeless
(SAIT Polytechnic), Mount Royal University, the Foundation.
University of Calgary, and Canadian Pacific
Railway, all agreed to provide staff on the In Canadian cities, Indigenous peoples
night of the Count in order to canvass areas are eight times more likely to experience
under their supervision. homelessness than the rest of the general
population (Social Planning & Research Council
In total, more than 70 organizations of Hamilton, 2015). Given that Indigenous
contributed data. Peoples are both overrepresented and
underserved, Indigenous Peoples should be
Recruiting Volunteers and Team involved in all aspects of the Point-in-Time
Count. It was beneficial to work with the
Leaders Aboriginal Friendship Centre of Calgary (AFC),
and the Aboriginal Standing Committee on
In order to recruit skilled volunteers, staff at
Housing and Homelessness (ASCHH), and
the Calgary Homeless Foundation compiled a
other Indigenous community members and
list of active service and agency workers from
groups to inform them of the project and
a vast array of community groups.
elicit feedback and participation in the event.
The selected individuals were invited to
More than 100 volunteers were recruited
participate in the October 2016 Count as Team
to participate in the Street Count portion
Leaders, who would act as spokespersons
(making up 19 teams and 4 transport teams).
for their three- to five-person team of
volunteers. Team Leaders were in charge of
handling engagement gifts, honorariums, Engaging the Public and Private
and clipboards, while also leading their Sector
team to canvass their designated zone.
Chosen individuals included case managers Calgary’s 2016 PiT Count would not have been
at agencies, volunteers from a multitude of possible without the help of more than 90
community groups, individuals who work with volunteers, 14 outreach workers, a dozen CHF
women fleeing violence, and other personnel staff members, and more than 30 officers and
in the homeless sector. cadets from the Calgary Police Service (CPS).
This recruitment method was complemented Outreach teams, CPS, and Community
by e-mails sent to all agencies and partners Standards (formerly known as Bylaw Services)
to encourage staff to participate in the PiT coordinated for weeks before the count to
Count. Volunteers were also recruited from determine what areas needed to be checked
Calgary Homeless Foundation volunteer for encampments. They explored known
registries from previous events. and suspected areas for encampment sites.
Additionally, the CPS helicopter, HAWCS, did a
Particular attention was made to actively flyover of numerous green spaces throughout
recruit front-line shelter staff and outreach the city a few days before the count and used
workers as well as Calgary Police Services the pilot’s expertise and Forward Looking
(CPS), Community Standards Peace Officers, Infrared Radar (FLIR) to detect new and
and Alberta Health Services (AHS). previously unknown active sites.
22Together, using all the information they’d to ensure they covered the areas being
collected, CPS, CSS, and DOAP outreach actively used.
teams decided whose teams would be • Campus Security from the Southern
covering each area on the night of the count Alberta Institute of Technology (SAIT
(with volunteers). For areas deemed too Polytechnic), Mount Royal University,
treacherous to cover with volunteers at and the University of Calgary, were
night, coverage was provided and surveys invited to participate as well. All three
were administered during the day prior campuses had their security officers
and morning after the count by teams of cover their campuses on the night of
outreach workers and CPS and Community the Count, and tallied the number of
Standards officers. In addition, the following individuals encountered who appeared to
organizations provided additional coverage: be homeless. They also noted observed
gender, age, and ethnicity.
• Canadian Pacific Railway (CPR) ran two
trains, one at 10:00 p.m. when the Count • City of Calgary Community Standards
started, and again at 5:00 a.m. to see if Peace Officers ventured out several
there were any individuals along the track nights prior to the Count to locate known
line. and new rough sleepers. On the night
of the Count, they used vehicles to
• Calgary Parking Authority security access large inner city areas and remote
personnel canvassed every downtown parks of Calgary, while also conducting
parking lot and parkade and tallied the surveys with any persons encountered.
number of individuals encountered who Community Standards Peace Officers also
appeared to be homeless. They also conducted scans during daytime hours
recorded observed gender, age, and for the three days prior to the count, to
ethnicity. identify camps in difficult to reach areas.
• Calgary Transit Peace Officers surveyed • Two days before the Count, CPS HAWCS
C-train stations during the hours of the helicopters determined if there were any
count for three days following the count. active camp sites. Any camps found were
Stations were also checked after the communicated to Community Standards
C-Train had stopped running (between Peace Officers, who accessed them
2:00 am and 4:00 am). Workers tallied the the night of the Street Count. CPS also
number of individuals encountered who assisted with transportation needs for
appeared to be homeless. An average of individuals on the night of the Count. CPS
these 3 nights was taken and the total was supplied volunteers for Team Leaders, as
added to the count. well as two roving units in the
• Calgary Stampede security canvassed the downtown core.
Stampede grounds and tallied the number
of individuals encountered who appeared
to be homeless. They also made note of
observed gender, age,
and ethnicity.
• Alberta Parks worked to cover Fish Creek
Park , a provincial park within Calgary’s
city limits. Wardens walked through the
Park several evenings prior to the Count
looking for people and signs of people
sleeping rough. They used this information
23Calgary Point-in-Time Count Report | Fall 2016
Facility Count Street Count
Time Period: 12:00 pm (Wednesday, October Time Period: 10:00 pm (Wednesday October
19) to 12:00 pm (Thursday, October 20).3 19) to 12:00 am (Thursday October 20).
Contributors: Contributors:
Facilities included emergency shelters and There were 100 Street Count volunteers.
short term supportive housing facilities. They included experienced outreach/agency
These included homeless shelters, women’s workers, as well as law enforcement officers;
shelters, and supportive mental health and including Calgary Police and Crisis Team
addictions facilities. Other facilities involved in (PACT), Downtown Outreach Addictions
the Count consisted of hospitals, Correctional Program Encampment Team (DOAP), Calgary
Services, and emergency and social services. Community Standards Peace Officers,
CPS Cadets, and community volunteers.
Process: Additionally, the Count included employees
from Canadian Pacific Railway (CPR), Calgary
On the night of October 19, 2016, Parking Authority, Calgary Stampede, Alberta
participating facilities and service agencies Parks, the University of Calgary, Mount Royal
completed the enumeration forms for all University, Southern Alberta Institute of
clients staying the night/day at their shelter Technology (SAIT Polytechnic), and
or facility classified as “No Fixed Address” Calgary Transit.
(NFA). The enumeration forms collected
basic demographic data including gender, Process:
age, ethnicity, and number of families. All
completed enumeration forms were e-mailed Team Leaders were required to attend an
to the Calgary Homeless Foundation. orientation two weeks prior to the Count.
Upon completion, Team Leaders arrived
at the PiT Count headquarters (which was
the Municipal Atrium of Calgary’s City Hall).
Once signed in, Team Leaders were given
an information package on a clipboard
designated with their ‘zone’ number, and a
backpack which contained:
• Copies of the consent form and a copy
of the Freedom of Information and
Protection of Privacy (FOIP) Act (Prior to
participation in the Street Count survey,
the consent was read to every individual
Copies of Street Count surveys).
• A copy of the Teams and Map of assigned
‘zone’ in the city.
• Emergency contact information, including:
contact phone number for headquarters,
CPS Transport Team, the DOAP Team, and
3 Although the Count allowed inclusion of day and night sleepers over a (24) hour period; the vast majority of facility enumeration was done between
10:00 pm on October 19, and 12:00 am on October 20. Full Count Results were asked to be completed and submitted to the Calgary Homeless
Foundation by 12:00 pm (noon) on October 20 (Best Practices & Lessons Learned in Conducting Counts of Homeless Persons in Calgary, 1992-2008, p.19).
24Non-Emergency Police Calls. surveys and observational tally sheets.
• Gifts of engagement and gratitude
including candy and chocolate bars, Please see Appendix C for a copy of the
cigarettes, warm hats, gloves, socks, hand Street Count survey questions, as well as the
warmers, dental kits, and hygiene kits. observed enumeration chart.
At 10:00 pm on the night of the Count, Limitations to Point-in-Time
teams of three to four volunteers led by one Counts
outreach/agency worker or law enforcement
officer, travelled to their pre-assigned It is critical to note that PiT Counts do not
geographic zone by foot, car, or transit. seek to capture the full picture or context
Enumeration forms were used to keep of homelessness. Likewise, as mentioned in
track of the total number of unsheltered the methods section of this report, most PiT
homeless individuals counted by each team.4 Counts (including Calgary’s) do not claim that
Each team asked homeless individuals they their ‘street counts’ are representative.
encountered to complete a 17-question
survey to capture basic demographics of Due to the fact facility reported data is
Calgary’s rough sleeping population, as well often based on agency staff observing
as basic information about their previous characteristics, there is potential for
living circumstances and housing needs. error when observing each individual’s
Participation in the survey was voluntary demographics.
and interviews did not exceed 20 minutes.
Consent was obtained from all participants, The Street Count component occurs during a
and engagement gifts such as cigarettes, two hour time period, while facility-reported
or candy/chocolate bars were offered to data could happen at any time during the
increase survey participation. If people chose day of the count. For example, a Short Term
not to participate in the survey, teams had a Supportive Housing facility may conduct a
tally sheet on which they collected a smaller count before administrative staff leave for
amount of information (namely, observed the day. This does create potential for over-
demographic information, including gender, counting or duplication.
approximate age, and ethnic background).
The observed method was also used if the Lastly, classification of facilities as Emergency
individual was sleeping, heavily intoxicated, or Shelter, Short Term Supportive Housing, or
believed to be severely mentally ill. Volunteers Permanent Supportive Housing Providers
were encouraged to approach everyone, is complex and can change overtime in
unless the individual was sleeping or if they correlation to the individual themselves and
felt it would jeopardize safety. the facility’s flexibility.
In addition to the gifts of engagement,
all individuals encountered were offered
transportation to an emergency shelter. Upon
completion of the survey, honorarium gifts
were given which included warm clothing, as
well as both dental and hygiene kits. Once the
two-hour period had elapsed, teams returned
to the headquarters with their completed
4 A mandatory training session was provided for volunteer two hours prior to the start of the Count on the evening of October 19. The orientation
outlined the Count’s history and purpose, along with the enumeration and interview process. It also covered safety and emergency procedures. A
separate and more detailed training session for Team Leaders was held two weeks prior to the Count.
25Calgary Point-in-Time Count Report | Fall 2016
The Weather and the Street
Count
During the colder months, homeless
individuals are more likely to enter homeless
shelters, where it is easier to more accurately
enumerate the population. In the summer
months, individuals are more likely to be
sleeping outdoors and in camps that are
spread across the city. As a result, there is
a higher probability that the count will miss
individuals in warmer months (Kelowna Point-
in-Time Count, Central Okanagan Foundation,
2016). October was chosen as a good month
to conduct the most accurate “snapshot” of
homelessness in Calgary. The 2016 Fall Count
took place in the same week as the 2014 Fall
Count. Temperatures during the 2014 Fall
Count reached 3 degrees Celsius. The average
temperature during the 2016 Fall Count was
1.4 degrees Celsius.
26Appendix B – List of Facilities and Classifications
Emergency Shelters Short Term Supportive Housing
• Alpha House • Calgary Catholic Immigration Services
oo Detox oo Beltline
• Awo Taan • Calgary Dream Centre
• Boys and Girls Clubs of Calgary • Calgary Drop-In & Rehab Centre
oo Avenue 15 oo Riverfront
oo Safe House • Discovery House Society
• Brenda’s House • Fresh Start Recovery
oo Children’s Cottage • Highbanks Society
• Calgary Drop-In & Rehab Centre • Calgary John Howard Society
oo West Hillhurst oo Berkana House
oo Centre 2507 oo Raido House
• Calgary Women’s Emergency Shelter oo Windsor House
• Inn From The Cold • Kerby Centre
oo C110 Family Shelter oo Rotary House
oo Knox Inn • McMan
oo Sundial oo Hope Homes for Aboriginal Youth
• The Salvation Army • Margaret Chisholm Resettlement Centre
oo Centre of Hope • Recovery Acres Society
oo WISH oo 1835 House
• YWCA of Calgary oo 1822 House
oo Mary Dover House • The Salvation Army
oo Sheriff King Home oo Centre of Hope
• Wood’s Homes oo WISH
oo EXIT Youth Shelter oo Addictions Recovery Program
• Servants Anonymous Society
Short Term Supportive Housing oo SAFE
• Alcove • Simon House
oo Addiction Recovery for Women • Sonshine Society
• Alpha House • Sunrise Addiction Services Society
• Aventa • Victory Foundation
oo Aventa oo Forest Lawn Recovery Program (Eastside
oo Aventa 12th Ave Victory Outreach)
• Boys and Girls Clubs of Calgary oo Victory Manor Transitional Housing
(Ogden)
oo Haven’s Way
• YWCA of Calgary
• Brenda Strafford Centre
oo Progressive Housing oo Mary Dover House
oo Second Stage
27Calgary Point-in-Time Count Report | Fall 2016
Systems Rough Sleepers
• Alberta Health Services • Calgary Transit
ooPeter Lougheed • Calgary Police Service; PACT
(Emergency and Inpatient) • Calgary Peace Officers; Community
ooFoothills Medical Centre Standards, PAL
(Emergency and Inpatient) • Canadian Pacific Railway
ooRocky view General Hospital • Calgary Parking Authority
(Emergency and Inpatient)
• DOAP Team & Encampment
ooSAF (Forensic and Psychiatry Inpatient
Centre) • SAIT Campus Security
ooSouth Health Campus • University of Calgary Campus Security
(Inpatient) • Calgary Stampede Authority
ooSheldon M. Chumir Health Centre • Mount Royal University Campus Security
ooRenfrew Recovery Detoxification • Fish Creek Park Warden
Centre
• Corrections
ooCalgary Remand Centre
ooCalgary Young Offender Centre
ooCalgary Police Service Court Services
Selection
ooAlberta Works Income Support
Contact Centre
28Appendix C – Data Collection Forms
Facility Count Enumeration Form
Please fill out the following form based on your records of people staying overnight in your
facility on the night of October 19, 2016 (10:00 am on October 19 and 12:00 am on October
20). For questions 8-13, please fill out only the fields relevant to your facility. If your facility
serves both families and single individuals, please record the information in the section for
facilities serving families. Note that definitions are listed under Table 1.
If your program operates more than one type of bed (i.e. emergency shelter beds as well as
transitional beds) in one facility, please submit one form for each type of program.
Please submit this form via email to rachel@calgaryhomeless.com no later than noon on
October 20th. You will receive a confirmation email in response.
If you have any questions about how to complete this form, please contact: Rachel Campbell
either by telephone (403) 718-2934 or by email at rachel@calgaryhomeless.com
If you require any other information about the Point-in-Time Count, please contact: Madison
Smith either by telephone at (403) 718-2928 or by email at madisons@calgaryhomeless.com
We would like to thank the City of Calgary for providing enumeration forms that were used
during the 2008 Point-in-Time Count and were invaluable to creating this form.
General Information:
1. Agency Name
2. Facility Name
3. Bed/Program Type (applicable if multiple program or bed types housed in one facility
– i.e. emergency mats, transitional beds. In the case of multiple programs, one form
should be submitted per program/bed type)
4. Date (MM/DD/YYYY) data was collected
5. Time (MST, AM/PM) data was collected
6. Data Source (observed by the case manager or from the software)
7. Contact information of the person who collected the data (name, phone, email)
Count Information: Facilities Serving Single Individuals
8. How many individuals who are homeless/have no fixed address were counted (includes
ALL Age Groups)?
9. Number of families staying in your facility
10. What is your regular bed capacity for singles programs or unit capacity for family
programs (total number of beds or units the organization has available)?
11. Description of unusual circumstances affecting the count
29Calgary Point-in-Time Count Report | Fall 2016
12. Additional comments about the count
Definitions: Terms of reference.
Single Individuals: For the purposes of this form, individuals are unaccompanied, single
persons in your facility.
Families: For the purposes of this form, a family is any combination of a parent/guardian and
dependent staying at the same facility. For example, an 18-year-old mother and her child; 2
parents and 2 children; a guardian and his/her dependent.
Other: This group represents all known ethnicities except Caucasian and Aboriginal (i.e. Asian,
African, and Latino).
Unknown Ethnicity: This group represents those whose ethnicity is unknown.
Unknown Gender: This group represents those whose gender is unknown.
Unknown Age: This group represents those whose age is unknown.
Thank you for participating in the Count. Your support is
essential for the success of this project.
30Enumeration Sheet
31Calgary Point-in-Time Count Report | Fall 2016
Street Survey
SURVEY QUESTIONS – POINT-IN-TIME COUNT, October 2016
3233
Calgary Point-in-Time Count Report | Fall 2016

                                        34
35
Calgary Point-in-Time Count Report | Fall 2016

Appendix D – Data Tables
Figure 1
0 to 5                     163
6 to 12                    139
13 to 17                   77
18 to 24                   300
25 to 44                   1218
45 to 64                   1368
65+                        141
Unknown                    24

Figure 2
Male                       2561
Female                     850
Transgender                0
Unknown                    19

Figure 3
Caucasian                  2035
Indigenous                 695
Other                      539
Unknown                    161

Figure 4
Shelter                    1503
Transitional               1453
Systems                    280
Unsheltered                194

Figure 5
                2014                         2016
0 to 5          198                          163
6 to 12         124                          139
13 to 17        112                          77
18 to 24        271                          300
25 to 44        1395                         1,218
45 to 64        1284                         1,368
65+             122                          141
Unknown         49                           24

                                                                          36
Figure 6
2014 2016
Shelter 1766 1503
Transitional 1292 1453
Systems 315 280
Unsheltered 182 194
Figure 7
2014 2016
Caucasian 2,010 2035
Indigenous 751 695
Other 641 539
Unknown 153 161
Figure 8
Caucasian Indigenous Other Unknown
Shelter 889 381 229 4
Transitional 947 190 300 16
Systems 138 65 2 75
Unsheltered 61 59 8 66
Caucasian Indigenous Other Unknown
Shelter 44% 55% 42% 2%
Transitional 47% 27% 56% 10%
Systems 7% 9% 0% 47%
Unsheltered 3% 8% 1% 41%
Figure 10
0 to 5 6 to 12 13 to 17 18 to 24 25 to 44 45 to 64 65+ Unknown
Caucasian 32 25 40 161 692 970 115 -
Indigenous 55 54 19 86 280 193 7 1
Other 73 60 18 40 182 158 8 -
Unknown 3 - - 13 64 47 11 23
0 to 5 6 to 12 13 to 17 18 to 24 25 to 44 45 to 64 65+ Unknown
ALL 4.8% 4.1% 2.2% 8.7% 35.5% 39.9% 4.1% 0.7%
Caucasian 1.6% 1.2% 2.0% 7.9% 34.0% 47.7% 5.7% 0.0%
Indigenous 7.9% 7.8% 2.7% 12.4% 40.3% 27.8% 1.0% 0.1%
Other 13.5% 11.1% 3.3% 7.4% 33.8% 29.3% 1.5% 0.0%
Unknown 1.9% 0.0% 0.0% 8.1% 39.8% 29.2% 6.8% 14.3%
37Calgary Point-in-Time Count Report | Fall 2016
Figure 11
All Youth
Total 3430 377
Shelter 1503 115
Transitional 1453 181
Systems 280 51
Unsheltered 194 30
Figure 12
0-24 25 to 44 45 to 64 65+
Calgary City Census 375514 419654 309011 131382 1,235,561
PiT Count 679 1,218 1,368 141 3,406
Calgary City Census 30.4% 34.0% 25.0% 10.6%
PiT Count 19.9% 35.8% 40.2% 4.1%
Figure 13
Male Female Transgender Unknown
Shelter 1,187 316 - - 1,503
Transitional 988 465 - - 1,453
Systems 241 39 - - 280
Unsheltered 145 30 - 19 194
2,561 850 - 19 3,430
Male Female
Emergency Shelter 46% 37%
Transitional Housing 39% 55%
Systems 9% 5%
Unsheltered 6% 4%
Figure 14
Sources of Income
Employment 33% 94
Informal/Self-employment 27% 78
Seniors Benefits 9% 25
Disability Benefits 8% 23
Welfare/Income Assistance 7% 19
Other Source 5% 14
Child and Family Tax Benefits 4% 12
Employment Insurance 3% 8
No income or not reported 23% 65
38Thank you and Acknowledgements
Thank you to our partners for the time and resources supplied towards making the Fall 2016
Point-in-Time Count successful. Your generosity is appreciated, and we thank you for your
courageous collaboration initiative. The following organizations:
• Alberta Health Services • Joy Socks
• Ambiance Dental • Live Out There
• Bandi Photography • Pizza 73
• Calgary Food Bank • MapWorld
• City of Calgary - City Hall • Mountain Equipment Co-op
• Dental Choice Scotia • Office of Hon. Kent Hehr
• Foresters Financial Insurance • Sandman Hotel
• Genumark • Safeway
• HIV Community Link
The authors of the present report would also like to thank the following individuals for
invaluable assistance with this document: Louise Gallagher, Darcy Halber, Joel Sinclair, and
Kara Layher. Any errors lie with the authors.
39You can also read