Design, Simulation, and Fabrication of a Copper-Chrome-Based Glass Heater Integrated into a PMMA Microfluidic System
←
→
Page content transcription
If your browser does not render page correctly, please read the page content below
micromachines

Article
Design, Simulation, and Fabrication of a Copper–Chrome-Based
Glass Heater Integrated into a PMMA Microfluidic System
Santiago Tovar, Cesar A. Hernández                    and Johann F. Osma *

                                          CMUA, Department of Electrical and Electronic Engineering, Universidad de los Andes, Carrera, 1E # 19A-40,
                                          Bogotá 111711, Colombia; s.tovar@uniandes.edu.co (S.T.); ca.hernandez11@uniandes.edu.co (C.A.H.)
                                          * Correspondence: jf.osma43@uniandes.edu.co

                                          Abstract: In this paper, the development of a copper–chrome-based glass microheater and its in-
                                          tegration into a Polymethylmethacrylate (PMMA) microfluidic system are presented. The pro-
                                          cess highlights the importance of an appropriate characterization, taking advantage of computer-
                                          simulated physical methods in the heat transfer process. The presented system architecture allows
                                          the integration for the development of a thermal flow sensor, in which the fluid flows through a
                                          1 mm width × 1 mm length microchannel across a 5 mm width × 13 mm length heating surface.
                                          Using an electrothermal analysis, based on a simulation and design process, the surface heating
                                          behavior curve was analyzed to choose a heating reference point, primarily used to control the
                                          temperature point within the fluidic microsystem. The heater was characterized using the theory of
                                          electrical instrumentation, with a 7.22% error for the heating characterization and a 5.42% error for
                                          the power consumption, measured at 0.69 W at a temperature of 70 ◦ C. Further tests, at a temperature
                                          of 115 ◦ C, were used to observe the effects of the heat transfer through convection on the fluid and the
                                heater surface for different flow rates, which can be used for the development of thermal flowmeters

                                          using the configuration presented in this work.
Citation: Tovar, S.; Hernández, C.A.;
Osma, J.F. Design, Simulation, and
                                          Keywords: microheater; microsystem; electrothermal systems; thermal characterization; hysteresis;
Fabrication of a
                                          physical vapor deposition (PVD); Polymethylmethacrylate (PMMA)
Copper–Chrome-Based Glass Heater
Integrated into a PMMA Microfluidic
System. Micromachines 2021, 12, 1067.
https://doi.org/10.3390/mi12091067
                                          1. Introduction
Academic Editor: Joost Lötters                 Heating in microsystems, referred to as microheaters, has a fundamental role in the
                                          operation of different devices, such as thermal flow sensors [1], microelectromechanical
Received: 7 July 2021                     systems (MEMS) gas sensors [2–5], liquid petroleum sensing (LPG) [6], trace detection of
Accepted: 18 August 2021                  explosives [7], thermal electric generation on microchannels [8], and temperature control
Published: 2 September 2021               of environment for chemical and biological processes at small scales [9,10]. The tem-
                                          perature control of microsystem devices can be achieved using macroscale equipment,
Publisher’s Note: MDPI stays neutral      such as incubators and surface heaters. This type of equipment usually consumes a
with regard to jurisdictional claims in   considerable amount of power and does not allow performing parallel system-specific
published maps and institutional affil-   adjustments. Moreover, these macroscopic temperature controls, if precise, usually have
iations.                                  slow time responses [11].
                                               The design of temperature controls directly integrated into the microsystem archi-
                                          tecture [12] is an auspicious alternative that has been credited for biological monitoring
                                          microsystems [10,13], polymerase chain reaction integrated devices [14], protein charac-
Copyright: © 2021 by the authors.         terization and sensing [15], and supported bilayer lipid membrane-based biosensors [16],
Licensee MDPI, Basel, Switzerland.        among others. These microsystems employ a thin film of deposited metal as an electrically
This article is an open access article    resistive heating element, as described by Joule’s law. The importance of having direct
distributed under the terms and           contact between the heater and the system relies on having control and certainty about
conditions of the Creative Commons        the conditions of the elements immersed in the microsystem, due to a resistance reduction
Attribution (CC BY) license (https://
                                          in the heating transference [17], in addition to having the possibility to include thermal
creativecommons.org/licenses/by/
                                          sensors using similar thin-film technologies within an integrated system [18].
4.0/).

Micromachines 2021, 12, 1067. https://doi.org/10.3390/mi12091067                                    https://www.mdpi.com/journal/micromachines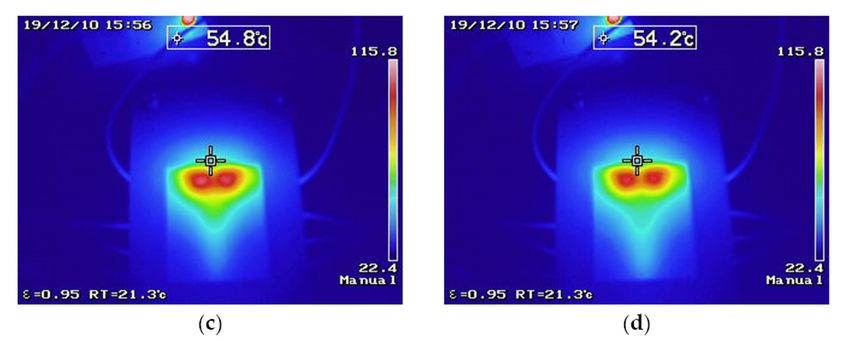
Micromachines 2021, 12, 1067                                                                                           2 of 16

                                     An adequate characterization process on a heating system gives more precise results
                               in the operating temperature [19–21]. For instance, in the works published by Scorzoni [20],
                               Byers [21], and Tiwari [22], different designs for printed microheaters were presented, using
                               COMSOL for modeling temperature and voltage distributions, highlighting the advantages
                               of implementing electrothermal simulations to compare and analyze the characterization
                               process on a heating system.
                                     Similar approaches are currently used for fabricating microheaters, with diverse
                               fabrication methods, both combined or not combined, such as physical vapor deposition
                               (PVD) deposition methods [6,10,23–25], photolithography with digital light processing [23],
                               and laser beam techniques [25]. Despite all the available techniques, research in emerging
                               countries requires a more cost-effective approach.
                                     On that basis, a heater was developed through a PVD deposition method and designed
                               with a serpentine shape. All previous features mentioned gave optimal temperature
                               requirements, as well as a good heat concentration on the device. Furthermore, it was
                               characterized in detail, interpreting the hysteresis behavior, and was compared with
                               electrothermal COMSOL simulations. The results were analyzed to choose a heating
                               reference point, providing precise temperature results. The fabricated heater was integrated
                               into a PMMA microsystem. This integration seeks to find an alternative to the use of
                               cleanroom facilities, taking advantage of readily available equipment, such as a laser
                               cutting machine, reducing fabrication costs and labor for research activities, thus offering a
                               desired characteristic for research in emerging countries. From the reference heating point, a
                               control current system was designed and implemented to maintain the temperature within
                               working boundaries at the microfluidic system. The electrothermal results supported the
                               simulation, and it granted a rapid, sustained, and validated low-power thermal control,
                               achieving a thermal characterization in which a high-resolution heat profile distribution
                               phenomenon, at different flow rates, was observed by thermal imaging, backing up the
                               possibility to integrate thermal flow sensors, with the advantage of having the flexibility of
                               being coupled to different systems, as well as having optical transparency and repeatability
                               in its fabrication process.

                               2. Materials and Methods
                               2.1. Materials, Equipment, and Software
                                    Polymethylmethacrylate (PMMA) sheets with a thickness of 2 mm and 3 mm
                               were bought from Diacrílicos J.D. (Colombia, Bogotá). Glass slides with dimensions of
                               25.4 mm × 7.2 mm × 1.2 mm were purchased from vendor Sail Brand (Yancheng, China).
                               Chrome pieces, Cr, purity of 99.95%, with a size range between 0.8 mm to 6 mm, and copper
                               pellets, purity 99.99%, with a diameter of 6.35 mm and a length of 6.35 mm were acquired
                               from Kurt J. Lesker Company (Clairton, PA, USA). Analytical-grade methylene chloride
                               was used. The physical vapor deposition (PVD) process was performed using thermal
                               evaporator Edwards E306 (Moorfield Nanotechnology Limited, Knutsford, Cheshire, UK)
                               in a cleanroom facility environment. Spin coating was performed using a SPIN150 spin
                               coater (SPS Europe B.V., Putten, The Netherlands). UV photolithography was performed
                               using a Karl-Suss MJB-3 Aligner (SÜSS MicroTec SE, Garching, Germany). Positive pho-
                               toresist MICROPOSIT™ SC™ 1827 (SC-1827) and developer MICROPOSIT™ MF™ 319
                               (MF-319 developer) were purchased from Rohm and Haas Electronic Materials LLC (Marl-
                               borough, MA, USA). Baker PRS-1000 was used as stripper for lift-off processes and was
                               purchased from Avantor (Radnor, PA, USA). PMMA slides were fabricated with a laser cut-
                               ting machine Trotec® SPEEDY 100 (Trotec Laser GmbH, Marchtrenk, Austria). Transparent
                               double-sided tape TESA, with a thickness of 205 um (Tesa SE, Hamburg, Germany), was
                               used for sealing of the microdevices. Special glue UHU HART (UHU GmbH & Co. KG,
                               Bühl, Germany) was used for gluing of coupling connectors.
                                    The design of the printed circuit board (PCB) was elaborated using EAGLE 8.3.2 PCB
                               Design Software (Autodesk, San Rafael, CA, USA). The design of the PMMA microsystems
                               was developed using AutoCAD 2020 Design Software (Autodesk, San Rafael, CA, USA).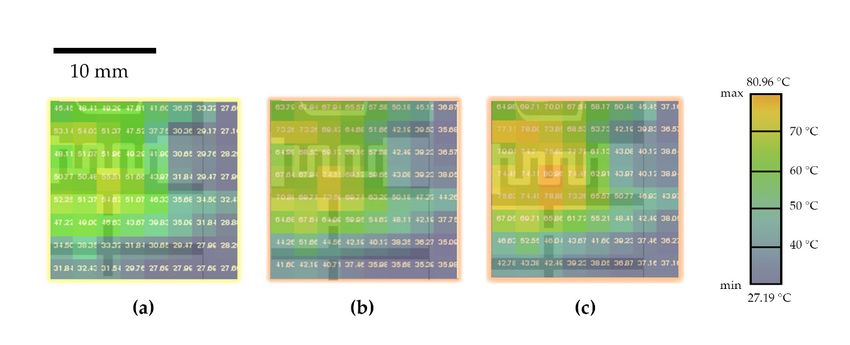
Micromachines 2021, 12, 1067                                                                                            3 of 16

                               A thermoelectric analysis simulation was implemented in COMSOL Multiphysics 5.3
                               (COMSOL, Inc., Burlington, MA, USA). Supply and measurements for the microsystem
                               characterization process were carried out with variable dual voltage source HAMEGTM
                               HM7042 (HAMEG Instruments GmbH, Mainhausen, Germany), digital multimeter Peak-
                               Tech Multifunction Tester® 3725 (PeakTech Prüf und Messtechnik GmbH, Ahrensburg,
                               Germany), and thermal camera Panasonic AMG8833 (Panasonic Industrial Devices Com-
                               pany, Newark, NJ, USA).
                                     The simulation of the temperature control system with the current source (IC) was devel-
                               oped in LTSpiceXVII of Analog Devices (Analog Devices, Inc. (ADI), Norwood, MA, USA).
                               For the integration of the IC, 2N2222 transistors from Microsemi (Microchip Technology Inc,
                               Chandler, AZ, USA), a 15 Ω metal film resistor 0.5 W 1% (KOA Speer Electronics Inc.,
                               Bradford, PA, USA), and an adjustable trimmer 100 Ω BOURNS 3296 W-1-101_LF (Bourns
                               Inc., Riverside, CA, USA) were used. The measurements of the microsystem heater were
                               performed with thermographic camera Keysight U5855A JP54270688 (Keysight Technolo-
                               gies, Santa Rosa, CA, USA) and syringe infusion pump Medcaptain MP-30 (Medcaptain
                               Medical Technology Co. Ltd., Guangdong Sheng, China). To perform the leak test and
                               report the thermographic camera results, transparent water-based olive green (956) dye
                               made with pigments and with a matte finish ROSETA (ROSETA INDUSTRIAL LTDA,
                               Colombia) was used.

                               2.2. Copper–Chrome-Based Glass Heater
                                    For the fabrication of the copper–chrome-based glass heater, a photolithographic mask
                               was designed (Figure 1) featuring two connection pads, each of 7.15 mm × 7.15 mm and a
                               1 mm width path to outline the heater trace, with a total longitude of 37 mm, in the shape of a
                               rectangular serpentine with 1 mm space between each lap and a 5 mm width × 13 mm length.
                               Additionally, the photolithographic mask included the design of three extra connection
                               pads, designed to allow the future integration of temperature sensors into the microsystem.
                                    The heater was built upon a regular glass slide (Figure 1). First, the glass slides
                               (Figure 1a) were spin-coated (Figure 1b) with SC-1827 photoresist at 5000 rpm for 1 min
                               and precured at 100 ◦ C for 50 s on a hotplate. Coated glass slides were exposed to UV light
                               using a photolithographic mask (Figure 1c), developed (Figure 1d), and exposed directly to
                               UV light for 1 min. Then, a 15 nm chrome layer was deposited by physical vapor deposition
                               (Figure 1e), for a 10 mg chrome evaporation, achieved using an electrically heated tungsten
                               filament. A vacuum pressure of 7 × 10⁻⁶ mbar and an evaporation rate of 1 nm/s were
                               established. Afterward, a 250 mg copper evaporation was performed (Figure 1f), using
                               the same evaporation parameters. As a result, metallic layers with a 115 nm thickness
                               compounded by a 15 nm chrome nanolayer and a 100 nm copper nanolayer (Figure 1g)
                               were achieved. The fabricated heater is shown in Figure 1h.

                               2.3. Microsystem Assembly Process
                                    The manufacturing technique for the PMMA microsystems was previously described
                               by our group [13,26]. This technique is based on a series of characterized 1 mm cuttings
                               and engravings with a laser-cutting machine on PMMA layers [27]. To assemble the PMMA
                               plates and the heater, double-sided tape was used, which was also previously cut using
                               the laser-cutting machine. The final layered plate design for the PMMA microsystem is
                               depicted in the Figure 2. The microchannel plate contains a 1 mm engraving and spaces
                               corresponding to the coupling pads used for wiring, and it was designed to adjust the
                               current source to supply energy to the heater resistor (Figure 2a). The next plate, i.e., the
                               heater adjustment plate, was dimensionally adjusted to the heater. The support plate was
                               used in the prototype base with a second glass slide to give it the same thickness to the
                               area reserved for the heater placement (2 mm) (Figure 2a).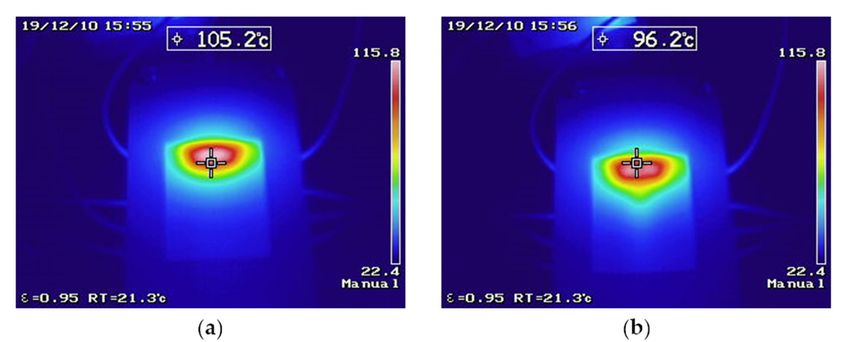
Micromachines 2021,
     Micromachines   12, 12,
                   2021, x 1067                                                                                                 4 of 16 4 of 17

                                                                                                                              5 of 17

   the heater adjustment plate, was dimensionally adjusted to the heater. The support plate
   was used in the prototype base with a second glass slide to give it the same thickness to
   the area reserved for the heater placement (2 mm) (Figure 2a).
        The thermographic camera adjustment plate (Figure 2c) was glued to the top layer of
   the microchannel plate, giving the test measurements a wider visual angle than that pro-
   vided by the characterization plate for the thermal camera (lens) and characterization
   plate for the thermal camera (body) (Figure 2b), which were glued to the top layer of the
   microchannel plate, wherein another layer was the microchannel coupled with the heater.
   In the final assembly of the microsystem (Figure 2a), the characterization mounting (Fig-
   ure 2b), using the two characterization plates (lens and body), was employed for the test
   measurements using the thermographic camera, while, for the test measurement mount-
   ing, only the characterization plate for the thermal camera was used (Figure 2c). It can be
   noted that light transmission is avoided in the structure outside of the window area,
   which allows carrying out the correct data and photo recording with both cameras.
        Lastly, to determine leaks and performance of the applied microflow, the complete
   microsystem was evaluated using a vacuum test with two empty syringes connected in
   both microsystem coupling connectors and a series pressure configuration of 12 mL/h
   with the syringe infusion     pump, where air was used first as fluid, followed by water with
                           Figure 1. Fabrication process of the copper–chrome-based glass heater: (a) clean glass surface; (b)
                         Figure
   transparent water-based         1. Fabrication
                                green              process of the copper–chrome-based
                                         dye (concentration              of ~3%),      to observeglass heater:  (a) clean
                                                                                                          the (e)
                                                                                                               flow         glass surface; (b)
                                                                                                                        transition
                           photoresist-covered  glass; (c) UV light exposure;  (d) photoresist  development;      chrome    deposition;
                         photoresist-covered glass; (c) UV light exposure; (d) photoresist development; (e) chrome deposi-
   within the system. tion;(f) copper deposition; (g) final heater structure on glass after stripping off photoresist; (h) Photograph
                                (f) copper deposition; (g) final heater structure on glass after stripping off photoresist. (h) Pho-
                                    of the completed copper–chrome-based glass heater with dimensions.
                                  tograph of the completed copper–chrome-based glass heater with dimensions.

                                       The heater was built upon a regular glass slide (Figure 1). First, the glass slides (Fig-
                                  ure 1a) were spin-coated (Figure 1b) with SC-1827 photoresist at 5000 rpm for 1 min and
                                  precured at 100 °C for 50 s on a hotplate. Coated glass slides were exposed to UV light
                                  using a photolithographic mask (Figure 1c), developed (Figure 1d), and exposed directly
                                  to UV light for 1 min. Then, a 15 nm chrome layer was deposited by physical vapor dep-
                                  osition (Figure 1e), for a 10 mg chrome evaporation, achieved using an electrically heated
                                  tungsten filament. A vacuum pressure of 7 × 10⁻⁶ mbar and an evaporation rate of 1 nm/s
                                  were established. Afterward, a 250 mg copper evaporation was performed (Figure 1f),
                                  using the same evaporation parameters. As a result, metallic layers with a 115 nm thick-
                                  ness compounded by a 15 nm chrome nanolayer and a 100 nm copper nanolayer (Figure
                                  1g) were achieved. The fabricated heater is shown in Figure 1h.

                                  2.3. Microsystem Assembly Process
                                       The manufacturing technique for the PMMA microsystems was previously described
                                 by our group [13,26]. This technique is based on a series of characterized 1 mm cuttings
       Figure 2. (a) Microsystem building diagram and final mounting photographs of (b) test measurement and (c) characterization.
                                 and engravings with a laser-cutting machine on PMMA layers [27]. To assemble the
   Figure 2. (a) Microsystem     PMMA      platesdiagram
                                     building      and the heater,   double-sided
                                                              and final   mounting    tape   was used, which
                                                                                          photographs      of (b) was  also
                                                                                                                     test     previously cut
                                                                                                                           measure-
   ment and (c) characterization.using   the  laser-cutting  machine.    The  final  layered    plate design   for  the  PMMA      microsys-
                                 tem is depicted in the Figure 2. The microchannel plate contains a 1 mm engraving and
                                 spaces corresponding to the coupling pads used for wiring, and it was designed to adjust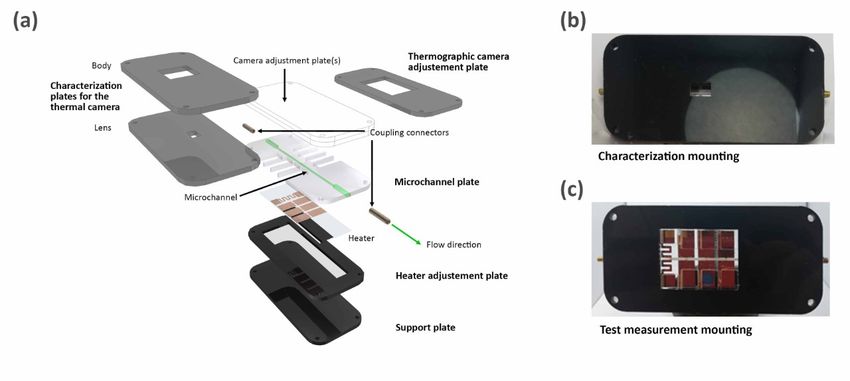
Micromachines 2021, 12, 1067                                                                                          5 of 16

                                     The thermographic camera adjustment plate (Figure 2c) was glued to the top layer
                               of the microchannel plate, giving the test measurements a wider visual angle than that
                               provided by the characterization plate for the thermal camera (lens) and characterization
                               plate for the thermal camera (body) (Figure 2b), which were glued to the top layer of
                               the microchannel plate, wherein another layer was the microchannel coupled with the
                               heater. In the final assembly of the microsystem (Figure 2a), the characterization mounting
                               (Figure 2b), using the two characterization plates (lens and body), was employed for the test
                               measurements using the thermographic camera, while, for the test measurement mounting,
                               only the characterization plate for the thermal camera was used (Figure 2c). It can be noted
                               that light transmission is avoided in the structure outside of the window area, which allows
                               carrying out the correct data and photo recording with both cameras.
                                     Lastly, to determine leaks and performance of the applied microflow, the complete
                               microsystem was evaluated using a vacuum test with two empty syringes connected in
                               both microsystem coupling connectors and a series pressure configuration of 12 mL/h
                               with the syringe infusion pump, where air was used first as fluid, followed by water with
                               transparent water-based green dye (concentration of ~3%), to observe the flow transition
                               within the system.

                               2.4. Electrothermal Characterization
                                    The characterization and calibration curves are an explicit relationship between a
                               stimulus (x-axis, voltage) and its response (y-axis, temperature). These curves were devel-
                               oped including the system hysteresis, defined by a heating curve (up) and a cooling curve
                               (down). A hysteresis curve, given by the theory of electrical instrumentation [28], can be
                               obtained using the following equation:

                                                                       H = |Y1 − Y2 |,                                   (1)

                               where Y1 is the resulting response of the heating curve and Y2 is the resulting response
                               of the cooling curve. These characterization curves were elaborated using the thermal
                               camera, suited with an in-house interface, to obtain a resolution of 8 × 8 pixels with a size
                               of 2.5 × 2.5 mm each. These measurements of voltage and temperature were developed
                               with a variation of 0.1 V by step voltage variation. Furthermore, the current was measured
                               within the characterization process to obtain the power consumption on the basis of the
                               electrothermal characterization curve. The determined time of stabilization to measure
                               each step was 10 s.

                               2.5. Electrothermal Simulation
                                    The thermoelectric simulations were used to predict and compare the thermal be-
                               havior of the heater in response to a provided voltage, according to the electrothermal
                               characterization. These simulations were defined for the computational model with similar
                               properties and the same dimensions of the designed heater, as shown in Table 1. Moreover,
                               the mesh size used in the model simulation was extra fine and was refined using the
                               adaptive mesh refinement tool in COMSOL MultiphysicsTM .
                                    The power consumption was simulated on the basis of the electrothermal characteri-
                               zation curve using the same properties, which enabled a comparison of the power behavior
                               in the fabricated microheater.

                               2.6. Point Thermal Characterization of the Fluid
                                    For the point thermal characterization, the microsystem was connected to the heating
                               control system, via the coupling wires, and to a syringe infusion pump, via the catheter,
                               with a flow rate of 12 mL/h, as depicted in Figure 3. The fluid used in the system was the
                               same as the fluid applied in the leak test, i.e., water with transparent water-based green
                               dye (concentration of ~3%), to observe the flow transition within the system acquired by
                               the thermographic camera, which was used with a ~15 cm distance to the microsystem,
                               focusing on the heater as a temperature reference in all the image captures.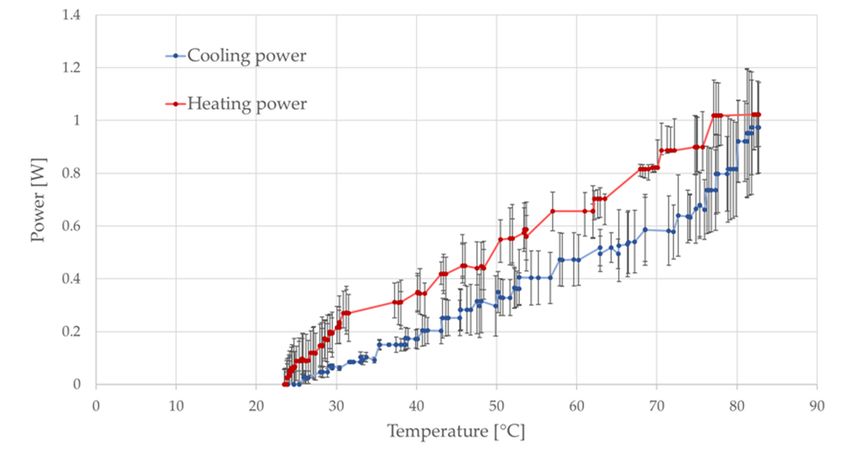
Micromachines 2021, 12, 1067                                                                                                      6 of 16

                                   Table 1. Properties used in the electrothermal simulation in COMSOL MultiphysicsTM , with proper-
                                   ties given by the material selected in the simulation.

                                                             Item                                               Value
                                                  Initial air temperature(◦ C)                                     20
                                            Copper electrical conductivity (S/m)                              5.96 × 10⁷
                                            Chrome electrical conductivity (S/m)                              7.9 × 10⁷
                                          Silica glass electrical conductivity (S/m)                          1 × 10⁻¹⁴
                                           Copper thermal conductivity (W/m·K)                                    400
                                          Chrome thermal conductivity (W/m·K)                                    93.7
                                         Silica glass thermal conductivity (W/m·K)                                1.38
                                      Air heat transfer film coefficient (W/(m2 ·K)) [29]                        20.45
Micromachines 2021, 12, x                                                                                                         7 of 17
                                                 Copper layer thickness (nm)                                      100
                                                 Chrome layer thickness (nm)                                       15

                                   Figure 3. Test assembly with a thermographic camera: (a) schematic; (b) photograph.
                                 Figure 3. Test assembly with a thermographic camera: (a) schematic; (b) photograph.
                                          For the final test, the temperature was increased to 115 ◦ C by maintaining a constant
                                    applied  current,
                                       For the          allowing
                                                final test,         an observation
                                                            the temperature          of the effects
                                                                               was increased    to 115of°Cheat convection ina constant
                                                                                                            by maintaining     the heater
                                    surface  due   to the liquid   flow  as the  temperature    gradient   between    the
                                 applied current, allowing an observation of the effects of heat convection in the heater heater  and the
                                    liquid was   increased,  thus  showing   a temperature    decrease   through  the
                                 surface due to the liquid flow as the temperature gradient between the heater and the flow direction line.
                                    The  microsystem     temperature     profile  was observed    for  flow  rates of
                                 liquid was increased, thus showing a temperature decrease through the flow direction  5 mL/h,  10 mL/h,
                                    15 mL/h,
                                 line.         and 20 mL/h,
                                       The microsystem            to inspect
                                                            temperature       the heat
                                                                           profile      profile distribution
                                                                                   was observed                 phenomenon,
                                                                                                   for flow rates  of 5 mL/h, 10which
                                                                                                                                  mL/h, is
                                 15produced
                                     mL/h, and due20to the thermal
                                                     mL/h,           advection
                                                             to inspect         and
                                                                         the heat    convection
                                                                                   profile        principle,
                                                                                           distribution       whereby, aswhich
                                                                                                          phenomenon,      flow increases,
                                                                                                                                 is pro-
                                    convective   heat  loss increases  from  the  heated  element   [20].
                                 duced due to the thermal advection and convection principle, whereby, as flow increases,
                                 convective heat loss increases from the heated element [20].
                                    3. Results
                                 3. 3.1. Theoretical and Practical Resistance Analysis
                                    Results
                                        Table 2 shows the common theoretical calculations for the resistance of the copper–
                                 3.1. Theoretical and Practical Resistance Analysis
                                   chrome-based glass heater. The heater resultant resistance was the sum of both the pads
                                   andTable  2 shows
                                        heater          the common
                                                resistance,  whereas theoretical  calculations
                                                                      this resistance          for theusing
                                                                                      was calculated   resistance  of the copper–
                                                                                                             the parallel resistance
                                 chrome-based     glass  heater. The heater  resultant resistance was  the sum   of
                                   value between the copper and the chrome structures. As a result, the theoretical both the  pads
                                                                                                                          resistance
                                 and  heater  resistance,  whereas
                                   of the heater was 4.80 Ω.        this resistance was  calculated using  the parallel resistance
                                 value between the copper and the chrome structures. As a result, the theoretical resistance
                                 of the heater was 4.80 Ω.

                                 Table 2. Measurements and common theoretical calculations of the copper-chrome-based heater.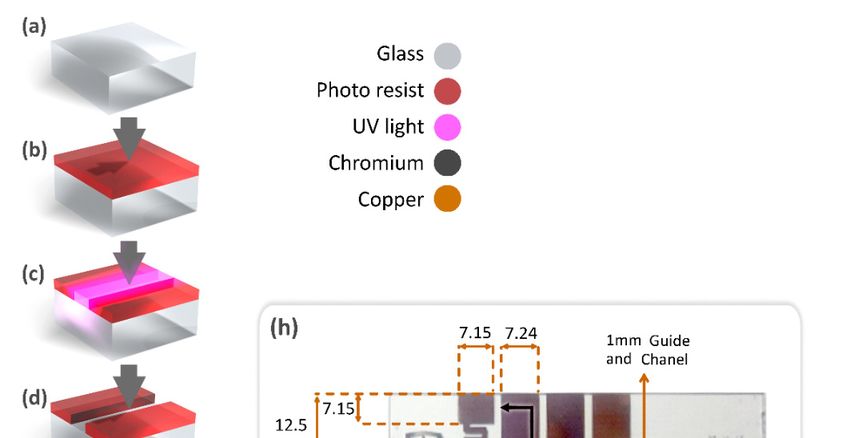
Micromachines 2021, 12, 1067 7 of 16
Table 2. Measurements and common theoretical calculations of the copper-chrome-based heater.
Item Copper Chrome Heater
Height (nm) 100 15 115
Micromachines 2021, 12, x Resistivity (Ω·mm2 /m) [30] 0.017 0.125 - 8 of 17
Pad area (mm ) 2 0.00125 0.0001875 -
Pad length (mm) 7.43 7.43 -
Heater length (mm) 31 31 -
Practical
Path resultant resistance was 0.101
resistance (Ω) measured for five identical heaters,
4.9538 produced as
0.0989
Heater
detailed in resistance (Ω)
the methods. 5.301
Each heater was measured four38.75
times, with a mean4.66result of 9.11
Heater resultant resistance (Ω) 5.402 43.73 4.80
Ω and variance of 0.17 Ω. Additionally, the microsystem coupling wire resistance was
measured, with a mean value of 1.4 Ω and a variance of 0.22 Ω.
Practical resultant resistance was measured for five identical heaters, produced as
detailed in the methods. Each heater was measured four times, with a mean result of
3.2.9.11
Thermal
Ω andCamera Characterization
variance of 0.17 Ω. Additionally, the microsystem coupling wire resistance was
Figure 4 shows images
measured, with a mean value of 1.4 Ωduring
captured and a variance of 0.22 Ω.
the characterization process; each value was
obtained by recording the maximum value of temperature, measured in the capture after
3.2. Thermal Camera Characterization
a stabilization time of 10 s. The concentrated distribution of heat within the heater zone
Figure 4 shows
can be observed images4,captured
in Figure and theduring the characterization
temperature process;to
values correlated each
thevalue was pro-
voltage
obtained by recording the maximum value of temperature, measured in the capture after a
vided, whereby 2 V corresponded to 55.51 °C (Figure 4a) at its peak, 2.5 V corresponded
stabilization time of 10 s. The concentrated distribution of heat within the heater zone can
to 74.15 °C (Figure
be observed 4b), and
in Figure 3 Vthe
4, and corresponded to 80.96
temperature values °C (Figure
correlated 4c).voltage
to the A clearprovided,
heat concen-
tration in the
whereby 2V neighboring
corresponded area of the
to 55.51 ◦ Cheater
(Figurecan
4a) be noted,
at its peak, thus
2.5 V confirming
correspondedthat the selected
to 74.15 ◦C
geometry of the heater allowed for a good ◦ heat concentration area.
(Figure 4b), and 3 V corresponded to 80.96 C (Figure 4c). A clear heat concentration in the
neighboring area of the heater can be noted, thus confirming that the selected geometry of
the heater allowed for a good heat concentration area.
Figure 4. Image capture of the thermal camera with an applied voltage of (a) 2 V (peak temperature of 55.51 ◦ C), (b) 2.5 V
(peak temperature of 74.15 ◦ C), and (c) 3 V (peak temperature of 80.96 ◦ C).
Figure 4. Image capture of the thermal camera with an applied voltage of (a) 2 V (peak temperature of 55.51 °C), (b) 2.5 V
(peak temperature of 74.15 °C), and The
(c) 3 resulting
V (peak temperature of 80.96
characterization °C).
of the heating system by the thermal camera is shown
in Figure 5a, which illustrates the hysteresis behavior of the heater, described by the heating
The resulting
curve (red) and thecharacterization of the heating
cooling curve (blue). system
The heating curvebyshowed
the thermal
a slowcamera is shown
increase in
in Figure 5a, which
temperature illustrates
until an the hysteresis
approximate voltage of 1.6behavior of the heater,
V was provided. After described bypoint,
reaching this the heat-
ing the temperature
curve (red) andwas theobserved to increase
cooling curve at aThe
(blue). constant
heatingrate; this behavior
curve showed can be seen
a slow in in
increase
the heater from 1.8 V until reaching 3 V, indicating that, between these
temperature until an approximate voltage of 1.6 V was provided. After reaching this two conditions, the
heater
point, thecan be considered
temperature to linearly
was observed respond to the supplied
to increase voltage.rate;
at a constant In contrast, the cooling
this behavior can be
curve described a slow decrease in temperature until reaching 70 ◦ C, which corresponds to
seen in the heater from 1.8 V until reaching 3 V, indicating that, between these two condi-
2.3 V when cooling down the microsystem. From this point, the cooling rate was constant
tions, thereturning
until heater can be considered
to room temperature; tothus,
linearly respond to response
the temperature the supplied
of thevoltage. In contrast,
heater could be
the considered
cooling curve
linear until reaching room temperature. This behavior reflects a rather slow°C,
described a slow decrease in temperature until reaching 70 heatwhich
corresponds
dissipationtoof 2.3
the V when
heater cooling down
microsystem the microsystem.
materials, which can be used From this point,
in systems the cooling
that require
rate was constant until returning to room temperature; thus, the temperature response of
the heater could be considered linear until reaching room temperature. This behavior re-
flects a rather slow heat dissipation of the heater microsystem materials, which can be
used in systems that require maintaining a specific temperature over time. The power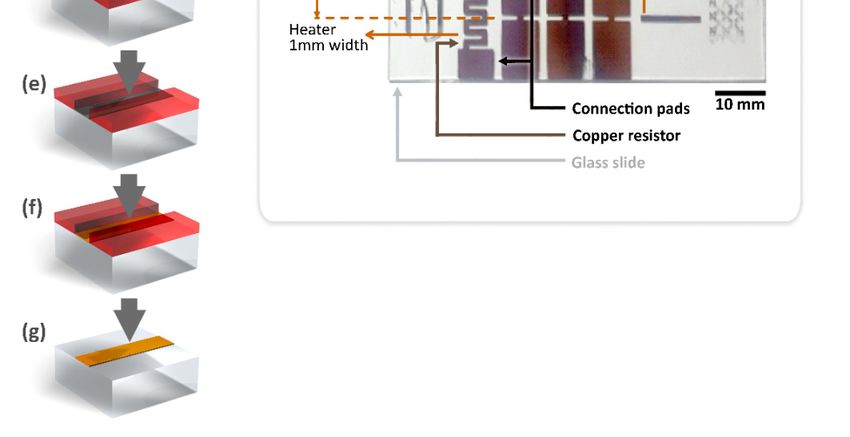
Micromachines 2021, 12, 1067                                                                                               8 of 16

                                       maintaining a specific temperature over time. The power consumption was obtained for
                                       different focal temperature values (Figure 5b), which were measured using an infrared
                                       thermometer. It can be noted that, despite a good response of the heater to the applied
                                       voltage in terms of heating rate time, when compared to the cooling heat dissipation, the
                                       heater requires a relatively larger amount of power to produce heat; thus, if maintained at
Micromachines 2021, 12, x              a constant voltage input, with no control of the consumed power, the system might tend   to17
                                                                                                                              9 of
                                       rise the working temperature. The error range observed in the power characterization can
                                       be attributed to a combination of the error range of voltage, current, and resist measured.

                                                                  (a)

                                                                  (b)
          Figure
      Figure         (a) System
                 5. System
             5. (a)              characterization
                             characterization  forfor
                                                   thethe  thermal
                                                        thermal    camerabased
                                                                 camera    basedinin0.1
                                                                                     0.1VVstep
                                                                                           step changes.
                                                                                                changes; (b)
                                                                                                         (b) Power
                                                                                                             Power consumption
                                                                                                                   consumptionvs.
                                                                                                                               vs.
          temperature   curve. The error bars show  the standard deviation on each  measurement
      temperature curve. The error bars show the standard deviation on each measurement point.    point.

                                    3.3. Heater Characterization Simulation
                                         The heating behavior characterization and power simulation curves are shown in
                                    Figure 6a,b. The heating behavior simulation values were compared with the respective
                                    thermal camera mean values, which yielded an estimate difference of 7.22% for the heat-
                                    ing characterization. The power consumption simulation was implemented through a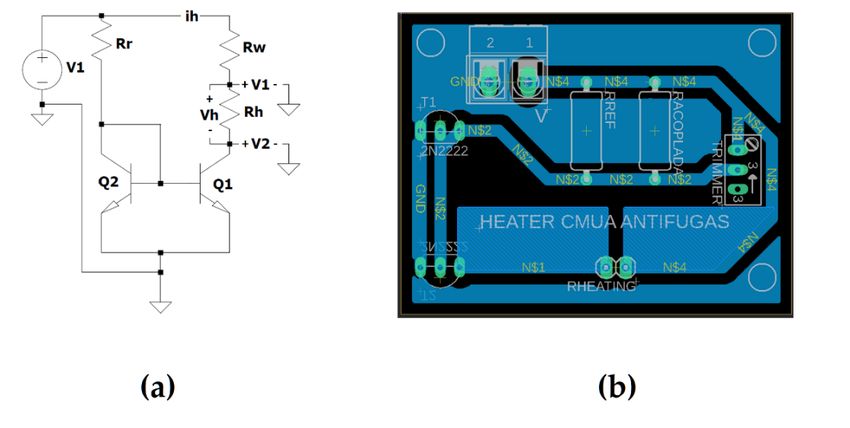
Micromachines 2021, 12, 1067 9 of 16
3.3. Heater Characterization Simulation
The heating behavior characterization and power simulation curves are shown in
Figure 6a,b. The heating behavior simulation values were compared with the respec-
tive thermal camera mean values, which yielded an estimate difference of 7.22% for the
heating characterization. The power consumption simulation was implemented through
a comparison between the temperature and the voltage simulation for the given resis-
tance from the thermal camera characterization, with a 5.42% difference between both
Micromachines 2021, 12, x 10 of 17
values. The acquired curves were used to establish a temperature setpoint, through the
comparison between the electrothermal characterization and its simulation. This value was
selected considering the temperature reference which possessed the least error range in
wastheselected
maximum point 6a).
(Figure of sensibility, defined
Additionally, as the slope
a current of the curve
intensity of 280atmAa given
waspoint [17]. for
measured
Specifically, an applied voltage of 2.47 V, which corresponds to a temperature of 70 ± 3 ◦ C,
the heating system at this reference point. The obtained operation point was used as a
was selected (Figure 6a). Additionally, a current intensity of 280 mA was measured for
constant reference for the heating temperature of the microsystem. The power within this
the heating system at this reference point. The obtained operation point was used as a
heating
constantcontrol range
reference forprovided
the heatingintemperature
the simulationof thewas 0.67 W, which
microsystem. is near
The power to the
within power
this
provided
heating in the measurements,
control range provided inwhere the average
the simulation power
was 0.67 provided
W, which within
is near to the the
power heating
control range
provided in was 0.69 W (Figure
the measurements, 6b). the
where According
average to the comparison
power provided withinprovided in Figure
the heating
6a,b, the behavior
control range wasobserved in the
0.69 W (Figure measurements
6b). According to the differed fromprovided
comparison that predicted
in Figurein6a,b,
the sim-
the behavior observed in the measurements differed from that predicted
ulation for temperatures above 70 °C, which were provided by an input voltage higher in the simulation
for2.6
temperatures above 70can◦ C, which were provided by an input voltage higher than 2.6 V;
than V; this difference be explained by the ideal conditions of the simulation and
this difference can be explained by the ideal conditions of the simulation and the effects of
the effects of the heat on the electric properties of the conductive layer.
the heat on the electric properties of the conductive layer.
100
Heating simulation curve
90
Thermal camera mean curve
80 Heating control point
70
Temperature [°C]
60
50
40
30
20
10
0
0.0 0.2 0.4 0.6 0.8 1.0 1.2 1.4 1.6 1.8 2.0 2.2 2.4 2.6 2.8 3.0 3.2
Voltage [V]
(a)
Figure 6. Cont.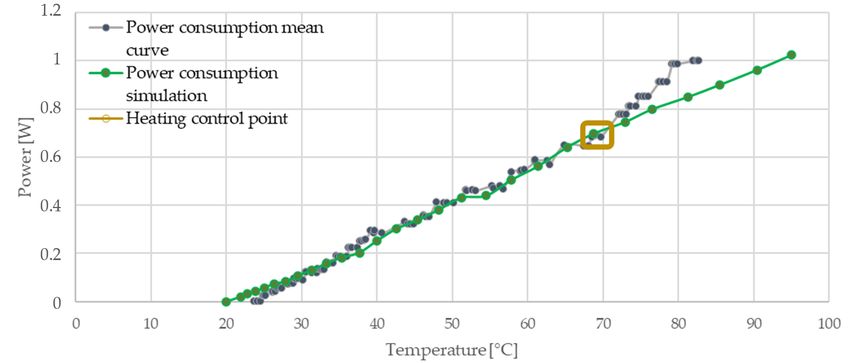
0
                     0.0    0.2        0.4   0.6   0.8    1.0    1.2    1.4       1.6   1.8   2.0   2.2   2.4   2.6   2.8    3.0    3.2

        Micromachines 2021, 12, 1067                                        Voltage [V]                                            10 of 16

                                                                            (a)

                                                                            (b)
              Figure 6. (a) Comparison system characterization between thermal camera mean curve and heating characterization
Figure 6. (a) Comparison      system characterization between thermal camera mean curve and heating characterization curve
              curve behavior simulation based in 0.1 V step changes; (b) comparison between power consumption simulation based on
behavior simulation      based in 0.1 V step changes; (b) comparison between power consumption simulation based on re-
              resistance characterization curve and the mean measurement power consumption vs. temperature curve. Both comparisons
 istance characterization
              have the heatingcurve
                                controland  the
                                        point    mean measurement power consumption vs. temperature curve. Both comparisons
                                              highlighted.
have the heating control point highlighted.
                                              From the reference point selected, a thermal distribution simulation (Figure 7a) was
                                         performed, considering the same electrical and thermal characteristics as used for the
                                       From    the reference
                                         characterization  curvepoint   selected,
                                                                 simulation  and thea same
                                                                                       thermal   distribution
                                                                                           reference            simulation
                                                                                                     voltage provided           (Figure 7a)
                                                                                                                        to the heater,
                                  performed,    considering
                                         for which  the voltage the   same electrical
                                                                 distribution simulation isand
                                                                                            shownthermal   characteristics
                                                                                                    in Figure                   as used for
                                                                                                              7b. The temperature
                                         distribution showed agreement with the thermal images captured during the characteriza-
                                         tion process, due to the thermic dissipation in the material surrounded by the designed
                                         rectangular serpentine geometry. Likewise, it can be observed that the provided voltage
                                         was evenly distributed throughout the heater geometry, which is explained by the divisions
                                         in the serpentine sections, where the lowest resistance is equally divided to focus the
                                         voltage proportionally, thus obtaining the temperature distribution that was previously
                                         observed. The power obtained in the simulation was 0.67 W, and the peak temperature in
                                         the thermal distribution simulation was 69.8 ◦ C, which was adjusted to the thermal camera
                                         characterization and the heating behavior simulation.

                                             3.4. Heating Control Circuit
                                                  The current source was designed and developed to set the current used at the heating
                                             point. The temperature control system design and its simulation were developed imple-
                                             menting 2N2222 transistors, to obtain a collector current of 300 mA, and, although there are
                                             market available mirrors and commercial encapsulated current sources, which are much
                                             more stable in their behavior, they were not able to provide this current intensity.
                                                  The electrical simulation for the circuit worked according to the Figure 8a with an
                                             output of 2.47 V in the heater resistance and a current of 270.5 mA, which represents
                                             the beginning of the chosen work area. Furthermore, as an indicator of good source
                                             performance [20,31], it was found to have an increase of 0.1 V and 10 mA due to the
                                             temperature increase in the circuit. Consequently, the calculated current source was
                                             implemented in a PCB, as observed in Figure 8b, providing the established power to the
                                             heater, in which the current was fixed by a reference resistance with a higher value than in
                                             the simulation, and which, in a parallel configuration with a trimmer, made it possible to
                                             lower the resistance to any specified value, adjusting the resistance value, if necessary, to
                                             change the reference resistance to the point at which the system would be worked.
ions in the serpentine sections, where the lowest resistance is equally divided to focus
he voltage proportionally, thus obtaining the temperature distribution that was previ-
usly observed. The power obtained in the simulation was 0.67 W, and the peak temper-
ture inMicromachines
the thermal distribution simulation was 69.8 °C, which was adjusted to the ther-
2021, 12, 1067 11 of 16
mal camera characterization and the heating behavior simulation.
(a)
(b)
Figure 7. (a) Thermal distribution simulation (◦ C); (b) simulation of the electrical distribution (V), where it was immersed
igure 7. (a)inThermal distribution
water and air simulation
at room temperature, (°C);
with the same (b)sizes
heater simulation
and similar of the electrical
properties distribution
to the heater, (V),
as shown in Table 2.
where it was immersed in water and air at room temperature, with the same heater sizes and similar
roperties to the heater, as shown in Table 2.increase in the circuit. Consequently, the calculated current source was implemented in a
PCB, as observed in Figure 8b, providing the established power to the heater, in which the
current was fixed by a reference resistance with a higher value than in the simulation, and
which, in a parallel configuration with a trimmer, made it possible to lower the resistance
Micromachines 2021, 12, 1067 12 of 16
to any specified value, adjusting the resistance value, if necessary, to change the reference
resistance to the point at which the system would be worked.
Figure 8. Heater circuit design: (a) simulation within reference point, where V1 (source volt-
age circuit)
Figure = 5 circuit
8. Heater V, Rr design:
(reference(a)resistance) 15 Ω, reference
simulation=within Rw (coupling
point,wire resistance)
where Ω,
= 1.4voltage
V1 (source cir-
Rh (homologated resistance heater) = 9.11 Ω, Q1 and Q2 (current mirror 2N2222
cuit) = 5 V, Rr (reference resistance) = 15 Ω, Rw (coupling wire resistance) = 1.4 Ω, Rh (homologated transis-
tors), ih (current
resistance heater)circuit)
= 9.11=Ω, 270.55
Q1 mA,
and V1Q2 (voltage
(current between homologated
mirror 2N2222 resistance
transistors), ih heater
(current and
circuit) =
ground)
270.55 mA, = V1
4.62(voltage
V, V2 (collector–emitter
between homologated Q1 voltage) = 2.16
resistance V, Vh
heater and(resistance
ground) =heater
4.62 V,voltage,
V2 (collector–
V2 − V1)
emitter Q1=voltage)
2.47 V; (b)= PCB
2.16 design
V, Vh with
(resistance heaterresistance
the reference voltage, and
V2 −the
V1) =Ω
100 2.47 V; (b)adjustment
parallel PCB design with
the reference
trimmer; resistance
(b) current andimplemented
source the 100 Ω parallel adjustment trimmer; (b) current source implemented
in a PCB.
in a PCB.
For the evaluation of the current source, a current value of 280 mA and a voltage value
of 2.49 V were observed, where the resistance of the heater was homologated by replacing
For the evaluation of the current source, a current value of 280 mA and a voltage
the heater with a fixed resistance, also including the resistance of the cables and the pads
value of 2.49 V were observed, where the resistance of the heater was homologated by
that surround the heater rectangular serpentine shape at the time of stabilization. Then, the
replacing the heater
printed circuit with
board for a fixed
this current resistance,
source wasalso including
assembled, thearesistance
where voltage of of the
2.52 cables and
V and
the pads that
a current surround
of 283 mA werethe heateratrectangular
achieved its output by serpentine
simulatingshape
the sameat the timeresistance
heating of stabilization.
Then, the printed circuit board for this current source was assembled,
with the homologated resistance value. Lastly, the measurements were 2.53 V of output where a voltage of
2.52 V and
voltage anda 279
current
mA of ofcurrent
283 mAwith weretheachieved
heater and atits
itscoupling
output by simulating the same heating
wires.
resistance with the homologated resistance value. Lastly, the measurements were 2.53 V
3.5. Thermal Characterization
of output voltage and 279 mA of current with the heater and its coupling wires.
The image captures of the thermographic camera allowed observing the temperature
distribution behavior in the microsystem when a flow was applied through the microchan-
3.5. Thermal Characterization
nel with the heater connected to the control circuit, as shown in Figure 9b. The reference
The image
temperature wascaptures
21.3 ◦ C of the thermographic
during the measurements, camera
whichallowed
is shown observing the temperature
at the lower value
distribution
of the scale inbehavior
Figure 9.inThe
themaximum
microsystem when aachieved
temperature flow was in applied
the heaterthrough the micro-
at the stabi-
lization with
channel time was
the heater 71.3 ◦ C. In to
aroundconnected thethe
thermal image
control capture,
circuit, it can in
as shown beFigure
observed9b.that
The refer-
the heater produced a concentrated temperature gradient, which is in agreement
ence temperature was 21.3 °C during the measurements, which is shown at the lower with the
thermal
value of distribution
the scale insimulation;
Figure 9. when the flow wastemperature
The maximum applied, the image shows
achieved inathe
distortion
heater at the
in the otherwise concentrated temperature profile of the heater (Figure 9a), caused by the
convective effect of the liquid, which can be followed thought the flow direction of the
microchannel (Figure 9b).
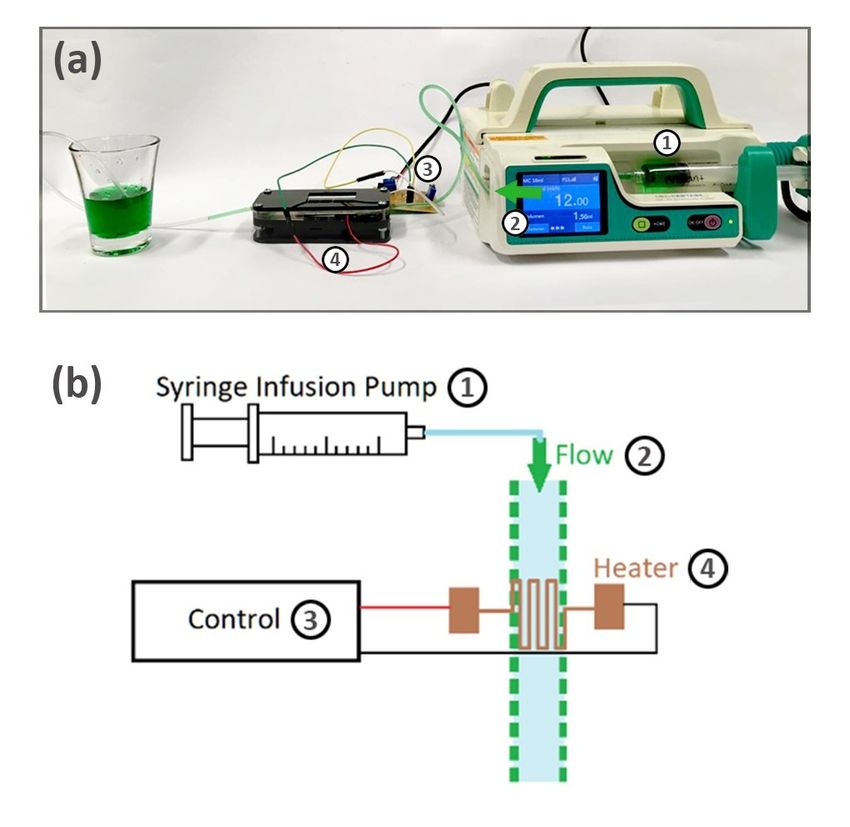
To observe the effects of the heat transfer through convection on the heater surface, the
microsystem was set to operate at a temperature of 115 ◦ C. The flow rates used were 5 mL/h
(Figure 10a), 10 mL/h (Figure 10b), 15 mL/h (Figure 10c), and 20 mL/h (Figure 10d). The
influence of the flow rate on the contour of the heat profile can be noted for each case
studied. While, in the first image capture, the heat profile distribution was seemingly
unaffected by the flow of the ambient temperature liquid, for the next cases, the heat profile
contour showed an elongation, determined by the flow direction, and of a longitude that
could be adjusted as a function of the flow rate. The direct effect of the flow over the heater
surface can also be noted. As the flow rate increased, the convective heat transfer was
more evident, showing a decrease in the temperature recorded at the heater–microchannelMicromachines 2021, 12, 1067 13 of 16
es 2021, 12, x 13 of 17
intersection; this phenomenon was not observed at lower temperatures and can be related
stabilization time was around 71.3 °C. In the thermal image capture, it can be observed
to the large temperature difference between the fluid and the heater surface, as well as the
that the heater produced a concentrated
convective temperature
heat transfer in gradient,
the fluid, which which
prevented theissystem
in agreement with
from completely elevating
the thermal distribution simulation; when the flow was applied, the image shows a
the fluid temperature at the heater focal point. These test results led to the dis-
conclusion that
tortion in the otherwise concentrated
the system temperature
allows keeping profile offocused
the temperature the heater (Figure
in the 9a),zone,
heating caused
evidencing the
by the convectivetemperature
effect of theflow,
liquid, which can be followed thought the flow direction of
which can be used to control the temperature in different processes and
the microchannelto(Figure
develop9b).
thermal flow sensors to monitor changes in the flow across a microsystem.
(a) (b)
2021, 12, x 14 of 17
Figure
Figure 9. 9. Thermographic
Thermographic camera camera
capturescaptures with a controlled
with a controlled flow
flow of 12 of 12 (a)
mL/h: mL/h: (a) full-screen
full-screen capture;
capture; (b) capture in a
(b)photo
combined capture
thatinshows
a combined photo that
the microsystem shows the
focalized microsystem focalized area.
area.
To observe the effects of the heat transfer through convection on the heater surface,
the microsystem was set to operate at a temperature of 115 °C. The flow rates used were
5 mL/h (Figure 10a), 10 mL/h (Figure 10b), 15 mL/h (Figure 10c), and 20 mL/h (Figure 10d).
The influence of the flow rate on the contour of the heat profile can be noted for each case
studied. While, in the first image capture, the heat profile distribution was seemingly un-
affected by the flow of the ambient temperature liquid, for the next cases, the heat profile
contour showed an elongation, determined by the flow direction, and of a longitude that
could be adjusted as a function of the flow rate. The direct effect of the flow over the heater
surface can also be noted. As the flow rate increased, the convective heat transfer was
more evident, showing a decrease in the temperature recorded at the heater–microchannel
intersection; this phenomenon was not observed at lower temperatures and can be related
to the large temperature difference between the fluid and the heater surface, as well as the
convective heat transfer in the fluid, which prevented the system from completely elevat-
ing the fluid temperature at the heater focal point. These test results led to the conclusion
that the system allows keeping the temperature focused in the heating zone, evidencing
the temperature flow, which can be used to control the temperature in different processes
and to develop thermal flow sensors to monitor changes in the flow across a microsystem.
Figure 10. Thermographic camera results in testing with different flows to inspect the heat velocity phenomena: (a) 5 mL/h;
Figure(c)10.
(b) 10 mL/h; 15 Thermographic
mL/h; (d) 20 mL/h.camera results in testing with different flows to inspect the heat
velocity phenomena: (a) 5 mL/h; (b) 10 mL/h; (c) 15 mL/h; (d) 20 mL/h.
4. Discussion
The thermal convection loss integrated into the lab-on-chip fabricated device can be
reduced, with an analysis of the contact resistance between the pads and the cables of theMicromachines 2021, 12, 1067 14 of 16
4. Discussion
The thermal convection loss integrated into the lab-on-chip fabricated device can be
reduced, with an analysis of the contact resistance between the pads and the cables of the
attached sensors and a better understanding on the heat transfer process. For instance,
Jiang [12], Byers [21], and Tiwari [22] used a time response of the temperature for a specified
provided voltage, which can be very useful to describe the transient thermal analysis [3]. In
the work of Jiang [12], this temporal curve characterization with hysteresis was developed,
showing the fluid heating response for a provided pulsating power between 0.2 W and
3.2 W, and a flow rate of 4 mL/min, demonstrating the rapid heat transfer process when
a liquid flow is applied, which, although not considered in that work, provides a key
characteristic for use in microsystem flow sensors.
The common theoretical resistance calculated in this work was less than the practical
resistance measured with respect to the heater, which is related to the effects of resistivity
on thin films that should be considered with a different model. In the model presented
by Byers [21], a resistor performance analysis in terms of response time was used, which
can be advantageous. An appropriate model can be used for materials that are reduced to
dimensions on the nanoscale, in which many of the common properties or characteristics
are no longer valid; likewise, it has been shown that the mechanical, thermodynamic,
electrical, and optical properties are altered due to size differences. The reasons for this
change in properties are related to increased surface interactions, as well as absorption and
dispersion effects [32].
Diverse approaches have been used to date for fabricating microheaters; for example,
Byers [22] and Tiwari [23] presented printed microheaters, in both cases, using COMSOL
for modeling temperature and voltage distributions, which achieved temperatures up to
67 ◦ C and 100 ◦ C, respectively. In the case of PVD microheaters, Scorzoni [20] showed a
similar method to the current work, using PVD to attain a Cr/Al/Cr resistive thin film. The
experimental characterization used in that work presented a different linear behavior of
the response curves in a measurement of the resistance of four terminals, for a temperature
range of 40 ◦ C to 90 ◦ C, highlighting the benefits of serpentine shaped microheaters, as
well as using simulation to calculate a more efficient geometry, changing the transverse
direction, the linewidth, and the line-gaps, where these changes extend the temperature
uniformity along the microheater. In this respect, as exposed by Wu [33], serpentine heaters
are more flexible than spiral heaters in achieving heat surface uniformity and, thus, a larger
temperature distribution area. These characteristics allow considering serpentine-based
heaters as a good candidate for ultralow-power microheater devices [34], as well as for
applications of fluid flow measurement.
Lastly, it can be observed that other materials, such as gold, used in a similar fashion
to copper, with similar development techniques, reflect a better response time for resis-
tance [23]. On the other hand, platinum, in the prospective characterization process for
microheaters, may decrease the response time and allow for a more linear characterization
curve, using a wider temperature range, as shown by Garraud who used a Pt layer with
PVD techniques in a heater to maintain a 37 ◦ C temperature [24], at the expense of increas-
ing material costs for production. In comparison, the copper–chromium heater had a better
temperature response to the power applied (71.3 ◦ C for 0.7 W) than other materials such as
aluminum in the microheater built by Nieto [25] over a soda–lime glass substrate covered
with an aluminum layer with a thickness of 120 nm (71.3 ◦ C for 0.94 W). Moreover, the
current approach also introduced a microsystem integration with techniques that can be
used outside of a clean room facility, which can be a desired characteristic for research in
emerging countries.
5. Conclusions
A PMMA microfluidic system microsystem that incorporates a copper–chrome-based
glass heater was designed, simulated, and characterized by a hysteresis process for a
voltage range of 0 V to 3.2 V, corresponding to temperatures between 20 ◦ C and 85 ◦ C. TheMicromachines 2021, 12, 1067 15 of 16
microsystem was built and integrated with a temperature control to use at the temperature
reference point. The system was simulated for 2.47 V and a power of 0.67 W, with a resulting
temperature of 69.8 ◦ C, at a room temperature of 20 ◦ C. The microsystem produced a
temperature of 71.3 ◦ C in measurements at a room temperature of ~21.3 ◦ C, with a provided
voltage of 2.53 V and a current of 279 mA (0.70 W of power).
The electrothermal results supported the simulation, with a 7.22% error for the heating
characterization and a 5.42% error for the power consumption. Furthermore, the chosen
reference temperature point backed up the distribution temperature and voltage, which
concluded that the system can be used to control the temperature in different processes
and to develop thermal flow sensors, with the advantage of having the flexibility of being
coupled in different systems, as well as having optical transparency and repeatability in its
fabrication, specifically in the vapor deposition process.
Author Contributions: Conceptualization, C.A.H. and J.F.O.; methodology, C.A.H. and S.T.; software,
C.A.H. and S.T.; validation, C.A.H. and S.T.; formal analysis, C.A.H. and S.T.; investigation, C.A.H.
and S.T.; resources, J.F.O.; data curation, C.A.H. and S.T.; writing—original draft preparation, C.A.H.
and S.T.; writing—review and editing, C.A.H., J.F.O. and S.T.; visualization, C.A.H., J.F.O. and S.T.;
supervision, C.A.H. and J.F.O.; project administration, J.F.O.; funding acquisition, J.F.O. All authors
have read and agreed to the published version of the manuscript.
Funding: The work of C.A.H. was founded by the Colombian Ministry of Education and the
Administrative Department of Science, Technology, and Innovation, MinCiencias, through the
program for national doctorates, grant 567.
Acknowledgments: The authors want to acknowledge the technical contribution to the cleanroom
of the Department of Electrical and Electronics Engineering, especially Alfredo Sanchez, in the heater
fabrication process, as well as Juliana Noguera, Paula Peñaranda, Ana Lucia Campaña, Diana Sotelo,
and Andres Aranguren, master’s students in the Electrical and Electronic Engineering Department,
in support of the microsystem fabrication process, and Brayan Ariza, undergraduate in the Electronic
Engineering Department, for the characterization and calibration curves with the thermal camera.
Conflicts of Interest: The authors declare no conflict of interest.
References
1. Khan, B.; Ahmed, S.; Kakkar, V. A Comparative Analysis of Thermal Flow Sensing in Biomedical Applications. Int. J. Biomed. Eng.
Sci. 2016, 3, 1–7. [CrossRef]
2. Das, S.; Kumar, R.; Singh, J.; Kumar, M. Fabrication of Microsensor for Detection of Low-Concentration Formaldehyde Gas in
Formalin-Treated Fish. IEEE Trans. Electron. Devices 2020, 67, 5710–5716. [CrossRef]
3. Jung, G.; Hong, Y.; Hong, S.; Jang, D.; Jeong, Y.; Shin, W.; Park, J.; Kim, D.; Jeong, C.B.; Kim, D.U.; et al. A low-power embedded
poly-Si micro-heater for gas sensor platform based on a FET transducer and its application for NO2 sensing. Sens. Actuators B
Chem. 2021, 334, 129642. [CrossRef]
4. Paun, C.; Tomescu, R.; Cristea, D.; Ionescu, O.; Parvulescu, C. Design, fabrication and caracterization of a micro-heater for
metasurface-based gas sensors. In Proceedings of the 2020 International Semiconductor Conference (CAS), Sinaia, Romania, 7–9
October 2020; pp. 31–34. [CrossRef]
5. Keshavaditya, G.; Eranna, G.R.; Eranna, G. PRT embedded microheaters for optimum temperature distribution of air-suspended
structures for gas sensor applications. IEEE Sens. J. 2015, 15, 4137–4140. [CrossRef]
6. Bagga, S.; Akhtar, J.; Mishra, S. Preeti Fabrication of coplanar microheater platform for LPG sensing applications. Microsyst.
Technol. 2020, 26, 731–738. [CrossRef]
7. Ricci, P.P.; Gregory, O.J. Free-standing, thin-film sensors for the trace detection of explosives. Sci. Rep. 2021, 11, 2–11. [CrossRef]
8. Rezania, A.; Rosendahl, L.A. Thermal effect of a thermoelectric generator on parallel microchannel heat sink. Energy 2012, 37,
220–227. [CrossRef]
9. Hayakawa, T.; Sakuma, S.; Fukuhara, T.; Yokoyama, Y.; Arai, F. A Single Cell Extraction Chip Using Vibration-Induced Whirling
Flow and a Thermo-Responsive Gel Pattern. Micromachines 2014, 5, 681–696. [CrossRef]
10. Hernandez, C.A.; Beni, V.; Osma, J.F. Fully automated microsystem for unmediated electrochemical characterization, visualization
and monitoring of bacteria on solid media; E. coli K-12: A case study. Biosensors 2019, 9, 131. [CrossRef]
11. Velve-casquillas, G.; Le, M.; Piel, M.; Tran, P.T. Microfluidic tools for cell biological research. Nano Today 2010, 5, 28–47. [CrossRef]
12. Jiang, L.; Wong, M.; Zohar, Y. Unsteady characteristics of a thermal microsystem. Sens. Actuators A Phys. 2000, 82, 108–113.
[CrossRef]Micromachines 2021, 12, 1067 16 of 16
13. Lagally, E.T.; Emrich, C.A.; Mathies, R.A. Fully integrated PCR-capillary electrophoresis microsystem for DNA analysis. Lab Chip
2001, 1, 102–107. [CrossRef] [PubMed]
14. Liu, X.; Li, L.; Mason, A.J. Thermal Control Microsystem for Protein Characterization and Sensing. In Proceedings of the 2009
IEEE Biomedical Circuits and Systems Conference, Beijing, China, 26–28 November 2009; pp. 277–280.
15. Tvarogek, V.; Tienb, H.T.; Novotny, I. Thin-film microsystem applicable in (bio) chemical sensors. Sens. Actuators B Chem. 1994,
19, 597–602. [CrossRef]
16. Bermudez, J.F.; Saldarriaga, J.F.; Osma, J.F. Portable and low-cost respirometric microsystem for the static and dynamic respirom-
etry monitoring of compost. Sensors 2019, 19, 4132. [CrossRef] [PubMed]
17. Wojtas, N.; Hierold, C. Microfluidic heat transfer systems optimized for thermoelectric heat exchangers. In Proceedings of the
2013 Transducers & Eurosensors XXVII: The 17th International Conference on Solid-State Sensors, Actuators and Microsystems
(TRANSDUCERS & EUROSENSORS XXVII), Barcelona, Spain, 16–20 June 2013; pp. 1368–1371. [CrossRef]
18. Pawlak, R.; Lebioda, M. Electrical and thermal properties of heater-sensor microsystems patterned in TCO films for wide-range
temperature applications from 15 K to 350 K. Sensors 2018, 18, 1831. [CrossRef] [PubMed]
19. Je, J.; Lee, J. Design, Fabrication, and Characterization of Liquid Metal Microheaters. Microelectromech. Syst. 2014, 23, 1156–1163.
20. Scorzoni, A.; Caputo, D.; Petrucci, G.; Placidi, P.; Zampolli, S.; de Cesare, G.; Tavernelli, M.; Nascetti, A. Design and experimental
characterization of thin film heaters on glass substrate for Lab-on-Chip applications. Sens. Actuators A Phys. 2015, 229, 203–210.
[CrossRef]
21. Byers, K.M.; Lin, L.K.; Moehling, T.J.; Stanciu, L.; Linnes, J.C. Versatile printed microheaters to enable low-power thermal control
in paper diagnostics. Analyst 2020, 145, 184–196. [CrossRef]
22. Tiwari, S.K.; Bhat, S.; Mahato, K.K. Design and fabrication of screen printed microheater. Microsyst. Technol. 2018, 24, 3273–3281.
[CrossRef]
23. Gregorini, M.; Grass, R.N.; Stark, W.J. One-Step Photolithographic Surface Patterning of Nanometer-Thick Gold Surfaces by
Using a Commercial DLP Projector and the Fabrication of a Microheater. Ind. Eng. Chem. Res. 2020, 59, 12048–12055. [CrossRef]
24. Garraud, A.; Basrour, S.; Peyrade, D. Fabrication of a Multiple Heater-Sensor Platform for Cell Temperature Monitoring. In
Proceedings of the 2020 Symposium on Design, Test, Integration & Packaging of MEMS and MOEMS (DTIP), Lyon, France, 15–26
June 2020; pp. 20–23. [CrossRef]
25. Nieto, D.; McGlynn, P.; de la Fuente, M.; Lopez-Lopez, R.; O’connor, G.M. Laser microfabrication of a microheater chip for cell
culture outside a cell incubator. Colloids Surf. B Biointerfaces 2017, 154, 263–269. [CrossRef]
26. Aranguren, A.; Torres, C.E.; Muñoz-Camargo, C.; Osma, J.F.; Cruz, J.C. Synthesis of Nanoscale Liposomes via Low-Cost
Microfluidic Systems. Micromachines 2020, 11, 1050. [CrossRef]
27. Campaña, A.L.; Sotelo, D.C.; Oliva, H.A.; Aranguren, A.; Ornelas-Soto, N.; Cruz, J.C.; Osma, J.F. Fabrication and characterization
of a low-cost microfluidic system for the manufacture of alginate-lacasse microcapsules. Polymers 2020, 12, 1158. [CrossRef]
[PubMed]
28. Perez, M.A. Instrumentación Electrónica; Paraninfo Ediciones: Madrid, Spain, 2014; pp. 7–12. ISBN 8428337020.
29. Khabari, A.; Zenouzi, M.; Connor, T.O.; Rodas, A. Natural and Forced Convective Heat Transfer Analysis of Nanostructured
Surface. In Proceedings of the World Congress on Engineering, London, UK, 2–4 July 2014; Volume I, pp. 7–9.
30. Serway, R.A.; Jewett, J.W., Jr. Physics for Scientists and Engineers with Modern Physics, 9th ed.; Brooks/Cole: Boston, MA, USA, 2014;
ISBN 9781133954057.
31. Cadar, S. Simulation & Modelling of a Tungsten Filament with COMSOL for Electrothermal Process. In Proceedings of the 2016
IEEE 22nd International Symposium for Design and Technology in Electronic Packaging (SIITME), Oradea, Romania, 20–23
October 2016; pp. 165–170.
32. Lacy, F. Developing a theoretical relationship between electrical resistivity, temperature, and film thickness for conductors.
Nanoscale Res. Lett. 2011, 6, 263501. [CrossRef] [PubMed]
33. Wu, Y.; Du, X.; Li, Y.; Tai, H.; Su, Y. Optimization of temperature uniformity of a serpentine thin film heater by a two-dimensional
approach. Microsyst. Technol. 2019, 25, 69–82. [CrossRef]
34. Mahdi, M. Ultra-low power MEMS micro-heater device. Microsyst. Technol. 2021, 27, 2913–2917. [CrossRef]You can also read