Machining of Inserts with PCD Cutting-Edge Technology and Determination of Optimum Machining Conditions Based on Roundness Deviation and ...
←
→
Page content transcription
If your browser does not render page correctly, please read the page content below
processes
Article
Machining of Inserts with PCD Cutting-Edge Technology and
Determination of Optimum Machining Conditions Based on
Roundness Deviation and Chip-Cross Section of AW 5083
AL-Alloy Verified with Grey Relation Analysis
Martin Miškiv-Pavlík *                    and Jozef Jurko

                                            Department of Industrial Engineering and Informatics, Faculty of Manufacturing Technologies,
                                            Technical University of Košice, Bayerova 1, 08001 Prešov, Slovakia; jozef.jurko@tuke.sk
                                            * Correspondence: martin.miskiv-pavlik@tuke.sk; Tel.: +421-55-602-6402

                                            Abstract: This paper describes the important significance of cutting-edge technology in the machining
                                            of polycrystalline diamond (PCD) cutting inserts by comparing the evaluation criteria. The LASER
                                            technology of cutting-edge machining is compared with grinding and electrical discharge machining
                                            (EDM) technologies. To evaluate the data from the experiments, the Grey Relational Analysis
                                            (GRA) method was used to optimize the input factors of turning to achieve the required output
                                  parameters, namely the deviation of roundness and chip cross-section. The input factors of cutting
                                     speed, feed rate, depth of cut and corner radius were applied in the experiment for three different
Citation: Miškiv-Pavlík, M.; Jurko, J.      levels (minimum, medium and maximum). The optimal input factors for turning of aluminum
Machining of Inserts with PCD               alloy (AW 5083) were determined for the factorial plan according to Grey Relational Grade based on
Cutting-Edge Technology and                 the GRA method for the multi-criteria of the output parameters. The results were confirmed by a
Determination of Optimum                    verification test according to the GRA method and optimal values of input factors were recommended
Machining Conditions Based on               for the machining of Al-alloy (AW 5083) products. This material is currently being developed by
Roundness Deviation and Chip-Cross
                                            engineers for forming selected components for the automotive and railway industries, mainly to
Section of AW 5083 AL-Alloy Verified
                                            reduce weight and energy costs. The best values of the output parameters were obtained at a cutting
with Grey Relation Analysis. Processes
                                            speed of 870 m/min, feed rate of 0.1 mm/min, depth of cut of 0.5 mm and a corner radius of 1.2 mm.
2021, 9, 1485. https://doi.org/
10.3390/pr9091485
                                            Keywords: cutting edge; roundness deviation; EDM; laser; grinding; PCD; grey relation analysis;
Academic Editors: Anna Trubetskaya
                                            turning; AW 5083
and Lara Carvalho

Received: 2 July 2021
Accepted: 22 August 2021                    1. Introduction
Published: 24 August 2021                        In machining, the main focus is on reducing machining times while maintaining or
                                            improving the quality of the material being machined [1]. To achieve this, cutting tools
Publisher’s Note: MDPI stays neutral        with the required better properties (e.g., hardness, cutting edge strength, tool life and
with regard to jurisdictional claims in     wear resistance) must be used [2]. The cutting materials that meet the required properties
published maps and institutional affil-     such as hardness and wear resistance include the so-called super hard cutting materials
iations.
                                            such as polycrystalline cubic diamond (PCD) and polycrystalline cubic boron nitride
                                            (PCBN) [3]. PCD can be defined as an artificial material consisting of the transformation of
                                            graphite with hexagonal lattice into a cubic lattice of diamond under the influence of high
                                            temperature and pressure and using a small amount of catalysts [4]. Super hard cutting
Copyright: © 2021 by the authors.           materials have become permanently established in the range of global manufacturers who
Licensee MDPI, Basel, Switzerland.          are constantly trying to innovate them and develop new methods in the manufacture of
This article is an open access article      PCD tools [5]. The modern trend is to combine properties of known cutting materials
distributed under the terms and             such as coating sintered carbides with synthetic diamond or cubic boron nitride, which
conditions of the Creative Commons
                                            is constantly evolving [6]. Replaceable inserts with a cutting edge of PCD material are an
Attribution (CC BY) license (https://
                                            essential component in the rational machining of non-ferrous materials and for achieving
creativecommons.org/licenses/by/
                                            the required quality of the machined surface for roundness deviation and the performance
4.0/).

Processes 2021, 9, 1485. https://doi.org/10.3390/pr9091485                                                  https://www.mdpi.com/journal/processes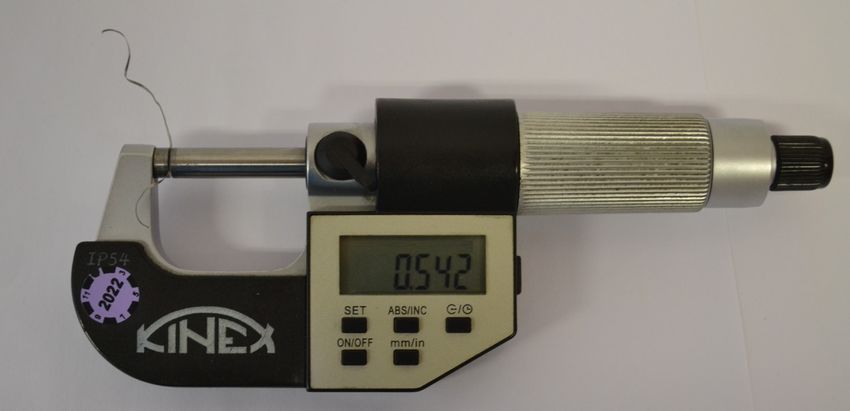
Processes 2021, 9, 1485                                                                                             2 of 27

                          of chip cross-section in finishing operations [7]. When using diamond cutting tools for
                          machining ferrous base materials (e.g., steel, cast iron), there is usually a high degree of
                          diffusion between the tool and the material to be machined and thus very rapid wear due
                          to ongoing chemical reactions (especially on the tool edge) [8]. Therefore, we must not use
                          diamond tools for machining ferrous materials.
                               The applications of PCD cutting materials are mainly in turning all pure nonferrous
                          metals and nonferrous materials with little or no abrasive filler content [9]. Among the
                          most commonly used nonferrous materials are aluminum alloys, which are used not only
                          in mechanical engineering but also in many other industries [10]. Aluminum-manganese
                          alloys have excellent corrosion resistance, good weld ability, and formability—properties
                          that are highly sought after in mechanical engineering [11]. Due to their natural hardness,
                          corrosion resistance and light weight nature, aluminum-based alloys, such as EN AW 5083,
                          are increasingly being used to replace heavy iron-based materials, especially steels, such
                          as in automotive aggregates [12]. By using lightweight aluminum alloys, it is possible to
                          lighten the vehicle by up to one third of the aggregate weight [13]. Another alternative is
                          to turn the ignition flanges from aluminum alloy EN AW 5083 with PCD cutting inserts
                          for off-road engines. This reduces the weight of the engine while increasing the corrosion
                          resistance. The use of the material EN AW 5083 can also be found in shipbuilding or
                          hydraulic lines in aircraft [14–16].
                               The manufacture and machining of PCD cutting tools has been covered by a number
                          of authors. One of the conventional methods for machining PCD materials is grinding [17].
                          In their article Wu and Li et al. presented the results that cutting inserts manufactured by
                          grinding have longer tool life than those manufactured by another technology described by
                          him such as electrical discharge machining (EDM) [18]. Rahim et al. in his paper compared
                          tool edge machining by grinding and electrical discharge machining (EDM) for machining
                          PCD material. He presented the research results with the following conclusion and that in
                          terms of achieving the required surface roughness parameter Ra both methods achieved
                          almost the same surface roughness but in EDM technology, the diamond was converted
                          to graphite at elevated temperature which resulted in degradation of the cutting tool [19].
                          In their article, Li and Rahim et al. analyzed the wear of PCD cutting tools machined by
                          different electrical discharge machining (EDM) methods and then tested them on titanium
                          alloy Ti-6AL-4V with different cutting conditions. The research focused on the analysis of
                          the negative phenomena in the production process and their influence on the change of
                          damage, i.e., wear of the cutting part of the tool [20]. Jia and Li et al. analyzed the machining
                          of PCD tool by EDM technique using different types of cutting wire. The surface properties
                          of the material were studied using X-ray diffraction method [21]. In conventional PCD tool
                          grinding, it is necessary to use a grinding wheel with the same hardness as diamond, and
                          yet significant wear occurs when grinding the tool edges. Therefore, You and Fang et al.
                          proposed to use LASER machining when machining the cutting edges of PCD tools. This
                          machining method does not cause mechanical wear, which is an innovative alternative for
                          manufacturing and machining tools made of PCD material [22].
                               Brecher et al. suggested using LASER to machine the cutting edges of PCD tools. He
                          also suggested using LASER only for finishing operations such as selective sharpening
                          of cutting edges. because the entire machining process with LASER takes much longer
                          than conventional grinding or EDM. By combining grinding and LASER it is possible to
                          save up to 50% of the total time required to machine cutting tools [23]. Dold et al. applied
                          the method of short pico-second pulses in machining cutting edges with LASER, which
                          resulted in better wear resistance of the tools and thus increased tool life in machining
                          carbon fiber materials compared to conventional grinding [24].
                               On the subject of machining and the use of PCD tools, various publications can be
                          found that analyze the influence of changes in cutting conditions on the wear of the tool
                          cutting edge on tool life or on the quality of machining the workpiece with PCD tools [25].
                          However, many publications consist of an analysis of only one type of PCD machining such
                          as grinding, EDM or LASER. The machining of innovative materials based on titanium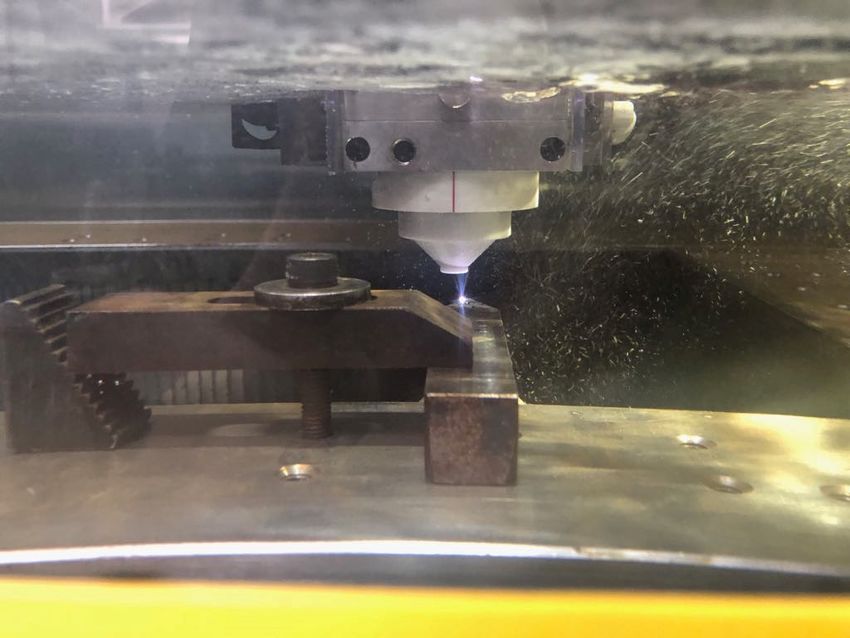
Processes 2021, 9, 1485                                                                                             3 of 27

                          and aluminum lightweight alloys for the aerospace and automotive industries is of great
                          importance [26].
                                Wang et al. applied the method GRA to optimize the input factors in turning according
                          to several criteria. In their research, they showed the importance of the method GRA for
                          integrating multiple output parameters and determining the required input factors [27].
                          Huh et al. present the results of the evaluation of an aluminum alloy product with a
                          cylindrical surface. The article concludes that the optimum combination of process output
                          parameters was determined from numerical results and confirmed by experiments. The
                          analysis is carried out using fractional model and Taguchi method to evaluate the effects
                          of process parameters, such as chip shape and roundness (curvature) of the aluminum
                          pipe [28]. Zhennan et al. presented in their paper that roundness and surface roughness are
                          important quality characteristics of machined cylindrical products. The optimum output
                          machining parameters were determined by using GRA and the main machining parameters
                          that affect the machining performance. They can be determined by the difference between
                          the maximum and minimum GRG values. The experimental results have shown that the
                          roundness and surface roughness of the machined surfaces can be effectively improved by
                          the proposed approach [29]. Mekid in his article presents the result of a new method for
                          measuring the deviation of roundness, which is an important parameter in the evaluation
                          of quality on cylindrical surfaces of components [30]. Śniegulska et al. presented in their
                          paper an important factor of the chip cross-section by the modeling of the cutting force to
                          solve the problem of complete plastic deformation of the chip cross-section [31]. Both Yalcin
                          and Kundrák et al. in their studies present the results of milling and turning points out the
                          importance of the chip cross-section in designing the cutting conditions and eliminating
                          the stress on the cutting edge of tools [32,33].
                                This paper presents the results of a research that can be divided into two phases. In
                          the first phase of the research, the results of the influence of three different technologies on
                          the machining quality of the cutting edges of replaceable inserts designated DCGW 11T308
                          with a cutting edge made of super-hard polycrystalline diamond (PCD) are presented. The
                          inserts were fabricated using three different technologies, namely: grinding, LASER and
                          electroerosive cutting (EDM). The experimental part of the work includes machining the
                          cutting edges, measuring the total time taken to produce the cutting edges, measuring the
                          radius of the cutting edge and measuring the roughness surface of the cutting part below
                          the main cutting edge. Based on the analysis of these parameters, the manufactured cutting
                          insert with the best parameters was recommended and selected for the production process.
                                The second phase of the research represents the optimization of input factors for
                          machining a semi-finished product of the aluminum bar with a diameter of 160 mm and a
                          length of 200 mm made of the aluminum alloy AW 5083 (AlMg4.5Mn0.7) by DCGW 11T308
                          cutting insert. To determine the influence of selected input factors (cutting speed, feed rate,
                          depth of cut and corner radius) during turning on the output quality and performance
                          parameters, the Gray Relational Analysis method was applied.
                                The achievement of the required quality parameter of the roundness deviation and
                          performance parameter of the chip cross-section were designed to increase the quality of
                          the machined surface and to prevent the outgoing chips from damaging the machined
                          surface. The roundness deviation was chosen on the basis of the requirements for the
                          manufacture of certain products.

                          2. Experimental Conditions and Procedure
                               The essence of the cutting process performed in the cutting zone is to create a new
                          surface with defined properties. These properties can be evaluated as internal and external
                          properties of the new surface. The new surface can be defined as a function of the interaction
                          between the cutting edge of the tool and the machined surface on the workpiece. The result
                          of this interaction in the cutting zone is a machined surface, the formation of a plastically
                          deformed material in the form of chips and a worn cutting edge. The wear of the cutting
                          edge surface and the chips depends on several factors. Very important are the cutting speed,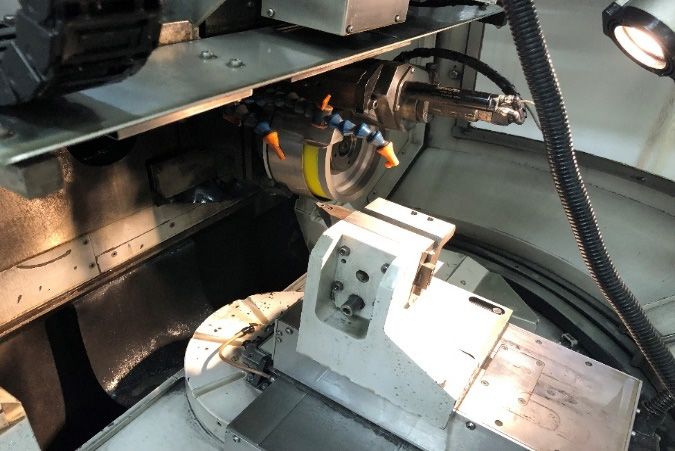
2. Experimental Conditions and Procedure
The essence of the cutting process performed in the cutting zone is to create a new
surface with defined properties. These properties can be evaluated as internal and exter‐
nal properties of the new surface. The new surface can be defined as a function of the
Processes 2021, 9, 1485 interaction between the cutting edge of the tool and the machined surface on the work‐ 4 of 27
piece. The result of this interaction in the cutting zone is a machined surface, the formation
of a plastically deformed material in the form of chips and a worn cutting edge. The wear
of the cutting edge surface and the chips depends on several factors. Very important are
the
the feed rate,speed,
cutting depth the
of cut (orrate,
feed size of allowance)
depth the size
of cut (or geometry of the cutting
of allowance) part of theoftool
the geometry the
the
cutting part of the tool the cutting material and others for external analysis of thesurface.
cutting material and others for external analysis of the quality of the machined quality
These
of the are mainly surface.
machined the parameters
These are of mainly
surface the
roughness and of
parameters thesurface
dimensional parameters
roughness and the
of the machined surface deviation from the nominal dimension and the
dimensional parameters of the machined surface deviation from the nominal dimension deviations of the
shape are important. The basic input factors were cutting speed V (m/min),
and the deviations of the shape are important. The basic input factors were cutting speed feed rate F
(mm), depthfeed
V (m/min), of cut ApF (mm)
rate (mm),anddepthcorner radius
of cut A (mm)Rε (mm). The input
and corner factors
radius were designed
R (mm). The input
for three different levels, minimum (lower), medium (medium) and maximum (upper),
factors were designed for three different levels, minimum (lower), medium (medium) and
mainly based on practical experience. These input factors for the three levels are listed in
maximum (upper), mainly based on practical experience. These input factors for the three
Table 1.
levels are listed in Table 1.
Table 1. Values of input factor levels.
Table 1. Values of input factor levels.
A B C D
Factor Level
A
Cutting Speed
B
Feed Rate
C
Depth of Cut
D
Corner Radius
Factor Level Cutting Speed
(m/min) Feed Rate
(mm/rev) Depth of Cut
(mm) Corner(mm)
Radius
Lower (−1) (m/min)
450 (mm/rev)
0.1 (mm) 0.1 (mm)
0.4
Lower (−1)
Medium (0) 450
660 0.1
0.2 0.1 0.3 0.4
0.8
Upper (+1)
Medium (0) 870
660 0.3
0.2 0.3 0.5 1.2
0.8
Upper (+1) 870 0.3 0.5 1.2
The technological system M-T-O-F by which we define the production process consists
The technological
of a machine system
(M) a tool (T) M‐T‐O‐F
an object by which
(O) and we(F).
a fixture define
This the production
technological process
system cancon‐
be
sists of a machine (M)
described by the model: a tool (T) an object (O) and a fixture (F). This technological system
can be described by the model:
TS = M + T(TH + TCI ) + O + F(FT + FO ) (1)
TS = M + T(TH + TCI) + O + F(FT + FO) (1)
M
M(Machine)
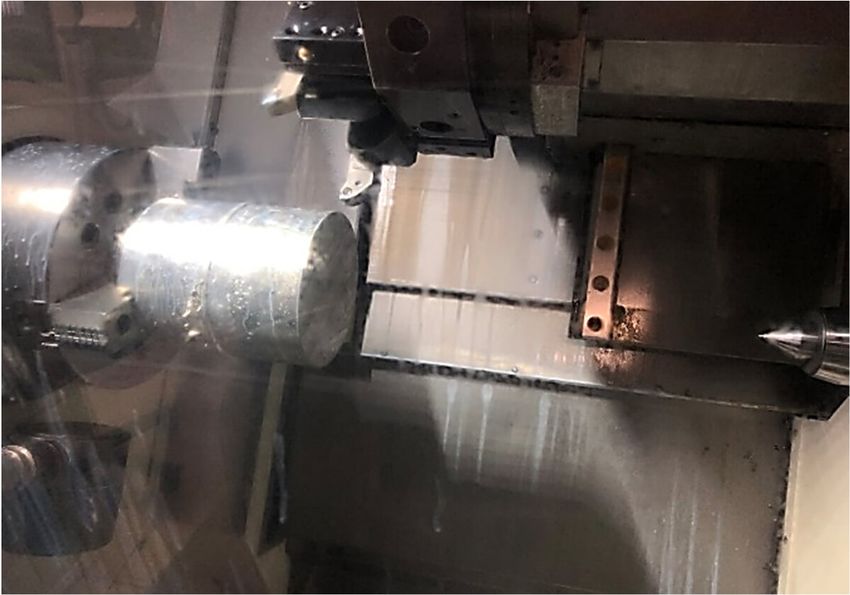
(Machine) aa high
high precision lathe was
precision lathe wasused
usedfor
forthe
theexperiments
experiments(DMG
(DMGMori
Mori eco
eco
Turn 450) turning center as shown in Figure 1.
Turn 450) turning center as shown in Figure 1.
Figure 1.
Figure 1. Working
Workingzone
zoneof
ofthe
theDMG
DMGMori
Morieco
ecoTurn
Turn450
450turning
turningcenter.
center.
T (Tool); the tool consists of a tool holder (TH) and a cutting insert (TCI). Cutting
inserts DCGW 11T308 were used for the experiments. The standard dimensions of the
insert according to the standard ISO are length 19.65 mm and height 3.97 mm. The diameter
of the insert in the axis is 9.525 mm. The changeable cutting inserts made of super hard
cutting materials are manufactured in two layers. A disk of polycrystalline diamond is
brazed onto the carbide substrate. The disk contains a brazed tip made of the material
PCD-CTB 010 with a length of 2.77 mm and a depth of 1.6 mm. The corner radius is 0.8 mm
and the tip angle is 55, as shown in the AutoCAD model in Figure 2.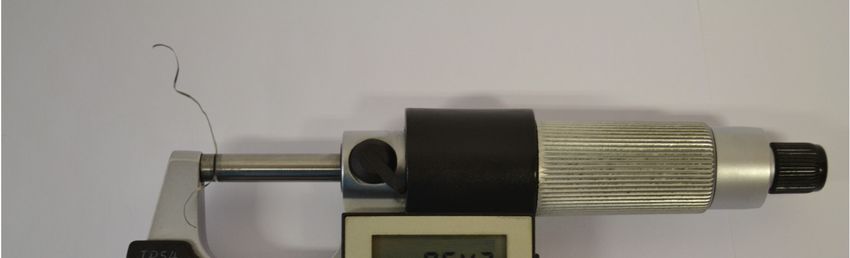
insert according to the standard ISO are length 19.65 mm and height 3.97 mm. The diam‐
                          eter of the insert in the axis is 9.525 mm. The changeable cutting inserts made of super
                          hard cutting materials are manufactured in two layers. A disk of polycrystalline diamond
                          is brazed onto the carbide substrate. The disk contains a brazed tip made of the material
Processes 2021, 9, 1485
                          PCD‐CTB 010 with a length of 2.77 mm and a depth of 1.6 mm. The corner radius is 0.8  5 of 27
                          mm and the tip angle is 55, as shown in the AutoCAD model in Figure 2.

                             Figure
                          Figure    2. Cutting
                                 2. Cutting    insert
                                            insert    model
                                                   model    DCGW
                                                         DCGW    11T308.
                                                               11T308.

                                 ELementSix brand PCD material characterized by the properties listed in Table 2 was
                              ELementSix brand PCD material characterized by the properties listed in Table 2 was
                            used as a semi-finished product for the manufacture of a plate from PCD (SVJCR 2525
                          used as a semi‐finished product for the manufacture of a plate from PCD (SVJCR 2525
                            M16-M-A-9024123323) according to ISO norm was used as the blade holder.
                          M16‐M‐A‐9024123323) according to ISO norm was used as the blade holder.
                            Table 2. Basic properties of PCD material [14].
                          Table 2. Basic properties of PCD material [14].
                               Basic Properties of PVD-VTB 010 Material                     PCD-CTB 010
                           Basic Properties of PVD‐VTB 010 Material                      PCD‐CTB 010
                                                Grain size
                                             Grain size                                      1010μmµm
                                                 Density                                     4.08 g/cm3
                                              Density
                                                 Binder
                                                                                           4.08 Cobalt
                                                                                                g/cm
                                               Binder
                                         Thermal Conductivity                                Cobalt
                                                                                             501 W/m·K
                                      Thermal   Conductivity
                                            Thermal Diffusion                             501 ×
                                                                                          0.27   10−3 m2 /s
                                                                                               W/m∙K
                                             Cobalt
                                        Thermal     Content
                                                  Diffusion                                       −3 m /s
                                                                                                10.3%
                                                                                        0.27 × 10
                                             Diamond Share                                      89.7%
                                          Cobalt Content                                      10.3%
                                          Diamond Share                                       89.7%
                                  O (Object) a round bar semi-finished product was used for the experiments with
                             diameter  of 160
                                O (Object)     mm bar
                                           a round  andsemi‐finished
                                                           length 200 mm,   AW was
                                                                       product 5083used
                                                                                     (AlMg4.5Mn0.7—EN
                                                                                         for the experiments573-3). The
                                                                                                             with di‐
                             chemical composition    of the  aluminum  alloy AW 5083 is shown   in Table
                          ameter of 160 mm and length 200 mm, AW 5083 (AlMg4.5Mn0.7—EN 573‐3). The chemi‐3.
                          cal composition of the aluminum alloy AW 5083 is shown in Table 3.
                            Table 3. Chemical composition of aluminum alloy AW 5083 [15].
                          Table 3. Chemical composition of aluminum alloy AW 5083 [15].
                                               Al Alloy                                           %
                                             Al Alloy
                                                   Si                                           %0.40
                                                Si Fe                                         0.400.4
                                                Fe Cu                                          0.40.10
                                                  Mn                                           0.4–0.10
                                                Cu                                            0.10
                                                  Mg                                            4.0–4.9
                                               MnCr                                         0.4–0.10
                                                                                               0.05–0.25
                                               MgZn                                         4.0–4.9
                                                                                                  0.25
                                                   Ti                                           0.15
                                                 Others.                                        0.35
                                                   Al                                          balance

                                 Table 4 Shows the mechanical and physical properties of the aluminum alloy AW 5083.
                                 F (Fixture = FT +FO) the fixture is for the tool (FT) and the fixture is for the object
                            (FO). A cutter head (FT) was used for the tool fixture and a chuck (FO) was used for the
                            object fixture. As the process medium Cimcool Cimstar 40B, which contains semi-synthetic
                            type of oil and water was used in all experiments. It is a semi-transparent process medium
                            suitable for applications requiring long life and cleanliness.
Table 4. Physical and mechanical properties of aluminum alloy AW 5083 [16].
Al Alloy Value
Yield stress Rp 0.2 (MPa) 110
Processes 2021, 9, 1485 Tensile strength Rm (MPa) 270 6 of 27
Density [kg/m ]3 2660
Melting range [°C] 575–683
Table 4. Electrical Conductivity
Physical and (MS/m) of aluminum alloy AW 508316–19
mechanical properties [16].
Thermal Conductivity (W/m.K) 110–140
Al Alloy Value
Modulus of Elasticity (GPa) 70
Yield stress Rp 0.2 (MPa) 110
Tensile strength
F (Fixture = FT +FO) the Rm (MPa)
fixture is for the tool (FT) and the 270fixture is for the object
Density [kg/m3 ] 2660
(FO). A cutter head (FT) was ◦ used for the tool fixture and a chuck (FO) was used for the
Melting range [ C] 575–683
object fixture. AsConductivity
Electrical the process(MS/m)
medium Cimcool Cimstar 40B, which 16–19 contains semi‐syn‐
thetic type of oil and water was
Thermal Conductivity (W/m·K) used in all experiments. It is a semi‐transparent
110–140 process
medium suitable
Modulusfor applications
of Elasticity (GPa)requiring long life and cleanliness.70
3.
3. Manufacturing
Manufacturing Process
Process ofof PCD
PCD Cutting
Cutting Inserts
Inserts
The
The cutting
cutting insert
insert of
of Figure
Figure 33 was
was made
made in
in the
the following
following successive steps. Production
successive steps. Production
of
of the cutting insert
the cutting insert DCGW
DCGW 11T308
11T308 from
from sintered
sintered carbide.
carbide. Cutting the mold
Cutting the mold onon aa cutting
cutting
insert DCGW 11T308 for mounting the PCD plate and blade as shown
insert DCGW 11T308 for mounting the PCD plate and blade as shown in Figure 3a in Figure 3a by
by
electrical
electrical discharge machining on Fanuc 31 i/W, using a 0.25 mm brass wire with a strengtha
discharge machining on Fanuc 31 i/W, using a 0.25 mm brass wire with
strength
of 900 N.of 900 N.
(a) (b)
Figure
Figure 3.
3. (a)
(a) Shape
Shape of
of the
the cutting
cutting insert
insert with
with PCD blade before
PCD blade before sharpening;
sharpening; (b)
(b) Cutting
Cutting insert
insert after
after sharpening.
sharpening.
The EDM cutting process shown in Figure 4 was carried out under the following
conditions 4 erosion process, voltage 78 V and current of 0.8 A. Distilled water was used as
the dielectric fluid. The cut was set up for two cycles with a cutting speed of 4.8 mm/min.
The process took 247 s. When using EDM technology, there is often a problem in
controlling the parameters and the machining process. This causes the brass wire to break,
resulting in lost time in the production cycle. This problem can be eliminated by optimizing
the manufacturing conditions of EDM technology.
Cutting the shape of the blade from PCD using EDM technology. The following
conditions were applied, cutting speed 3.1 m/min. and voltage 49 V. In order not to turn
the diamond into graphite which is caused by the high temperature during cutting [34].
The single cutting cycle took about 480 s and consist joining the carbide disk and the
cutting blade made of PCD by induction brazing, sharpening the cutting edges made of
PCD material according to the selected technical documentation and testing of the cutting
insert with a PCD cutting edge.
conditions 4 erosion process, voltage 78 V and current of 0.8 A. Distilled water was used
                                  as the dielectric fluid. The cut was set up for two cycles with a cutting speed of 4.8
                                  mm/min.
                                       The process took 247 s. When using EDM technology, there is often a problem in
                                  controlling the parameters and the machining process. This causes the brass wire to break,
Processes 2021, 9, 1485                                                                                                7 of 27
                                  resulting in lost time in the production cycle. This problem can be eliminated by optimiz‐
                                  ing the manufacturing conditions of EDM technology.

                                       (a)                                                    (b)
      Figure 4. (a)
                (a) Calibration
                    Calibrationofofthe
                                    themachine
                                        machinebefore
                                                before EDM
                                                      EDM   sharpening
                                                          sharpening    of the
                                                                     of the    cutting
                                                                            cutting    insert;
                                                                                    insert;     (b) Cutting
                                                                                            (b) Cutting     process
                                                                                                        process     of PCD
                                                                                                                of PCD insertinsert
                                                                                                                              with
      with EDM    machining   technology.
      EDM machining technology.

                                          Cutting theProcess
                                    3.1. Sharpening   shape of the blade from PCD using EDM technology. The following con‐
                                   ditions were applied, cutting speed 3.1 m/min. and voltage 49 V. In order not to turn the
                                          Three technologies were used in sharpening process of the DCGW 11T308 insert with
                                   diamond into graphite which is caused by the high temperature during cutting [34]. The
                                    PCD cutting edge, grinding on a Coborn R9 NC grinder, electrical discharge machining
                                   single cutting cycle took about 480 s and consist joining the carbide disk and the cutting
                                    (EDM) on a Fanuc 31 i/W machining center and LASER cutting on a CNC Lasertec 20. To
                                   blade made of PCD by induction brazing, sharpening the cutting edges made of PCD ma‐
                                    sharpen the cutting edges by grinding, as shown in Figure 5, grinding wheel Tyrolit Skytec
                                   terial according to the selected technical documentation and testing of the cutting insert
                                    XD-1 with 150 mm diameter and a high percentage of diamond grit was used to machine
                                   with a PCD cutting edge.
                                    the PCD material. The spindle speed was set at 2000 rpm, feed rate of 12.5 mm per second
 Processes 2021, 9, x FOR PEER REVIEW
                                    and a depth of cut of 0.1 mm. The grinding wheel was water sprayed directly onto the8 tool
                                                                                                                          of 27
                                   3.1. Sharpening Process
                                    throughout the machining cycle. The average sharpening time per plate was 852 s.
                                         Three technologies were used in sharpening process of the DCGW 11T308 insert with
                                   PCD cutting edge, grinding on a Coborn R9 NC grinder, electrical discharge machining
                                   (EDM) on a Fanuc 31 i/W machining center and LASER cutting on a CNC Lasertec 20. To
                                   sharpen the cutting edges by grinding, as shown in Figure 5, grinding wheel Tyrolit
                                   Skytec XD‐1 with 150 mm diameter and a high percentage of diamond grit was used to
                                   machine the PCD material. The spindle speed was set at 2000 rpm, feed rate of 12.5 mm
                                   per second and a depth of cut of 0.1 mm. The grinding wheel was water sprayed directly
                                   onto the tool throughout the machining cycle. The average sharpening time per plate was
                                   852 s.

                                  Figure5.5. Sharpening
                                  Figure     Sharpeningof
                                                        ofinsert
                                                           insertwith
                                                                 withPCD
                                                                      PCDgrinding
                                                                         grindingin
                                                                                  inNC
                                                                                    NCCoborn
                                                                                       CobornR9
                                                                                             R9(working
                                                                                                (workingzone).
                                                                                                         zone).

                                        Sharpening the cutting edges with LASER as seen in Figure 6 has the advantage of
                                   being a non‐contact technology so this process does not require the use of additional tools
                                   that wear out over time. The sharpening cycle was performed on a Lasertec 20 machine at
                                   a cutting speed of 591 mm/minute, which is an incomparable difference to grinding. De‐
                                   spite the high speed the resulting sharpening time for one plate was 2160 s.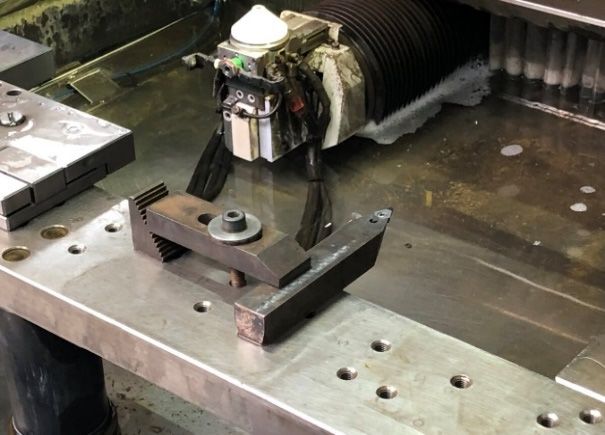
Processes 2021, 9, 1485 8 of 27
Figure 5. Sharpening of insert with PCD grinding in NC Coborn R9 (working zone).
Sharpening the
Sharpening the cutting
cutting edges
edges with
with LASER
LASER as as seen
seen inin Figure
Figure 66 has
hasthe
theadvantage
advantage of
of
being aa non-contact
being non‐contact technology
technologyso so this
this process
processdoes
doesnot
not require
requirethetheuse
useofofadditional
additionaltools
tools
that wear
that wear out
out over
over time.
time. The
The sharpening
sharpening cycle
cycle was
was performed
performedon onaa Lasertec
Lasertec20 20machine
machineatat
aa cutting
cuttingspeed
speedofof591
591mm/min,
mm/minute,whichwhich
is anisincomparable
an incomparable difference
difference to grinding.
to grinding. De‐
Despite
the high
spite thespeed the resulting
high speed sharpening
the resulting time for
sharpening onefor
time plate
one was
plate2160
wass.2160 s.
(a) (b)
Figure6.6. (a)
Figure (a) Calibration
Calibrationof
of the
the machine
machine before
beforeLASER
LASERsharpening
sharpeningof
ofthe
thecutting
cuttinginsert;
insert;(b)
(b)Sharpening
Sharpeningof
ofthe
thecutting
cuttinginsert
insert
with LASER CNC Lasertec
with LASER CNC Lasertec 20. 20.
The EDM
The EDMof ofthe
thecutting
cuttingedges
edgeshas
hasaadouble
doublesharpening
sharpeningcycle
cycle and
and was
was performed
performed onon
a
a Fanuc
Fanuc 31/WAFigure
31/WA Figure7 7atata acutting
cuttingspeed
speedofof2.2
2.2mm
mmper
perminute
minuteandandaavoltage
voltageof
of42
42VVinin
Processes 2021, 9, x FOR PEER REVIEW 9 of 27
two stages
two stagesasasspecified
specifiedbyby thethe manufacturer
manufacturer Element
Element SIX.SIX.
The The machining
machining time
time for for
one one
plate
was
plate480 s. 480 s.
was
Figure7.7. Sharpening
Figure Sharpeningof
ofthe
thecutting
cuttinginsert
insertwith
withEDM
EDMmachining
machiningon
onFanuc
Fanuc31/WA.
31/WA.
Based on the results of the analysis of the comparison of three technological methods
the evaluation output parameters were established on the basis of practical experience by
article of Židek et al. [34]. With the help of a 3D light microscope from Alicona Edge Mas‐
ter G4 in Figures 8a,b and 9 the parameters on the cutting insert namely the radius of
curvature of the cutting edge and the surface roughness were evaluated. The measure‐
ment results are shown in Table 5 for machining by grinding. EDM and LASER. This de‐
vice is used for microscopic 3D measurement of roughness and shape of components with
output to a computer monitor. All‐important surface properties are measured with only
one multifunctional measuring sensor.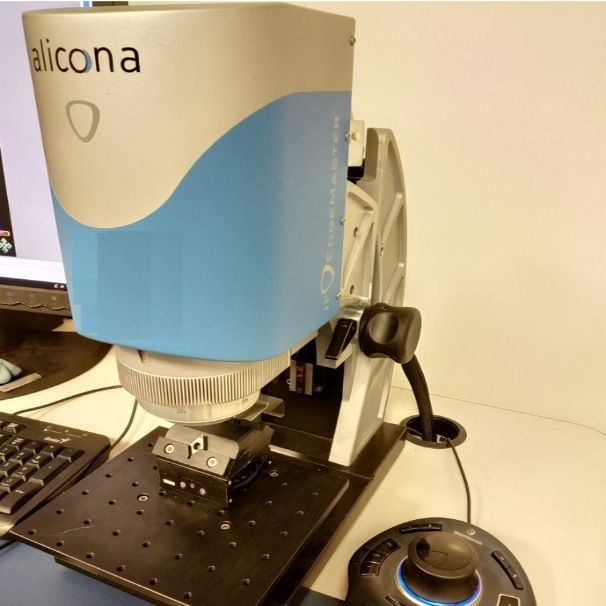
Processes 2021, 9, 1485 9 of 27
Figure 7. Sharpening of the cutting insert with EDM machining on Fanuc 31/WA.
Based on the results of the analysis of the comparison of three technological methods
the evaluation
evaluation output
outputparameters
parameterswere wereestablished
establishedonon the basis
the basisof of
practical experience
practical by
experience
article of Židek
by article et al.et[34].
of Židek WithWith
al. [34]. the help of a 3D
the help of alight microscope
3D light from from
microscope Alicona Edge Edge
Alicona Mas‐
ter G4 in
Master G4Figures 8a,b8a,b
in Figures andand
9 the parameters
9 the parameters ononthe
thecutting
cuttinginsert
insertnamely
namely the
the radius of
curvature
curvature ofofthe
thecutting
cuttingedge
edgeand
andthethe surface
surface roughness
roughness were
were evaluated.
evaluated. The The measure‐
measurement
ment
results are shown in Table 5 for machining by grinding. EDM and LASER. ThisThis
results are shown in Table 5 for machining by grinding. EDM and LASER. de‐
device
vice is used
is used for microscopic
for microscopic 3D 3D measurement
measurement of of roughness
roughness andshape
and shapeofofcomponents
components with
output to a computer monitor. All-important
All‐important surface properties are measured with only
one multifunctional measuring sensor. sensor.
(a) (b)
Processes 2021, 9, x FOR PEER REVIEW 10 of 27
8. (a) Measuring
Figure 8. Measuring the radius of curvature
curvature of the
the cutting
cutting edge
edge on
on Alicona
Alicona 3D
3D optical
optical microscope;
microscope; (b)
(b) Cutting
Cutting edge
edge
display measuring
display measuring with
with Alicona
Alicona 3D
3D software.
software.
Figure 9. Example of measured parameters of cutting edge arithmetic mean deviation of the assessed
Figure 9. Example of measured parameters of cutting edge arithmetic mean deviation of the as‐
profile Ra (EDM sharpening).
sessed profile Ra (EDM sharpening).
Table 5. Experimental plan matrix.
Number d Sch
A B C D
of Experiment (mm) (mm2)
1 −1 −1 −1 −1 0.0112 0.2194
2 −1 −1 −1 1 0.0106 0.2082
3 −1 −1 1 −1 0.0124 0.2193
4 −1 −1 1 1 0.0114 0.2105
5 −1 1 −1 −1 0.0131 0.2088
Processes 2021, 9, 1485                                                                                     10 of 27

                          Table 5. Experimental plan matrix.

                              Number                                                         ∆d          Sch
                                               A           B         C           D
                           of Experiment                                                    (mm)        (mm2 )
                                  1            −1          −1       −1           −1         0.0112      0.2194
                                  2            −1          −1       −1            1         0.0106      0.2082
                                  3            −1          −1        1           −1         0.0124      0.2193
                                  4            −1          −1        1            1         0.0114      0.2105
                                  5            −1          1        −1           −1         0.0131      0.2088
                                  6            −1          1        −1            1         0.0106      0.3841
                                  7            −1          1         1           −1         0.0142      0.2238
                                  8            1           1         1            1         0.0124      0.3917
                                  9            1           −1       −1           −1         0.0116      0.2345
                                 10            1           −1       −1            1         0.0108      0.2453
                                 11            1           −1        1           −1         0.0104      0.2153
                                 12            1           −1        1            1         0.0102      0.2316
                                 13            1           1        −1           −1         0.0147      0.2162
                                 14            1           1        −1            1         0.0115      0.2644
                                 15            1           1         1           −1         0.0117      0.2592
                                 16            1           1         1            1         0.0103      0.2458
                                 17            0           0         0            0         0.0126      0.2652
                                 18            0           0         0            0         0.0117      0.2388
                                 19            0           0         0            0         0.0104      0.3943
                                 20            0           0         0            0         0.0119      0.2715
                                 21            0           0         0            0         0.0128      0.2225
                                 22            0           0         0            0         0.0106      0.2263
                                 23            0           0         0            0         0.0105      0.2844
                                 24            0           0         0            0         0.0129      0.2135

                               Figure 10 shows a comparison of the values obtained for the cutting edge radius
                          Rn. We have recorded the smallest radius in the technology LASER. Figure 11 shows a
                          comparison of the parameters of surface roughness Ra and Rz. The best parameters Ra
                          and Rz were measured using the technology LASER. The parameters Ra and Rz were
                          measured with a measuring device MarSurf PS 10. We measured as the shortest cutting
                          edge sharpening time using EDM technology. Based on the above comparison of the
                          parameter evaluation results after applying the three technologies, the machined cutting
                          inserts LASER were used to optimize the output parameters for Al alloy turning and the
                          results will be presented in the next part of the paper.
with a measuring device MarSurf PS 10. We measured as the shortest cutting edge sharp‐
with atime
ening measuring device
using EDM MarSurf PS
technology. 10. We
Based on measured as the shortest
the above comparison cutting
of the edge sharp‐
parameter eval‐
ening time using EDM technology. Based on the above comparison of the parameter
uation results after applying the three technologies, the machined cutting inserts LASEReval‐
Processes 2021, 9, 1485 11 of 27
uation results after applying the three technologies, the machined cutting inserts LASER
were used to optimize the output parameters for Al alloy turning and the results will be
were usedin
presented tothe
optimize theof
next part output parameters for Al alloy turning and the results will be
the paper.
presented in the next part of the paper.
5
5 4.5284
4.5 4.5284
radius
4.5
radius
4
4
rounding
3.5 3.1836
rounding 3.5 3.1836
Rn(μm)
3
Rn(μm) 3
2.5
edge
2.1965
2.5
edge
2.1965
2
Cutting
2
Cutting
1.5
1.5
1
1
0.5
0.5
0
0
Grinding EDM LASER
Grinding EDM LASER
Figure 10.
Figure 10. Mean
Mean radius
radius parameter
parameter values
values comparison
comparison of
of the
the curvature
curvature of
of the
the cutting
cutting edge
edge Rn
Rn with
with
Figure 10. Mean
repeatability of 5 radius parameter values comparison of the curvature of the cutting edge Rn with
measurements.
repeatability of 5 measurements.
repeatability of 5 measurements.
6
6
RzRz
4.973 Ra
5 4.973 Ra
Rz
Ra,
5 Rz
Ra,
parameter
parameter
4
4
(μm)
3
(μm)
roughness
3
roughness
2 1.6305
2 1.6305 1.3433
1.3433
Surface
0.9693
Surface
1 0.9693
1 0.4022
0.4022 0.2147
0.2147
0
0
Grinding EDM LASER
Grinding EDM LASER
Figure 11. Comparison of values of surface roughness parameters Ra and Rz on a cutting insert.
Figure11.
Figure 11. Comparison
Comparisonof
ofvalues
valuesof
ofsurface
surfaceroughness
roughnessparameters
parametersRa
Raand
andRz
Rzon
onaacutting
cuttinginsert.
insert.
3.2. Optimalization of Input Factors for AW 5083 Processing
3.2.
3.2. Optimalization
Optimalization of of Input
InputFactors
Factorsfor
forAW
AW5083
5083Processing
Processing
All 24 experiments were conducted to determine the influence of four input factors
All 24 experiments
Allresults
24 experiments were conducted to determine thethe
influence of four input factors on
on the of the twowere conducted
output to determine
parameters, roundness influence
deviation of four
(d) andinput
chipfactors
cross‐
the results
on the (S of
results the two output parameters, roundness deviation (∆d) and chip
of the two output parameters, roundness deviation (d) and chip cross‐ cross-section
section ch). To make the results of the factors verifiably accurate we performed 5 replicate
(S ch ). To(S
section make
ch). Tothe results
make the of the factors
results of the verifiably accurate we performed 5 replicate mea-
measurements for each combination offactors verifiably
input factors. accurate
In addition, we
the performed
inserts were5 replaced
replicate
surements
measurements for eacheachcombination of input factors. In In
addition, the
theinserts
insertswere
werereplaced
after 5 replicatefor combination
measurements of input
for each factors.
experiment. addition,
The matrix of experiments replaced
is shown
after
after 55replicate
replicate measurements
measurements for each
for experiment.
each experiment. The matrix
The matrixof experiments
of experiments is shown
is in
shown
in Table
Table 5.
5. This
This matrix
matrix
of
of experiments
experiments was
was created
created from a
from a composite
composite factorial
factorial
design
design
which
in Table 5. This matrix of experiments was created from a composite factorial design
contains 24 defined experiments for specific conditions and the results of the experiments
for the responses of the dependent variables ∆d and Sch . All the information obtained from
the process of manufacturing cutting inserts and inserts as well as information obtained
from turning was analyzed and evaluated in detail in order to achieve the desired result of
the experiments and the optimal input factors to achieve the specified technical require-Processes 2021, 9, 1485 12 of 27
ments. The parameter of roundness deviation of the machined surface was measured
with a Round Test R-120 measuring device and the chip cross-section (thickness—hsch and
width—bsch ) were measured with a micrometer. The measurement was made around the
circumference of the workpiece in five positions and the results were statistically analyzed
for each test. The chip cross-section was calculated from the measured values of chip
thickness and width according to Equation (2) statistically evaluated and the values are
given in Table 6.
Sch = bsch ·hsch mm2 (2)
Table 6. The sequence after data preprocessing.
Sch
Reference Comparability Sequence ∆d (mm)
(mm2 )
Reference sequence comparability sequence 1.000 1.000
E1 0.778 0.940
E2 0.911 1.000
E3 0.511 0.940
E4 0.733 0.988
E5 0.356 0.997
E6 0.911 0.055
E7 0.111 0.916
E8 0.511 0.014
E9 0.689 0.859
E10 0.867 0.801
E11 0.956 0.962
E12 1.000 0.874
E13 0.000 0.957
E14 0.711 0.698
E15 0.667 0.726
E16 0.978 0.798
E17 0.467 0.694
E18 0.667 0.836
E19 0.956 0.000
E20 0.622 0.660
E21 0.422 0.923
E22 0.911 0.903
E23 0.933 0.591
E24 0.400 0.972Processes 2021, 9, 1485 13 of 27
For factorial design, the variables are multilevel and their output effects are nonlinear.
Therefore, it was decided to use a three-level experiment for each factor. Process medium
was designed as a constant factor. In Full Factorial Design (FFD) the number of factors as
well as their levels increases exponentially with the number of experiments. This number
of experiments has a significant impact on the duration of the research and the amount
of costs. The FFD consisting of four input factors at three levels would have a form
of 34 which means conducting 81 experiments. If we include the repeatability of each
experiment, for example for repeatability 5 it is 405 experiments. To reduce the number of
experiments performed we assumed a trade-off design for two unfavorable factors—the
choice of optimal cutting conditions and a limited number of experiments. We designed a
composite factorial 24 + 8 with a content of 24 experiments. These were selected to optimize
performance and quality characteristics for the turning process. The experiments were
conducted according to the process input factors listed in Table 1.
The chip cross-section is an important parameter for the performance evaluation of the
cutting process, also based on the interrelationship between the technological parameters
(feed rate and depth of cut) and the physical parameters (chip thickness and width) of the
cutting process. Furthermore, it is the physical and technological parameters of the chip
that are important for the productivity of the cutting process.
The cross-section of the removed layer (or the cutting cross-section) during turning
is determined from the input variables by the feed rate, the depth of cut and the setting
angle of the main cutting edge. This cross-section of the removed layer (or cross-section) is
evaluated in the tool ground plane Pr. The actual real cross-section of the chip is determined
by measuring the chip, i.e., after turning. The chip cross-section is a parameter that can be
used to evaluate the performance factors of turning as: (performance parameter, due to the
change in the actual cross-section of the chip, evaluation of chip shape, chip compression,
chip formation and chip root, evaluation of loading—especially pressure and its influence
on internal energy of elements in the cutting zone, friction and tribological properties of
the machining process).
We have, therefore, chosen the chip cross-section for the evaluation, because in our
research of several years we have focused on the study of the pressure fields in the cutting
zone under changing cutting conditions.
To evaluate the values of the results of the experiments, we used the GRA method
according to Deng et al. [35]. GRA is a method by which we measure the degree of
approximation between sequences according to the Grey relational grade (GRG). This
method has been applied by several researchers [35–37].
Kumar et al., in their publication, defined the ideal machining conditions using
the GRA method and the Taguchi model based on the ANOVA method by varying the
machining conditions of the material composite of WC-Co during drilling [38]. Another
author who used GRA method to optimize machining conditions was Sahu et al. who
used various machining parameters with EDM parameters such as material removal rate
(MRR), tool wear rate (TWR) and radial over cut (ROC) in machining titanium alloys [39].
Garg et al. used characteristics and process optimization of the ECDM process of Carbon
Fibre Reinforced Polymer machining performed by the Grey Relational Analysis (GRA)
method in Taguchi’s L9 orthogonal array method by using the applied voltage, electrolyte
concentration, and inter-electrode distance as process parameters [40]. Akepati et al. used
an idea of machining the polypropylene composite with a Laser technology and determined
the optimum processing conditions by GRA method, which were confirmed by the method
ANOVA [41].Processes 2021, 9, 1485 14 of 27
In order to arrive at the correct results, it is necessary to initially preprocess the
experimental results of the deviation of the roundness and cross-section of the chip and
to arrange them in sequences ranging from 0 to 1. This is also called Grey Relational
Generation. An important indicator of the method is GRG, which we calculate as an
average for each resulting parameter. The total result for multiple output parameters is
determined using GRG. Optimizing complex multiple input factors can result in conversion
to a single Grey Relational Grade. Based on the GRA method, we can design different
combinations of factors for the optimal cutting process. Optimization of input factors of
turning to achieve quality and performance parameters using the GRA method requires
the following procedure according to [35]:
1. Identify the input factors and the parameters for evaluating the output quality and
performance of the cutting process;
2. Determination of the number of levels for the input factors of the cutting process;
3. Design of the factorial matrix of the experiment and assignment of the factors of the
cutting process;
4. Results of experiments for roundness deviation and chip cross-section;
5. GRG generation and calculation of GRC coefficients;
6. Calculation of GRGrades based on GRC results;
7. Analysis of experimental results with GRGrade;
8. Design of optimum levels of cutting process parameters.
3.3. Data Pre-Processing
Data preprocessing must be performed because the range and unit in a data sequence
may differ from the others. Data preprocessing is a means of converting the original se-
quence into a comparable sequence. Depending on the characteristics of the data sequence.
There are different methods for data preprocessing that are recommended for GRA [35].
Input experiments were conducted to design the input factors. Initially, roundness
deviations in the range of 0.001 to 0.05 mm were obtained. Based on these input exper-
iments, adjusted input factors (A, B, C, D) were set according to Table 1, assuming that
we achieve the required initial values of the parameters. Manufacturers required (mainly
in terms of product function and production cost) to achieve roundness deviations in the
range of 0.01 to 0.05 mm with the highest output (largest chip cross-section). Therefore, in
the optimization of the method GRA, the methodology chosen was the larger the better,
i.e., to approach larger but required values.
We applied the methodology, if the sequence is infinite and has the property “the
higher is better”. The original sequence can be normalized according to Equation (3).
xi0 (k) − min xi0 (k)
xi+ (k) = (3)
max xi0 (k) − min xi0 (k)
where i = 1, . . . , m, k = 1, . . . , n, m is the number of experimental data n is the number
of parameters, xi0 (k) denotes the original sequence, xi+ (k ) denotes the sequence after
data processing, xi0 (k) the highest value of the smallest value of xi0 (k), min xi0 (k) smallest
value of xi0 (k), xi0 is the required value of xi0 (k). GRA is a method based on the study of
importance between two sequences defined by the Grey relational grade (GRG) indicator.
When only one sequence is available as a reference sequence and all other sequences serve
as reference sequences this method is called Local Grey Relational Measurement. After
preprocessing the data, we perform the GRC calculation according to Equation (4).Processes 2021, 9, 1485 15 of 27
∆min + ξ · ∆max
ξ , (k) =
∆oi (k) + ξ · ∆max (4)
∆oi (k) = xo∗ (k) − xi∗ (k) , ∆max = 1.00; ∆min = 0.00
where ∆oi (k ) is the sequence divergence of the reference sequence x0∗ (k) and the reference
sequence xi∗ (k). The ξ is the identification coefficient and is defined in the range 0 ≤ ξ ≤ 1.
This value can be set by the system as required. For smaller values ξ the resolution is higher.
The determination of this coefficient is important to show the degree of the relationship
between the reference sequence x0∗ (k) and the 24 comparison sequences xi∗ (k). Where
i = 1, 2, . . . , m and k = 1, 2, . . . , n. For the experiment we determined m = 24 and n = 2. The
determination of GRG ∗ in the procedure GRA is to define the degree of influence between
∗
the 24 sequences x0 (k) and xi (k), i = 1, 2, 3 . . . 24 . After determining the GRC we then
determine the GRG value as the mean of the GRC values. Calculate GRG according to
Equation (5).
1 n
γi = ∑ ξ i ( k ) (5)
n k =1
In real processes, the relative importance of the different factors varies. Deng and Lin et al.
recommend changing Equation (4) to the form of Equation (6) [35].
1 r r
r ∑ k =1 k i
γi = w ξ ( k ) ∑ k =1 w k = 1 (6)
where wk denotes the normalized weight of the factor k. If the weight is the same
Equations (5) and (6) are the same. The Grey relational degree expresses the degree of
correlation between a reference sequence and a comparable sequence. If the two sequences
are identical due to the circumstances, then the GRG value is 1. GRG also expresses the
degree of influence of the possibility of using a comparable sequence compared to the
reference sequence. In the presented experiment we have identified two output parameters,
namely the performance parameter chip cross-section and the qualitative parameter round-
ness deviation which is influenced by the formation of BUE, when turning Al alloy for
cutting edge factors on a plate of LASER. These two different output parameters are listed
in Table 5. Therefore, we applied the “higher is better” methodology for data preprocessing
and used Equation (3).
To optimize the input factors (cutting speed, feed rate, tip radius and depth of cut)
and to evaluate the two required output parameters (roughness deviation and chip cross-
section), we applied the methodology according to the method GRA. For the performance
parameter chip cross-section, it is important that its size ensures the required turning
performance, and for the surface quality parameter (deviation of roundness) that the
required value of the machined surface is achieved. We have determined the input factors
experimentally in order to achieve the highest possible performance parameter and, at
the same time, to achieve the required value of the deviation of roundness, which results
from the function of the machined surface on the product. Therefore, the “higher is better”
method was chosen. The smallest parameter values or the largest parameter values are not
always correct. It is important to develop optimum input factors to achieve the required
output parameters resulting from real operating conditions. Thus, even roundness values
close to 0.0 mm may not be correct in practice.
The results of the sequence deviations for i = 1 to 24 and k = 1 for 24 experiments
are shown in Table 7. The results of labeled reference sequences and labeled reference
sequences for i = 1 to 24 and k = 1 for 24 experiments are shown in Table 8. The sequence
deviations can be calculated according to Equation (3).
Values:
∆max = ∆o1 (1) = ∆o24 (2) = 1.00, ∆min = ∆o1 (1) = ∆o24 (2) = 0.00Processes 2021, 9, 1485 16 of 27
Table 7. The deviation sequence.
Deviation Sequence ∆oi (∆d) ∆oi (Sch )
E1 0.222 0.060
E2 0.089 0.000
E3 0.489 0.060
E4 0.267 0.012
E5 0.644 0.003
E6 0.089 0.945
E7 0.889 0.084
E8 0.489 0.968
E9 0.311 0.141
E10 0.133 0.199
E11 0.044 0.038
E12 0.000 0.126
E13 1.000 0.043
E14 0.289 0.302
E15 0.333 0.274
E16 0.022 0.202
E17 0.533 0.306
E18 0.333 0.164
E19 0.044 1.000
E20 0.378 0.340
E21 0.578 0.077
E22 0.089 0.097
E23 0.067 0.409
E24 0.600 0.028
The coefficient ξ can be replaced by the procedure of Equation (4) for GRG coefficient.
We consider the value of the coefficient ξ as 0.5 since both initial parameters have the same
weight. The GRC and GRG values for each factorial design experiment were calculated
according to Equations (4)–(6). Table 8 shows the GRG for each factorial experimental
design experiment. Higher GRG values represent the corresponding experimental values
and are more indicative of the standard values. According to the GRG values in Table 8
experiment E2 out of 24 experiments expresses the best results for both output parameters
as the GRG value is the highest.
Chips after turning were examined for shape after turning (tangled chips with varying
lump sizes predominated and for possible side effects of cutting). Samples (about 3 to
8 cm long) were taken for measurement, following the principle that chips should not be
taken at the beginning and end of the turned area. The thickness and width of the chips
were measured with a micrometer, according to the Figure 12. The repeatability was 5
for each chip. Calculation of particle cross-section from the average values obtained by
measurement according to the equation presented in the content of the article. An example
of the measurement of chip width and thickness is shown in Figure 12. From the presented
results of the study in Table 8 and Figure 13 the optimization of two output parameters
in turning an Al alloy can be seen, which is replaced by the GRG optimization. At the
same time the optimal turning parameters for the deviation of the roundness and the chipProcesses 2021, 9, 1485 17 of 27
cross-section were determined. In Table 9 for the factorial design method the calculated
GRG value for each level of input factors was used.
Table 8. Calculated Grey relational coefficient and Grey relational grade values for 24 comparable
sequences.
Number of Experiment GRC (∆d) GRC (Sch ) GRG
E1 0.692 0.893 0.792
E2 0.849 1.000 0.925
E3 0.506 0.893 0.700
E4 0.652 0.976 0.814
E5 0.437 0.994 0.715
E6 0.849 0.346 0.598
E7 0.360 0.856 0.608
E8 0.506 0.336 0.421
E9 0.616 0.780 0.698
E10 0.789 0.715 0.752
E11 0.918 0.929 0.924
E12 1.000 0.799 0.900
E13 0.333 0.921 0.627
E14 0.634 0.623 0.629
E15 0.600 0.646 0.623
E16 0.957 0.712 0.835
E17 0.484 0.620 0.552
E18 0.600 0.753 0.676
E19 0.918 0.333 0.626
E20 0.570 0.595 0.582
E21 0.464 0.867 0.665
E22 0.849 0.837 0.843
E23 0.882 0.550 0.716
E24 0.455 0.946 0.700
Table 9. Response table for Grey relational grade.
−1 0 1 Max-Min
A 0.697 0.670 0.749 0.079
B 0.813 0.670 0.632 0.181
C 0.717 0.670 0.728 0.058
D 0.717 0.670 0.734 0.064the measurement of chip width and thickness is shown in Figure 12. From the presented
results of the study in Table 8 and Figure 13 the optimization of two output parameters in
turning an Al alloy can be seen, which is replaced by the GRG optimization. At the same
Processes 2021, 9, 1485 time the optimal turning parameters for the deviation of the roundness and the chip 18
cross‐
of 27
section were determined. In Table 9 for the factorial design method the calculated GRG
value for each level of input factors was used.
0.27 1.00 0.30 1.00
Chip cross section (mm2)
Chip cross section (mm2)
0.26 0.80 0.27 0.80
0.25 0.60 0.24 0.60
GRG
GRG
0.24 0.40 0.21 0.40
0.23 Sch 0.20 0.18 0.20
Sch
GRG
0.22 0.00 GRG
0.15 0.00
Lower Middle Higher
Lower Middle Higher
Factor A (m/min) Factor B (mm)
(a) (b)
0.27 1.00 0.45 1.00
Chip cross section (mm2)
Chip cross section (mm2)
0.80 0.80
0.26
0.3
0.60 0.60
GRG
GRG
0.25
0.40 0.40
0.15
0.24
Sch 0.20 0.20
Sch
GRG GRG
0.23 0.00 0 0.00
Lower Middle Higher Lower Middle Higher
Factor
Processes 2021, 9, x FOR PEER REVIEW C (mm) Factor D (mm) 18 of 27
(c) (d)
Figure 12. (a) Sample
Sampleof
ofthe
theresulting
resulting chipfrom
from turning process of AW 5083; (b) Chip width measurement in (mm); (c)
average chip
GRG of theturning process
reference of AW
sequence 5083; (b) Chip
is more width measurement
meaningful than the in (mm);
average (c) Chip
value of the
Chip thickness
thickness measurement;
measurement; (d) Another
(d) Another samplesample
of ofwidth
chip chip width measurement.
measurement.
GRG of the comparison sequence.
Table 7. The deviation sequence.
1
0.9 Deviation Sequence oi (d) oi (Sch)
Grey Relational Grade
0.8 E1 0.222 0.060
0.7
E2 0.089 0.000
0.6
0.5
E3 0.489 0.060
0.4 E4 0.267 0.012
0.3 E5 0.644 0.003
0.2 E6 0.089 0.945
0.1
E7 0.889 0.084
0
E10
E11
E12
E13
E14
E15
E16
E17
E18
E19
E20
E21
E22
E23
E24
E1
E2
E3
E4
E5
E6
E7
E8
E9
Experimental number
Figure 13.
Figure 13. Grey
Grey Relational
Relational Grade
Gradefor
forthe
thesection
sectionof
ofchip
chipand
androundness
roundnessdeviation.
deviation.
The resulting average GRG values for each level of rotation factors are shown in Ta‐
ble 9 and express the performance behavior of the multifactor.
Table 9. Response table for Grey relational grade
−1 0 1 Max‐MinProcesses 2021, 9, 1485 19 of 27
GRG values for each level of turning factors were calculated as average values. The
GRG can be characterized as a method in which we examine the degree of correlation
between the reference sequence and the comparison sequence. The higher value of the
average GRG of the reference sequence is more meaningful than the average value of the
GRG of the comparison sequence.
The resulting average GRG values for each level of rotation factors are shown in
Table 9 and express the performance behavior of the multifactor.
The underlined values indicate the optimal values of the factors for rotation. Figure 14
shows the dependence of the obtained GRG values on different levels of the rotation factors
A, B, C and D. The higher the GRG value is, the closer the performance is to the ideal value.
A higher GRG value is required for the optimum turning process. Thus, the design of the
optimum turning factors corresponds to the highest GRG values according to Table 9, we
can conclude that the optimum conditions for turning to achieve required cross-section and
deviation of roundness are: cutting speed V = 870 m/min (Level 3), feed rate F = 0.1 mm
(Level 1), depth of cut Ap = 0.1 mm (Level 3) and corner radius Rε = 1.2 mm (Level 3)
and obtained by combining them. The values for experiment number E12 according to
Figure 14 and Table 8 can be considered very close to the optimal process conditions. As
shown in Table 9, the differences between the maximum and minimum values of GRG
turning factors are as follows 0.079 for cutting speed, 0.181 mm for feed rate, 0.058 mm for
depth of cut and 0.064 mm for radius of tool cutting edge. For the analysis of power turning,
we can use a comparison of these factor values and determine the degree of influence
of each factor. Based on this, we can determine the order of the output parameters that
have a significant influence on the additional performance characteristics of the turning
Processes 2021, 9, x FOR PEER REVIEW
parameters. The order of the input factors is factor B (feed rate), A (cutting speed), 19 ofD27
(corner radius) and C (depth of cut). Factor B was an effective performance factor.
0.900
Grey Relational Grade
0.800
0.700
0.600
0.500
A‐ A A+ B‐ B B+ C‐ C C+ D‐ D D+
Level of input factors
Figure 14.Effect
Figure14. Effectof
ofturning
turningfactors
factorson
onthe
themulti-characteristic.
multi‐characteristic.
Figure 15a,b shows the influence of the machined surface for the combination of the
Figures 15a, b shows the influence of the machined surface for the combination of the
effects of input factors A, B, C and D on the cross-sectional value of the chip (plastically
effects of input factors A, B, C and D on the cross‐sectional value of the chip (plastically
deformed layer) for defined levels. The results show that an increase in cross-sectional
deformed layer) for defined levels. The results show that an increase in cross‐sectional
area is significantly affected by an increase in feed rate and an increase in cross-sectional
area is significantly affected by an increase in feed rate and an increase in cross‐sectional
area is significantly affected by an increase in cutting speed. It was shown that the effect
area is significantly affected by an increase in cutting speed. It was shown that the effect
of depth of cut in combination with the value of corner radius has a greater influence on
of depth of cut in combination with the value of corner radius has a greater influence on
the formation of an built up edge shown in Figure 15a,b, which is indirectly shown by the
the formation of an built up edge shown in Figure 15 a,b, which is indirectly shown by the
change in chip cross-section and roundness deviation from Figures 16 and 17.
change in chip cross‐section and roundness deviation from Figures 16 and 17.You can also read


