New Zealand Tourism Forecasts 2015-2021 - Report Sector Performance - MBIE
←
→
Page content transcription
If your browser does not render page correctly, please read the page content below
Sector Performance

New Zealand Tourism
Forecasts 2015-2021
Report

                                 May 2015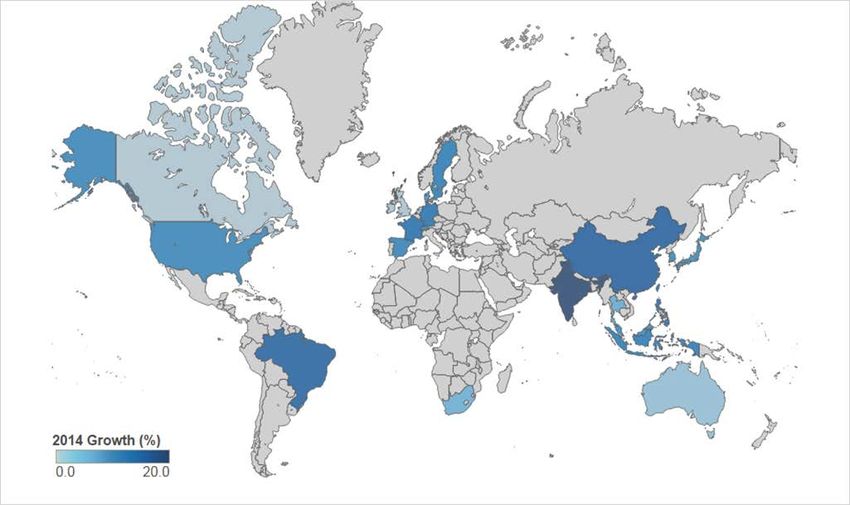
Ministry of Business, Innova on and Employment (MBIE)
Hīkina Whakatutuki – Li ing to make successful
MBIE develops and delivers policy, services, advice and regula on to support economic growth
and the prosperity and well-being of New Zealanders.
MBIE combines the former Ministries of Economic Development, Science + Innova on, and the
Departments of Labour and Building and Housing.

More informa on
                                             Informa on, examples and answers to your
www.mbie.govt.nz                             ques ons about the topics covered here can be
                                             found on our website www.mbie.govt.nz or by
0800 20 90 20
                                             calling us free on 0800 20 90 20.

Disclaimer
This document is a guide only. It should not be
used as a subs tute for legisla on or legal
advice. The Ministry of Business, Innova on
and Employment is not responsible for the
results of any ac ons taken on the basis of
informa on in this document, or for any errors
or omissions.

May 2015

© Crown copyright 2015 The material contained in this report is subject
to Crown copyright protec on unless otherwise indicated. The Crown
copyright protected material may be reproduced free of charge in any
format or media without requiring specific permission. This is subject to
the material being reproduced accurately and not being used in a
derogatory manner or in a misleading context. Where the material is
being published or issued to others, the source and copyright status
should be acknowledged. The permission to reproduce Crown copyright
protected material does not extend to any material in this report that is
iden fied as being the copyright of a third party. Authoriza on to
reproduce such material should be obtained from the copyright holders.
Foreword
It is my pleasure to release the Ministry of Business, Innova on and Employment’s tourism
forecasts for the 2015-2021 period.
The global economic outlook is stronger than in previous years. Reflec ng this more posi ve
outlook, the tourism forecasts are strong, with interna onal visitor expenditure projected to
increase 48.5 per cent to $11.1 billion by 2021.
I am pleased to announce the introduc on of two emerging markets to our forecasts, India and
Indonesia. These markets have seen strong growth in recent years, so providing further insight
on the future of these markets will be useful to the sector.
This year, MBIE has also launched an interac ve web tool for users to explore the forecast results
for key markets. This can be found on MBIE’s website here:
h p://www.med.govt.nz/sectors-industries/tourism/tourism-research-data/forecasts.
The forecasts are based on econometric modelling, current trends and best available forecasts of
interna onal factors. They provide a baseline for what will happen ‘if things keep going this way’.
The forecasts do not set targets and are not numbers carved in stone. Rather, I hope that these
forecasts will encourage strategic thinking and planning from the industry so that it can con nue
to provide visitors with high-quality experiences whilst striving toward the aspira onal goals set
out in the Tourism 2025 framework.
The forecasts are subject to the global economic situa on. China and Australia will remain key
markets in the coming years, with arrivals from these two countries projected to make up 56.1
per cent of visitors by 2021.
Due to longer stays, the average spend per day is expected to drop for many of our key markets,
except for the US, UK and South Korea, where we are expec ng to see an increase in daily
spending. We are no cing an upturn in visitors coming to New Zealand on holiday, a er a
fla ening on this part of the market during the Global Financial Crisis (GFC). This upturn is
par cularly pronounced for China, Germany and the US markets.
The Ministry has con nued to use a technical commi ee to moderate and improve the forecast
results. The technical commi ee consists of members from the Ministry, Air New Zealand,
Tourism Industry Associa on, Auckland Interna onal Airport, the New Zealand Ins tute of
Economic Research (NZIER) and Tourism New Zealand. This approach of combining quan ta ve
modelling with expert industry knowledge has worked well to deliver be er results. I would like
to take this opportunity to thank all of you who were involved in this process.

Michael Bird
General Manager
Ins tu ons and Systems Performance, Science, Skills and Innova on
Ministry of Business, Innova on and Employment
Contents
1 Background to the report                                                                                            1

2 Execu ve Summary                                                                                                    2
     2.1      Recent performance . . . . . . . . . . . . . . . . . . . . . . . . . . . . . . . . .                    2
     2.2      Outlook to 2021 . . . . . . . . . . . . . . . . . . . . . . . . . . . . . . . . . . . .                 3
     2.3      Outlook for all markets . . . . . . . . . . . . . . . . . . . . . . . . . . . . . . . .                 4

3 Fundamental drivers                                                                                                 7
     3.1      Recent drivers . . . . . . . . . . . . . . . . . . . . . . . . . . . . . . . . . . . . .                7
     3.2      Future drivers . . . . . . . . . . . . . . . . . . . . . . . . . . . . . . . . . . . . . 11

4 Outlook for key markets                                                                                           16
     4.1      Australia . . . . . . . . . . . . . . . . . . . . . . . . . . . . . . . . . . . . . . . . 17
     4.2      Asia . . . . . . . . . . . . . . . . . . . . . . . . . . . . . . . . . . . . . . . . . . 21
     4.3      Europe and Americas . . . . . . . . . . . . . . . . . . . . . . . . . . . . . . . . . 30

5 Outlook for emerging markets                                                                                      43
     5.1      India . . . . . . . . . . . . . . . . . . . . . . . . . . . . . . . . . . . . . . . . . . 45
     5.2      Indonesia . . . . . . . . . . . . . . . . . . . . . . . . . . . . . . . . . . . . . . . 47
     5.3      South America . . . . . . . . . . . . . . . . . . . . . . . . . . . . . . . . . . . . . 50

6 Alterna ve Scenarios                                                                                              53
     6.1      China slowdown . . . . . . . . . . . . . . . . . . . . . . . . . . . . . . . . . . . . 53
     6.2      Oil prices slump then recover . . . . . . . . . . . . . . . . . . . . . . . . . . . . . 55

7 Technical Commi ee Adjustments                                                                                    57
     7.1      Adjustment to Australia forecast . . . . . . . . . . . . . . . . . . . . . . . . . . . 58
     7.2      Adjustment to China forecast . . . . . . . . . . . . . . . . . . . . . . . . . . . . . 59
     7.3      Adjustment to Japan forecast . . . . . . . . . . . . . . . . . . . . . . . . . . . . . 60

A Appendix.Forecasts for Other markets                                                                              61

MINISTRY OF BUSINESS, INNOVATION & EMPLOYMENT          i                          New Zealand Tourism Forecasts 2015-2021
List of Figures
1 Growth from New Zealand’s top visitor markets has been posi ve over 2014 . . . . 2
2 Summary of forecasts: All . . . . . . . . . . . . . . . . . . . . . . . . . . . . . . . 4
3 In terms of volume, Australia is projected to con nue being New Zealand’s largest
market . . . . . . . . . . . . . . . . . . . . . . . . . . . . . . . . . . . . . . . . . 5
4 Australians contribute the most to total spend now, but China is likely to overtake
by 2020, and the US is showing strong growth . . . . . . . . . . . . . . . . . . . . 5
5 Germans stay the longest in New Zealand, and are likely to con nue this pa ern . 6
6 Many factors are working in tandem to li total spend. Volume and value growth,
year ending December 2014 . . . . . . . . . . . . . . . . . . . . . . . . . . . . . 7
7 Growth in spend has overtaken growth in visitor arrivals. Percentage year-on-year
growth in total spend and visitor arrivals . . . . . . . . . . . . . . . . . . . . . . . 8
8 Both volume and value drove year-on-year growth in total spend in 2014 . . . . . 9
9 Arrivals from Asian markets are growing . . . . . . . . . . . . . . . . . . . . . . . 10
10 Exchange rate indexes for key visitor markets . . . . . . . . . . . . . . . . . . . . 10
11 Both advanced and emerging economies will drive visitor growth over the forecast
period . . . . . . . . . . . . . . . . . . . . . . . . . . . . . . . . . . . . . . . . . 11
12 China growth outstrips advanced economies . . . . . . . . . . . . . . . . . . . . . 12
13 Growth of interna onal visitors will be driven by holiday and VFR visitors . . . . . 13
14 Emerging economies will drive growth in spend . . . . . . . . . . . . . . . . . . . 14
15 China is forecast to be New Zealand’s largest market in terms of expenditure . . . 15
16 Summary of forecasts: Australia . . . . . . . . . . . . . . . . . . . . . . . . . . . 17
17 New South Wales is the state that provides most Australian visitors to New Zealand,
followed by Queensland and Victoria . . . . . . . . . . . . . . . . . . . . . . . . . 18
18 Australian forecasts show a trend towards more interna onal holidays, with strong
growth in outbound from Australia (as well as very strong growth in inbound) . . . 19
19 Asian des na ons are providing more compe on . . . . . . . . . . . . . . . . . 20
20 Many Asian countries are growing strongly, especially China . . . . . . . . . . . . 21
21 Summary of forecasts: China . . . . . . . . . . . . . . . . . . . . . . . . . . . . . 22
22 Shanghai, Guangdong, and Beijing are the top Chinese provinces for visitor arrivals
to NZ . . . . . . . . . . . . . . . . . . . . . . . . . . . . . . . . . . . . . . . . . . 23
23 The Chinese are visi ng more regions than before, with strong growth in spend
especially in South Island regions . . . . . . . . . . . . . . . . . . . . . . . . . . . 24
24 Par cipa on rates for popular ac vi es undertaken by Chinese holidaymakers,
and how rates compare with all interna onal holidaymakers . . . . . . . . . . . . 25
25 Summary of forecasts: Japan . . . . . . . . . . . . . . . . . . . . . . . . . . . . . 26
26 Japanese visitors are now much younger than before . . . . . . . . . . . . . . . . 27
27 Summary of forecasts: Korea . . . . . . . . . . . . . . . . . . . . . . . . . . . . . 28
MINISTRY OF BUSINESS, INNOVATION & EMPLOYMENT ii New Zealand Tourism Forecasts 2015-202128 Korean visitor growth is weak when the economy is weak . . . . . . . . . . . . . . 29
29 Growth in visitor arrivals from Europe and the Americas has picked up in 2014 . . . 30
30 Summary of forecasts: UK . . . . . . . . . . . . . . . . . . . . . . . . . . . . . . 31
31 GDP per capita and unemployment in the UK are improving . . . . . . . . . . . . 33
32 One-off past events have boosted UK visitor arrivals to both Australia and New
Zealand, showing future promise for events such as the 2017 Lions Tour . . . . . . 33
33 Summary of forecasts: US . . . . . . . . . . . . . . . . . . . . . . . . . . . . . . . 34
34 California was the US state that brought most visitors to New Zealand in 2014 . . . 36
35 Summary of forecasts: Canada . . . . . . . . . . . . . . . . . . . . . . . . . . . . 37
36 Oil prices plummeted recently . . . . . . . . . . . . . . . . . . . . . . . . . . . . 38
37 The Canadian economy is weaker overall, due to the drop in oil price reducing
Canadian export prices . . . . . . . . . . . . . . . . . . . . . . . . . . . . . . . . 39
38 Summary of forecasts: Germany . . . . . . . . . . . . . . . . . . . . . . . . . . . 40
39 Germans and Chinese visitor arrivals with working holiday visas are growing more
than other countries . . . . . . . . . . . . . . . . . . . . . . . . . . . . . . . . . 42
40 Emerging markets have a large growth of middle-class popula on . . . . . . . . . 43
41 Summary of forecasts: India . . . . . . . . . . . . . . . . . . . . . . . . . . . . . 45
42 India’s popula on is growing as well as its GDP per capita, driving more outbound
travel from this market . . . . . . . . . . . . . . . . . . . . . . . . . . . . . . . . 46
43 Summary of forecasts: Indonesia . . . . . . . . . . . . . . . . . . . . . . . . . . . 47
44 GDP is expected to grow for both India and Indonesia . . . . . . . . . . . . . . . . 48
45 Indonesia’s outbound numbers sit alongside other key emerging markets . . . . . 49
46 Brazil has a large popula on with rela vely high incomes per capita . . . . . . . . 50
47 It is harder to do business in South America than elsewhere . . . . . . . . . . . . 51
48 The economic outlook is for modest improvement . . . . . . . . . . . . . . . . . . 52
49 Scenario for slowing Chinese economy . . . . . . . . . . . . . . . . . . . . . . . . 54
50 Commi ee-adjusted forecast and scenario-based visitor arrivals for China . . . . . 54
51 Oil price scenarios: NZ Tourism Forecast prices used in model versus the IEA’s oil
price predic ons . . . . . . . . . . . . . . . . . . . . . . . . . . . . . . . . . . . 56
52 Commi ee-adjusted forecast and scenario-based visitor arrivals forecasts, world-
wide . . . . . . . . . . . . . . . . . . . . . . . . . . . . . . . . . . . . . . . . . . 56
53 Commi ee and model-based visitor arrival forecasts for Australia . . . . . . . . . 58
54 Commi ee and model-based visitor arrival forecasts for China . . . . . . . . . . . 59
55 Commi ee and model-based visitor arrival forecasts for Japan . . . . . . . . . . . 60
56 Summary of forecasts: Other . . . . . . . . . . . . . . . . . . . . . . . . . . . . . 61
MINISTRY OF BUSINESS, INNOVATION & EMPLOYMENT iii New Zealand Tourism Forecasts 2015-20211. Background to the report Each year, the Ministry of Business, Innova on and Employment (MBIE) produces tourism forecasts to support planning and investment processes in the tourism industry. In response to industry feedback, this year’s report includes specific forecasts for India and Indonesia, two emerging and important markets for New Zealand. There is also addi onal insight and context on the South American market, to help industry think about what these markets might mean for their own businesses. The forecasts are developed using NZIER’s tourism forecas ng model with input from a small expert commi ee of industry par cipants. This approach, supported by one-on-one discussions with members of the industry, helped develop the outlook. The forecasts are based on macroeconomic drivers such as exchange rates, oil prices, the global economy and the economies of our key visitor markets. The industry-led and government supported Tourism 2025 framework provides a shared vision and common framework to drive the contribu on tourism makes to the New Zealand economy. Success of ini a ves under the framework will help the tourism sector achieve its $41 billion aspira onal goal by 2025 based on 6 per cent year-on-year growth in interna onal expenditure. The tourism forecasts 2015-2021 show New Zealand just shy of the interna onal expenditure target, at 5.8 per cent growth per year to 2021. MINISTRY OF BUSINESS, INNOVATION & EMPLOYMENT 1 New Zealand Tourism Forecasts 2015-2021
2. Execu ve Summary
New Zealand’s interna onal tourism market is in good health. 2014 outperformed the solid
performance of 2013, with total spend across all markets up 13.2 per cent in the year to
December 2014. Both volume (visitor arrivals) and value (visitor spend) drivers are now
contribu ng to growth. More people are coming and spending more each trip.

2.1 Recent performance
Visitor arrivals increased 5.3 per cent (or 143,000 extra visitors) in the year to December 2014.
Visitor volumes from emerging markets and some advanced economies have grown rapidly in
the last year (see Figure 1). The number of Chinese visitors con nues to grow, and, compared to
previous years, they are now staying longer.
Value has also li ed, with average spend per trip up 7 per cent (to $2,900) in 2014. Visitors from
the US are boos ng the contribu on to overall value, with total spend up almost a third in 2014;
and Chinese visitor spend is up 49.6 per cent in the last year.

Figure 1: Growth from New Zealand’s top visitor markets has been posi ve over 2014

        Source: Growth in visitor arrivals to NZ, year ending December 2014, Sta s cs New Zealand

MINISTRY OF BUSINESS, INNOVATION & EMPLOYMENT     2                          New Zealand Tourism Forecasts 2015-2021
2.2 Outlook to 2021
The tourism sector looks well-posi oned to capture opportuni es from several markets. The
outlook to 2021 is very posi ve and while there is a risk of an economic downturn in China, the
central forecast scenario suggests China will be New Zealand’s largest market in terms of
expenditure within the next 7 years.
◦ Visitor arrivals to New Zealand are expected to grow 4 per cent a year, reaching 3.8 million
visitors in 2021 from 2.9 million in 2014. The number of interna onal holidaymakers has
been flat in recent years but is expected to improve rapidly over the forecast period.
◦ Total interna onal spend is expected to reach $11.1 billion in 2021, up nearly 48.5 per cent
on 2014 total spend. Spending in 2015 is expected to surpass the pre-GFC high of $7.6
billion in 2007. Volume is playing a role but increasingly value is contribu ng to the
bo om-line. Although spend per day has been flat or falling for several years now and
forecast to decline slightly, trends are showing visitors are staying longer and spending
more per trip, li ing value overall.
◦ Australia is New Zealand’s largest visitor market, providing over 1.2 million visitors in 2014.
This market will con nue to be healthy and looks set to grow by 3 per cent a year to 2021.
◦ We expect strong visitor growth from China and a maturing of this market towards longer
stays. There could be shocks to the Chinese economy along the way, and one of the
scenarios in this report (refer to sec on 6.1), explores the possibility of how such a shock
could play out. As an example, a shock to the Chinese economy that reduces its economic
growth to half that of what it is now, is es mated to reduce the forecast of Chinese visitors
to New Zealand from 571,000 visitor arrivals that are currently predicted in 2021, to
435,000 instead. This scenario, however, s ll equates to a 7.3 per cent annual growth for
China (compared with the central scenario growth rate of 11.6 per cent per year). This
growth s ll far exceeds the growth rate forecast in other key markets.
◦ The impact of a strong New Zealand dollar looks much weaker than expected. New Zealand
has just experienced two consecu ve years of strong growth in both visitor arrivals and
spending during a me when we expected the strong New Zealand dollar to weigh heavily
on the outlook. Excep onally strong growth from emerging markets, par cularly China,
and a boost from US visitors as the US economy strengthens are two explanatory factors.
◦ The sharp decline in oil prices, which started in the second half of 2014 has helped boost
interna onal tourism. We expect the fall in prices to hold across 2015 and 2016, but to
creep upwards in future years. Cheaper oil should mean cheaper airfares, and this will be a
contribu ng factor to boost visitor arrivals to New Zealand.
◦ The forecasts provide a baseline for what will happen ‘if things keep going this way’.
Marke ng and visitor experience will, of course, con nue to play an important role - as
well as airline routes and changes in airline capacity. The forecasts can be used to help
industry plan strategically, and are by no means se ng targets for specific markets. MBIE
will con nue to update the forecast outlook annually.
MINISTRY OF BUSINESS, INNOVATION & EMPLOYMENT 3 New Zealand Tourism Forecasts 2015-20212.3 Outlook for all markets
Summary 2014 2021
Total spend ($m)1 7,445 11,055
Total visitors (000s)2 2,854 3,755
Total days (000s)2 56,765 86,643
Spend per day ($)3 161 158
Ave length of stay (days)2 20 23
Figure 2: Summary of forecasts: All
(A) Total spend per year (B) Spend per visitor day
500
10,000
$NZ, millions
400
8,000 300
$NZ
200
6,000
100
4,000 0
1990 2000 2010 2020 1990 2000 2010 2020
(C) Total visitor days (D) Average length of stay
90
days, millions
20
70
15
days
50 10
5
30
0
1990 2000 2010 2020 1990 2000 2010 2020
(E) Total visitor arrivals Holiday
(F) Visitor mix
2,000
arrivals, thousands
arrivals, thousands
VFR
Business
3,000 1,500
Other
1,000
2,000
500
1,000
1990 2000 2010 2020 1990 2000 2010 2020
GROWTH
Year 2014 2015 2016 2017 2018 2019 2020 2021 Total Annual5
Total spend ($m)1 7,445 8,155 8,549 8,982 9,443 9,938 10,474 11,055 48% 5.8%
Total visitors (000s)2 2,854 2,996 3,118 3,243 3,371 3,498 3,626 3,755 32% 4.0%
Total days (000s)2 56,765 62,753 66,368 70,231 73,174 77,391 81,856 86,643 53% 6.2%
Spend per day ($)3 161 157 157 156 158 158 158 158 -2% -0.3%
Ave length of stay (days)2 20 21 21 22 22 22 23 23 15% 2.0%
1. Interna onal Visitor Survey, MBIE; 2. Interna onal Travel & Migra on data, Sta s cs NZ; 3. Derived from Interna onal Visitor Survey; 5. Compound Average Growth Rate per
year (’14-’21).
MINISTRY OF BUSINESS, INNOVATION & EMPLOYMENT 4 New Zealand Tourism Forecasts 2015-2021New Zealand’s biggest markets for visitor arrivals
Figure 3: In terms of volume, Australia is projected to con nue being New Zealand’s largest market
1,500
Visitor arrivals (000s)
1,000 Australia
China
US
UK
Japan
500 Germany
0
2000 2005 2010 2015 2020
Source: Sta s cs New Zealand, NZIER
New Zealand’s biggest markets for spend
Figure 4: Australians contribute the most to total spend now, but China is likely to overtake by 2020, and
the US is showing strong growth
2,000
Total spend ($m)
China
Australia
US
UK
1,000 Japan
Germany
0
2000 2005 2010 2015 2020
Source: MBIE, NZIER
MINISTRY OF BUSINESS, INNOVATION & EMPLOYMENT 5 New Zealand Tourism Forecasts 2015-2021Average length of stay, comparison across markets
Figure 5: Germans stay the longest in New Zealand, and are likely to con nue this pa ern
Germany China Korea
60
40
20
Average length of stay (days)
UK Canada Japan
60
40
20
Australia US
60
40
20
1980 1990 2000 2010 2020 1980 1990 2000 2010 2020
Source: Sta s cs New Zealand, NZIER
MINISTRY OF BUSINESS, INNOVATION & EMPLOYMENT 6 New Zealand Tourism Forecasts 2015-20213. Fundamental drivers
3.1 Recent drivers
Both volume and value drivers contributed to a strong increase in total spend of interna onal
visitors to New Zealand.
Figure 6 below illustrates last year’s growth for interna onal visitors to New Zealand in terms of
both volume and value.
Figure 6: Many factors are working in tandem to li total spend. Volume and value growth, year ending
December 2014
Length of stay
19.9 days
Spend per trip Up 3.6%
$2,901
Up 6.8% Spend per day
$161
Visitor Spending Down -0.9%
$7.4 billion
Up 13.2%
Share by purpose
Number of visitors Holiday 48%
2.9m VFR 32%
Up 5.3% Business 9%
Other 11%
Source: Sta s cs New Zealand, MBIE
Figure 7 shows the percentage year-on-year growth for both spend and visitor arrivals. While
visitor numbers grew by 5.3 per cent in 2014, total spend was up propor onately more, by 13.2
per cent in the same period. Total spend reached $7.4 billion by the end of 2014, almost at its
pre-GFC high of $7.6 billion in 2007.
MINISTRY OF BUSINESS, INNOVATION & EMPLOYMENT 7 New Zealand Tourism Forecasts 2015-2021Figure 7: Growth in spend has overtaken growth in visitor arrivals. Percentage year-on-year growth in
total spend and visitor arrivals
10%
Per cent growth
5%
Spend
Visitors
0%
-5%
2012 2013 2014
Source: Interna onal Visitor Survey, MBIE
Many factors came together to increase spend in 2014. Figure 8 illustrates the influence of both
volume and value drivers in total spend growth over the last three years:
◦ A er the GFC, in 2012, the drop in total spend of 6.5 per cent was mostly influenced by
visitors spending less per trip.
◦ In 2013, growth in visitor arrivals dominated the scene, li ing total spend by 3.7 per cent.
◦ Last year, value (as measured by spend per trip) played a much more influen al role in
li ing total spend (by 13.2 per cent in 2014).
MINISTRY OF BUSINESS, INNOVATION & EMPLOYMENT 8 New Zealand Tourism Forecasts 2015-2021Figure 8: Both volume and value drove year-on-year growth in total spend in 2014
15% 13.2%
Growth in spend per trip
Growth in visitors
Growth in total spend
Impact on total spend
10%
3.7%
5%
0%
-5% -6.5%
2012 2013 2014
Source: Interna onal Visitor Survey, MBIE
The increase in spend per trip is driven by visitors staying longer. Average length of stay was up
3.6 per cent in 2014, to 19.9 days.
Figure 9 shows the historic share of interna onal visitor arrivals to New Zealand over me. While
visitors from Oceania (mostly Australians) made up the largest share of New Zealand’s
interna onal visitors up to 2014, is it evident that Asian markets are growing propor onately
more than European markets in recent years.
Standout markets include the US (arrivals up 9.5 per cent in 2014) and China (arrivals up 15.7 per
cent in 2014, having grown 82 per cent in the last three years). Arrivals from Australia were
weaker than expected, up only 2.4 per cent, compared to the 5.4 per cent growth experienced in
2013.
MINISTRY OF BUSINESS, INNOVATION & EMPLOYMENT 9 New Zealand Tourism Forecasts 2015-2021Figure 9: Arrivals from Asian markets are growing
100% 91,000
300,000
Share of international visitor arrivals
441,000
75%
634,000
50%
25% 1,388,000
0%
1983 1988 1993 1998 2003 2008 2013
Oceania Asia Europe Americas Africa and M.E. Other
Source: Sta s cs New Zealand
The sector is growing at rates not seen for several years, at a me when the strong New Zealand
dollar might be expected to crimp growth (see Figure 10).
Figure 10: Exchange rate indexes for key visitor markets
114
110
106
105
Indexed exchange rate
(01 Jan 2011 = 100)
100
CNY
GBP
USD
90 88 EUR
AUD
82
JPY
80
71
70
2011 2012 2013 2014 2015
Source: Oanda
Values less than 100 indicate the currency in ques on buys less NZD than in 2011
MINISTRY OF BUSINESS, INNOVATION & EMPLOYMENT 10 New Zealand Tourism Forecasts 2015-20213.2 Future drivers
Many factors drive the propensity to travel overseas, including:
◦ changes in disposable income
◦ exchange rates (in determining realised spending)
◦ influence of des na on marke ng
◦ airline route availability and capacity.
Delivering a quality visitor experience plays a cri cal role in li ing visitor spend and increasing
the likelihood to return and/or recommend New Zealand as a des na on to others.
Volume
Figure 11 below shows volume growth over the forecast period will come from both advanced
and emerging economies.
Figure 11: Both advanced and emerging economies will drive visitor growth over the forecast period
Australia Advanced economies Emerging economies Other
3,000
Arrivals (000s)
2,000
1,000
0
1980 1990 2000 2010 2020
Source: Sta s cs New Zealand, NZIER
Advanced economies: UK, US, Canada, Germany, Japan, Korea
Emerging economies: China, India, Indonesia
The annual growth rate for Chinese visitors is expected to outstrip all other advanced economies.
Figure 12 shows the forecasted year-on-year growth for all markets (bars), alongside their
forecasted arrival numbers (circles). In terms of absolute volume, Australia will s ll be New
Zealand’s largest market for arrivals over the forecast period, but growth in visitors from China
MINISTRY OF BUSINESS, INNOVATION & EMPLOYMENT 11 New Zealand Tourism Forecasts 2015-2021outstrips all other advanced economies. Visitor growth from emerging markets, India and
Indonesia, will be significant, albeit from a much smaller base of visitors.
Figure 12: China growth outstrips advanced economies
20% 2,000
Forecast 2021 arrivals (000s)
Annual Growth (bars)
15% 1,500
10% 1,000
5% 500
0% 0
All
Australia
Other excl
India and
Indonesia
China
US
UK
Germany
Japan
India
Korea
Canada
Indonesia
Source: NZIER
Bars show annual growth; circles show arrivals forecast in 2021
Advanced economies
Currently the US economy is much more robust than in recent years, with wages star ng to li
for the first me since the GFC. Stock markets con nue to rise, buoyed by low interest rates.
Demand for an interna onal holiday experience, which paused during the GFC, once again is
driving visitor numbers to New Zealand.
Other advanced economies are also improving. In the UK, GDP per capita is on the rise and
labour markets are slowly recovering too. The risks around sovereign default in the euro area are
much lower than 18 months ago. Growth in some countries, such as Germany, is strengthening
but growth in the euro area will be lower than in other regions. Japan and South Korea also look
set to have stronger visitor arrivals than in previous years.
Emerging economies
Growth in visitor arrivals from emerging economies is complemen ng growth from advanced
economies. China is already New Zealand’s second largest market in terms of visitor arrivals.
India, Indonesia and other emerging markets in South America hold poten al and are growing
rapidly albeit from a low base of visitor arrivals. We can expect these markets to boost demand
in the medium to long-term.
MINISTRY OF BUSINESS, INNOVATION & EMPLOYMENT 12 New Zealand Tourism Forecasts 2015-2021Figure 13: Growth of interna onal visitors will be driven by holiday and VFR visitors
2,000
1,500
Visitor arrivals (000s)
Holiday
1,000 VFR
Other
Business
500
0
1980 1990 2000 2010 2020
Source: Sta s cs New Zealand, NZIER
Much of New Zealand’s future growth is expected to come from holidaymakers and those visi ng
friends and rela ves (see Figure 13). This is a cri cal dynamic. The number of interna onal
holidaymakers has been flat in recent years but is expected to improve rapidly over the forecast
period.
MINISTRY OF BUSINESS, INNOVATION & EMPLOYMENT 13 New Zealand Tourism Forecasts 2015-2021 Value
Despite total spend from all visitor markets forecast to increase 48.5 per cent to 11.1 billion by
2021, average spend per day is forecast to fall slightly. For several years now, spend per day by
visitors to New Zealand has been flat or falling. A number of factors are influencing this, including
the soaring New Zealand dollar making New Zealand’s tourism product less price compe ve.
Domes c costs of supplying tourism services such as restaurant meals can make New Zealand
products feel expensive rela ve to the costs of services in the home country. Having said this,
total spend is 17.4 per cent higher than it was two years ago. Spending in 2015 is expected to
surpass the pre-GFC high of $7.6 billion in 2007.
The main driver for increased spend is that visitors are staying longer. Some markets are playing a
larger role than others in this. For example, visitors from China are rapidly changing their travel
pa erns visi ng more regions and taking on more ac vi es. These factors li ed the average
length of stay of this market by 15 per cent over the last two years, to 18.4 days, a trend we
expect to con nue.
Increasingly, emerging economies are boos ng growth in value and not just volume. Figure 14
shows that by 2021, visitors from emerging economies such as China, India and Indonesia will
contribute a large propor on (28.6 per cent) of the total visitor spend.
Figure 14: Emerging economies will drive growth in spend
Australia Advanced economies Emerging economies Other
$9
Spend (billions)
$6
$3
$0
2000 2005 2010 2015 2020
Source: Sta s cs New Zealand, NZIER
Advanced economies: UK, US, Canada, Germany, Japan, Korea
Emerging economies: China, India, Indonesia
MINISTRY OF BUSINESS, INNOVATION & EMPLOYMENT 14 New Zealand Tourism Forecasts 2015-2021Figure 15 below shows the annual year-on-year forecasted growth for spend across all markets
(bars), alongside their forecasted spend (circles). In terms of absolute volumes, China will be
New Zealand’s largest market for spend in 2021, as well as a fast-growing one. The US, Germany
and India are also forecast to have significant growth in total spend.
Figure 15: China is forecast to be New Zealand’s largest market in terms of expenditure
20% $3
Forecast 2021 spend ($bn)
Annual Growth (bars)
15%
$2
10%
$1
5%
0% $0
All
Australia
Canada
China
Germany
Japan
Korea
Other
UK
US
Source: NZIER
Bars show annual growth; circles show spend forecast in 2021
MINISTRY OF BUSINESS, INNOVATION & EMPLOYMENT 15 New Zealand Tourism Forecasts 2015-20214. Outlook for key markets
The following sec ons provide forecasts and commentary on each of our key markets:
◦ Australia
◦ Asia
◦ China
◦ Japan
◦ South Korea
◦ Europe and Americas
◦ United Kingdom
◦ United States of America
◦ Canada
◦ Germany
Interac ve web tool and market summaries
Available on MBIE’s website is an interac ve web tool to explore forecasts data by market, as well
as downloadable one-page summaries for each market. These can be found here:
h p://www.med.govt.nz/sectors-industries/tourism/tourism-research-data/forecasts.
Other markets
Visitor markets classified within ’other’ are an important source of visitors for New Zealand.
These include emerging markets India and Indonesia, as well as markets in South East Asia (e.g.
Thailand, Singapore and Malaysia), and in La n America (e.g. Brazil and Argen na).
In the year ending December 2014, ’other’ markets made up 24.8 per cent of total spend to New
Zealand, equivalent to $1,844 million, and this is expected to grow 18.4 per cent to $2,183 by the
year 2021. Total visitors from ’other’ markets are expected to grow 27.4 per cent over the
forecast period to 783,000 arrivals in 2021.
A full one-page summary of forecasts for ‘other’ markets can be found in Appendix A.
MINISTRY OF BUSINESS, INNOVATION & EMPLOYMENT 16 New Zealand Tourism Forecasts 2015-20214.1 Australia
Summary 2014 2021 Visitor market characteris cs4
Total spend ($m)1 2,054 2,296 GDP per capita (PPP) 43,202
Total visitors (000s)2 1,248 1,535 Popula on (millions) 23.1
Total days (000s)2 13,455 18,328 Outbound departures (millions) 8.8
Spend per day ($)3 171 140 Outbound spend (USD mn) 28,376
Ave length of stay (days)2 11 12
Figure 16: Summary of forecasts: Australia
(A) Total spend per year (B) Spend per visitor day
500
$NZ, millions
2,000 400
300
$NZ
1,600
200
1,200
100
800 0
1990 2000 2010 2020 1990 2000 2010 2020
(C) Total visitor days (D) Average length of stay
15
days, millions
15
10
days
10
5
5 0
1990 2000 2010 2020 1990 2000 2010 2020
(E) Total visitor arrivals Holiday
(F) Visitor mix
arrivals, thousands
arrivals, thousands
1,500 600 VFR
Business
1,200 Other
400
900
200
600
300
1990 2000 2010 2020 1990 2000 2010 2020
GROWTH
Year 2014 2015 2016 2017 2018 2019 2020 2021 Total Annual5
Total spend ($m)1 2,054 2,179 2,177 2,202 2,225 2,248 2,272 2,296 12% 1.6%
Total visitors (000s)2 1,248 1,285 1,324 1,363 1,404 1,446 1,490 1,535 23% 3.0%
Total days (000s)2 13,455 15,405 15,915 16,374 16,843 17,324 17,819 18,328 36% 4.5%
Spend per day ($)3 171 159 153 151 148 145 143 140 -18% -2.8%
Ave length of stay (days)2 11 12 12 12 12 12 12 12 9% 1.3%
1. Interna onal Visitor Survey, MBIE; 2. Interna onal Travel & Migra on data, Sta s cs NZ; 3. Derived from Interna onal Visitor Survey; 4. World Bank data
(h p://data.worldbank.org/indicator); 5. Compound Average Growth Rate per year (’14-’21).
MINISTRY OF BUSINESS, INNOVATION & EMPLOYMENT 17 New Zealand Tourism Forecasts 2015-2021Australia is New Zealand’s only major short-haul market and provides many of our interna onal
visitor arrivals. Many Australians visit friends and rela ves and tend to come more frequently but
stay for shorter periods than visitors from long-haul markets. Figure 17 shows the states where
most of New Zealand’s Australian visitors originate from.
Figure 17: New South Wales is the state that provides most Australian visitors to New Zealand, followed
by Queensland and Victoria
New South Wales
Queensland
Queensland
Victoria Western Australia
Western Australia
South Australia
New South Wales
South Australia
Australian Capital Territory
Victoria
State/territory not stated
Tasmania
Tasmania
Northern Territory
Visitors to
New Zealand 2014
100,000 400,000 50,000 300,000
Source: Visitor arrivals to New Zealand by Australian state, year to December 2014, Sta s cs
New Zealand
Currently the Australian economy is weak, reflected in an Australian dollar that can buy far fewer
New Zealand goods and services than in recent years. Growth in arrivals from Australia halved in
2014, down to 2.4 per cent from 5.4 per cent only a year earlier.
In the short-term, we can expect moderate growth in the Australian market. Long-term drivers
include the movement of New Zealanders, living in Australia, across the Tasman and subsequent
growth of travellers visi ng friends and rela ves. However, compe on for Australian outbound
from Asian markets is intensifying. Looking forward, visitor growth from Australia is likely to be
lower than in previous periods.
MINISTRY OF BUSINESS, INNOVATION & EMPLOYMENT 18 New Zealand Tourism Forecasts 2015-2021 Forecasts and drivers
◦ When their economy is weak, Australians tend to forego more expensive long-haul holidays
and treat New Zealand more like a cheaper domes c holiday, mi ga ng the impact on
visitor arrivals of a downturn in the Australian economy. Since the GFC, Australians have
preferred to holiday abroad rather than take domes c holidays (see Figure 18).
Figure 18: Australian forecasts show a trend towards more interna onal holidays, with strong growth in
outbound from Australia (as well as very strong growth in inbound)
40.7%
40% 37.5%
Forecast growth 2014-2021
30%
20%
10% 7.6%
3.2%
0%
Overnight trips Day trips Outbound trips Inbound visitors
Source: Tourism Research Australia
◦ Changes in air capacity can have a strong influence on arrivals from Australia, especially if
they result in increased compe ve pressure on air fare prices.
◦ Spending was down over 7 per cent in 2014 because of the much weaker Australian dollar.
We expect that weakness to con nue in to 2015 with Australian households being cau ous
with spending. Flat or falling interest rates will also lower the Australian dollar. Australia’s
currency deprecia on is partly due to prices for Australians key export commodi es being
driven lower by ongoing weakness and uncertainty in China’s real estate market.
◦ Unlike during the GFC, when the Australian Government spent up to boost consump on,
now the Government books are under pressure to return to surplus. The only avenue to
boost consump on and investment is for the Reserve Bank of Australia to reduce interest
rates, but that will weaken the Australian dollar.
MINISTRY OF BUSINESS, INNOVATION & EMPLOYMENT 19 New Zealand Tourism Forecasts 2015-2021◦ The longer-term outlook for Australia is more op mis c. The Australian economy will
rebound and the movement of New Zealanders (living in Australia) across the Tasman will
con nue to boost visitor arrivals. The broadening appeal of new and growing Asian
markets temper longer-term possibili es (see Figure 19).
Figure 19: Asian des na ons are providing more compe on
Australian outbound travellers ('000)
1,500
Other Asia
Europe
New Zealand
Indonesia
1,000
United States
Thailand
China
500
2012 2016 2020
Source: Outbound for Australian visitors, Tourism Research Australia
MINISTRY OF BUSINESS, INNOVATION & EMPLOYMENT 20 New Zealand Tourism Forecasts 2015-20214.2 Asia
Outbound tourism from China is changing the profile of New Zealand’s interna onal tourism
markets. Recent sustained visitor growth has coincided with expanding growth in spend. Whilst
other Asian markets are also moving ahead, it is hard to go past the remarkable growth of
Chinese visitor arrivals, which are forecast to exceed half a million by 2020; and total spend from
the China market is forecast to overtake Australia’s total spend by 2020, albeit numbers of
Australian visitors will be threefold that of the Chinese, at just under 1.5 million visitors by 2020.
Other Asian markets are also showing growth, albeit from a smaller visitor base than the
dominant China market.
Figure 20: Many Asian countries are growing strongly, especially China
Source: Growth in visitor arrivals to NZ, year to December 2014, Sta s cs New Zealand
MINISTRY OF BUSINESS, INNOVATION & EMPLOYMENT 21 New Zealand Tourism Forecasts 2015-2021China
Summary 2014 2021 Visitor market characteris cs4
Total spend ($m)1 1,037 2,612 GDP per capita (PPP) 11,907
Total visitors (000s)2 265 571 Popula on (millions) 1,357.4
Total days (000s)2 4,874 15,935 Outbound departures (millions) 98.2
Spend per day ($)3 309 238 Outbound spend (USD mn) 128,576
Ave length of stay (days)2 18 28
Figure 21: Summary of forecasts: China
(A) Total spend per year (B) Spend per visitor day
500
$NZ, millions
2,000 400
300
$NZ
1,000 200
100
0 0
1990 2000 2010 2020 1990 2000 2010 2020
(C) Total visitor days (D) Average length of stay
15
days, millions
40
10
days
5 20
0 0
1990 2000 2010 2020 1990 2000 2010 2020
(E) Total visitor arrivals Holiday
(F) Visitor mix
arrivals, thousands
arrivals, thousands
400 VFR
Business
400 300 Other
200
200
100
0 0
1990 2000 2010 2020 1990 2000 2010 2020
GROWTH
Year 2014 2015 2016 2017 2018 2019 2020 2021 Total Annual5
Total spend ($m)1 1,037 1,278 1,441 1,623 1,828 2,059 2,319 2,612 152% 14.1%
Total visitors (000s)2 265 305 348 394 442 486 530 571 115% 11.6%
Total days (000s)2 4,874 6,601 7,860 9,277 10,849 12,451 14,154 15,935 227% 18.4%
Spend per day ($)3 309 281 266 254 244 240 238 238 -23% -3.7%
Ave length of stay (days)2 18 22 23 24 25 26 27 28 56% 6.5%
1. Interna onal Visitor Survey, MBIE; 2. Interna onal Travel & Migra on data, Sta s cs NZ; 3. Derived from Interna onal Visitor Survey; 4. World Bank data
(h p://data.worldbank.org/indicator); 5. Compound Average Growth Rate per year (’14-’21).
MINISTRY OF BUSINESS, INNOVATION & EMPLOYMENT 22 New Zealand Tourism Forecasts 2015-2021Last year Chinese visitors spent over a billion dollars in the New Zealand economy. Provided the
New Zealand tourism industry can con nue to deliver a great visitor experience for this market
and economic condi ons in China con nue to hold, we can expect outstanding growth to persist.
The China market goes from strength to strength, the pace of change is extremely rapid and this
con nues to present the biggest challenge and opportunity for industry.
In 2014, visitor arrivals grew 15.7 per cent, to 265,000. Spend per day was up 4.6 per cent to
$309 per day. Average length of stay was up 7.6 per cent (to 18.4 days). All these factors
combined to increase total spend from China by 49.6 per cent in the last year.
Figure 22 shows the provinces where New Zealand’s Chinese visitors originate from. Airlines
con nue to increase their capacity on direct routes from China to New Zealand and the ques on
is whether demand (both ways) will con nue to meet these capacity increases, especially in
quieter seasons. Many visitors from China also travel to New Zealand via connec ng flightrs
through hubs in, for example, Australia and Singapore.
Figure 22: Shanghai, Guangdong, and Beijing are the top Chinese provinces for visitor arrivals to NZ
Shanghai
Guangdong
Beijing
Zhejiang Beijing
Liaoning
Shandong
Jiangsu
Jiangsu
Sichuan Sichuan Shanghai
Zhejiang
Shandong Fujian
Liaoning
Guangdong
Province not stated
Other
Visitors to
New Zealand 2014
10,000 30,000 50,000 5,000 35,000
Source: Visitor arrivals to New Zealand by Chinese province, year to December 2014, Sta s cs
New Zealand
MINISTRY OF BUSINESS, INNOVATION & EMPLOYMENT 23 New Zealand Tourism Forecasts 2015-2021 Forecasts and drivers
◦ There are an increasing propor on of free and independent travellers (FITs) from the China
market - these visitors tend to stay much longer than visitors on group shopping tours.
This, in turn, has helped li spend from this market.
◦ With more FITs from China, the travel pa erns of this market are changing, with Chinese
visitors spreading further across New Zealand’s regions (see Figure 23). Chinese visitors are
also engaging in a wider range of ac vi es - out of the 72 ac vi es reported in the
Interna onal Visitor Survey, Figure 24 show the most and least popular ac vi es
undertaken by Chinese visitors in 2014, compared with par cipa on rates of all
interna onal visitors. The changes in travel pa erns for the China market are having a
posi ve impact on length of stay and spend for this market.
Figure 23: The Chinese are visi ng more regions than before, with strong growth in spend especially in
South Island regions
Average growth
(Per cent per year)
40%
0%
-40%
Spend for
YEMarch 2014
($ million)
$100
$200
$300
$400
Source: MBIE
MINISTRY OF BUSINESS, INNOVATION & EMPLOYMENT 24 New Zealand Tourism Forecasts 2015-2021Figure 24: Par cipa on rates for popular ac vi es undertaken by Chinese holidaymakers, and how rates
compare with all interna onal holidaymakers
Chinese visitors All visitors
Maori culture
Go for a walk, hike, trek or tramp
A beach
Natural attraction
Geothermal park
A national park
Scenic boat trip
Museum or art gallery
A casino
Air activities
80%
60%
40%
20%
0%
Participation rate
Source: MBIE
◦ Chinese economic growth shi ed down a gear in 2014 and is likely to show sub-7 per cent
growth in the next two to three years. Growth is reorien ng itself towards consump on
and services and away from exports; factors that encourage rather than hinder Chinese
households from undertaking interna onal travel. We expect visitor arrivals from China to
con nue to grow strongly over the forecast horizon.
◦ There is the possibility of a marked slowdown in the Chinese economy, due to
overstretched local government debt and the chance of extended real estate markets
eventually correc ng themselves. Later on in this report, there are scenarios of
interna onal arrivals to New Zealand based on varying growth predic ons for the China
market.
MINISTRY OF BUSINESS, INNOVATION & EMPLOYMENT 25 New Zealand Tourism Forecasts 2015-2021Japan
Summary 2014 2021 Visitor market characteris cs4
Total spend ($m)1 202 191 GDP per capita (PPP) 36,223
Total visitors (000s)2 81 90 Popula on (millions) 127.3
Total days (000s)2 1,418 1,857 Outbound departures (millions) 17.5
Spend per day ($)3 152 110 Outbound spend (USD mn) 21,861
Ave length of stay (days)2 18 21
Figure 25: Summary of forecasts: Japan
(A) Total spend per year (B) Spend per visitor day
800 500
$NZ, millions
400
600
300
$NZ
400 200
100
200 0
1990 2000 2010 2020 1990 2000 2010 2020
(C) Total visitor days (D) Average length of stay
20
days, millions
2.4
15
days
2.0 10
1.6 5
1.2 0
1990 2000 2010 2020 1990 2000 2010 2020
(E) Total visitor arrivals (F) Visitor mix
arrivals, thousands
arrivals, thousands
150
Holiday
VFR
150
100 Business
Other
120
50
90
0
1990 2000 2010 2020 1990 2000 2010 2020
GROWTH
Year 2014 2015 2016 2017 2018 2019 2020 2021 Total Annual5
Total spend ($m)1 202 193 187 185 185 186 188 191 -5% -0.8%
Total visitors (000s)2 81 82 84 85 86 87 89 90 11% 1.5%
Total days (000s)2 1,418 1,418 1,430 1,481 1,554 1,643 1,744 1,857 31% 3.9%
Spend per day ($)3 152 145 139 133 127 121 115 110 -28% -4.5%
Ave length of stay (days)2 18 17 17 18 18 19 20 21 17% 2.2%
1. Interna onal Visitor Survey, MBIE; 2. Interna onal Travel & Migra on data, Sta s cs NZ; 3. Derived from Interna onal Visitor Survey; 4. World Bank data
(h p://data.worldbank.org/indicator); 5. Compound Average Growth Rate per year (’14-’21).
MINISTRY OF BUSINESS, INNOVATION & EMPLOYMENT 26 New Zealand Tourism Forecasts 2015-2021The outlook for Japan is mixed. Visitor growth surged in 2014, up 8.8 per cent on a year earlier,
exceeding expecta ons in last year’s forecasts. Although visitor growth was strong, spending
decreased by 5.5 per cent over the same period.
The visitors from Japan are increasingly younger and at least for now spend less than older
visitors to New Zealand. The Japanese economic recovery remains stagnant and the Yen is 30 to
35 per cent weaker than it was a few years ago, reducing the likelihood of any sustained recovery
in spending from this market. We expect Japanese visitor arrivals to post modest growth across
the next 7 years.
Forecasts and drivers
◦ Although Japanese visitor arrivals were up 8.8 per cent in 2014, the Japanese economy has
been weak, so other factors must be at play to sustain this growth.
◦ The age distribu on of Japanese visitors has shi ed towards the younger brackets (see
Figure 26), and these visitors spend less than their older counterparts. Encouraging repeat
visits provides an opportunity to grow the number of visitors, although the weak Yen likely
caps the extent of growth in spend.
◦ Economic growth in Japan remains very weak at around 0.5 to 1 per cent at the end of
2014 and early 2015.
◦ The Japanese government is carrying high levels of debt and introduced an addi onal tax
on consump on to boost revenue. This tax slowed the economy to a greater extent than
was expected so the government has now pushed out the ming of addi onal tax
increases that are required to reduce debt.
Figure 26: Japanese visitors are now much younger than before
2009 2014
Per cent share of holiday visitors
20%
10%
0%
Under 30 30-39 40-49 50-59 60-69 70+
Source: MBIE
MINISTRY OF BUSINESS, INNOVATION & EMPLOYMENT 27 New Zealand Tourism Forecasts 2015-2021South Korea
Summary 2014 2021 Visitor market characteris cs4
Total spend ($m)1 145 199 GDP per capita (PPP) 33,062
Total visitors (000s)2 55 77 Popula on (millions) 50.2
Total days (000s)2 1,021 1,229 Outbound departures (millions) 14.8
Spend per day ($)3 257 292 Outbound spend (USD mn) 21,676
Ave length of stay (days)2 18 16
Figure 27: Summary of forecasts: Korea
(A) Total spend per year (B) Spend per visitor day
400 500
$NZ, millions
300 400
300
$NZ
200
200
100 100
0 0
1990 2000 2010 2020 1990 2000 2010 2020
(C) Total visitor days (D) Average length of stay
40
days, millions
2.0
1.5 30
days
1.0 20
0.5 10
0
1990 2000 2010 2020 1990 2000 2010 2020
(E) Total visitor arrivals (F) Visitor mix
arrivals, thousands
arrivals, thousands
Holiday
100 90 VFR
Business
60 Other
50
30
0 0
1990 2000 2010 2020 1990 2000 2010 2020
GROWTH
Year 2014 2015 2016 2017 2018 2019 2020 2021 Total Annual5
Total spend ($m)1 145 154 162 169 176 183 191 199 37% 4.6%
Total visitors (000s)2 55 60 63 65 68 71 74 77 40% 4.9%
Total days (000s)2 1,021 1,029 1,076 1,121 1,159 1,191 1,214 1,229 20% 2.7%
Spend per day ($)3 257 270 271 272 273 277 283 292 14% 1.8%
Ave length of stay (days)2 18 17 17 17 17 17 16 16 -11% -1.7%
1. Interna onal Visitor Survey, MBIE; 2. Interna onal Travel & Migra on data, Sta s cs NZ; 3. Derived from Interna onal Visitor Survey; 4. World Bank data
(h p://data.worldbank.org/indicator); 5. Compound Average Growth Rate per year (’14-’21).
MINISTRY OF BUSINESS, INNOVATION & EMPLOYMENT 28 New Zealand Tourism Forecasts 2015-2021A er falling in 2013, Korean visitor arrivals increased 8.8 per cent in 2014, to 55,000 visitors.
Korean household consump on was much weaker in 2013 and early 2014 but is now improving in
2015. The Korean Won has also been stronger than many other currencies, boos ng spend from
this market. We expect moderate growth from the Korean market in the short to medium-term.
Forecasts and drivers
◦ The Korean economy was fairly weak in 2013 and early 2014, with reduced household
consump on in the face of domes c uncertainty and earlier falls in house prices.
◦ Most analysts expect stronger economic growth of around 3-4 per cent for South Korea
across 2015-16. Interest rates have been low, s mula ng consump on and investment in
the economy, which contributes to economic growth, helping support outbound tourism
from South Korea.
◦ Unlike many other markets, the Won has been apprecia ng against the New Zealand
dollar, li ing spending from this market.
◦ There are risks to the outlook that include a so ening in China’s economy and/or the
global economy, but South Korea’s fiscal posi on is stronger than before, which means
policymakers have more headroom to respond to any deteriora on in economic
condi ons.
◦ Historically, Korean visitors to New Zealand have been par cularly sensi ve to downturns
in their own economic condi ons. Visitor arrivals tend to drop rapidly as a consequence
(see Figure 28).
Figure 28: Korean visitor growth is weak when the economy is weak
20%
GDP growth 200%
Visitor growth
10%
Visitor growth
GDP growth
100%
0% 0%
-100%
-10%
1990 1995 2000 2005 2010 2015
Source: Datastream
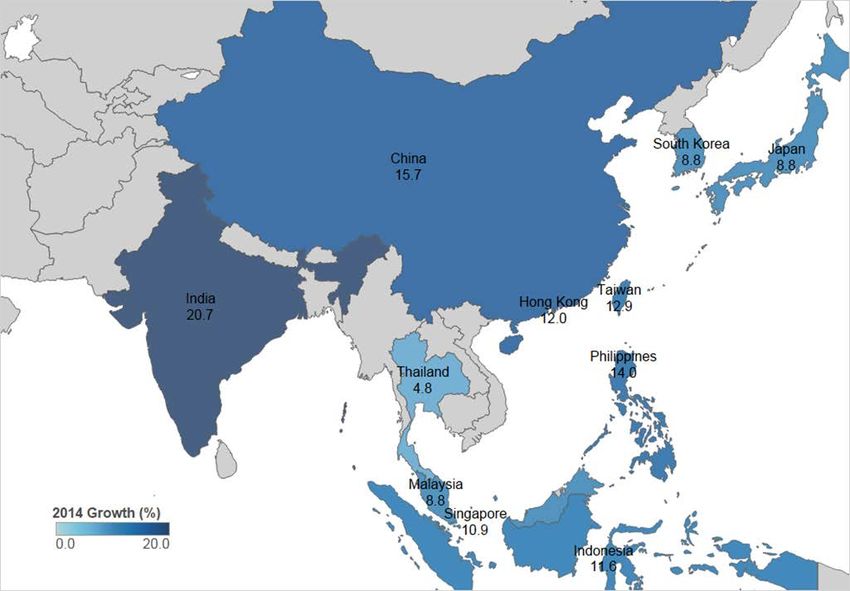
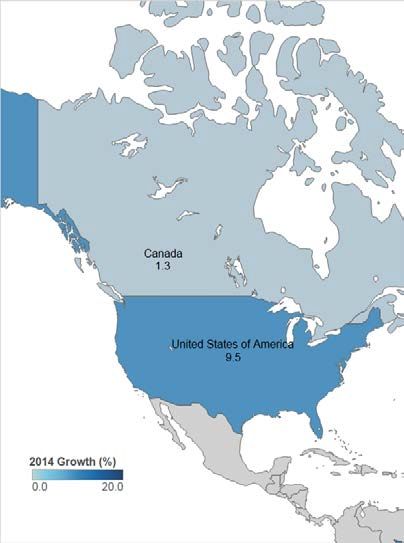
MINISTRY OF BUSINESS, INNOVATION & EMPLOYMENT 29 New Zealand Tourism Forecasts 2015-20214.3 Europe and Americas
Visitor arrivals from advanced economies in Europe and North America con nued to climb in
2014. Strong US visitor growth led the way, outperforming other countries. Different economic
outlooks, with interest rate hikes more likely in the US than elsewhere, drive currency
differen als that will impact on bo om-line spend on a market-by-market basis. As a des na on,
New Zealand is in compe on for European demand with emerging markets such as Eastern
Europe and South America.
Figure 29: Growth in visitor arrivals from Europe and the Americas has picked up in 2014
(a) Europe (b) North America
Source: Growth in visitor arrivals, year ending December 2014, Sta s cs New Zealand
MINISTRY OF BUSINESS, INNOVATION & EMPLOYMENT 30 New Zealand Tourism Forecasts 2015-2021United Kingdom
Summary 2014 2021 Visitor market characteris cs4
Total spend ($m)1 790 981 GDP per capita (PPP) 38,259
Total visitors (000s)2 194 217 Popula on (millions) 64.1
Total days (000s)2 5,640 6,777 Outbound departures (millions) 58.5
Spend per day ($)3 144 148 Outbound spend (USD mn) 52,490
Ave length of stay (days)2 29 31
Figure 30: Summary of forecasts: UK
(A) Total spend per year (B) Spend per visitor day
500
$NZ, millions
1,250 400
1,000 300
$NZ
200
750
100
500 0
1990 2000 2010 2020 1990 2000 2010 2020
(C) Total visitor days (D) Average length of stay
days, millions
8 30
days
20
6
10
4
0
1990 2000 2010 2020 1990 2000 2010 2020
(E) Total visitor arrivals Holiday
(F) Visitor mix
arrivals, thousands
arrivals, thousands
300 VFR
150
Business
250
Other
100
200
150 50
100
0
1990 2000 2010 2020 1990 2000 2010 2020
GROWTH
Year 2014 2015 2016 2017 2018 2019 2020 2021 Total Annual5
Total spend ($m)1 790 831 846 869 895 923 951 981 24% 3.1%
Total visitors (000s)2 194 196 198 202 205 209 213 217 12% 1.6%
Total days (000s)2 5,640 6,015 6,093 6,215 6,349 6,489 6,631 6,777 20% 2.7%
Spend per day ($)3 144 142 142 143 145 146 147 148 3% 0.4%
Ave length of stay (days)2 29 31 31 31 31 31 31 31 7% 1.0%
1. Interna onal Visitor Survey, MBIE; 2. Interna onal Travel & Migra on data, Sta s cs NZ; 3. Derived from Interna onal Visitor Survey; 4. World Bank data
(h p://data.worldbank.org/indicator); 5. Compound Average Growth Rate per year (’14-’21).
MINISTRY OF BUSINESS, INNOVATION & EMPLOYMENT 31 New Zealand Tourism Forecasts 2015-2021Economic growth in the UK has been modest. Infla on has been close to zero allowing the Bank
of England to maintain extremely low levels of interest rates. Whilst this has helped consumers
reduce debt a er a prolonged recession it has also kept the Bri sh pound low against the soaring
New Zealand dollar. Visitor growth was modest in 2014, up 1.5 per cent, backing up the posi ve
visitor growth in 2013 a er several stagnant years. The UK economy is picking up and household
consump on will grow.
We expect moderate growth from this market, and compe on from cheaper European
des na ons to limit a strong upturn in UK visitor arrivals.
Forecasts and drivers
◦ The UK economy is improving, with extended periods of low interest rates helping
households reduce debt and boost the local economy. A weak fiscal posi on and modest
growth in key trading partners puts a cap on a strong upturn to the growth outlook.
◦ Households have benefited from cheaper energy prices - both oil and domes c - resul ng
in higher disposable incomes.
◦ Both GDP per capita and labour markets are improving, although long-term
unemployment con nues to weigh on the UK economy (see Figure 31).
◦ UK spend per day in New Zealand rebounded strongly in 2014, perhaps driven by the
modest li in the UK economy. Since UK visitors tend to stay for longer periods - the
average length of stay sits around 30 days - a persistent li in spend per day has the
poten al to significantly boost the overall value of the UK market.
◦ Longer term, the development of cheaper, predominantly European markets is likely to
constrain the growth poten al of the UK visitor market, but one-off events, like the 2017
Lions Tour, will boost visitor arrivals based on evidence from previous events (see figure
32).
MINISTRY OF BUSINESS, INNOVATION & EMPLOYMENT 32 New Zealand Tourism Forecasts 2015-2021Figure 31: GDP per capita and unemployment in the UK are improving
GDP Per Capita (constant price)
$27,000
GDP per capita
$25,000
$23,000
$21,000
Unemployment Rates
8%
Unemployment
7%
6%
5%
1998 2000 2002 2004 2006 2008 2010 2012 2014 2016 2018 2020
Source:IMF
Figure 32: One-off past events have boosted UK visitor arrivals to both Australia and New Zealand,
showing future promise for events such as the 2017 Lions Tour
Share of UK resident outbound travel
Lions tour of Australia
1.5%
1.0%
Rugby world cup
0.5%
2011 2012 2013 2014 2015
Australia New Zealand
Source: Tourism Research Australia, Sta s cs New Zealand
MINISTRY OF BUSINESS, INNOVATION & EMPLOYMENT 33 New Zealand Tourism Forecasts 2015-2021United States of America
Summary 2014 2021 Visitor market characteris cs4
Total spend ($m)1 771 1,690 GDP per capita (PPP) 53,042
Total visitors (000s)2 221 307 Popula on (millions) 316.1
Total days (000s)2 4,140 5,544 Outbound departures (millions) 61.6
Spend per day ($)3 186 305 Outbound spend (USD mn) 104,678
Ave length of stay (days)2 19 18
Figure 33: Summary of forecasts: US
(A) Total spend per year (B) Spend per visitor day
500
1,600
$NZ, millions
400
1,200 300
$NZ
200
800
100
400 0
1990 2000 2010 2020 1990 2000 2010 2020
(C) Total visitor days (D) Average length of stay
days, millions
5
15
days
4 10
3 5
2 0
1990 2000 2010 2020 1990 2000 2010 2020
(E) Total visitor arrivals Holiday
(F) Visitor mix
arrivals, thousands
arrivals, thousands
200
300 VFR
Business
150
250 Other
100
200
50
150
1990 2000 2010 2020 1990 2000 2010 2020
GROWTH
Year 2014 2015 2016 2017 2018 2019 2020 2021 Total Annual5
Total spend ($m)1 771 923 1,052 1,175 1,296 1,422 1,553 1,690 119% 11.9%
Total visitors (000s)2 221 244 257 268 278 288 297 307 39% 4.8%
Total days (000s)2 4,140 4,354 4,530 4,717 4,911 5,113 5,324 5,544 34% 4.3%
Spend per day ($)3 186 212 232 249 264 278 292 305 64% 7.3%
Ave length of stay (days)2 19 18 18 18 18 18 18 18 -5% -0.8%
1. Interna onal Visitor Survey, MBIE; 2. Interna onal Travel & Migra on data, Sta s cs NZ; 3. Derived from Interna onal Visitor Survey; 4. World Bank data
(h p://data.worldbank.org/indicator); 5. Compound Average Growth Rate per year (’14-’21).
MINISTRY OF BUSINESS, INNOVATION & EMPLOYMENT 34 New Zealand Tourism Forecasts 2015-2021You can also read