Bone, M., Macquart, T., Hamerton, I., & Howlin, B. J. (2020). A Novel Approach to Atomistic Molecular Dynamics Simulation of Phenolic Resins Using ...
←
→
Page content transcription
If your browser does not render page correctly, please read the page content below
Bone, M., Macquart, T., Hamerton, I., & Howlin, B. J. (2020). A Novel
Approach to Atomistic Molecular Dynamics Simulation of Phenolic
Resins Using Symthons. Polymers, 12(4), [926].
https://doi.org/10.3390/polym12040926

Publisher's PDF, also known as Version of record
License (if available):
CC BY
Link to published version (if available):
10.3390/polym12040926

Link to publication record in Explore Bristol Research
PDF-document

This is the final published version of the article (version of record). It first appeared online via MDPI at
https://www.mdpi.com/2073-4360/12/4/926. Please refer to any applicable terms of use of the publisher.

University of Bristol - Explore Bristol Research
General rights

This document is made available in accordance with publisher policies. Please cite only the
published version using the reference above. Full terms of use are available:
http://www.bristol.ac.uk/pure/user-guides/explore-bristol-research/ebr-terms/
Article
A Novel Approach to Atomistic Molecular Dynamics
Simulation of Phenolic Resins Using Symthons
Matthew A. Bone 1,2,*, Terence Macquart 2, Ian Hamerton 2 and Brendan J. Howlin 1
 1   Department of Chemistry & Faculty of Engineering and Physical Sciences, University of Surrey, Guildford,
     Surrey GU2 7XH, UK; b.howlin@surrey.ac.uk
 2 Bristol Composites Institute (ACCIS), Department of Aerospace Engineering, School of Civil, Aerospace,
   and Mechanical Engineering, University of Bristol, Queen’s Building, University Walk,
   Bristol BS8 1TR, UK; terence.macquart@bristol.ac.uk (T.M.); ian.hamerton@bristol.ac.uk (I.H.)
 * Correspondence: matthew.bone@bristol.ac.uk

 Received: 26 March 2020; Accepted: 15 April 2020; Published: 16 April 2020

 Abstract: Materials science is beginning to adopt computational simulation to eliminate laboratory
 trial and error campaigns—much like the pharmaceutical industry of 40 years ago. To further
 computational materials discovery, new methodology must be developed that enables rapid and
 accurate testing on accessible computational hardware. To this end, the authors utilise a novel
 methodology concept of intermediate molecules as a starting point, for which they propose the term
 ‘symthon’ a rather than conventional monomers. The use of symthons eliminates the initial
 monomer bonding phase, reducing the number of iterations required in the simulation, thereby
 reducing the runtime. A novel approach to molecular dynamics, with an NVT (Canonical) ensemble
 and variable unit cell geometry, was used to generate structures with differing physical and thermal
 properties. Additional script methods were designed and tested, which enabled a high degree of
 cure in all sampled structures. This simulation has been trialled on large-scale atomistic models of
 phenolic resins, based on a range of stoichiometric ratios of formaldehyde and phenol. Density and
 glass transition temperature values were produced, and found to be in good agreement with
 empirical data and other simulated values in the literature. The runtime of the simulation was a key
 consideration in script design; cured models can be produced in under 24 h on modest hardware.
 The use of symthons has been shown as a viable methodology to reduce simulation runtime whilst
 generating accurate models.

 Keywords: material simulation; molecular dynamics; intermediate structures; phenolic resins;
 characterisation; symthons

1. Introduction
      Materials development, much like drug development in the pharmaceutical industry, often
relies on a systematic trial and error campaign of the design space for a given material system.
Empirical trials can be time-consuming and costly, both financially and in terms of embodied energy,
as many experiments must be done to explore all possible synthetic conditions. Increasingly, it is
recognised that this approach is inherently unsustainable, since it also involves the production of
waste material that must be disposed of safely. Computer modelling can be used to reduce empirical
trial and error, and more quickly develop materials with increased functionality for bespoke
applications. In the future, the aim of computational materials science is to conduct all trial and error
testing virtually, using laboratory experiments to verify the integrity of a model and synthesise the

a The term ‘Symthon’ is being used as a simulation equivalent of the synthon, popularised by Dr
Stuart Warren in ‘Organic Synthesis: The Disconnection Approach’, OUP: Oxford, 1983.
Polymers 2020, 12, 926; doi:10.3390/polym12040926                              www.mdpi.com/journal/polymers
Polymers 2020, 12, 926 2 of 12
material whose properties are optimal. Rather than spending time developing a single material, time
is spent developing an accurate model that can predict a broad range of materials. Modern materials
development is beginning to see the use of computer simulations for epoxy [1–4], carbon nanotube
[5–7] and hybrid composite materials [8–10], to name but a few. High quality structures give rise to
the accurate prediction of macroscopic physical properties, such as density, glass transition
temperature (Tg), and electrical conductivity [11,12]. The evaluation of these physical properties can
be used to narrow down a broad design space to propose an optimised material, which can
subsequently be tested empirically.
First produced by Leo H. Baekeland and patented in 1907, phenolic resins are considered the
first wholly synthetic plastics, which were later commercialised as Bakelite [13]. Modern uses range
from insulation foam in the construction industry to advanced aerospace applications such as heat
shields employed by spacecraft on re-entry to the Earth’s atmosphere [14,15]. Phenolic resins are
characterized by several key properties: high strength, low flammability, high char yield and low
thermal conductivity [13,16]. These properties arise from the potential for crosslinking within the
resin, but vary between resole and novolac resins. Resoles, the class of phenolic resin modelled in this
work, have a formaldehyde (F):phenol (P) ratio of ≥1:1, up to a limit of 3:1 [17]. Excess formaldehyde
facilitates extensive crosslinking between the chains. This crosslinking occurs via the formation of
hydroxymethylphenol (HMP) intermediate structures, which can be seen in Figure 1. Novolacs have
an F:P ratio ofPolymers 2020, 12, 926 3 of 12
unit cell with periodic boundary conditions is used to keep the simulation size practical yet scalable.
Further to reducing computational demand, interaction cut-offs and energy forcefields are used to
manage bonding and non-bonding interaction energies without the need to undertake ab initio
calculations. Simulations can be influenced by macroscopic (bulk) properties with the
implementation of thermostats/barostats to simulate the effects of temperature and pressure. Further
details of these methods can be found in introductions to the topic by Allen and Tildesley [21] or
Schneider et al. [22]. The design of the script to simulate the polymerisation of the system can affect
the quality of the results, as well as the runtime. Common across many applications of computational
simulation is the concept of static and dynamic approaches. Static approaches complete an action in
its entirety, whilst dynamic approaches perform a subset of an action before continuing to carry out
a major change such as structural movement. In MD, static approaches typically involve bonding
every available bond; dynamic approaches bond a subset of the available bonds, before undergoing
MD simulation, so as to avoid forming the structure too quickly. Monk et al. highlight in a sensitivity
study that the dynamic methodology has a significant impact on the energy of bonded systems [23].
Dynamically cured systems tend to have lower potential energies, but have increased runtimes due
to increased iterations of the curing script.
The use of intermediates, or ‘symthons’, is an easy to implement design philosophy to reduce
the runtime of simulations. Traditional MD simulations follow chemical mechanisms originating
with real monomers. The first step in these simulations is bonding between the monomers. By
contrast, originating the simulation with symthons, this initial bonding step is eliminated, and
polymer chains can begin forming immediately. The HMPs outlined in Figure 1 reflect the second
step of the mechanism in Figure 2, and form the basis of the symthons. This step has been proven
empirically to pass through a quinone methide intermediate [24,25]. One of three products is formed
based on whether the formaldehyde reacts at the ortho- or para- site, denoted as o-o’, o-p’, p-p’ bonded
phenols via a methylene bridge. The cure mechanism is known to be complex, and further side
products have been identified empirically using spectral analysis, e.g., 1H and 13C nuclear magnetic
resonance (NMR) or Fourier transform infrared (FTIR) spectroscopy, of phenolic resins [26]. These
structures originate from the condensation of hydroxymethyl groups of two HMPs bonding together
to form an ethylene bridge, or reacting at the hydroxide group.
A number of recent papers have aimed to generate phenolic resin structures; the comparison of
their methods and results provide useful context to contrast the results of this work. All these works
report density values which facilitate a direct comparison of the subtly different methods employed
across the research. A key focus across all simulations of thermosets is enabling a high degree of
crosslinking within short runtimes. Izumi et al. have demonstrated extensively the potential for MD
within phenolic resin research [27–29]. They have shown that large (>200,000 atom, or 10,000 phenol
molecules) MD simulations are suitable for modelling phenolic resins for studying inhomogeneity.
However, their focus is on the static modelling of novolacs and using pseudo-reactions or united atom
approaches which, being coarse grained, have less detail than an individual atomistic approach to
bonding. Monk et al. have generated good dynamic phenolic models predicting density, Tg and
Young’s modulus, which have been corroborated with empirical literature [23]. They also reviewed
the effects of different modelling parameters on final structures, the results of which have been used
to inform the design of the script in this work. Monk et al. have generated their structures from fixed
length chains that have been crosslinked together, as opposed to monomers or a symthon. This is a
simple method for generating crosslinked structures, although it limits the potential variability in the
models, leaving the simulation prone to bias. Work by Li et al. utilises a novel mixed modelling
technique for generating resole phenolic resin structures using quantum calculations, Monte Carlo
and MD simulation originating from monomers [30]. Although they report model densities
supported by empirical literature, their Tg results fall significantly below those produced empirically
by Manfredi et al., with an F:P ratio of 2.0 simulating a Tg of 403 K, compared to 543 K from empirical
resin derived by dynamic mechanical analysis [31].Polymers 2020, 12, 926 4 of 12
Figure 2. Polycondensation mechanism phenol and formaldehyde reacting via a quinone methide
intermediate to form a methylene bridge. Possible products from left to right: o-o’, p-p’, o-p’.
The simulations performed in the present work aim to generate atomistic phenolic resin
structures using a novel intermediate starting point (i.e., a symthon). Runtime is a focus of simulation
design to enable rapid material testing, allowing the greater exploration of the novel material design
space. Existing simulations in the literature, of both phenolics and other material systems, often
develop a script that more closely represents the chemical mechanism of a curing polymer from
starting reagents. By doing this, simulations have an increased computational demand, as the initial
bonding of monomers is the primary step. Our novel methodology bypasses this initial step,
significantly reducing runtime without impacting the accuracy of the structures produced. To
examine further the effects of the simulation runtime, this simulation will be designed and tested on
modest hardware in an effort to facilitate the more widespread use of materials modelling. The
structures generated will be validated by comparing density and Tg to empirical and simulated
results. Monk et al. show that density is intrinsically linked to Young’s Modulus and viscoelastic
properties, therefore making it a vital parameter to be able to simulate accurately [23].
2. Materials and Methods
2.1. Software and Hardware
Modelling simulations were carried out using Materials Studio™ 6.1 by Accelerys™ Software
Inc., with the additional packages Forcite Plus and Amorphous Cell. Programming and data analysis
were undertaken on a desktop computer, with script writing in Perl for general flow control and
Materials Script to interface with the model. To provide context for simulation runtime, simulations
were managed by a 48 core Linux server of 4 AMD™ Opteron® 6174 processors with 64 GB of RAM.
2.2. Initial Unit Cell Construction
Symthon (intermediate) structures were produced with ortho- and para- substitution sites,
colored blue and purple respectively, which can be seen in Figure 3. This provided the script with the
means to distinguish reaction sites from other parts of the structure. A cuboid periodic unit cell was
constructed using the Amorphous Cell builder within Materials Studio, and symthons were packed
into the cell to a target density of 1 g cm−3. Simulations were designed with 10,000 atoms per unit cell;
the number of symthons in each simulation varied, but aimed to be the smallest value above 10,000
atoms possible. The F:P ratio could be controlled by varying the ratio of different mono- and di-Polymers 2020, 12, 926 5 of 12
substituted symthons. The cell dimensions varied with the F:P ratio, and ranged from 41–53 Å. The
ratio of ortho- and para- sites was kept at 1:1, so as to not bias the bonding by favouring one site over
another. Empirical literature is ambiguous over whether bonding is favored at the ortho- or para- sites
[32–34]. Li et al. calculate that the activation energies of sites are comparable; to enable good
comparison, this work follows the same evidence and does not bias the bonding of the structure [23].
The initial construction was repeated to create seven 10,000 atom structures, with F:P ratios ranging
from 1:1 to 2:1.
1 2 3 4
Figure 3. Mono-substituted (1 and 2) di-substituted (3 and 4) symthon structures used to populate
unit cells to achieve different F:P ratios. Ortho (blue) and para (purple) sites are colored to give them
a unique identifier for which the script can search.
2.3. Script Iterations
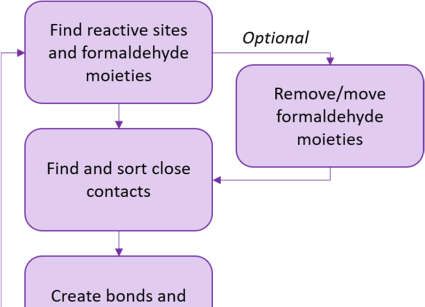
An average execution of the script will loop through 100 iterations of the processes outlined in
Figure 4. All possible bonds within a 5 Å cut-off were narrowed down based on the closest contact
between the formaldehyde moiety and the reaction site. To utilise a dynamic methodology, the array
of possible bonds was shrunk to a maximum of 35 bonding pairs, which ensured the structure did
not cure too quickly. These pairs were picked arbitrarily, and as other script components influence
the number of bonds forming, the typical maximum number of bonds formed per script loop is
around 25.
Following bond formation, as proposed by Izumi et al., bond angles are checked to determine
whether the angle is realistic: bonds with unrealistic angles (< 90°) are broken [29]. Note that the bond
angle used is the methylene bridge angle, rather than using the angle defined across the phenol rings
before bonding. This check helped to reduce the potential energy of the finished structures. Following
the formation of a successful bond, the hydrogen atom of the reaction site and the hydroxide group
of the formaldehyde moiety are deleted from the system. This means the simulation reflects a
perfectly dry phenolic resin (N.B. the polymerisation mechanism is a step growth, condensation
mechanism that yields water molecules as a byproduct). As the rate of simulated cure decreased, two
additional methods to promote curing and achieve a high final degree of cure were enabled.
Formaldehyde moieties were slowly deleted from the system to free up potential reactive sites to
enable crosslinking between chains and maintain the rate of cure. Furthermore, formaldehyde
moieties were transferred from an occupied reactive site to neighbouring free reactive sites. This
created further bonding by bringing formaldehyde moieties within the range of other free reactive
sites, or by freeing up a reactive site that was in a range of other formaldehyde moieties that had not
been moved. Both these methods were essential for F:P ratios > 1.5:1, as sites needed to be cleared of
formaldehyde moieties to enable fully cured (> 99%) structures to be generated. In these cases, up to
10–15 formaldehyde moieties could be deleted per loop; deletion rates were ramped based on the
number of moieties deleted in previous iterations, in order to maintain a steady deletion rate.Polymers 2020, 12, 926 6 of 12
Figure 4. A simplified overview of the script design. The optional formaldehyde moiety
deletion/movement methods would be activated when the relative degree of cure between iterations
fell too low. This was essential for F:P ratios > 1.5:1, where reactive sites need to be cleared to achieve
high degrees of cure.
2.3.1. Geometry Optimisation
The geometry optimisation is carried out with the COMPASS (Condensed-phase Optimized
Molecular Potentials for Atomistic Simulation Studies) forcefield of pre-calculated bonding and non-
bonding interaction terms. COMPASS was chosen over other popular fields such as DREIDING, as
it has been specifically designed for condensed phase polymers such as thermoset networks [35].
Furthermore, COMPASS includes partial atomic charges, calculated by ab initio calculations,
eliminating an additional step common in most simulations [2]. These charges are updated by
Materials Studio as necessary as the structure cures. A combined steepest descent [36] and conjugate
gradient method [37] was used to optimise the structures [38]. Steepest descents ran for a short (100
steps) optimisation to reduce the potential energy of the structure to something more feasible. The
conjugate gradient method was found to be unsuccessful at high potential energies, as is typically
seen initially, so was employed after steepest descents to achieve a better final optimisation. During
the conjugate gradient stage, the geometry of the unit cell was allowed to change in order to reduce
the volume of the cell, and thus the density of the system changed.
2.3.2. Molecular Dynamics
This work made use of the NVT (Canonical) ensemble, which holds the number of atoms, the
system volume and temperature as all constant. The NVT ensemble is feasibly employed in this
simulation, as density is varied in the geometry optimisation stage; density is constant in the MD
stage, as the volume is held constant. The temperature was held constant during dynamics
simulations using the Nosé thermostat [39]. The Nosé algorithm gave the most control over
temperature within the system when compared to the Andersen and Berendsen thermostats, whichPolymers 2020, 12, 926 7 of 12
were also trialled. The initial system temperature was 298 K, which was gradually ramped between
loops from 298 K to 398 K, based on the degree of cure of the system. The timestep of the simulation
was 1 fs, and the initial simulation duration was 12 ps. This duration was increased to 20 ps as the
structure became more cured, to allow the simulation more time to equilibrate. The velocity Verlet
algorithm was used to integrate equations of motion across each timestep [40]. Motion groups were
not kept rigid throughout this process, to facilitate random movement within the simulation. Once
the structure reached the cut-off degree of cure, the loop was closed with a final 20 ps dynamics
simulation at 298 K, to equilibrate the structure to room temperature for comparison with literature
data.
2.4. Tg Simulation
To identify the Tg of the final cured structures, the Temperature Cycle protocol from the
Amorphous Cell module was used. Structures were elevated from an initial temperature of 300 K to
600 K. Finalised structures with F:P ratios of 1.2:1 and 1.5:1 were simulated. The protocol works by
gradually raising the temperature of the system in 10 K increments, followed by simulating atom
dynamics, allowing the volume of the system to change. Each temperature increment was modelled
five times, and a plot with two fitted lines was produced. The Tg can be found by observing the
temperature at which the density of the system decreases considerably—the point at which the two
fitted lines intersect [41]. This corresponds to an increase in volume, as the system transforms from a
rigid structure to a more flexible, elastomeric one.
3. Results and Discussion
3.1. Simulation Outcomes
The results of seven cured 10,000-atom structures across a range of F:P ratios derived from the
method herein are displayed in Table 1. The density results are reproduced graphically in Figure 5
for ease of comparison with results from other groups. As can be seen, there is a broad range of
densities quoted within the literature [17,42]. In comparison to the results of Manfredi et al., these
results follow the trend that peak density lies somewhere around an F:P ratio of 1.2:1 [31]. Equally,
the results show good comparison to those reported by Li et al., the closest simulation in literature,
for F:P ratios ≤ 1.5:1—however, the reliability of these results is brought into question above 1.5:1. A
greater than 1.5:1 F:P ratio marks a change in design philosophy for the simulation, as the
formaldehyde component deletion/movement becomes essential to achieve the high degree of cure
seen in the results of Table 1. The positive potential energies of > 1.5:1 F:P ratio models are thought
to contribute to the non-conforming density results. 1.6:1 and 1.8:1 F:P ratio structures have similar
densities but vastly different potential energies. The 2:1 F:P model has density in agreement with the
literature, but high potential energy. There is no clear trend in the discrepancy between the results to
suggest a definitive cause for this error. One thought is that formaldehyde deletion and movement
methods are causing the simulation to run longer, which hampers structure relaxation methods.
Various methods have been trialled to produce more relaxed cured structures, using longer duration
simulations and/or shorter timesteps, but all significantly increased the runtime without
meaningfully improving potential energy. Additional simulation and refinement of the script
procedure is required to fully establish the cause; however, the models in the ideal F:P ratio range
defined by the literature are conforming, which gives credence to the model design.Polymers 2020, 12, 926 8 of 12
Table 1. Results of seven cured 10,000-atom structures of varying F:P ratios.
Maximum
Degree
F:P Density /g Theoretical Initial Atom Final Atom Final Potential Energy /
of Cure /
ratio1 cm−3 Degree of Count Count kcal mol−1
%
Cure / %
1.0 1.223 66.1 66.7 10,013 8261 −13,367
1.2 1.222 79.1 80.0 10,057 8039 −11,051
1.4 1.205 91.6 93.3 10,044 7790 −5107
1.5 1.182 96.8 100.0 10,032 7659 −2975
1.6 1.141 97.3 100.0 10,012 7489 2491
1.8 1.142 99.5 100.0 10,020 7220 43,785
2.0 1.207 99.2 100.0 10,017 6947 41,185
1 F:P ratio refers to the molar ratio of formaldehyde in the initial unit cell.
Simulated values of Tg were derived for the 1.2:1 and 1.5:1 F:P ratio cured models, and achieved
values of 515 K and 526 K, respectively. A plot of density as a function of temperature for the 1.5:1
model can be seen in Figure 6. A clear decrease in density at 526 K is observed, corresponding to an
increase in volume as the structure becomes more flexible. Comparing these results to literature
provides good validation for this simulation design. Manfredi et al. reported Tg values of 506 K and
530 K for 1.2:1 and 1.5:1 F:P ratios, respectively [31]. In comparison to other simulated literature, the
simulation in this work shows a clear improvement, e.g., the comparable simulation produced by Li
et al., which resulted in a Tg of 412 K for a 1.5:1 F:P ratio model [30].
3.2. Evaluation of Novel Modelling Concepts
The runtimes for these simulations ranged from 12 h for 1:1 F:P ratio structures to 23 h for 2:1
ratio models. The discrepancy in timing originates from the increased reliance on formaldehyde
moiety deletion and movement in the higher F:P ratio models. Using these methods to achieve a high
degree of cure led to more script iterations, and thus longer runtimes, in higher F:P ratio models.
There is room for further refinement of these methods to ensure that deletion/movement is high
enough to promote fast simulations without impacting the final degree of cure. Considering the
results presented in Table 1, it may be suggested that these methods were too severe for the 1.5:1 and
1.6:1 models, as they fall further below their theoretical maximum degree of cure than other models.
1.36
1.34
1.32
1.3
Density (g cm-3)
1.28
1.26
1.24
1.22
1.2
1.18
1.16
1.14
1.12
1.0 1.2 1.4 1.6 1.8 2.0
F:P ratio (formaldehyde component)
Figure 5. Graphical representation of density as a function of F:P ratio for cured 10,000 atom
structures. Grey dashed lines indicate the upper and lower bound densities found within the
literature [17,42].Polymers 2020, 12, 926 9 of 12
1.232
1.23
Density (g cm-3) 1.228
1.226
1.224
1.222
1.22
1.218
400 450 500 Tg: 526 550 600
Temperature (K)
Figure 6. Density against temperature plot for a cured 1.5:1 F:P ratio model. Tg is observed at the
gradient change as 526 K.
In early script design, the NPT (Isothermal-isobaric) ensemble was used, as it allows the density
of the structure to vary during dynamics simulations. However, concern can be found in the
literature, as well as in discussion with our group, over the ability of the NPT ensemble to meet its
ensemble averages [43,44]. Equally, results produced by the NPT ensemble in this simulation had
density values ranging from 1.02–1.10 g cm−3, far lower than seen in most empirical literature. This
was the case across the range of F:P ratios trialled. Varying the barostat, attempting the Andersen,
Berendsen and Parrinello Rahman algorithms [45–47], had a limited effect on the results produced.
Materials Studio uses an NPT ensemble developed by Martyna et al. in 1994, and subsequent
iterations have attempted to improve upon this [44,48–50]. In order to switch to the more reliable
NVT (Canonical) ensemble, an alternative means of altering volume across the cure loops needed to
be adopted. During the geometry optimisation phase, both the model structure and the unit cell
dimensions were optimised, enabling the unit cell to change volume, and altering the subsequent
density of the total structure. This novel methodology has been shown to produce acceptable
structures in this instance, as seen by comparison with empirical results herein.
The use of symthons has been shown to be capable of producing phenolic structures that fall in
line with empirical and simulated literature; their use raises questions regarding static and dynamic
bonding within molecular dynamics (MD). Using symthons as a starting point is similar to a single
large-scale static cure of phenol and formaldehyde molecules in a conventional phenolic resin
simulation. Based on this concept, the evidence herein shows that there is scope to vary static and
dynamic bonding in MD simulations. Early stage bonding, if not employing symthons and instead
originating with monomers, can be modelled statically or with looser dynamic bonding parameters.
As the structure cures, bonding should become more dynamic—potentially scaling down bonds per
cure cycle gradually right to the end of the simulation.
4. Conclusions
The fundamental aim of this work was to produce an accurate (i.e., chemically representative)
large-scale model originating from an intermediate structure (a symthon). Further to this, a new
modelling methodology was trialled using the NVT (Canonical) ensemble and unit cell dimension
optimisation during the conventional geometry optimisation stage. These methods have proven
successful when applied to phenolic resins, as models have well-reproduced literature values arising
from both empirical and simulated experiments. Low runtimes have been achieved for thesePolymers 2020, 12, 926 10 of 12
simulations, with fully cured models being generated within 12–23 h on readily accessible hardware.
Moreover, there is scope for a further reduction in runtime by exploring how novel formaldehyde
deletion/movement methodology affects the final structure. Symthons have successfully been shown
to be a viable methodology for simplifying simulations, ultimately reducing runtimes. Their use in
other polymer systems warrants additional investigation. Equally, research into the use of symthons
to promote ease of simulation, rather than simulations based on replication of chemical mechanisms,
would be a valuable addition to the concept. Further simulation refinement is required to reduce the
final potential energy of structures with an F:P ratio >1.5:1, as this currently limits the scope of this
simulation.
Author Contributions: M.A.B. and B.J.H. conceived and planned the simulations. M.A.B. developed the
software, carried out testing and analysed results. B.J.H. supervised the work undertaken. M.A.B. wrote the
manuscript; B.J.H., I.H. and T.M. reviewed the manuscript and contributed improvements. All authors have
read and agreed to the published version of the manuscript.
Funding: This research received no external funding. M.A.B. is supported by the Engineering and Physical
Science Research Council as part of the EPSRC Centre for Doctoral Training in Composites Science, Engineering,
and Manufacturing. Grant number: EP/S021728/1.
Conflicts of Interest: The authors declare no conflict of interest.
References
1. Hall, S.A.; Howlin, B.J.; Hamerton, I.; Baidak, A.; Billaud, C.; Ward, S. Solving the problem of building
models of crosslinked polymers: An example focussing on validation of the properties of crosslinked epoxy
resins. PLoS ONE 2012, 7, 1–12, doi:10.1371/journal.pone.0042928.
2. Demir, B.; Walsh, T. A robust and reproducible procedure for cross-linking thermoset polymers using
molecular simulation. Soft Matter 2016, 12, 2453–2464, doi:10.1039/c5sm02788h.
3. Sun, Y.; Chen, L.; Cui, L.; Zhang, Y.; Du, X. Molecular dynamics simulation of cross-linked epoxy resin and
its interaction energy with graphene under two typical force fields. Comput. Mater. Sci. 2018, 143, 240–247,
doi:10.1016/j.commatsci.2017.11.007.
4. KomarovChiu, P.V.; Yu-Tsung, C.; Shih-Ming, C.; Khalatur, P.G.; Reineker, P. Highly cross-linked epoxy
resins: An atomistic molecular dynamics simulation combined with a mapping/reverse mapping
procedure. Macromolecules 2007, 40, 8104–8113, doi:10.1021/ma070702.
5. Ni, B.; Sinnott, S.B.; Mikulski, P.T.; Harrison, J.A. Compression of carbon nanotubes filled with C60, CH4, or
Ne: Predictions from molecular dynamics simulations. Phys. Rev. Lett. 2002, 88, 1–4,
doi:10.1103/physrevlett.88.205505.
6. Zhang, J.; Jiang, D.; Scarpa, F.; Peng, H. Enhancement of pullout energy in a single-walled carbon nanotube-
polyethylene composite system via auxetic effect, Composites. Part A 2013, 55, 188–194,
doi:10.1016/j.compositesa.2013.09.006.
7. Maruyama, S. A molecular dynamics simulation of heat conduction of a finite length single-walled carbon
nanotube. Microscale Thermophys. Eng. 2003, 7, 41–50, doi:10.1080/10893950390150467.
8. Hattemer, G.D.; Arya, G. Viscoelastic properties of polymer-grafted nanoparticle composites from
molecular dynamics simulations. Macromolecules 2015, 48, 1240–1255, doi:10.1021/ma502086c.
9. Han, Y.; Elliott, J. Molecular dynamics simulations of the elastic properties of polymer/carbon nanotube
composites. Comput. Mater. Sci. 2007, 39, 315–323, doi:10.1016/j.commatsci.2006.06.011.
10. Zhu, R.; Pan, E.; Roy, A.K. Molecular dynamics study of the stress–strain behavior of carbon-nanotube
reinforced Epon 862 composites. Mater. Sci. Eng. A 2007, 447, 51–57, doi:10.1016/j.msea.2006.10.054.
11. Mortazavi, B.; Bardon, J.; Ahzi, S. Interphase effect on the elastic and thermal conductivity response of
polymer nanocomposite materials: 3D finite element study. Comp. Mat. Sci. 2013, 69, 100–106,
doi:10.1016/j.commatsci.2012.11.035.
12. Mortia, H.; Tanaka, K.; Kajiyama, T.; Nishi, T.; Doi, M. Study of the glass transition temperature of polymer
surface by coarse-grained molecular dynamics simulation. Macromolecules 2006, 39, 6233–6237,
doi:10.1021/ma052632h.Polymers 2020, 12, 926 11 of 12
13. Gardziella, A.; Pilato, L.A.; Knop, A. Phenolic Resins Chemistry, Applications, Standardization, Safety and
Ecology, 2nd ed.; Gardziella, A., Ed.; Springer-Verlag Berlin Heidelberg: Berlin, Germany, 2000; pp. 109–
115. ISBN 978-3-642-08484-3.
14. Cornick, M. Foam. In Phenolic Resins: A Century of Progress; Pilato, L., Ed.; Springer Berlin Heidelberg:
Berlin, Germany, 2010; pp. 189–208. ISBN 978-3-642-04713-8.
15. Hou, T.H.; Bai, J.M.; Baughman, J.M. Processing and properties of a phenolic composite system. J. Reinf.
Plast. Compos. 2006, 25, 495–502, doi:10.1177/0731684405058271.
16. Mottram, J.; Geary, B.; Taylor, R. Thermal expansion of phenolic resin and phenolic-fibre composites. J.
Mater. Sci. 1992, 27, 5015–5026, doi:10.1007/bf01105268.
17. Haupt, R.A.; Sellers, T. Characterizations of phenol-formaldehyde resol resins. Ind. Eng. Chem. Res. 1994,
33, 693–697, doi:10.1021/ie00027a030.
18. Guo, Z.; Li, H.; Han, W.; Zhao, T. Thermal stability of novolac cured with polyborosilazane. J. Appl. Polym.
Sci. 2013, 128, 3356–3364, doi:10.1002/app.38441.
19. Lee, Y.-K.; Kim, D.-J.; Kim, H.-J.; Hwang, T.-S.; Rafailovich, M.; Sokolov, J. Activation energy and curing
behavior of resol- and novolac-type phenolic resins by differential scanning calorimetry and
thermogravimetric analysis. J. Appl. Polym. Sci. 2003, 89, 2589–2596, doi:10.1002/app.12340.
20. Bai, D.; Zhang, X.; Chen, G.; Wang, W. Replacement mechanism of methane hydrate with carbon dioxide
from microsecond molecular dynamics simulations. Energy Environ. Sci. 2012, 5, 7033–7041,
doi:10.1039/C2EE21189K.
21. Tildesley, D.J.; Allen, M.P. Computational Simulation of Liquids, 2nd ed.; Oxford University Press: Oxford,
UK, 2017; ISBN: 9780198803195.
22. Schneider, R.; Sharma, A.R.; Rai, A. Introduction to Molecular Dynamics. Lect. Notes Phys. 2008, 739, 3–40,
doi:10.1007/978-3-540-74686-71.
23. Monk, J.D.; Haskins, J.B.; Bauschlicher, C.W.Jr.; Lawson, J.W. Molecular dynamics simulations of phenolic
resin: Construction of atomistic models. Polymer 2015, 62, 39–49, doi:10.1016/j.polymer.2015.02.003.
24. Li, T.; Cao, M.; Liang, J.; Xie, X.; Du, G. Theoretical confirmation of the quinone methide hypothesis for the
condensation reactions in phenol-formaldehyde resin synthesis. Polymers 2017, 9, 45–56,
doi:10.3390/polym9020045.
25. Škalamera, D.; Antol, I.; Mlinaric-Majerski, K.; Vancik, H.; Phillips, D.L.; Ma, J.; Basaric, N. Ultrafast
adiabatic photodehydration of 2-hydroxymethylphenol and the formation of quinone methide. Chem. Eur.
J. 2018, 24, 9426–9435, doi:10.1002/chem.201801543.
26. Patel, M.; Patel, J. Synthesis and characterization of phenolic resins with ethylene bridges. Die Angew.
Makromol. Chem. 1981, 91, 71–77, doi:10.1002/apmc.1981.050970116.
27. Izumi, A.; Nakao, T.; Shibayama, M. Atomistic molecular dynamics study of cross-linked phenolic resins.
Soft Matter 2012, 8, 5283–5292, doi:10.1039/c2sm25067e.
28. Shudo, Y.; Izumi, A.; Hagita, K.; Nakao, T.; Shibayama, M. Structure-mechanical property relationships in
crosslinked phenolic resin investigated by molecular dynamics simulation. Polymer 2017, 116, 506–514,
doi:10.1016/j.polymer.2017.02.037.
29. Izumi, A.; Shudo, Y.; Hagita, K.; Shibayama, M. Molecular dynamics simulations of cross-linked phenolic
resins using a united-atom model. Macromol. Theory Simul. 2018, 27, 1700103–1700111,
doi:10.1002/mats.201700103.
30. Li, J.; Jumpei, S.; Waizumi, H.; Oya, Y.; Huang, Y.; Kishimoto, N.; Okabe, T. A multiscale model for the
synthesis of thermosetting resins: From the addition reaction to cross-linked network formation. Chem.
Phys. Lett. 2019, 720, 64–69, doi:10.1016/j.cplett.2019.02.012.
31. Manfredi, L.B.; Osa, O.; Fernandez, N.G.; Vazquez, A. Structure-properties relationship for resols with
different formaldehyde/ phenol molar ratio. Polymer 1999, 40, 3867–3875, doi:10.1016/S0032-3861(98)00615-
6.
32. Grenier-Loustalot, M.F.; Larroque, S.; Grenier, P.; Leca, J.P.; Bedel, D. Phenolic resins: 1. mechanisms and
kinetics of phenol and of the first polycondensates towards formaldehyde in solution. Polymer 1994, 35,
3046–3054, doi:10.1016/0032-3861(94)90418-9.
33. Monni, J.; Alvila, L.; Pakkanen, T.T. Structural and physical changes in phenol-formaldehyde resol resin,
as a function of the degree of condensation of the resol solution. Ind. Eng. Chem. Res. 2007 ,46, 6916–6924,
doi:10.1021/ie070297a.Polymers 2020, 12, 926 12 of 12
34. Lenghaus, K.; Qiao, G.G.; Solomon, D.H. Model studies of the curing of resole phenol-formaldehyde resins
Part 1. The behaviour of ortho quinone methide in a curing resin. Polymer 2000, 41, 1973–1979,
doi:10.1016/S0032-3861(99)00375-4.
35. Sun, H. COMPASS: An ab Initio force-field optimized for condensed-phase applications overview with
details on alkane and benzene compounds. J. Phys. Chem. B 1998, 102, 7338–7364, doi:10.1021/jp980939v.
36. Debye, P. Näherungsformeln für die Zylinderfunktionen für große Werte des Arguments und
unbeschränkt veränderliche Werte des Index. Math. Ann. 1909, 67, 535–558, doi:10.1007/BF01450097.
37. Hestenes, M.R.; Stiefel, E. Methods of Conjugate Gradients for Solving Linear Systems. J. Res. Natl. Bur.
Stand. 1952, 49, 409–436, doi:10.6028/jres.049.044.
38. Shewchuk, J.R. An Introduction to the Conjugate Gradient Method Without the Agonizing Pain; Technical
Report; Carnegie Mellon University: Pittsburgh, PA, USA, 1994.
39. Nosé, S. A molecular dynamics method for simulations in the canonical ensemble. Mol. Phys. 1984, 52, 255–
268, doi:10.1080/00268978400101201.
40. Martys, N.S.; Mountain, R.D. Velocity Verlet algorithm for dissipative-particle-dynamics-based models of
suspensions. Phys. Rev. E 1999, 59, 3733–3736, doi:10.1103/PhysRevE.59.3733.
41. Wang, Y.; Wang, W.; Zhang, Z.; Xu, L.; Li, P. Study of the glass transition temperature and the mechanical
properties of PET/modified silica nanocomposite by molecular dynamics simulation. Eur. Polym. J. 2016,
75, 36–45, doi:10.1016/j.eurpolymj.2015.11.038.
42. Nair, C.P.R. Advances in addition-cure phenolic resins. Prog. Polym. Sci. 2004, 29, 401–498,
doi:10.1016/j.progpolymsci.2004.01.004.
43. Roe, R.J. MD simulation study of glass transition and short time dynamics in polymer liquids. In Atomistic
Modeling of Physical Properties; Monnerie, L., Suter, U.W., Eds.; Springer: Berlin, Germany, 1994; Volume
116, pp. 111–144. ISBN: 978-3-540-57827-7.
44. Martyna, G.J.; Tobias, D.J.; Klein, M.L. Constant pressure molecular dynamics algorithms. J. Chem. Phys.
1994, 101 4177–4189, doi:10.1063/1.467468.
45. Andersen, H.C. Molecular dynamics simulations at constant pressure and/or temperature. J. Chem. Phys.
1980, 72, 2384–2393, doi:10.1063/1.43948672.
46. Berendsen, H.J.C.; Postma, J.P.M.; van Gunsteren, W.F.; DiNola, A.; Haak, J.R. Molecular dynamics with
coupling to an external bath. J. Chem. Phys. 1984, 81, 3684–2690, doi:10.1063/1.448118.
47. Parrinello, M.; Rahman, A. Polymorphic transitions in single crystals: A new molecular dynamics method.
J. Appl. Phys. 1981, 52, 7182–7190, doi:10.1063/1.328693.
48. Tuckerman, M.E.; Liu, Y.; Ciccotti, G.; Martyna, G.J. Non-Hamiltonian molecular dynamics: Generalizing
Hamiltonian phase space principles to non-Hamiltonian systems. J. Chem. Phys. 2001, 115, 1678–1702,
doi:10.1063/1.1378321.
49. Keffer, D.J.; Baig, C.; Adhangale, P.; Edwards, B.J. A generalized Hamiltonian-based algorithm for rigorous
equilibrium molecular dynamics simulation in the isobaric–isothermal ensemble. Mol. Sim. 2006, 32, 345–
356, doi:10.1080/08927020600684345.
50. Uline, M.J.; Corti, D.S. Molecular dynamics at constant pressure: Allowing the system to control volume
fluctuations via a “shell” particle. Entropy 2013, 15, 3941–3969, doi:10.3390/e15093941.
© 2020 by the authors. Licensee MDPI, Basel, Switzerland. This article is an open access
article distributed under the terms and conditions of the Creative Commons Attribution
(CC BY) license (http://creativecommons.org/licenses/by/4.0/).You can also read