V.I.P. Industries (VIP IN) - Bag it for a sky ride - Moneycontrol

Page created by Steven Barnes
 
CONTINUE READING
V.I.P. Industries (VIP IN) - Bag it for a sky ride - Moneycontrol
V.I.P. Industries (VIP IN)

                                       Rating: BUY | CMP: Rs444 | TP: Rs579

Bag it for a sky ride
Jinesh Joshi jineshjoshi@plindia.com | 91-22-66322238
V.I.P. Industries (VIP IN) - Bag it for a sky ride - Moneycontrol
V.I.P. Industries

                 Contents

                                                                                                                             Page No.

                 Story in charts ........................................................................................................ 4
                 Company Overview ............................................................................................... 5
                    VIP is a formidable play on luggage market in India .......................................... 5
                 Investment Argument............................................................................................. 7
                    Organized luggage industry on cusp of higher growth ....................................... 7
                    VIP all set to ride the growth phase in luggage industry................................... 10
                    Creating twin levers of growth .......................................................................... 15
                    Channel checks indicate brand pull for Skybags is high; Carlton is a sturdy
                    product ............................................................................................................. 16
                    Competitive landscape of the luggage industry ................................................ 17
                 Financial projections ............................................................................................ 21
                    VIP’s sales to grow at a CAGR of 23.7% over FY18-21E ................................ 21
                    Calibrated price hikes & better product mix to offset gross margin headwinds 22
                    Product premiumisation to aid in EBITDA margin expansion ........................... 24
                    Improvement in cash conversion cycle to drive OCF at a CAGR of 21.0% over
                    FY18-21E ......................................................................................................... 25
                 Valuations ............................................................................................................ 26
                    Premium valuations justified; past history redundant ....................................... 26
                 Key tables & charts .............................................................................................. 28
                 Annexure ............................................................................................................. 29

March 25, 2019                                                                                                                            2
V.I.P. Industries (VIP IN) - Bag it for a sky ride - Moneycontrol
March 25, 2019                                               V.I.P. Industries (VIP IN)
Company Initiation
                                                             Rating: BUY| CMP: Rs444 | TP: Rs579

                                                             Bag it for a sky ride
                                                             We initiate coverage on VIP Industries Ltd (VIP) with a BUY rating given
                                                             market leadership (~50% revenue share) in the organized luggage industry,
                                                             well-diversified product portfolio (six brands and multiple SKUs exceeding
                                                             1,500) and solid brand salience (brand-ex is ~5-7% of sales). Strong
                                                             distribution network (~11,000 touch points), GST implementation (narrowed
                                                             pricing gap with unorganized players resulting in up-trading) and entry into
Key Financials (Consolidated)
                                                             the under penetrated ladies hand bags and backpack market is likely to drive
                       FY18     FY19E    FY20E      FY21E
                                                             sales/PAT at a CAGR of 23.7%/25.1% over FY18-21E. While headwinds from
Sales (Rs. m)         14,096    17,917   21,897     26,695
                                                             currency & crude volatility prevail, product premiumisation (rising share of
EBITDA (Rs. m)         1,934     2,249    2,934      3,764
 Margin (%)             13.7      12.6       13.4     14.1   Caprese and Carlton) and increase in production from captive facilities at
PAT (Rs. m)            1,268     1,453    1,920      2,481   Bangladesh will aid in 40bps EBITDA margin expansion over FY18-21E. We
EPS (Rs.)                 9.0     10.3       13.6     17.6   expect premium valuations (32.7x FY20E and 25.3x FY21E) to sustain given
 Gr. (%)                48.8      14.7       32.1     29.2   strong growth prospects, debt free BS, high return ratios (RoE/RoCE of
DPS (Rs.)                 3.0      3.4        4.2      5.5
                                                             25.6%/36.9% in FY18; to expand by 230bps/310bps over FY18-21E), and
 Yield (%)                0.7      0.8        0.9      1.2
                                                             healthy dividend pay-out (average 41% over last 5 years). Initiate with a BUY
RoE (%)                 25.6      25.0       26.6     27.8
RoCE (%)                36.9      35.4       38.2     40.0
                                                             and TP of Rs579.
EV/Sales (x)              4.4      3.5        2.8      2.3
EV/EBITDA (x)           32.0      27.5       21.0     16.2
                                                             GST has proved to be a boon for the industry: Luggage/backpack/handbags
PE (x)                  49.5      43.2       32.7     25.3   market is dominated by unorganized players with a share of ~67%/
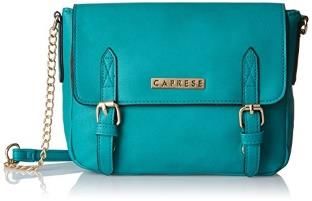
V.I.P. Industries (VIP IN) - Bag it for a sky ride - Moneycontrol
V.I.P. Industries

Story in charts
           Sales to grow at a CAGR of 24% over FY18-21E

                                                                             Premiumization, GST & new
                 Since FY09 sales growth
                                                                             product launches to result in
 30.0%           has never breached the
                                                                             a secular 24% sales CAGR
                        20% mark
 25.0%                                                                             over FY18-21E

 20.0%

 15.0%

 10.0%

   5.0%
                           14.3%    17.8%      13.4%                16.1%       7.7%   16.1%                  12.6%       27.1%       22.2%     21.9%
                                                                                                 2.9%
   0.0%    -1.8%                                           -2.6%
  -5.0%
            FY09            FY10        FY11   FY12        FY13      FY14       FY15    FY16     FY17          FY18       FY19E       FY20E     FY21E

Source: Company, PL

           Secular earnings expansion is on the cards (Rs m)

  3,000                                                                                       New peak likely to be
                  Between FY09 to FY17                                                      created over next 3 years
  2,500           VIP managed peak PAT
                    of Rs887mn in FY11                      Peak PAT of FY11 was
  2,000                                                     surpassed in FY18 after
                                                               a gap of 6 years
  1,500

  1,000
                                                             315

                                                                                                                                        1,920
                                                                                                                 1,268

                                                                                                                            1,453

                                                                                                                                                 2,481
    500
                 -139

                                         887

                                                  676

                                                                       576

                                                                                          665

                                                                                                    852
                                                                                 466
                              484

       -
             FY09           FY10        FY11   FY12        FY13      FY14       FY15    FY16     FY17          FY18       FY19E       FY20E     FY21E
   -500

Source: Company, PL

           Strong portfolio comprising of luggage, backpacks and handbags

Source: Company, PL

           Segmentation of luggage Industry
Segment
                        Approximate price point         Competitive intensity                             Peer standing
classification
Premium                 Upwards of Rs6,000              Moderate                                          Samsonite is the market leader
Economy/Value           Rs4,000-6,000                   Moderate                                          VIP is the market leader
                                                        High as maximum upscaling has happened in         Safari has made strong in-roads in the last few
Mass                    Less than Rs4,000
                                                        this segment post GST                             years
Source: PL

March 25, 2019                                                                                                                                           4
V.I.P. Industries

                 Company Overview
                 VIP is a formidable play on luggage market in India

                 VIP is the market leader in organized segment with a revenue share of ~50%.
                 Samsonite is the second largest player followed by Safari with a share of ~36% and
                 ~15% respectively.

                 VIP is a strong play on huge growth opportunity in the Indian luggage market given
                 rising discretionary spends on travel and tourism, emergence of backpacks as a
                 key accessory for students and rising demand for premium handbags amid
                 increasing proportion of working women in population. VIP’s product portfolio
                 consists of diverse range of hard-sided and soft-sided luggage which includes
                 strollys, suitcases, duffel-bags, backpacks, executive cases, overnight travel
                 solutions and school bags. It has two manufacturing units located at Nashik and
                 Haridwar for manufacturing hard luggage while soft luggage is imported from China.
                 The company has also set up a wholly owned subsidiary in Bangladesh which
                 serves as a captive manufacturing unit (soft luggage) for the parent. VIP exports
                 (~4% of revenue in FY18) to more than 31 countries including UK, Europe, UAE,
                 Qatar, Kuwait, Asia Pacific etc.

                            VIP is the market leader in luggage industry

                                        Safari
                                         15%

                                                                                                 VIP
                                                                                                50%

                      Samsonite
                        36%

                 Source: Company, PL

                 PS: Market share is calculated on latest fiscal revenue of all the 3 players

                 VIP has six brands in its portfolio viz; Carlton, VIP, Skybags, Aristocrat and Alfa in
                 luggage and Caprese in handbags. Samsonite and Safari have 8-10 brands
                 concentrated at premium and mass end of the industry respectively. While VIP is
                 more or less well diversified across regions Samsonite is strong in South and Safari
                 is strong in North.

                            VIP has even geographic presence versus competition
                             VIP                        Safari                     Samsonite
                                                         North                       South
                  More or less similar across            West                         North
                        geographies                      East                         West
                                                         South                        East
                 Source: Company, PL

March 25, 2019                                                                                         5
V.I.P. Industries

            Brand portfolio of the luggage players
                                                      5 year
                                                                                                      5 year
                                                    average                                                  Our inference on revenue
Company       Brands                                         Our inference on margin profile        revenue
                                                    EBITDA                                                   growth
                                                                                                      CAGR
                                                     margin
                                                             Has presence across both mass &
                                                                                                            Has a relatively stable market
              Carlton, Caprese, VIP, Skybags,                premium segments (margin is
VIP                                                    9.8%                                           11.0% share; growth in line with
              Aristocrat, Alfa                               higher than Safari but lower than
                                                                                                            industry
                                                             Samsonite)
              Samsonite, Samsonite red,
              American tourister, High sierra,                                                               Has a relatively stable market
                                                              Is a premium player (highest
Samsonite     Hartman luggage, Tumi, Speck,           14.7%                                             9.1% share; growth in line with
                                                              margin)
              Kamiliant, Lipault, Gregory,                                                                   industry
              Saxoline (Chile only brand)
                                                                                                            Has gained market share
              Safari, Genius, Magnum,
                                                                                                            (growth above industry average)
Safari        Egonauts, Gscape, Activa, Orthofit,      6.6% Is a mass player (lowest margin)          34.8%
                                                                                                            from unorganized players since
              DBH, and Genie
                                                                                                            it has mass offerings
Source: Company, PL

                                                     VIP’s sales and PAT have grown at a CAGR of 10.4% and 39.6% respectively over
                                                     FY15-18. We estimate sales and PAT to grow at a CAGR of 23.7% and 25.1% over
                                                     FY18-21E given 1) strong tailwinds from GST 2) ability to straddle across segments
                                                     and price points 3) depth and width of distribution network and 4) benefits from
                                                     rising production from low cost destination (Bangladesh). Debt free balance sheet
                                                     and RoE/RoCE of 25.6%36.9% respectively in FY18 makes VIP as one of the best
                                                     plays on discretionary spends in India.

                                                                 Key timeline of events for VIP Industries
                                                     Year      Event
                                                     1986      Alfa brand launched
                                                     1992      BP Ergo launched
                                                     1996      Elanza variant launched
                                                               Delsey JV (Delsey products were stocked in VIP outlets. In 2010, the JV got
                                                     2000
                                                               terminated)
                                                     2001      Bangladesh JV (50:50 JV with Nitol Group)
                                                     2004      Carlton brand acquisition, Opened office in Hong Kong
                                                     2005      Retail focus, brand identity revamp, Haridwar plant
                                                     2008      Merger of Aristocrat with VIP, launch of coupe twin section bag
                                                               Launch of water & stain resistant bags with Teflon, Ranked amongst the top 100
                                                     2009
                                                               most trusted brands
                                                     2011      Skybags launch, Started manufacturing PC cases
                                                     2012      Manufacturing of printed PC cases
                                                     2013      Caprese launched, manufacturing of hybrid PC cases
                                                     2014      Bangladesh operations began
                                                     2017      Set up a subsidiary in Bangladesh
                                                     2018      Followed it up with another subsidiary in Bangladesh
                                                     Source: Company, PL

March 25, 2019                                                                                                                                  6
V.I.P. Industries

                 Investment Argument
                 Organized luggage industry on cusp of higher growth

                 The Indian luggage industry with a market size of ~Rs75-80bn (wholesale level) is
                 dominated by unorganized players (~67% value share & ~80% volume share). The
                 market size for back packs (growing by ~30% annually) and hand bags is ~Rs>30bn
                 and ~Rs70bn respectively.

                 The organized luggage sector (VIP, Samsonite & Safari used as a proxy for the
                 sector) has grown at a CAGR of 12.4% over the last 5 years (FY13-18). While Safari
                 has grown at a CAGR of 35%, VIP and Samsonite have registered a growth of 11%
                 and 9% respectively over the same period indicating that Safari has gained market
                 share from unorganized players since it has mass offerings.

                             Organized luggage industry has doubled over the last 5 years

                                            Organized luggage industry market size (Rs bn)
                                            Organized luggage industry growth (RHS)

                   30.0    27.4%                                                                       30.0%

                   25.0                                21.4%                                           25.0%
                                    20.4%
                   20.0                                                                                20.0%
                                                                13.4%        13.5%
                   15.0                                                                       11.6%    15.0%

                   10.0                                                                                10.0%
                                              4.7%
                                                                                      2.7%
                             12.5

                                     15.1

                                                15.8

                                                         19.2

                                                                   21.7

                                                                               24.7

                                                                                       25.4

                                                                                                28.3
                    5.0                                                                                5.0%

                     -                                                                                 0.0%
                            FY11    FY12      FY13      FY14     FY15         FY16    FY17     FY18

                 Source: Company, PL

                 Dominance of unorganized players on a wane

                 Unorganized players dominate the luggage industry in India. Dominance of
                 unorganized players in back packs market is in line with luggage (Rs30bn
V.I.P. Industries

                               Unbranded sells cheap due to poor quality & under invoicing
                 Category                                    Average discount to an organized player
                 Luggage                                                                      40-50%
                 Back packs                                                                    ~50%
                 Hand bags                                                                  >30-40%
                 Source: Company, PL

                 Over the last 1-2 years, penetration of organized players in all the 3 categories has
                 improved amid improving lifestyle, rising brand consciousness, better quality and
                 attractive price points. We expect organized players to further increase their
                 penetration and market share led by: -

                    Ability to innovate and launch variants: Organized players have significantly
                     increased innovations and new variant launches in recent past. We have seen
                     more innovations flowing in the polycarbonate segment which has seen launch
                     of vibrant colors and new designs specifically targeting female and children.
                     Soft luggage has seen a lot more variety in fabric and accessories which
                     unorganized players would find hard to match.

                    Lifetime replacement warranties: Further, the fact that organized players
                     offer warranties (typically 5 years in case of luggage and 1 year in case of
                     backpacks) makes them a preferred choice for buyers. More importantly,
                     domestic players have started highlighting the importance of warranties as it
                     would be very difficult to get any product repaired/warranty enforced in case of
                     unorganized brands.

                     We note that Safari has started offering replacement warranties rather than
                     repair warranties which has added to the attractiveness as an entry level
                     luggage at just 15-20% premium. VIP has also started offering lifetime
                     warranties for Carlton edge in the premium segment. We believe lifetime
                     warranties will go a long way in increasing the sales of organized players.

                    GST led gains: GST implementation will bring unorganized players within the
                     tax net and reduce pricing gap making organized players more competitive. In
                     pre GST era excise on local production was 12.5%, cess was 0.5% and VAT
                     stood at 14% resulting in blended tax rate of ~27%. However, the effective
                     indirect tax rate was ~18% given excise exemption at Haridwar plant, higher
                     share of soft luggage sales which is imported & hence did not attract excise
                     and differential VAT rates. Given that the GST rate is reduced from 28% to
                     18% recently, the overall tax impact on the luggage industry post
                     implementation of GST is neutral.

                               Tax incidence pre & post GST era
                 Particulars               Tax rate
                 Tax incidence pre-GST     18%
                 Tax incidence post-GST    Earlier the GST rate was 28% which was brought down to 18%
                 Source: Company, PL

March 25, 2019                                                                                      8
V.I.P. Industries

                                                                   Strong macro tailwinds to support industry growth

                                                                   Growth in the luggage/backpack/handbag industry is linked to factors like 1)
                                                                   employee work force/student growth (linked to backpack demand), 2) increasing
                                                                   ratio of working women which induces discretionary spend (linked to handbag
                                                                   demand) and 3) air traffic which is a function of growth in tourism & business travel
                                                                   (linked to luggage demand).

                    Student enrolment in higher education rises at                                Female labour force participation is on a steady
4% CAGR over FY13-18                                                                  rise

          40                                                    35.7      36.6         27.6%
                                                   34.6                                                                                27.5%
          35               32.3        33.3
                30.1                                                                   27.4%                                 27.3%
          30                                                                                                                                   27.2%
                                                                                       27.2%                       27.1%
          25
  (m n)

                                                                                                         27.0%
          20                                                                           27.0%
                                                                                                26.8%
          15
                                                                                       26.8%
          10
                                                                                       26.6%
          5
          0                                                                            26.4%
                FY13      FY14         FY15        FY16         FY17     FY18                    2012     2013     2014       2015     2016    2017

Source: AISHE, PL                                                                     Source: World Bank, PL

                                                                   Air traffic in India has grown at a CAGR of 9.9% over the last 10 years. Further,
                                                                   domestic expenditure on tourism and number of domestic tourist visits have grown
                                                                   at a CAGR of 7.2% and 9.6% respectively over the last 5 years.

                    Air traffic rises at a CAGR of 9.9% over FY08-FY18                            Rising discretionary spends aiding tourism
  200
                               Air traffic (In mn)                                                        Domestic tourist visit growth rate
                                                                                                          Domestic expenditure on tourism
  150                                                                                                                                13%
                                                                                       14%                 12%
                                                                                                                       12%
                                                                                       12%
  100                                                                                            9%
                                                                                       10%
                                                                                        8%                             10%           9%
    50                                                                                  6%
                                                                                                            7%
                                                    104

                                                          116

                                                                  135

                                                                        158

                                                                              184

                                                                                        4%       6%                                            2%
               72

                     68

                          77

                                       99

                                              98
                                  89

                                                                                        2%                                                     4%
     -
                                                                                        0%
                                                                                                2013       2014        2015          2016      2017

Source: DGCA                                                                          Source: IBEF & Ministry of tourism

PS: The traffic data includes inbound/outbound traffic of domestic
& international carriers

                                                                   Despite growth of its air travel market over the past decade, India still has one of
                                                                   the lowest air travel penetration rates in the world, as defined by annual domestic
                                                                   carrier seats per capita.

 March 25, 2019                                                                                                                                        9
V.I.P. Industries

                                                     India’s air passenger traffic is at a phase observed by China in 2004 when it’s GDP
                                                     per capita crossed the $1,500 mark for the first time. With a GDP per capita of
                                                     $1,509 China’s annual trips per capita stood at 0.09. Over the next 6 years in spite
                                                     of global turmoil in 2008, China’s annual trips per capita doubled to 0.20 and has
                                                     been growing at a steady state ever since. Taking this cue, India having entered
                                                     this phase only in 2014 is set to witness strong growth in passenger traffic over the
                                                     coming few years.

                                                     We believe that confluence of all macro factors like rising mass of students/
                                                     workforce, working women and rising disposable income will enable luggage
                                                     industry to surpass the 12.4% compounded growth witnessed in the past 5 years.

             China entered strong growth phase in 2004                                   India’s annual trips/capita at an inflection point

           GDP per capita (USD)      Annual Trips/capita (RHS)                     GDP per capita (USD)                                          Annual trips/capita (RHS)

  10,000                                                     0.45         3,500                                                                                                      0.20 0.22
                                                             0.40                                                                                                                         0.20
                                                                          3,000                                                                                                           0.18
   8,000                                                     0.35
                                                                          2,500                                                                                                           0.16
                                                             0.30                                                                                                                         0.14
   6,000                                     0.20            0.25         2,000                                                           1,576                                           0.12
                                                             0.20         1,500                                                                                                           0.10
   4,000                                                                                                                                                                                  0.08
                                  0.09       4,561           0.15         1,000                                                                                                           0.06
   2,000                                                     0.10                                                                                                                         0.04
                                         1,509                              500                                                           0.06
                                                             0.05                                                                                                                         0.02
      -                                                      -                -                                                                                                           -
                                                                                  1997
                                                                                         1999
                                                                                                2001
                                                                                                       2003
                                                                                                              2005
                                                                                                                     2007
                                                                                                                            2009
                                                                                                                                   2011
                                                                                                                                          2013
                                                                                                                                                  2015
                                                                                                                                                         2017
                                                                                                                                                                2019
                                                                                                                                                                       2021
                                                                                                                                                                              2023
                                                                                                                                                                                     2025
           1989
           1991
           1993
           1995
           1997
           1999

           2003
           2005
           2007
           2009
           2011
           2013
           2015
           2017
           2001

Source: World Bank, PL                                                  Source: World Bank, Airbus, PL

                                                     VIP all set to ride the growth phase in luggage industry

                                                     VIP is well poised to ride tailwinds evident in the industry led by strong entry barriers
                                                     like 1) well diversified portfolio with multiple brands that straddles across price
                                                     points 2) superior distribution network 3) manufacturing efficiency that comes with
                                                     increasing scale of Bangladesh operations and 4) strong growth potential visible in
                                                     the handbags & backpacks market.

                                                     Multiple brands straddling across price points

                                                     VIP has a well-diversified product portfolio comprising of six brands and multiple
                                                     SKUs. Prime advantage of having a well-diversified portfolio is presence across all
                                                     three price segments viz: premium, economy and mass which enables VIP to serve
                                                     customers across price points. Carlton & Caprese are premium brands with highest
                                                     margin while Aristocrat & Alfa cater to mass segment with lowest margin. VIP and
                                                     Skybags are value/economy offerings.

                                                     While Samsonite’s product portfolio is equally well diversified with presence across
                                                     premium (Samsonite), economy/value (American Tourister) and mass brands
                                                     (Kamiliant) focus is more on the premium side. Safari has predominantly a mass
                                                     portfolio with limited presence in the premium category.

 March 25, 2019                                                                                                                                                                                  10
V.I.P. Industries

               Well diversified product portfolio across categories
             Year of Typical price    Brand                             Product         Channel       Revenue
Brand                                             Key competitors                                                       Margin hierarchy
             launch      point      positioning                          type          dominance     contribution
                       Rs6,000-
                     8,000. Carlton
Carlton       2004                   Premium          Samsonite         Luggage          EBOs
                     Edge range is                                                                                   Both Carlton & Caprese
                         higher                                                                        ~7-8%        have highest margin within
                                                    Lavie, Baggit,                                                     the product portfolio
                                                                                    Modern trade,
Caprese       2013   Rs1,500-4,000   Premium           Esbeda,          Handbag
                                                                                    EBOs, E-com
                                                     Unorganized
                                                  American Tourister,    Luggage,
VIP           1971   Rs4,000-6,000   Economy                                              NA                          Lower than Carlton &
                                                   Samsonite, Safari    backpacks
                                                                                                      ~70-75%        Caprese but higher than
                                                  American Tourister,    Luggage,
Skybags       2011   Rs4,000-6,000   Economy                                              NA                            Aristocrat & Alfa
                                                   Samsonite, Safari    backpacks
                                                   Safari, Kamiliant,    Luggage,   Hypermarket,
Aristocrat    2008    Sub Rs4,000      Mass
                                                     Unorganized        backpacks       E-com                       Lowest margin within the
                                                                                                        ~20%
                                                   Safari, Kamiliant,                 Traditional                      product portfolio
Alfa          1989    Sub Rs3,000      Mass                             Luggage
                                                     Unorganized                    dealer channel
Source: Company, PL, Media articles

PS: 1) The company does not share brand wise sales figures. Hence, revenue contribution figure is arrived based on information
available in public domain 2) Typical price point figures are based on our channel checks.

                                                     Given bulky nature of the product (increases retailing cost) and low inventory turn
                                                     (luggage is bought infrequently over 4-5 years) SKU management becomes a
                                                     challenging task. Lower SKUs will limit the choice for customer while having higher
                                                     SKUs can result in dead stock increasing storage & inventory costs.

                                                     In terms of SKUs, Safari has done incredibly well over the last few years with more
                                                     than 100+ SKUs for a revenue size of Rs4.1bn as of FY18. VIP’s SKU count is
                                                     >1,500 and more than Safari as it has presence in handbag segment which requires
                                                     higher SKUs (random search on Amazon for travel bags under VIP brand gives 290
                                                     listings, the count rises to 3,000 for handbags under Caprese brand). Also, in the
                                                     backpack segment, VIP has added a lot more designs (increases the SKU count)
                                                     that have been well appreciated (Skybags is a leading brand for backpacks within
                                                     5-6 years of its launch) within the dealer/distributor channel.

                                                     VIP has strongest distribution network amongst peers

                                                     Apart from the traditional dealer/distribution channel there are numerous other sales
                                                     channels in the luggage industry like canteen store department (CSD), modern
                                                     trade, EBOs, MBOs, E-com etc. Every channel has a different operating
                                                     characteristic (ex: e-com is a highly discounted channel, CSD credit is longer, EBO
                                                     is a high cost channel where in-store merchandiser is required). Even the product
                                                     assortment varies quite a bit to avoid channel conflict. Diversity in distribution
                                                     channel creates a huge barrier for the new entrant.

                                                     VIP has a well-entrenched distribution network comprising of CSD, modern trade,
                                                     EBOs, MBOs, E-com. The company has about ~1,000 active dealers, 100 active
                                                     distributors (which in turn reach to 1,000 retailers), ~250 EBOs and ~250
                                                     franchises. The company also has presence across ~1,000 modern trade outlets.
                                                     Total point of sale is ~11,000.

March 25, 2019                                                                                                                              11
V.I.P. Industries

                              Modern & retail trade dominates the distribution network for VIP
                                                                  Revenue                Revenue
                    Distribution    Revenue contribution
                                                               contribution for       contribution for
                      channel             for VIP
                                                                    Safari              Samsonite
                                    Data not available but
                                  the category has highest ~50% (Modern trade
                 Modern & general
                                   share in revenues. Both    & general trade                 NA
                      trade
                                   modern trade & general account 25% each)
                                      trade are at par.
                      CSD                   ~20%                     ~25%                     NA
                                    Data not available but
                   Institutional    has the third highest       Both e-com &                  NA
                                     share in revenues     institutional contribute
                                                                     ~25%
                     E-com                   ~6%                                           ~14%
                 Source: Company, PL, Media articles

                 In comparison to VIP, Safari’s penetration in dealer/distribution network is low.
                 However, the CSD share is higher. Safari has 40-50 EBOs (lower than VIP) but is
                 planning to expand the stores in high footfall areas. In all, Safari has >3,500
                 customer touch points. On the other hand, Samsonite has more than 350 stores
                 across India.

                 Both Samsonite and Safari have a higher share of E-com as they do not have a
                 vast dealer network like VIP. Since E-com is a highly discounted channel unless
                 the manufacturer has a different product assortment, it can create a channel conflict
                 with traditional channel partners. (Dealers can refuse to stock inventory as the same
                 product is sold on other channel at a discounted price).

                 Despite having strongest distribution network amongst peer’s VIP is facing a
                 structural   challenge   as   consumers      are   moving     away    from    traditional
                 dealer/distribution channel (where VIP is stronger than peers) to other channels like
                 modern trade, e-com, EBOs etc which offers a better environment to shop.
                 However, in line with evolving shopping trends, VIP has improved its presence
                 meaningfully in other channels (E-com revenue share has increased from 3% to
                 6%; focus on expanding via EBOs/franchise is also rising) to ensure that it does not
                 lose market share to competitors. Typically margins across channels are similar,
                 however, EBO’s have highest margins while E-com has lowest margins.

                 Share of CSD going down with rising penetration in other channels

                 CSD is a Government of India enterprise which provides access to quality products
                 (household requisites, watches & stationery, general use items etc) of daily use at
                 below market rates to the armed forces. The department has 34 depots and 3,000
                 odd canteens located all over India.

                 Since there is no trade margin, prices in CSD are lower (there is a tax advantage
                 too which further helps in price reduction). However, establishing presence in the
                 channel is difficult as it takes about 9 months to get the design approved and listed.
                 Also, taking a price hike in the channel takes a bit longer than other channels as
                 there is a process which needs to be followed to get the approvals. Pricing & product
                 assortment for CSD happens at HO and there is no need to negotiate with each
                 CSD individually. As seen in exhibit 20, Safari’s revenue share in CSD is higher
                 than VIP Industries given Mr Sudhir Jatia (CMD and an ex-MD of VIP Industries)
                 has strong relationship with CSD officials (CSD business is dependent on
                 relationship).

March 25, 2019                                                                                           12
V.I.P. Industries

                 CSD remains as one of the key distribution channels although its share in industry
                 sales has started declining in past 3-4 years. This follows quantitative restriction on
                 consumer purchases, lower CSD allocations by ministry and working capital issues.
                 In addition, better shopping experience, higher discounts and convenience is taking
                 consumers towards emerging channels like e-com, modern trade etc.

                 Efficiencies in manufacturing & procurement provides competitive
                 advantage

                 Increasing share of captive manufacturing from Bangladesh will increase
                 efficiencies in production while scale advantage that comes from bulk China
                 sourcing provides huge competitive advantage to VIP.

                 Bangladesh expansion to improve profitability profile

                 In order to reduce dependency on China as it is witnessing wage inflation, VIP has
                 set up a captive soft luggage (SL) manufacturing facility in Bangladesh. VIP has 3
                 subsidiaries in Bangladesh viz; VIP Bangladesh Ltd (established in 2012), VIP
                 Industries BD Manufacturing Pvt Ltd (established in Sep 2017; has a 7-year tax
                 holiday) and VIP Luggage BD Pvt Ltd (established in 2018) with a capacity of 2.1mn
                 units. The plan is to increase the capacity to 3.5mn units by end of FY19.

                 Currently, China is the largest SL sourcing destination for VIP. However, as
                 Bangladesh operations gain scale dependency on China is expected to come down
                 and improve the profitability of VIP due to 1) labour cost arbitrage 2) better control
                 over sourcing and 3) import duty advantage.

                              China dominates the sales mix for VIP
                 Country        Contribution to sales   Comments
                 China          >50% of sales           Mostly SL. Fully outsourced
                                                        Mix of HL & SL. HL is manufactured in-house
                 India          ~25-30% of sales
                                                        while SL is sourced from vendors
                 Bangladesh     ~4-5% of sales          Mostly SL. Own manufacturing
                 Source: Company, PL

                 Labour cost arbitrage: Rising wage inflation in China is the primary reason for
                 setting up manufacturing operations in Bangladesh. Roughly, labour cost in China
                 is 4x of Bangladesh. SL is highly labour intensive (in order to manufacture the
                 current quantum/value of SL internally VIP would need additional 10,000-12,000
                 employees; (current strength as of FY18 including contractual labour is 5,069
                 employees) and thus there is a huge labour arbitrage in shifting Bangladesh.

                 With Bangladesh operations, in addition to distribution margin, manufacturing
                 margin would also accrue within the company.

March 25, 2019                                                                                        13
V.I.P. Industries

              Sales & profitability profile of Bangladesh operations
Particulars (Rs mn)                     1QFY18   2QFY18   3QFY18    4QFY18   1QFY19   2QFY19   3QFY19   FY17      FY18    FY19E    FY20E   FY21E
Sales                                      138       50      184       198      252      259      389     490      570     1,300   1,690   2,197
PAT                                         32        1       30        32       40       27       61      83       95      221      287     373
PAT margin                               23.2%     2.0%    16.3%     16.2%    15.9%    10.4%    15.7%   16.9%    16.7%    17.0%    17.0%   17.0%
Bangladesh's sales a % of total sales     3.5%     1.6%     5.4%      5.5%     4.9%     6.4%     9.0%   3.9%      4.0%     7.3%     7.7%    8.2%

Standalone PAT                           378.2    242.4     240.8    324.4    598.5    310.4    198.6   763.9   1,185.7
Standalone PAT margin                     9.5%     7.8%     7.1%      8.9%    11.6%     7.7%     4.6%   6.1%      8.4%

Source: Company, PL

                                                          As seen in the table, except for 2QFY18, where in VIP Bangladesh’s performance
                                                          was impacted due to disruption in production, average PAT margin of Bangladesh
                                                          operations over the past 8 quarters is ~2.1x of standalone operations of VIP. As
                                                          contribution of VIP Bangladesh improves from 3.9% of sales in FY17 to 8.2% of
                                                          sales in FY21E with capacity addition, incremental contribution to profits will rise
                                                          considering the PBT margin delta is ~5-6%, if the production is outsourced from
                                                          Bangladesh rather than China.

                                                          Better control over sourcing: With own manufacturing at Bangladesh plant, VIP
                                                          can exercise better control over sourcing the raw material (PP of particular blend
                                                          and quality can be purchased, can pre-stock raw material if prices are down etc).
                                                          In the current scenario, where finished goods are imported there is limited control
                                                          over sourcing as Chinese have better bargaining power due to scale.

                                                          Import duty advantage: In Sep 2018, import duty on luggage was increased from
                                                          10% to 15% by the GoI. However, Bangladesh is exempted from import duty
                                                          resulting in direct tax savings.

                                                          Scale advantage in sourcing

                                                          China is the world capital for soft luggage (SL) manufacturing due to abundant RM
                                                          availability and labour (SL is labour intensive). Most players import their SL
                                                          requirements from China and manufacture hard luggage (HL) in house. Given
                                                          Chinese operate on a large scale they have a better bargaining power. Thus, unless
                                                          a buyer sources huge quantity getting the desired quality, discount (bulk
                                                          purchases), and favorable payment terms may not be possible. As of FY18, VIP’s
                                                          sales are 1.4x higher than Samsonite (only India sales are taken into consideration)
                                                          and 3.4x higher than Safari presenting a huge scale advantage moat when it comes
                                                          to sourcing SL from China. Size also helps in getting favorable payment terms as
                                                          reflected by payable days of VIP, Samsonite and Safari at 55, 71 and 41
                                                          respectively as at FY18.

March 25, 2019                                                                                                                                14
V.I.P. Industries

                 Creating twin levers of growth

                 VIP has been synonymous with suitcase and luggage in India. However, over the
                 last few years it has laid lot of focus on emerging segments like backpacks and
                 ladies handbags to accelerate the growth. Backpacks currently contribute ~15-20%
                 of sales while Caprese has achieved sales in excess of Rs1bn.

                 Backpacks – huge potential given low penetration

                 Having entered the market only about 4-5 years ago, Skybags today is the leading
                 backpack brand for VIP. Aggressive pricing to begin with, good product assortment
                 and attractive price points in the range of Rs1,000-2,000 has enabled Skybags to
                 gain market share. Back pack as a category has grown at a CAGR of more than
                 30% for the last 3-4 years and is expected to sustain the growth momentum as:

                    Backpacks are more light weight and in demand as they are stylish,
                     comfortable and hassle-free. Further, their demand is linked to 2W, organized
                     workforce and student strength which has seen a rise over the last few years.
                     We see the trend continuing, till a new substitute emerges.

                    Penetration is less than luggage and it is a repeat item (new backpack is bought
                     once every 2-3 years as compared to luggage which is bought every 4-5 years)

                    Backpack market is led by local and unorganized segment, as the product has
                     gained wide acceptance in past 5-7 years only. Branded segment has huge
                     scope led by increased distribution and consumer up-gradation.

                               Backpacks: A brief overview
                 Brands                    Skybag, Aristocrat, VIP
                 Price point               Rs1,000-2,000
                 Margin profile            GM is in line with luggage but less than hand bags
                 Is the brand being
                                           Yes
                 advertised?
                 Brand Ambassador          Varun Dhawan for Skybags
                 Key competing brands      American Tourister, High Sierra, Safari, Wildcraft, Fast track
                 Seasonality               Yes, majority of the sales happen in 4Q
                 Category growth           >30%
                 Revenue contribution      ~15-20% of sales
                 Source: Company, PL

                 Share of backpack in overall revenues has increased from 12% in FY16 to ~15-
                 20% in FY18 and is expected to rise further to 22.1% in FY21E as two additional
                 brands viz; Aristocrat (value pricing) & VIP backpacks (premium pricing) have been
                 launched, the merchandize has seen improvement and penetration is low.

                 Caprese to grow at a CAGR of 35% over FY18-21E

                 VIP Industries entered the ladies hand bags market with the launch of Caprese in
                 2013. Caprese is positioned in the synthetic leather segment to compete with the
                 likes of Lavie, Baggit and Esbeda and is a premium brand targeting the core age
                 group of 20-45 years. Despite initial challenges in establishing the brand, setting
                 the right price point and revamping the distribution, Caprese has achieved sales of
                 Rs1bn (47% CAGR since inception) in FY18 and it is amongst the top 5 handbag
                 brands in India.

March 25, 2019                                                                                              15
V.I.P. Industries

                                                      Product and price positioning

                                                      Initially the hand bag was priced in the range of Rs4,000-5,000 but it did not get the
                                                      desired response (margins in unbranded are higher) and thus the price was lowered
                                                      (average price now is in the range of Rs2,000-3,000) which increased affordability.
                                                      Given branding plays a big role in the ladies’ handbags market, VIP has hired Alia
                                                      Bhatt to endorse its brand. Further, entry into the mass premium segment ruled by
                                                      unorganized players will further open the playing field for VIP.

                                                      Modern trade, EBO’s & E-com hold key

                                                      Caprese has presence in ~200 modern trade outlets and ~300 EBOs. It also has
                                                      presence in department stores and e-com. However, it has negligible presence in
                                                      the traditional dealer/distribution channel where VIP is strong. If VIP is able to milk
                                                      this channel to its advantage (convince dealers to sell Caprese as against
                                                      unbranded/private label products), we believe Caprese could be a far bigger brand
                                                      like VIP and Skybags. However, high margins in the unbranded category (little
                                                      incentive to stock Caprese) and fundamental shift towards hyper markets & modern
                                                      trade for shopping (puts pressure on dealer channel as footfalls come down) are
                                                      key challenges to expand in the traditional channel. We believe as penetration in
                                                      EBOs, modern trade and e-com rises the brand will gain further credence.

                 Caprese: A brief overview
Brand name                     Caprese
Launch date                    2013
Product type                   Hobo, clutch, satchel, laptop satchel, sling, tote, wallet, handbag, crossbody, sleeve
Price point                    Rs 1,500-4,000
Brand size                     Over Rs1bn
Margin profile                 EBITDA positive, GM is better than luggage & backpacks
Is the brand being advertised? Yes
Brand Ambassador               Alia Bhatt
Distribution model             Modern trade, EBOs, E-com. Little presence in traditional dealer/distribution channel
Key competing brands           Lavie, Baggit, Esbeda. Hidesign and DaMilano are in genuine leather segment and hence not direct competitors.
Touch points                   More than 1,000; >40% of sales is from E-com
Source: Company, PL

                                                      Given changes made in price point and revamping done in the distribution channel
                                                      we expect Caprese’s share in revenues to rise from ~7.1% in FY18 to ~9.2% in
                                                      FY21E (35% revenue CAGR over the next 3 years). Rising share of Caprese will
                                                      uplift the EBITDA (high margin product than luggage) profile of VIP.

                                                      Channel checks indicate brand pull for Skybags is high;
                                                      Carlton is a sturdy product

                                                      Key findings from our visits to MBOs, EBOs, hypermarkets of VIP, Safari and
                                                      Samsonite indicate that 1) trade margins are in the region of 20-30% with
                                                      unbranded having the highest margin 2) brand pull for Skybag is high and collection
                                                      is well accepted by the market 3) Carlton is extremely sturdy product (limited
                                                      possibility of lifetime warranty to be invoked) with no discounts being offered 4)
                                                      Caprese had limited shelf space in Carlton EBOs. In hypermarkets, collection of
                                                      Lavie and Baggit was at par/sometimes even better than Caprese 5) VIP EBOs
                                                      were offering cash back (not present in other channels) 6) Quality issue on
                                                      Samsonite product was low (limited customer complaints) 7) Safari is offering
                                                      highest credit period to dealers/retailers.

March 25, 2019                                                                                                                                 16
V.I.P. Industries

              Channel check - Feedback from our visit to EBOs, MBOs & hyper markets
Particulars              Our observation                                 Comments
                                                                         Hyper market is a discounted channel for sale of mass products. Since
                         Safari's shelf space was more or less equal
                                                                         Safari has a strong mass portfolio it covered more or less equal shelf
                         when compared to the other two giants
                                                                         space as VIP & Samsonite.
Visit to hyper markets                                                   As end of season sale was around the corner, huge discounts were in
                         Huge discounts visible
                                                                         the offing.
                                                                         Aristocrat, Safari and Kamiliant had high visibility. Even Skybags had
                         Low end brands visible
                                                                         decent shelf space. Alfa was virtually non-existent.
                         No product discounts; in all 5 series were
                                                                         Price range was Rs7,000-25,000.
                         available
Visit to Carlton EBOs    Carlton edge offered lifetime warranty including Density of PC used to manufacture Carlton products was high but weight
                         accidental damage                                was light. Product was extremely sturdy.
                         Caprese had some shelf space                    Scope for improvement remains
                         Premium products on display                     NA
                                                                         Since EBOs offer premium products cashback offers were available only
                         Cashback offer was available
                                                                         in this channel to persuade customer to buy high end products.
Visit to VIP EBOs                                                        Management commentary by both listed luggage players over PP to PC
                         PP shelf space was low
                                                                         movement was quite evident
                                                                         Our interaction with the PoS personnel suggests that brand pull for the
                         Skyback collection was appealing
                                                                         product is high
                         Safari was providing a 5 year warranty including
                                                                          NA
Visit to a small         product replacement in some cases
temporary Safari         Backpack collection was limited, however,
outlet inside the mall   luggage collection was dominated by SL (both    NA
                         nylon & polyester)
                         Backpack collection started from Rs 1,900       Collection was at premium end
                         Product quality was superior with many options
Visit to Samsonite                                                      NA
                         on display
EBOs
                         Had only 1 PoS person in a ~300-400 sq ft
                                                                         Indicates brand pull is high
                         shop
                         Safari is offering highest credit period to
                         dealers/retailers followed by VIP and then      Credit period for Safari is high as it wants to establish itself in the market
                         Samsonite.
                         Trade margins are in the range of 20-30%.
                         Margin hierarchy is as follows:-
                         1) Unbranded
                                                                         Unbranded offers high margins while brands command low margins
                         2) Safari
Visit to MBOs            3) VIP
                         4) Samsonite
                         Warranty for backpacks is 1 year across brands.
                         Warranty for luggage was 5 years for VIP and    NA
                         Safari and 3 years for Samsonite
                                                                         Since we visited metro EBOs shelf space for Safari was low. Our
                         Shelf space for Safari was negligible           interaction with PoS personnel suggests Safari has strong presence in
                                                                         teir 2/3 markets

Source: PL

                                                        Competitive landscape of the luggage industry

                                                        While VIP is a market leader in the organized luggage industry, Safari (35% sales
                                                        CAGR over the last 5 years) has emerged as a strong competitor over the last few
                                                        years. At the premium end of the market (price point above Rs6,000) Samsonite is
                                                        a formidable player. VIP has a well-diversified portfolio to compete against both
                                                        Samsonite and Safari at premium and mass end of the brand hierarchy.

March 25, 2019                                                                                                                                        17
V.I.P. Industries

                 Comparative analysis: VIP leads in terms of size; Samsonite has higher margins but Safari has long way to go
                                                       VIP                                          Samsonite                                    Safari
Particulars                                                                                                                                                                  Safari is the biggest beneficiary of GST transition.
                                      FY14     FY15     FY16       FY17     FY18    CY13    CY14       CY15     CY16     CY17    FY14    FY15      FY16    FY17     FY18    Samsonite's growth has been in single digits (last 3
                                                                                                                                                                             years) since upscaling has happened at the mass
Sales                                 9,728   10,477   12,165     12,515   14,096   7,787   9,110      9,748    9,412   10,045   1,665   2,159    2,769    3,423   4, 154       segment. VIP's growth has been in line with
YoY Growth                            16.1%    7.7%    16.1%       2.9%    12.6%    20.0%   17.0%      7.0%     -3.4%    6.7%    78.2%   29.7%    28.2%    23.6%   21.4%          industry due to well diversified portfolio

Gross margins                         45.3%   45.3%    45.5%      46.0%    49.5%    42.7%   45.8%     46.5%     45.4%    48.2%   45.4%   42.3%    42.8%    41.1%   45.7%     Samsonite has lowest rent expense since it has
                                                                                                                                                                                       adopted franchise model

Rent expenses (as a % of sales)       3.8%     3.7%     3.6%       3.8%     3.5%    1.6%    1.4%       1.2%     1.6%     1.9%    3.3%    3.4%      3.3%    2.8%     2.6%
                                                                                                                                                                            Safari has lowest A&P spend since it hasn't signed
                                                                                                                                                                                          any brand ambassador
A&P spend (as a % of sales)           5.9%     6.0%     5.8%       6.1%     6.4%    4.2%    6.3%       5.7%     5.1%     6.2%    4.1%    2.2%      2.0%    2.3%     1.9%
                                                                                                                                                                            Samsonite has lowest employee cost given strong
                                                                                                                                                                            brand pull (less people required at PoS to push the
Employee expenses (as a % of sales)   9.6%    10.5%    10.3%      11.2%    11.3%    8.8%    8.6%       7.8%     8.6%     10.0%   10.5%   10.5%    10.5%    11.7%   12.7%                          product)

                                                                                                                                                                               VIP has best collection cycle given it is a well-
Freight & Octroi (as a % of sales)    5.0%     5.4%     5.2%       4.8%     4.9%    3.5%    2.9%       2.8%     6.8%     5.8%    6.8%    6.2%      5.5%    6.7%     6.3%      established brand (lends better bargaining power
                                                                                                                                                                            with dealers/distributors). Safari's collection cycle is
                                                                                                                                                                            lengthiest amongst peers as brand parentage is yet
EBITDA margins                        8.3%     7.4%     8.9%      10.6%    13.7%    11.3%   15.1%     17.2%     13.7%    16.2%   4.1%    5.6%      6.5%    7.0%     9.8%                          to evolve.

                                                                                                                                                                            Inventory days tend to be high across industry given
                                                                                                                                                                              1) luggage is bought infrequently (inventory turn is
PAT margins                           5.9%     4.4%     5.5%       6.6%     8.9%    5.7%    8.9%      10.6%     8.5%     10.6%   0.1%    2.0%      2.8%    2.8%     5.0%
                                                                                                                                                                             low) 2) it is a bulky item & requires high SKUs, and
                                                                                                                                                                            3) average lead time for SL to arrive from China is 3
                                                                                                                                                                                                      months.
Working capital management
Debtor days                              36      39          45      35       46       69      58         63       56       72      70      68       72       62      91    Credit period is a function of scale. Larger the scale
                                                                                                                                                                             better the bargaining power with Chinese suppliers
Inventory days                           66      79          86      82       82       56      52         56       61       68     102     101      101      100     107    and longer the credit period. This is evident from the
                                                                                                                                                                              fact that both VIP & Samsonite have better credit
Payable days                             37      41          48      42       55       56      55         55       49       71      66      23       29       50      41
                                                                                                                                                                                              terms than Safari.
Cash conversion cycle                    64      76          83      75       73       70      55         64       68       70     105     145      143      112     157
                                                                                                                                                                             PAT margin expansion is driving RoE's. Given low
                                                                                                                                                                            capital intensive nature of the industry, FAS turnover
BS & CF variables                                                                                                                                                                            is another RoE lever.
RoE                                   20.1%   15.2%    18.4%      20.4%    25.6%    31.2%   40.7%     36.9%     25.3%    36.1%   0.9%    5.6%      8.5%    9.5%    12.1%
                                                                                                                                                                            Both VIP & Samsnoite are debt free. Safari being a
RoCE                                  20.9%   17.8%    24.9%      29.1%    36.9%    33.0%   57.3%     54.5%     36.3%    51.6%   8.7%    8.3%      9.3%    13.3%   15.3%     new entrant has debt on books predominantly to
                                                                                                                                                                                     meet the working capital needs
D/E                                     0.1      0.1      0.0          -        -     0.5     0.1          -        -        -     4.2     0.4       0.6     0.4      0.3
OCF (Rs mn)                             503     136      534       1,265     859      745   1,075        781      797      889    (25)   (321)     (130)     241    (480)     Safari's OCF is negative due to lengthy working
                                                                                                                                                                                               capital cycle.
Dividend payout ratio                 41.7%   45.5%    42.6%      39.8%    33.4%      NM    24.0%     18.9%     44.4%   100.1%     NM    9.3%      6.4%    8.2%     5.0%

Source: Company, Ace equity, PL

March 25, 2019                                                                                                                                                                                                                  18
V.I.P. Industries

                 As seen in the table, VIP’s 5-year average EBITDA margin is higher by 320 bps
                 than Safari but lower by 490 bps than Samsonite. Factors that result in margin
                 diversity amongst peers include differences in 1) rent expenses 2) A&P spend 3)
                 employee expenses.

                 Samsonite has lowest rent expenses due to franchise model

                 Rent expense is a function of EBOs. VIP has ~250, Safari has ~40-50, while
                 Samsonite has more than 350 stores (exact EBO count not available). Samsonite
                 has lowest rent expense amongst peers since most of its stores are on franchise
                 model. VIPs rent expense is marginally higher than Safari as it has higher number
                 of EBOs in tier 1 markets where the rent expense is higher.

                 Safari has lowest brand-ex amongst peers

                 VIP and Samsonite’s A&P spend is more or less similar in the range of 5-7% while
                 Safari is lower by ~400bps as compared to the peers. Since there is no
                 manufacturing moat in luggage business (SL is imported from China) branding
                 (both VIP and Samsonite have brand ambassadors) is extremely critical to achieve
                 scale. This is evident by the fact that Samsonite despite being a global brand & VIP
                 being in existence in India for 48 years continues to invest heavily in brand building.

                              VIP leads the branding game vis-à-vis peers
                 Company              Brand Ambassador
                                      Alia Bhatt for Caprese, Varun Dhawan for Skybags, Rohit Sharma & R
                 VIP Industries
                                      Aswhin for Aristocrat, Hrithik Roshan for VIP
                 Samsonite            Virat Kohli for American Tourister
                 Safari Industries    NA
                 Source: Company, PL

                 Samsonite has highest revenue per employee

                 Despite having more than 350 stores (requires in-store merchandiser which is
                 absent in traditional dealer distribution model) Samsonite’s employee cost is lowest
                 amongst peers signifying the impact of brand pull (less people required at point of
                 sale to push the product). As Safari has lowest A&P spends and limited brand re-
                 call, employee cost is highest amongst peers. For VIP, employee expenses have
                 been rising over the last 3 years as presence across modern trade & EBOs have
                 increased.

                              Samsonite has highest revenue per employee
                                     Number of permanent     Revenue FY18/CY17             Revenue per
                 Company
                                     employees as of FY18              (Rs mn)         employee (Rs mn)
                 VIP                                 2,099              14,096                      6.7
                 Samsonite                          1,000                  10,045                    10.0
                 Safari                             1,147                   4,154                      3.6
                 Source: Company, PL

                 PS: 1) The employee count does not include contractual labour 2) Samsonite's
                 employee count is not publically available. We take higher number from the range
                 (500-1,000) available on LinkedIn

March 25, 2019                                                                                             19
V.I.P. Industries

                 As seen in the above table, VIP is 3.4x the size of Safari Industries in terms of
                 revenues has 2x the number of employees. The revenue per employee for VIP is
                 1.9x Safari. However, while VIP is 1.4x the size of Samsonite, the revenue per
                 employee is lower than Samsonite given that the latter has a strong brand pull.

                 Safari has longest cash conversion cycle

                 VIP had cash conversion cycle of 73 days in FY18 as compared to 70 days for
                 Samsonite and 157 days for Safari. Strong brand parentage (improves bargaining
                 power with dealers/distributors) and scale/size advantage (lends bargaining power
                 against Chinese vendors) enables VIP and Samsonite to have a better cash
                 conversion cycle than Safari.

March 25, 2019                                                                                     20
V.I.P. Industries

                 Financial projections
                 Brand salience (brand-ex is ~5-7% of sales), strong distribution network (~11,000
                 touch points), GST implementation (narrowed pricing gap with unorganized players
                 and resulted in up-trading), entry into the under penetrated ladies hand bags &
                 backpack market, product premiumisation and rising share of Bangladesh
                 operations is likely to drive sales/PAT at a CAGR of 23.7%/25.1% over FY18-21E.

                 VIP’s sales to grow at a CAGR of 23.7% over FY18-21E

                 Since FY08, VIP’s sales growth has never breached the 20% benchmark. In fact,
                 since FY04, there have been only two instances, one in FY07 (34.9% YoY growth)
                 and another one in FY08 (30.0% YoY growth), where sales growth has breached
                 the 20% benchmark.

                               Sales to grow at a CAGR of 23.7% over FY18-21E driven by
                 backpacks & handbags
                 Particulars (Rs mn)              FY18         FY19E         FY20E          FY21E
                 Luggage                        10,629         13,286        15,678         18,343
                 YoY growth                         NA         25.0%          18.0%         17.0%
                 As a % of sales                 75.4%         74.2%          71.6%         68.7%

                 Backpacks                        2,467         3,281         4,396          5,891
                 YoY growth                         NA         33.0%          34.0%         34.0%
                 As a % of sales                 17.5%         18.3%          20.1%         22.1%

                 Handbags                         1,000         1,350         1,823          2,460
                 YoY growth                         NA         35.0%          35.0%         35.0%
                 As a % of sales                  7.1%          7.5%           8.3%          9.2%

                 Total sales                    14,096         17,917        21,897         26,695
                 YoY growth                      12.6%         27.1%          22.2%         21.9%
                 Source: Company, PL

                 PS: The company does not share exact range/category wise revenue numbers.
                 Backpacks/handbags contribution is ~15-20% and ~7% of sales respectively in
                 FY18. We use our judgment in arriving at the approximate figures.

                 We expect sales to grow at a CAGR of 23.7% over FY18-21E as 1) GST
                 implementation has led to reduction in price differential between organized &
                 unorganized players resulting in up-trading by consumers especially at the mass
                 end 2) backpack as a category is expected to grow at CAGR of 33.7% over FY18-
                 21E given low penetration and lower replacement cycle 3) given the changes made
                 in price point and revamping done in the distribution channel; handbag category is
                 expected to grow at a CAGR of 35.0% over FY18-21E.

March 25, 2019                                                                                  21
V.I.P. Industries

              Impact of GST on mass segment of the luggage industry
Particulars                       Comments

                                  Aristocrat brand (mass offering of VIP) has grown by ~79% in FY18 and is expected to grow by at least 70% in
VIP Industries
                                  FY19. During 3QFY19 call, management stated that Aristocrat has grown at a healthy pace.

                                  Kamiliant brand (mass offering of Samsonite) was launched in late 2016 but crossed the Rs1bn mark in first
Samsonite
                                  year itself. In 2018, Kamiliant was the highest focused brand & the plan is to double sales for next few years.

Safari Industries                 Entire portfolio is considered mass. 9MFY19 revenue of Safari was up 44.3% YoY.
Source: Media Articles, Company, PL

              Low penetration driving backpack sales
Particulars                       Comments
VIP Industries                    Backpack contributes ~15-20% of sales, category growing at 30%+
Samsonite                         NA
Safari Industries                 Backpack contributes ~
V.I.P. Industries

                             Gross margins are inversely correlated with crude prices; product
                 mix& price hike results in exceptions

                                    Brent crude movement           Gross margin movement

                   40%
                   30%                                                                   18%
                   20%                    32%
                           4%    24%                                                     4%     22%
                   10%           -2%      -2%              -2%   0%     0%     0%               -1%
                                                 -5%
                    0%
                                                                               3%
                  -10%                           -3%       -3%
                  -20%
                  -30%    -18%                                   -20%
                  -40%
                  -50%
                                                                        -45%
                          FY10   FY11     FY12   FY13     FY14   FY15   FY16   FY17      FY18   YTD
                                                                                                FY19

                 Source: Bloomberg, PL, Company

                             Gross margins are inversely correlated with rupee/dollar
                 exchange rate; product mix & price hike results in exceptions

                                        Dollar movement          Gross margin movement
                                                 14%
                   15%
                                                          11%
                                                                                                9%
                   10%                                                  7%
                                          5%
                           4%
                    5%                                                         3%
                                                                 1%
                    0%     4%                                                            4%
                                  -4%                                          0%        -4%
                                                                 0%     0%                      -1%
                   -5%            -2%     -2%              -2%
                                                 -5%
                  -10%
                          FY10   FY11     FY12   FY13     FY14   FY15   FY16   FY17      FY18   YTD
                                                                                                FY19

                 Source: Bloomberg, PL, Company

                 As seen in the above chart, crude is up 22% YTD while USD has appreciated by
                 9% YTD in FY19. Increasing share of SL in the portfolio will further dent margins as
                 wage inflation in China is rising. However, calibrated price hikes (10% hike taken in
                 FY18 and 7% YTD in FY19) and better product mix (increasing share of high margin
                 products like Carlton & Caprese) should partially offset the impact of crude and
                 rupee volatility. While the gross margin is expected to decline by 110bps to 48.4%
                 in FY19E amid RM cost inflation, high cost inventory and increase in import duty
                 we expect an expansion of 40bps each year to 48.8%/49.2% in FY20E/FY21E
                 respectively.

March 25, 2019                                                                                         23
V.I.P. Industries

                               Higher share of SL makes VIP susceptible to rupee volatility

                                        Revenue share of HL      Revenue share of SL

                     100%
                      90%
                      80%
                      70%
                               71.3%          73.9%           72.5%         76.1%         76.3%
                      60%
                      50%
                      40%
                      30%
                      20%
                               28.7%          26.1%           27.5%         23.9%         23.7%
                      10%
                       0%
                               FY14           FY15            FY16          FY17           FY18

                 Source: Company, PL

                 Product premiumisation to aid in EBITDA margin
                 expansion

                 While EBITDA margin is expected to compress by 120bps to 12.6% in FY19E amid
                 increase in import duty, adverse product mix (increasing share of mass brand
                 aristocrat) and inability to take sufficient price hike in line with RM cost inflation &
                 rupee depreciation we expect margins to expand 90bps/70bps to 13.4%/14.1% in
                 FY20E/FY21E led by: -

                      Launch of new product range (Laptop cabin strolly, duffle strolly, satchel strolly
                       and a whole new range of designer backpacks) which would drive scale and
                       thus operating leverage

                      Increasing share of Carlton and Caprese which rank higher in the margin
                       hierarchy

                      Reduction in rent expenses from 3.5% in FY18 to 3.2% in FY21E given
                       preference towards franchise model

                      Reduction in freight & octroi expenses from 4.9% in FY18 to 4.5% in FY21E
                       due to introduction of GST which has resulted in reduction in number of
                       warehouses (earlier warehousing decision was based on the tax structure of
                       various states). Post GST, it is based on proximity to customer/supplier.

                      Reduction in employee expenses from 11.3% in FY18 to 10.8% in FY21E as
                       operating leverage benefits would start kicking in with improving scale.

                 Consequent to the expansion in EBITDA margin (24.9% CAGR over FY18-21E) we
                 expect the PAT to grow at a CAGR of 25.1% over FY18-21E.

March 25, 2019                                                                                        24
V.I.P. Industries

          Caprese share in sales to rise to 9.2% in FY21E                            Rent, freight & employee expenses to decline

 10.0%                                        9.2%                30bps, 40bps,50 bps over FY18-21E
  9.0%                            8.3%                                          Rent expenses                                       Freight expenses
  8.0%                7.5%
           7.1%                                                                 Employee expenses
  7.0%
                                                                                                             11.3% 11.1% 10.8% 10.8%
  6.0%                                                              12.0%                  10.5% 10.3% 11.2%
                                                                               9.6%
  5.0%                                                              10.0%
  4.0%                                                               8.0%
  3.0%                                                                         5.0% 5.4% 5.2% 4.8% 4.9% 4.8% 4.7% 4.5%
                                                                     6.0%
  2.0%                                                               4.0%
  1.0%                                                               2.0%      3.8% 3.7% 3.6% 3.8% 3.5% 3.4% 3.3% 3.2%
  0.0%                                                               0.0%
           FY18       FY19E       FY20E       FY21E

                                                                                    FY14

                                                                                                      FY16

                                                                                                                  FY17

                                                                                                                             FY18
                                                                                             FY15

                                                                                                                                      FY19E

                                                                                                                                                FY20E

                                                                                                                                                             FY21E
Source: Company, PL
                                                                  Source: Company, PL

                                            Improvement in cash conversion cycle to drive OCF at a
                                            CAGR of 21.0% over FY18-21E

                                            VIP’s cash conversion cycle is expected to improve from 73 days in FY18 to 70
                                            days in FY21E as we expect payable days to increase from 55 in FY18 to 59 in
                                            FY21E once scale of the business increases (revenue CAGR of 23.7% over FY18-
                                            21E). Debtor days are likely to improve marginally from 46 in FY18 to 44 in FY21E
                                            as share of CSD sales has been declining which has longer credit period. However,
                                            we expect the average collection period for next 3 years to be higher than the past
                                            5-year average of 40 days as competition has intensified in the luggage industry
                                            over last 2-3 years due to emergence of Safari. Inventory days are likely to increase
                                            from 82 in FY18 to 85 in FY21E with increasing share of handbags and backpacks
                                            which require higher SKUs.

                                                            VIP’s cash conversion cycle to improve to 70 days in FY21E

                                                                Debtor days                                   Inventory days
                                                                Payable days                                  Cash conversion cycle (RHS)

                                             100                               83                                                                                    90
                                                                   76                        75
                                              90                                                             73            72          71               70           80
                                              80       64
                                                                                                                                                                     70
                                              70                                                                                                                     60
                                              60
                                                                                                                                                                     50
                                              50
                                                                                                                                                                     40
                                              40
                                              30                                                                                                                     30
                                              20                                                                                                                     20
                                              10     36 66 37   39 79 41   45 86 48        35 82 42   46 82 55           45 83 56    44 84 57     44 85 59           10
                                               0                                                                                                                     0
                                                      FY14       FY15         FY16          FY17        FY18             FY19E       FY20E         FY21E

                                            Source: Company, PL

                                            Improvement in cash conversion cycle is likely to drive OCF at a CAGR of 21.0%
                                            over FY18-21E. With minimal capex needs (SL expansion would require Rs200-
                                            250mn), FCFF generation is likely to be at Rs421mn/Rs932mn/Rs1,252mn in
                                            FY19E/FY20E/FY21E resulting in higher dividend pay-outs. We expect average
                                            pay-out ratio to be closer to ~32% over the FY19-21E.

March 25, 2019                                                                                                                                                        25
V.I.P. Industries

                                              Valuations
                                              Premium valuations justified; past history redundant

                                              There have been two sharp rallies 1) one between 2010-2012 and 2) post 2017;
                                              over the last 10 years resulting in a 52% CAGR in VIP’s stock price. While the first
                                              rally was more cyclical in nature (driven by crude & exchange rate) the second one
                                              is more structural as it is driven by GST (shift from unorganized to organized),
                                              improvement in scale of Bangladesh operations and better brand visibility of
                                              Caprese though the role of crude and exchange rate cannot be undermined.

           VIP’s stock price has delivered a CAGR of 52% over the last 10 years

 700.00
                                                        Introduction of GST
           Dollar w as pretty stable in the
 600.00                                                 Dollar depreciated 3.9% in FY18
           range of 46-48 from FY10-FY12
 500.00                                                 EBITDA margin expansion of ~400-500bps since FY16
           Brent crude w as down 18% in
 400.00    FY10                                         Improving scale of Bangladesh operations
                                                        Improving brand visibility of Caprese
 300.00    Safari had negligible presence

 200.00

 100.00

   0.00
          May-14
          Jun-10

          May-12

          Jan-16
          May-16
          Jan-07

          Jun-08

          Jan-09

          Jun-17

          Jan-18
          Feb-12
          Feb-10

          Feb-14
          Mar-08

          Mar-13

          Mar-17
          Mar-15

          Mar-19
          Apr-09

           Jul-11

           Jul-15

          Apr-18
          Apr-07

           Jul-09

          Apr-11

           Jul-13
          Oct-13

          Oct-17
          Oct-15
          Aug-07

          Sep-08

          Sep-12

          Aug-16
          Sep-10

          Aug-14

          Aug-18
          Nov-09

          Dec-10

          Dec-14

          Nov-18
          Nov-07

          Nov-11

          Dec-12

          Nov-16
Source: Company, PL

                                              As seen below, the stock peaked out 50x one year forward earnings during the rally
                                              of 2010-2012 as well as the one witnessed post 2017 (both the rallies were driven
                                              by earnings expansion). From a loss of Rs139mn in FY09, VIP achieved peak profit
                                              of Rs887mn in FY11, which was regained only in FY17 (stock price was more or
                                              less flat in the interim). The peak of FY11 (regained in FY17) was finally breached
                                              in FY18 with a profit of Rs1.25bn (second leg of the rally began).

          One year forward PE band                                            One year forward PE band chart
  700                                                                     P/E (x)               Peak(x)            Avg(x)
                                                      50.0x
  600                                                                     Median(x)             Min(x)
  500                                                 40.0x      60.0         52.6
  400                                                 30.0x      50.0
                                                                 40.0         28.3
  300
                                                      20.0x      30.0
  200                                                                                                                       31.1
                                                                 20.0
  100                                                 10.0x                25.3           2.2
                                                                 10.0
    0                                                             0.0
        Feb-12
        Sep-12

        Feb-19
         Jan-15
          Jul-11

          Jul-18
        Aug-15
        Oct-09

        Oct-16
        Mar-09

        Mar-16
        May-10
        Dec-10

        May-17
        Dec-17
        Apr-13

         Jun-14
        Nov-13

                                                                        Feb-12
                                                                        Sep-12

                                                                        Feb-19
                                                                          Jul-11

                                                                          Jul-18
                                                                         Jan-15
                                                                        Aug-15
                                                                        Oct-09

                                                                        Oct-16
                                                                        Mar-09

                                                                        Mar-16
                                                                        May-10
                                                                        Dec-10

                                                                        May-17
                                                                        Dec-17
                                                                        Apr-13
                                                                        Nov-13
                                                                        Jun-14

Source: Company, Bloomberg, PL                                 Source: Company, Bloomberg, PL

 March 25, 2019                                                                                                                    26
V.I.P. Industries

                                               We value the stock 33x FY21E earnings as we expect PAT to grow at a CAGR of
                                               25.1% over FY18-21E driven by shift towards organized market, premiumisation of
                                               product portfolio (rising share of Carlton & Caprese) and increasing share of
                                               Bangladesh operations which will improve the profitability profile. We believe the
                                               past trading history is immaterial and our multiple of 33x is justified as -

                                                  Unorganized players command ~67% of the market share and have been at a
                                                   huge structural disadvantage post GST which is not captured in the past
                                                   regime. Since the implementation of GST from 01 July 2017, VIP has traded
                                                   at an average TTM multiple of 46x.

                                                  Though Bangladesh operations began in 2014, initially management
                                                   bandwidth was consumed in managing raw material cycle and getting
                                                   infrastructure in place (VIP does not have presence in Dhaka/Chittagong which
                                                   are big export promotion zones). Thus, it took long before Bangladesh
                                                   operations turned into profit. As a result, past history does not reflect true
                                                   potential of a shift from China to Bangladesh. With profitability (FY18 PAT of
                                                   Rs95mn; 9MFY19 PAT of Rs128mn) of Bangladesh operations increasing and
                                                   scale advantage (plans to increase the capacity to 3.5mn units by FY19)
                                                   expected to come in, we believe re-rating is on the cards.

                                                  Product portfolio is witnessing premiumisation as share of Carlton and Caprese
                                                   (highest margin amongst all six brands) is expected to rise (current contribution
                                                   is ~7-8%) given changes made in distribution channel and rise in number of
                                                   EBOs (premium products typically sell in this channel). Full reflection of
                                                   premiumisation is not reflected in the past history as revenue share was
                                                   miniscule. Rising share of high margin brands is likely to result in re-rating from
                                                   these levels.

                                               Though one may argue that most of the global listed global peers (except Hermes
                                               International), trade at ~50% discount to VIP on a 1 year forward basis and hence
                                               the current valuation is unjustified we believe difference in valuation is a reflection
                                               of increase in brand premium and opportunity pie (transition towards organized
                                               market) that VIP has its disposal post introduction of GST.

              Global luggage/luxury goods companies financial profile
                                                   EBITDA        PAT
Particulars                             Revenue                                RoE        P/E Brief profile
                                                    margin     margin
                                                                                              Largest luggage company in the world by
Samsonite International (CY17-US$ mn)    3,490.9     16.6%         7.5%     14.2%        18.9
                                                                                              market share
                                                                                              Owns brands like Gucci, Bottega Veneta,
Kering SA (CY18- US$mn)                 16,140.0     32.5%      20.2%       34.0%        23.9
                                                                                              Saint Laurent
                                                                                              Known for handmade luggage &
Hermes International (CY17 - US$ mn)     6,269.0     39.0%      22.5%       25.9%        45.9
                                                                                              handbags
VF Corp (CY17 - US$mn)                  11,811.2     15.8%      10.5%       14.2%        21.9 Controls 55% of the US backpack market
Source: Company, Bloomberg, PL

                                               At our target multiple of 33x, we arrive at a TP of Rs579 per share (FY21E EPS of
                                               Rs17.6). Initiate with a BUY.

March 25, 2019                                                                                                                     27
You can also read