T -Mobile & 5G - Inflection Capital Management
←
→
Page content transcription
If your browser does not render page correctly, please read the page content below
T -Mobile & 5G

The purpose of this project was to:

  1. Update an investment idea and research work
     created in ’18 that was a “big idea.” One that Wall
     Street had absolutely not discussed, or focused on;
     i.e. it was not considered.

  2. Present to prospective employers how I frame new
     opportunities and explain very complex situations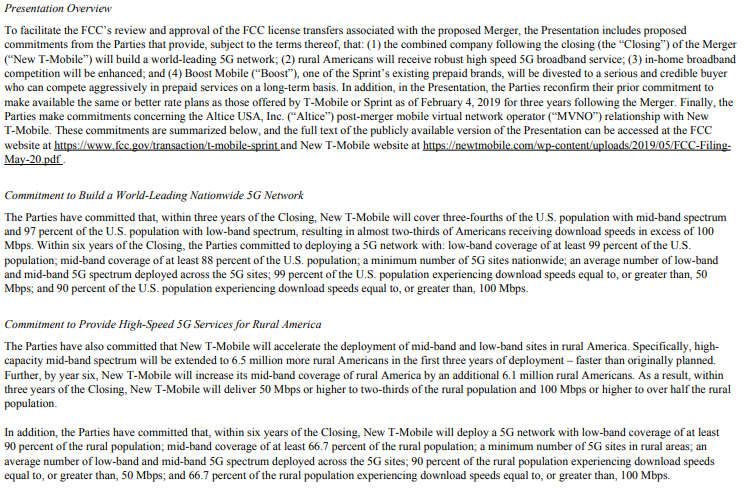
T-Mobile: How 5G creates the opportunity for a
transformation and substantial value creation

T-Mobile’s consistent obsession on increasing customer satisfaction
and value, being a consumer advocate and disruptor, Sprint’s
limitations, and the transition to 5G has created a substantial
opportunity for it to enter new markets and create more customer
lifetime value.

The merger with Sprint would be a major win for the consumer and the
nation as it will result in a more capable, higher quality, greater
coverage 5G network that is built faster than the status quo, especially
in rural markets. It will also bring more competition to the ISPs.

                   All rights reserved, Inflection Capital Management, LLC   2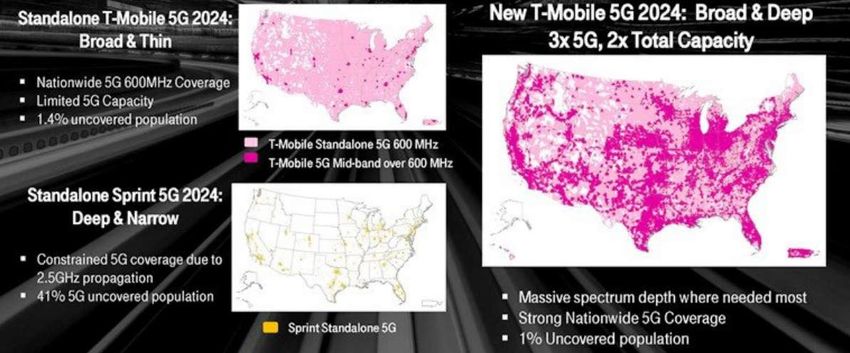
Summary
A Unique Opportunity: T-Mobile is afforded an opportunity for substantial shareholder value creation due to its
obsession for enhancing the relative consumer value of its service, hamstrung competitors, and the transition to 5G.

Winning Brand For Consumers: T-Mobile, know for its “Un-Carrier” product enhancements, has created substantial
consumer affinity and brand love over the past six years, resulting in substantial and continuing market share gains.
Given the fixed-cost nature of wireless service, those gains have resulted in substantial profit and cash flow growth
which allowed the financial strength for the Sprint proposal.

5G Precipitated the Merger: Wireless technology transitions like 3G to 4G, and 4G to 5G, allow wireless operators to
enhance their relative network service levels and significantly disrupt market share. The 5G transition also creates the
opportunity for T-Mobile to acquire Sprint as the economics and physics of the merger allows them to deliver a superior
5G service in terms of coverage, capacity, and capability to what it could independently

Win for the Country: the New-T-Mobile significantly increases in competitive intensity of both the wireless and wireline
industry, incenting AT&T, Verizon, Comcast, and Charter to move harder and faster to enhance their services and
value. All of this is good for the consumer and nation; that’s what creates a regulatory opening for the merger.

Replay of the Past: The proposed Sprint & T-Mobile merger is a replay of the Metro PCS & T-Mobile merger, a
development that was significantly disruptive to the status quo and that yielded significant consumer benefits.

5G – Forget about IoT, Remember 4G: the transition to 5G allows the opportunity for significant incremental service
revenue from more consumption. More consumption will come from more lines of service for new devices, more data
consumption, cloud-based services, and other more speculative opportunities like IoT.

Approval to Happen: We expect the deal to be approved because it’s good for the nation, provides the mechanism
for underserved markets to get better telecommunication services than the status quo, especially as 5G threatens to
widen the digital divide, and because it will be trumpeted as a major win by the Administration. The FCC’s leadership
blessed the merger on May 20th.

3X Investor Return: Should everything go management’s way with TMUS appreciating from $75 to over $245.

                                       All rights reserved, Inflection Capital Management, LLC                             3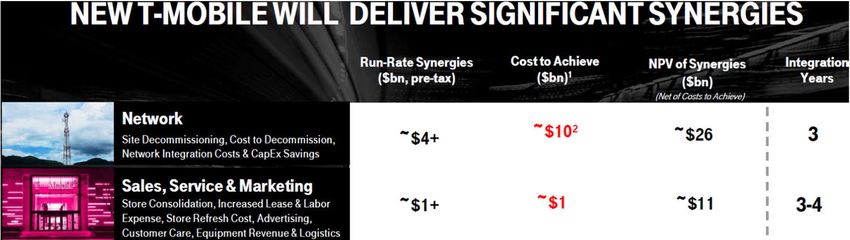
TMUS’ Substantial Value Creation Opportunity Dated: 5.23.19
The table shows a range of potential TMUS stock prices resulting from a range of fundamental outcomes.
Should everything go managements’ way, TMUS stock price could exceed $246/sh, up 3.25X.
The only way for a 3X increase to be possible is if the company and industry went through a significant and
favorable transition. That is what this presentation explores.
We have no way to accurately estimates potential outcomes, to apply probability-weighted outcomes
would be a false precession that yields a meaningless expected return number.
The Downside scenario is reflective of a break in industry pricing or an unexpected increases in costs that
leads to a -10% earnings revision and a contraction in the valuation multiple to 5.5X EV/EBITDA.
Year-End 2020 Stock Price Outcomes
Current Hitting 2021 6.5X 2022 8.5X 2022 8.5X & 5G Platform
Downside Price Consensus EBI TDA w / 5G EBI TDA w / 5G S+TMUS Economics
Value -$17 + $8 + $23 + $39 + $74 + $27
Total Value $58 $75 $83 $106 $145 $219 $246
Annualized Return -16% 7% 26% 55% 104% 121%
Hitting Consensus means that 6.5X & 5G means that industry 8.5X & 5G means that industry 8.5X & 5G + S+ TMUS means the Platform Economics means
TMUS can drive EBITDA to growth accelerates due to growth accelerates and prior plus the merger is that the 5G architecture
match the 2021 Consensus increased consumer usage margin levels improve. The approved allowing synergies; allows operators to capture
estimates, while maintaining a (lines & data) & estimates rise. faster growth leads to we estimate $8.5B in synergies an portion of subscriptions,
6.5X EV/EBITDA Valuation Yet, valuations do not. valuations expanding 30% vs. $6.0B guide apps, cloud, etc.
All rights reserved, Inflection Capital Management, LLC 4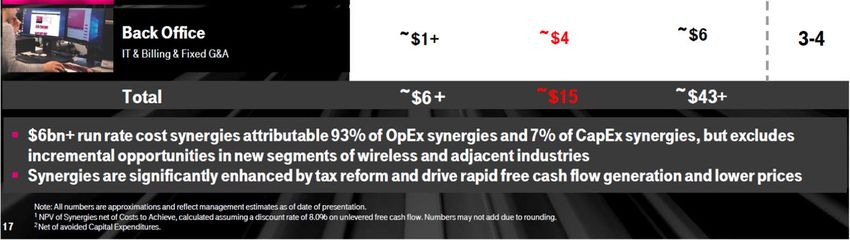
Since its 2012 merger with Metro-PCS, T-Mobile
The Un-Carrier: Classic Strategy -- has consistently given the consumer more value
Disrupt the Status-que and flexibility which has resulted in increased
competitive intensity for the industry.
The rise in intensity yielded:
A substantial decline in wireless CPI
Flattish industry revenue growth
A less competitive Sprint that has
been pushed back to #4 and into a
unsustainable financial position as a
national carrier
Note: Prepaid & Wholesale are connections
2016:Unlimited Data 2017: One-Price and Netflix-on-Us
Wireless Service CPI: More Consumer Value
Incumbents move
to “Unlimited”
5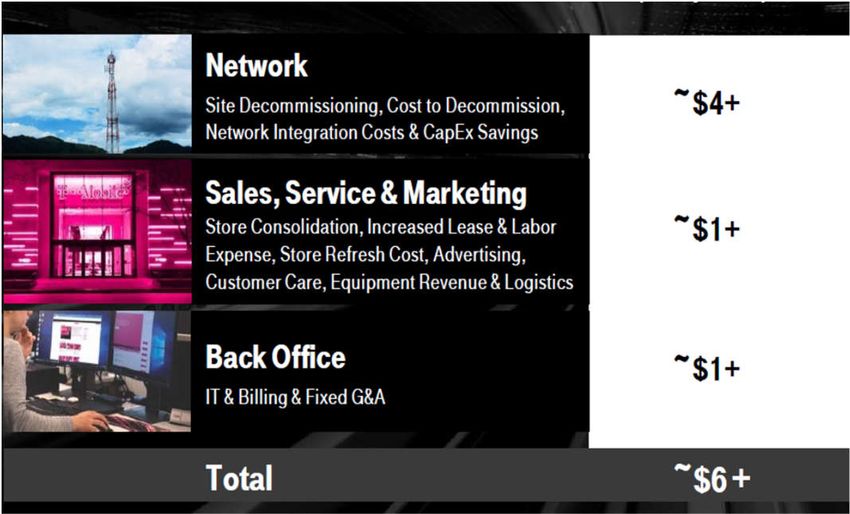
Sprint + T-Mobile: A Replay of Metro by PCS + T-Mobile
T-Mobile acquired MetroPCS (April ‘13 closing) coincident with the transition to 4G in order to foster greater
revenue and network scale and generate cost savings/synergies to fund its 4G network transition
i.e to improve on its competitiveness versus Verizon and AT&T; this is the same argument that is employing to
regulators and the public to justify the Sprint merger.
The merger created spectrum synergies to increase the capacity and coverage in major metro markets,
allowing T-Mobile to improve on its #1 consumer negative--network quality and coverage.
Additional benefits came from leveraging the sales force and stores, and better leverage with OEMs (Apple).
$1.5B in annual cost synergies were identified, at $3.34/sub/mo.
The integration of MetroPCS went smoothly in ‘13 and the full synergies were realized by ‘14. During 2013, new
customer benefits included the elimination of service contracts, iPhones for the 1st time, increased network
capacity, and the expansion of 4G LTE coverage to 200m peoples.
In the subsequent years, T-Mobile was able to improve its network quality and coverage such that its service
deficiency to industry leader Verizon significantly narrowed (as shown in the subsequent slides). That along with
T-Mobile’s value proposition strategies (Un-Carrier moves) strongly resonated with the consumer and these
allowed T-Mobile to gain substantial market share.
Synergies to improve coverage and value Network & spectrum synergies Spectrum Combination
All rights reserved, Inflection Capital Management, LLC 6
T-Mobile’s Network Started Inferior

      At the MetroPCS Deal
       (as of Oct, 2012)
       (no coverage w/ LTE)

     Verizon’s LTE Network in ‘14

                                                                Verizon’s network was vastly superior
                                                                in ’14 & won the advertising claim
                                                                “Best Network”

                                    All rights reserved, Inflection Capital Management, LLC             7
T-Mobile’s Improvement in Coverage: No Deficiency

                                                                         Verizon enjoys no network distinction 2018

                        All rights reserved, Inflection Capital Management, LLC                                       8
Un-Carrier + Better Network: More NPS & Customer Love

   Note: Prepaid & Wholesale are connections

                                                                                                         Significant
                                                                                                         Relative
Service Revenue Market Share Gains
                                                                                                         Gains

                                               All rights reserved, Inflection Capital Management, LLC                 9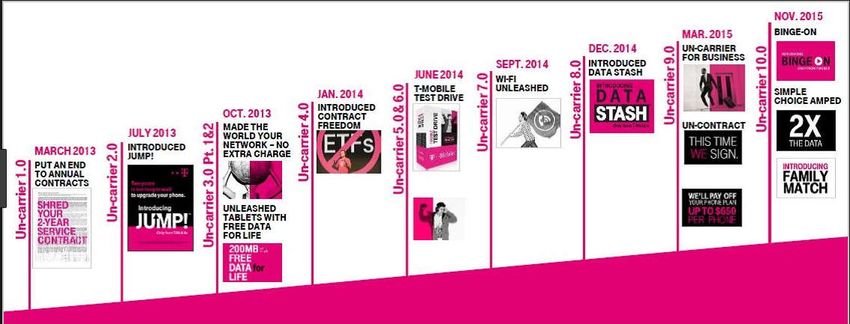
The Un-Carrier, Market Share Gains
     Postpaid Market Share Gains, +69% improvement in 6 years
      millio ns                2012    2013     2014     2015      2016      2017     2018
     Postpaid Phone
      Verizon                    84      86       88        89       89        90        91
      AT&T Mobility              68      68       68        66       64        64        63
      Sprint                     28      27       25        25       26        27        27
      T-Mobile                   20      22       26        29       31        34        37

     Total Postpaid Phone       200     203      207      210       211       214      220

      T-Mobile Share          10.0%   10.8%   12.5%     14.0%     14.9%    15.9%     16.9%    Significant

     Relative Churn Improvement, +90% in 6 years
     Monthly Postpaid Churn    2012    2013     2014     2015      2016      2017     2018
      Verizon (connections)   0.91%   0.96%   1.03%     0.95%     1.01%    1.09%     1.09%
      AT&T Mobility           1.08%   1.06%   1.04%     1.09%     1.07%    1.08%     1.11%
      Sprint (phone)          2.02%   2.22%   2.20%     1.74%     1.61%    1.66%     1.59%
      T-Mobile (phone)        2.32%   1.69%   1.59%     1.38%     1.30%    1.19%     1.15%

     Total                    1.28%   1.25%   1.25%     1.15%     1.14%    1.17%     1.17%

     T-Mobile vs. Others      1.7 X   1.2 X    1.1 X     1.1 X     1.1 X    0.9 X     0.9 X   Significant

     Service Revenue Market Share Gains, +46% improvement in 6 years
      $ billions               2012    2013     2014     2015      2016      2017     2018
      Verizon                   $64     $69      $73      $70       $67       $63      $61
      AT&T Mobility             $59     $62      $61      $60       $59       $58      $57
      Sprint                    $29     $29      $28      $26       $24       $23      $22
      T-Mobile                  $22     $21      $22      $25       $28       $30      $32

     Total                     $110    $111     $111     $111      $111      $111     $112

     T-Mobile Share            20%     18%      20%       22%       25%      27%       29%
                                                                                              Significant
                                        All rights reserved, Inflection Capital Management, LLC             10
Wireless services is a scale-business. Given the market share gains
Un-Carrier: Impact on shown on the prior pages, those resulted in substantial profit and
cash flow growth, allowing the T-Mobile to deleverage, increase its
T-Mobile’s Profits & Cash Flow service and sales investment (fueling a virtuous cycle), and allowing
for the Sprint bid in 2018.
Leverage from Disruption
2013 2018 Despite a 20%
$ billions expect mont hlies decline in price,
~$3.35/mo of the price
EBITDA/sub improved
Branded Customers (Avg)31.7 61.2 decline was funded by
10% due to
(millio ns) MetroPCS synergies
leveraging fixed
Service Revenue $19.1 $32.2 costs
(billio ns)
ARPU-Postpaid $52.60 $43.25
Leverage from filling
the network; lower
COGS $5.3 $6.4 costs despite massive
increases in usage
Borrowing Capacity Increased
Per Sub / Mo $13.86 $8.69 and customer value 2013 2018
$ billions
Est. GP-$ / sub / mo $38.74 $34.56 Total EBITDA $4.9 $12.4
Net Debt $20.2 $23.6
SG&A $7.4 $13.2 Customers per FTE Debt/EBITDA 4.1 X 1.9 X
improved to 1200
Per Sub / Mo $19.38 $17.94 from 800 2.75X Leverage
Borrowing Capacity Zero $10.5
Service EBITDA $6.9 $14.4
Per Sub / Mo $18.01 $19.61
More customers and More profits for more
more profit/customer borrowing capacity.
Note: T-Mobile’s acquisition of MetroPCS
closed in April ‘13. That was the point of
The outcome is what T-
time that they had the ability to scale. Mobile & Sprint argue is
the motivation for the
current merger and why
prices aren’t to rise
All rights reserved, Inflection Capital Management, LLC 114G + iPhone was the step-change as they enabled the
3G to 4G: Product Transition mobile app ecosystem by allowing significantly faster
data speeds and capacity that foster a new ecosystem
and platforms—the smartphone app.
4G allows Verizon and T-Mobile to be share winners
Market Share 2011 2012 2013 2014 2015 2016
Postpaid Phone
T-Mobile wins share in the value
AT&T 32.7% 32.9% 32.4% 33.0% 31.7% 30.6% market and due to improvements
Sprint 15.6% 13.8% 13.0% 12.1% 12.1% 12.4% in network and in Un-Carrier values
T-Mobile 10.5% 12.6% 13.4% 12.5% 14.0% 14.9%
Verizon 41.2% 40.7% 41.3% 42.4% 42.3% 42.2% Verizon wins share in the premium
and business segment due to its
Total 100.0% 100.0% 100.0% 100.0% 100.0% 100.0%
perceived superior network.
Upgrade rate accelerates due to 4G benefits over 3G
Service Revenues 3Q17 4Q17 1Q18 2Q18 Q318 Q418
A djusted Service revenue gro wth
AT&T Mobility -2.9% -2.5% -1.7% 0.2% 2.3% 2.9%
Sprint 2.5% 3.1% 4.6% 2.8% -0.5% -0.5%
T-Mobile 7.4% 7.3% 6.9% 6.5% 4.7% 6.6%
Verizon -5.1% -2.9% -0.7% 2.5% 2.9% 1.9%
Total -1.3% -0.3% 0.9% 2.5% 2.6% 2.7%
Note: Service revenue likely strengthened ex. hurricane credits
Sprint, AT&T, and VZ all guided to higher ARPUs in ‘19.
All rights reserved, Inflection CapitalCTIA
Management, LLC
Wireless Report 12What is 5G Really?
5G is Tony Stark Toys for Everyone
5th-Generation is the latest wireless standard following 4G
We are not going to opine about telemedicine, IoT, smart cities, autonomous vehicles and the like.
Focus on the two things that consumer care about--latency and speed (especially in the context of cloud-based services).
5G is going to allow processing and storage to move from the handset to the Cloud and the Edge.
5G will allow phones/devices to have significantly less commentary and a longer/smaller battery which is less cost.
5G Features
Change
Speed 100 Mbit/s - 5G 10X
Latency 1 ms 50x
Battery Life >10X
Battery Life Inverted 10X Smaller
Better Coverage & Reliablity Better
Latency: Think Nextel’s Push-To-Talk service, think “boot-up” time when computers used to be turned off
when not used, or when one had to “dial up” to reach the internet
All rights reserved, Inflection Capital Management, LLC 135G
Pre-5G we have the following constructs in our head; they are
things that we consider and manage
“Strong-Weak Signal”
“Fast-Slow Connection”
“Connected – Not
Connected to the Internet”
All rights reserved, Inflection Capital Management, LLC 145G
“Strong-Weak Signal”
“Fast-Slow Connection”
“Connected – Not
Connected to the Internet”
All rights
All rights reserved, reserved,
Inflection Inflection
Capital Capital Management,
Management, LLC LLC 15
155G
“Strong-Weak Signal”
“Fast-Slow Connection” Electricity
“Connected – Not
Connected to the Internet”
All rights reserved, Inflection Capital Management, LLC 165G
Connectivity:
to the Web
Electricity-Like
to the Cloud
across nearly all devices
All rights reserved, Inflection Capital Management, LLC 175G
Less cost
Less weight
Less volume
Other Features
10 second movie downloads
Instantaneous content, page downloads and search results
Instantaneous and life-like augmented reality
Nextel-like Push-To-Talk voice-connectivity and real-time
language translation, think Babel Fish or C-3PO
All rights reserved, Inflection Capital Management, LLC 185G
Little added
• volume
• weight
• cost
• Slim profile
• Less weight
• 3x battery life
• Lower cost
• More features
All rights reserved, Inflection Capital Management, LLC 19Instantaneous subscription
music and video from the cloud
5G into the Smart Eyewear
Real-time Traffic Navigation
Hands-free video
Augmented Reality Integrated stored into the cloud
into Smart Eyewear
Real-time Translation
Your own Babel Fish
All rights reserved, Inflection Capital Management, LLC 20Will 5G be priced at a premium?
4G fueled massive demand for data and 5G is expected to accelerate the trend.
The YoY absolute changes are enormous in ‘18
> 14X in data increase with 3G –> 4G, +88% YoY in Q4
Ericsson says
a 5.8X increase
for 5G
All rights reserved, Inflection Capital Management, LLC 21We refer to Sprint and T-Mobile and
Will 5G be priced at a premium? managements as “The Companies”
It’s complicated. Verizon has an early price of $10/mo. Our industry conversations have generally led to
confidence that there will more revenue from increased data usage, but we do not expect any real plan
price increases, or a 5G premium tier. Certainly, The Companies’ statement make it certain that they will not
charge a 5G premium. Verizon and AT&T will likely restrain themselves to not create a disadvantage. However,
what all three will do is bundle data intensive services and apps (gaming, SVOD, streaming music, etc.) that
push subscribers above throttling limits which incent users to upgrade their plans for more monthly data.
Already
marketing
5G Extremely limited
Hotspot data
All rights reserved, Inflection Capital Management, LLC 22& More Pricing (+$5/mo)
Throttled
after 22 GB
All rights reserved, Inflection Capital Management, LLC 23Will 5G be priced at a premium?
We have created a hypothetical model to demonstrate how this usage-based mechanism may
work. The model is completely a WAG. We do not know if usage has a normal distribution or
what the standard deviation is. We have seen enough surveys to feel that 6 GB per month is a
reasonable baseline. We have also used a range of 3rd party estimates for our 53 GB average by
2023. However, as we don’t have access the authors’ models we would also characterize our
estimates for data usage to be a WAG.
As 5G incents subscribers to use more data, upgrades increase
Monthly Wireless Data Use (GB) increases w/ 5G
2018 2019 2020 2021 2022 2023
Avg Use 6 8 15 27 38 53
Est. Std Dev 8 10 12 14 17 20
% of Users < 22 98 92 72 36 17 6
% of Users < 35 2 8 28 59 59 39
% of Users < 50 0 0 0 5 24 55
‘21 Distribution of Monthly Data Users by Usage
All rights reserved, Inflection Capital Management, LLC 24Revenue for 5G to be driven by plan upgrades
We have applied our usage model to a hypothetical product model to demonstrate how the
usage increases could filter through into higher ARPUs and more revenue. Verizon and AT&T use
caps at 22 GB. T-Mobile uses a much higher 50 GB. Verizon’s and T-Mobile’s plan tiers are
$10/mo and $15 respectively; AT&T’s is $5/mo. The model below uses $10/mo, but this is a also
WAG. Obviously the companies know their customer elasticities and how to optimize the benefit
from packaging, trade-up, and mix.
Model implies annual ARPU increases of +HSD, or ~$4/mo.
Monthly Wireless Data Use (GB) increases w/ 5G
2018 2019 2020 2021 2022 2023
Avg Use 6 8 15 27 38 53
Est. Std Dev 8 10 12 14 17 20
% of Users < 22 98 92 72 36 17 6
% of Users < 35 2 8 28 59 59 39
% of Users < 50 0 0 0 5 24 55
Hypothetical Prices ARPU
< 22 GB $40 $40 $40 $40 $40 $40
< 35 GB $50 $50 $50 $50 $50 $50
< 50 GB $60 $60 $60 $60 $60 $60
Weighting
< 22 GB $39.20 $36.80 $28.80 $14.40 $6.80 $2.40
< 35 GB $1.00 $4.00 $14.00 $29.50 $29.50 $19.50
< 50 GB $0.00 $0.00 $0.00 $3.00 $14.40 $33.00
Weighted $40.20 $40.80 $42.80 $46.90 $50.70 $54.90
YoY % Ch 1% 5% 10% 8% 8%
All rights reserved, Inflection Capital Management, LLC 255G & Wireless Industry
No Iot, smart factories,
Three Use Cases Modeled autonomous cars, drones,
Robotic surgery, etc. modeled
Year 2020
5G Mobile
Total Postpaid Wireless Sub Mkt 265,302
5G Phone Subscribers 9,500 Use Case-1
Penetration 3.6% Increased data consumption
leading to higher data-cap tiers
ARPU lift $2.80 and $2.80/mo of added ARPU
Revenue $210
NOPAT $133
5G Wireless Accessories
Penetration of 5G Subs 50.0%
5G Access Subscribers 3,500 Use Case-2
Connected accessories, pricing
ARPU $10.00
levels already established with
Revenue $300 iWatch and connected cars.
NOPAT $237
Fixed Broadband
Total Broadband Subscribers Mkt 98,940
5G BB Subscribers 1,500
Use Case-3
Penetration 1.5% This is wireline broadband
ARPU $50.00 replacement using
Revenue $750 neighborhood antennas.
NOPAT $415
Subscriber units are thousands; revenue and NOPAT is millions
All rights reserved, Inflection Capital Management, LLC 265G & Wireless Industry
Three Use Cases Modeled
Year 2020 2021 2022 2023 2024
Assuming penetration
5G Mobile gains slightly faster
Total Postpaid Wireless Sub Mkt 265,302 270,608 276,020 281,541 287,171 than 4G
5G Phone Subscribers 9,500 27,061 62,105 112,616 143,586 T-Mobile says 70% by
Penetration 3.6% 10.0% 22.5% 40.0% 50.0% 2023
ARPU lift $2.80 $6.90 $10.00 $10.00 $10.00
Revenue $210 $1,514 $5,350 $10,483 $15,372
ARPU lift capped at
NOPAT $133 $957 $3,381 $6,625 $9,715 $10/mo
5G Wireless Accessories
Penetration of 5G Subs 50.0% 45.0% 40.5% 36.5% 32.8%
5G Access Subscribers 3,500 12,177 25,152 41,049 47,103
ARPU $10.00 $10.50 $11.03 $11.58 $12.16
Revenue $300 $988 $2,469 $4,598 $6,429
NOPAT $237 $780 $1,951 $3,633 $5,079
2021 2022 2023 2024
Fixed Broadband
Total Broadband Subscribers Mkt 98,940 100,919 102,937 104,996 107,096
5G BB Subscribers 1,500 5,000 10,000 15,000 17,442 Assuming the historic
Penetration 1.5% 5.0% 9.7% 14.3% 16.3% precedent seen
ARPU $50.00 $50.00 $50.00 $50.00 $50.00 elsewhere. Google
Revenue $750 $1,950 $4,500 $7,500 $9,733 Fiber penetration was
NOPAT $415 $1,078 $2,489 $4,148 $5,382 75% of homes passed
Telcos are modeling
substantially more BB
subs than 17.4m
Subscriber units are thousands; revenue and NOPAT is millions
All rights reserved, Inflection Capital Management, LLC 275G & Wireless Industry: $21B new profit pool in 2024
Year 2020 2021 2022 2023 2024
5G Mobile
Total Postpaid Wireless Sub Mkt 265,302 270,608 276,020 281,541 287,171
5G Phone Subscribers 9,500 27,061 62,105 112,616 143,586
Penetration 3.6% 10.0% 22.5% 40.0% 50.0%
ARPU lift $2.80 $6.90 $10.00 $10.00 $10.00
Revenue $210 $1,514 $5,350 $10,483 $15,372
NOPAT $133 $957 $3,381 $6,625 $9,715
5G Wireless Accessories
Penetration of 5G Subs 50.0% 45.0% 40.5% 36.5% 32.8%
5G Access Subscribers 3,500 12,177 25,152 41,049 47,103
ARPU $10.00 $10.50 $11.03 $11.58 $12.16
Revenue $300 $988 $2,469 $4,598 $6,429
NOPAT $237 $780 $1,951 $3,633 $5,079
2021 2022 2023 2024
Fixed Broadband
Total Broadband Subscribers Mkt 98,940 100,919 102,937 104,996 107,096
5G BB Subscribers 1,500 5,000 10,000 15,000 17,442
Penetration 1.5% 5.0% 9.7% 14.3% 16.3%
ARPU $50.00 $50.00 $50.00 $50.00 $50.00
Revenue $750 $1,950 $4,500 $7,500 $9,733
NOPAT $415 $1,078 $2,489 $4,148 $5,382
New Revenue Pools Other
Revenue $100 $200 $400 $800 $1,600 applications.
NOPAT $55 $111 $221 $442 $885
Total 5G Revenue $1,360 $4,651 $12,719 $23,381 $33,134
NOPAT $840 $2,926 $8,042 $14,848 $21,061
All rights reserved, Inflection Capital Management, LLC 285G + T-Mobile-Stand Alone = Significant Lift to Growth & Profits
Stand-alone means that we are
looking at the impact of 5G on
T-Mobile’s economics independent
from any Sprint merger Year 2020 2021 2022 2023 2024 CAGR
Industry
T-Mobile currently has a Total 5G Revenue $1,360 $4,651 $12,719 $23,381 $33,134
17% share of post-paid
subs and 29% share of Total 5G NOPAT $840 $2,926 $8,042 $14,848 $21,061
service revenue.
23% share of 5G
Incremental Revenue $313 $1,070 $2,925 $5,378 $7,621
Incremental NOPAT $193 $673 $1,850 $3,415 $4,844
T-Mobile
Exisiting Bus Service Rev $32,160 $42,155 7%
Exisiting Business NOPAT $4,757 $8,755 16% 4 pt lift to
revenue
growth
Esisting T-Mobile + 5G
Total Service Rev $32,473 $49,776 11%
Total NOPAT $4,950 $13,599 29%
T-Mobile 5G EBITDA $156 $546 $1,521 $2,850 $4,115
Margin Rate 50% 51% 52% 53% 54%
All rights reserved, Inflection Capital Management, LLC 29Dec-19 Dec-20 Dec-21 Dec-22 Dec-23
Hitting Consensus
T-Mobile Stand-Alone Valuation EBITDA-NTM $13,700 $14,600 $15,500 $16,200 $16,900
& Longer-term Price Targets EV/EBITDA 6.5 x 6.5 x 6.5 x 6.5 x 6.5 x
Enterprise Value $89,050 $94,900 $100,750 $105,300 $109,850
Here we lay out the first three valuation
Net Debt $26,212 $22,841 $18,919 $14,407 $9,679
cases that were shown at the introduction FCF $4,494 $5,230 $6,016 $6,304 $6,704
(the green circles) Debt Paydown $3,371 $3,923 $4,512 $4,728 $5,028
75% of the free-cash-flow (FCF) is put into Equity Value $62,839 $72,059 $81,832 $90,894 $100,172
deleveraging. Using the resulting debt and per Share $72 $83 $94 $104 $115
holding the multiple, yields a rising equity
value driven by the EBITDA growth. 6.5X & 5G Dec-19 Dec-20 Dec-21 Dec-22 Dec-23
The 5G scenario results in more EBITDA to 5G EBITDA NTM $546 $1,521 $2,850 $4,115
deleverage faster. The 8.5X valuation vs. Total NTM $13,700 $15,146 $17,021 $19,050 $21,015
6.5X amplifies the equity value.
EV/EBITDA 6.5 x 6.5 x 6.5 x 6.5 x 6.5 x
Enterprise Value $89,050 $98,446 $110,638 $123,826 $136,599
8.5X is more appropriate given faster growth
and a larger TAM. Net Debt $26,212 $22,841 $18,595 $13,182 $6,765
FCF $4,494 $5,661 $7,218 $8,556 $9,955
The 2022 to 2023 equity value increase of Debt Paydown $3,371 $4,246 $5,413 $6,417 $7,466
$23B compares significantly to TMUS’ current
equity value of $65B. Equity Value $62,839 $75,605 $92,043 $110,644 $129,834
per Share $72 $87 $106 $127 $149
8.5X & 5G Dec-19 Dec-20 Dec-21 Dec-22 Dec-23
5G EBITDA NTM $546 $1,521 $2,850 $4,115
Total NTM $13,700 $15,146 $17,021 $19,050 $21,015
EV/EBITDA 8.5 x 8.5 x 8.5 x 8.5 x 8.5 x
Enterprise Value $116,450 $128,738 $144,680 $161,927 $178,629
$10B in FCF/yr Net Debt $26,212 $22,841 $18,595 $13,182 $6,765
compares to current FCF $4,494 $5,661 $7,218 $8,556 $9,955
debt of $26B and a Debt Paydown $3,371 $4,246 $5,413 $6,417 $7,466
market cap of $63B
Equity Value $90,239 $105,897 $126,085 $148,745 $171,864
per Share $104 $122 $145 $171 $198
Prices as of 5.23.19 All rights reserved, Inflection Capital Management, LLC 30Convergence Redefined
In September ‘17 T-Mobile announced “Netflix On Us” which is a benefit for 2-line (& other) subscribers of no
Netflix bill, i.e. Netflix will cover your T-Mobile subscription. At Netflix’s current price of $13/mo (2-streams), this is
a substantial subscriber benefit as it represents an 11% benefit/discount to the mobile subscription.
T-Mobile pays Netflix a discounted wholesale price (~10-30% lower). Netflix accepts the discount/wholesale
price because it benefits from no customer billing costs, no bad debt, and a lower cancelation (churn) rate.
Since then, AT&T included HBO and Sprint included Hulu.
Based upon T-Mobile’s management’s enthusiasm for the Netflix partnership, the prominence of the offer on
T-Mobile’s marketing and website store, and our analysis of disclosed figures, the offer is very popular.
We estimate that there are now 5.6m T-Mobile customer on the Netflix offer which is ~10% of Netflix’s
domestic subscribers. Moreover, the offer contributes ~17% of Netflix’s new subs each quarter.
“Netflix On Us” offer estimated to be 10% of Netflix’s US base
Netflix marked on all
Q4'17 Q4'18 Q1'19
T-Mobile merchandising
TMUS Postpaid Phone Subsribers: Avg. 33,669 36,714 37,224
Estimated new Neflix Subsribers YoY 800 2,400 2,400
Estimated Wholesale Price $8.99 $9.90 $9.90
Estimated Contra-Revenue--Annualized $43 $143 $143
Calculated ARPU Impact $0.11 $0.32 $0.32
2-Lines
Reported ARPU Impact $0.11 $0.32 $0.32
Estimated Total Neflix Subscribers 800 3,200 5,600
on TMUS' plan
Netflix Domestic Paid Subs: EOP 52,810 58,486 58,486
TMUS's Share 2% 5% 10%
Est. Netflix Gross Domestic Adds 13,800 13,800
% from TMUS 17% 17%
All rights reserved, Inflection Capital Management, LLC 315G holds another transformative opportunity—
To become a Platform Company
Two dynamics are at work,
one is the speed and response that 5G provides, the second is convergence.
Speed & response as noted previously will magnify the demand for cloud services and storage, but also for
what is called “mobile edge-computing” (MEC). It is imaginable, that the carriers not only compete with
price, packaging, and network coverage and capacity, but also with what the network can do in terms of
computing performance and applications.
Convergence between voice, data, video is happening at a very fast pace and scale (AT&T acquirng Time
Warner). It is also happening with payments, music, and other services. Over time, the carriers are going to
come head-to-head with Apple and Google over “who owns” the customer, who accrues the majority of
the customer’s life-time-value, and who gets the distribution revenue. In the case of T-Mobile’s “Netflix on
us,” if the subscriber had previously come to Netflix via. the Apple App Store, Netflix was paying 15% or
$2/mo to Apple. With “on us,” Netflix pays Apple nothing (T-Mobile also pays nothing to Apple).
The merger is strategically very important to T-Mobile and Sprint as it produces more scale to
create the above mentioned edge-computing and network differentiation vs. Verizon and AT&T.
It also gives them greater heft in negotiations with content providers (Netflix and Spotify), other
service providers (banking, etc.) and with Apple and Google.
The more the investment in 5G edge-compute hardware and backhaul, the superior the consumer
experience will be. The T-Mobile and Sprint merger via network, spectrum, and expense synergies allow for
a far more significant investment. One that creates a 5G service that would be far superior to what T-Mobile
alone could bring to market and at a faster pace. A superior service by T-Mobile/Sprint would incent AT&T
and Verizon to elevate their network investment intensity and pace from the status quo.
A superior 5G network will also give more leverage to the wireless operators in their relationships with
adjacent tech and media titans. That leverage should exhibit itself in a broader distribution of new revenue
and economics. As the competitive intensity between the operators will remain high, some of those
economics will flow to the consumer as we have seen with bundled OTT video.
All rights reserved, Inflection Capital Management, LLC 32Existing Network Architecture and Services Ecosystem
Current circle of
economics for operators
15-30% of the
economics
go to
All rights reserved, Inflection Capital Management, LLC 335G Demands Added Element of Edge Servers
Mobile Edge
Computing
added in 5G
All rights reserved, Inflection Capital Management, LLC 34Edge Servers Allow for Disrupting the Economics
A share of cloud storage and processing will move to MEC servers owned by the operators, as such the
operators should get these economics. This IS NOT TO IMPLY that work loads move to the MECs to the detriment
of AWS, etc. It is that the MECs and 5G create additional demand because of the Edges’ better response.
Should the operators offer a differentiated network that adds value, they should be able to capture some of
the value from new apps and bundled entertainment and subscription services into their monthly fee.
As the operators bundle entertainment and gain some leverage on IOS and Android, it is conceivable that
they are able to build targeted advertising business that also have local relevancy. This would serve to pick off
some of Google, Bing, and Facebook revenue.
Storage &
Processing
Economics
5G app
economics
shared
All rights reserved, Inflection Capital Management, LLC 352024 Platform Economics Plateform TAMS
billions 2019 2024 Assumption
We have made WAG estimates for each of Cloud
the existing and tangible markets from Big-3 Cloud Revenue $52 $159 25% CAGR
which the operators should be able to % NA 60% 50%
capture increased economics. Big-3 $ NA $31 $79
We assume that The New T-Mobile captures Wireless Operator Penetration 0% 10% WAG
a third of each of the new markets.
T-Mobile of Wireless 33%
In total, these could exceed $7B in revenue T-Mobile $ NA $0 $2.6
for The New T-Mobile which at 70% margins is
Mobile Apps
worth $33/sh in 2024, or $27/sh at year-end
US App Revenue $20 $40 AppAnnie
2020 using an 11% discount rate.
OS Split 20% 20%
Wireless Operator Penetration 0% 10% WAG
T-Mobile of Wireless 33%
T-Mobile $ NA $0 $1.3
Entertainment Subscriptions $110 $119 PwC
Wireless Operator Penetration 0% 10% WAG
T-Mobile of Wireless 33%
T-Mobile $ NA $0 $1.1
Advertising $224 $253 Morgan Stanley
Wireless Operator Penetration 0% 2.5% WAG
T-Mobile of Wireless 33%
T-Mobile $ NA $0 $2.1
Total Platorm Economics
for T-Mobile $7.2
The New T-Mobile is T-Mobile’s term for
the merged T-Mobile and Sprint entity.
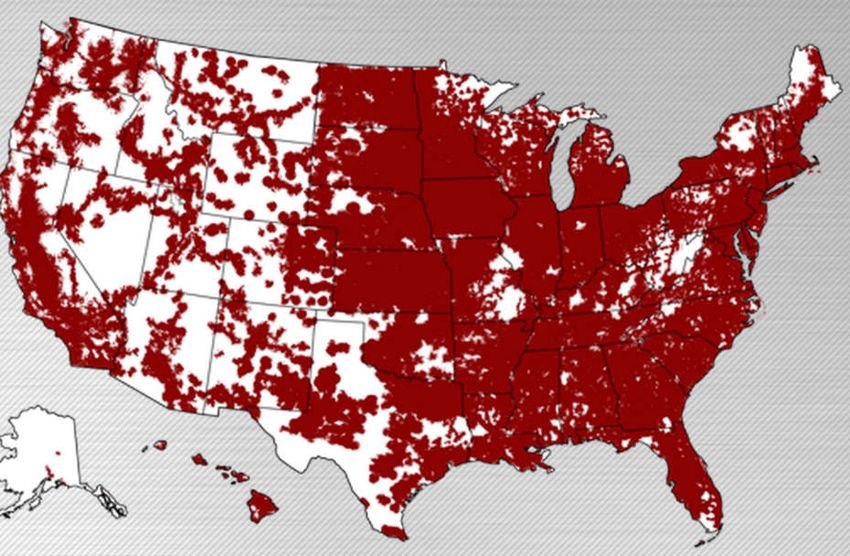
All rights reserved, Inflection Capital Management, LLC 36On May 20th the
The Regulators: T-Mobile + Sprint Helps Promote the FCC’s Goals FCC Chairman Ajit
Pai announced
The FCC’s four primary strategic goals are: that he supported
the merger
1) Closing the Digital Divide: Develop a regulatory environment to encourage the private sector to
build, maintain, and upgrade next-generations networks so that the benefits ….are available to
all Americans.
2) Promoting Innovation: Foster a competitive, dynamic...through policies that promote the
introduction of new technologies and services…and remove barriers to…investment.
3) Protecting Consumers & Public Safety
4) Reforming the FCC’s Processes
Approving the merger with conditions on rural service delivers on (1) and (2) expeditiously and
with a magnitude that would not happen otherwise.
How:
The merger would foster a deeper investment in rural and underserved markets both though the
existing commitments by T-Mobile management to do so and by making a requirement for approval.
The New T-Mobile is promising $15B in added network investment funding by merger synergies. An
investment that would not happen otherwise.
A more competitive 5G market between Verizon, AT&T, and the New T-Mobile would result in more
services (edge compute) and platforms than would exist otherwise. That in turn would foster the
introduction of new technologies and services and lower the entry costs for innovators to come
aboard these network platforms.
All rights reserved, Inflection Capital Management, LLC 37T-Mobile + Sprint Helps Resolve Acute Public Service Deficiencies
Proposed T-Mobile and Sprint merger intimately intertwined with 5G: The merger allows the companies a
5G network that is NATIONWIDE and ROBUST.
How:
Commingled spectrum assets allow for the national coverage and the capacity for 5G capacity & speeds.
$4B in savings from the network resulting from fewer antennas and lower payments for rents & carriage.
Sharing network allows capacity to be allocated to 5G while at the same time supporting LTE capacity.
The merger (Merger) facilitates faster and 5G deploy nationwide significantly earlier than AT&T and
Verizon. Merger raises the industry’s competitive intensity leading to better 5G networks and service.
How:
Sharing network allows capacity to be allocated to 5G while at the same time supporting LTE coverage.
$1B in savings from marketing and $1B from back office allows for more upfront investment in 5G network.
New T-Mobile is promising 96m people covered with 300 mbps service by 2021 vs. w/o merger. With
approval AT&T and Verizon would have to materially step up their investment pace to match.
As present, AT&T and Verizon have indicated no step-up in spend. New T-Mobile has promised $15B in
adding spending, to be funded by the merger synergies. An approval would change AT&T and Verizon’s
spending plans—more and faster.
Merger allows T-Mobile the credibility to argue that the merger will allow them to bring 240 Mbps speeds
to the underserved--the 50% of US HH that have only one broadband (BB) option and the 10% w/o any
BB; to narrow the Digital Divide.
5G is a material risk for further widening the gap. This is because without the merger, metro communities
will get 5G service and capacity first. Rural communities will be get the service last with less MEC and
backhaul investment and far after the 5G ecosystem is paying dividends to metro residents.
All rights reserved, Inflection Capital Management, LLC 38Current Digital Divide
Only 58% of lowest 20% in
HHs income are served
by incumbent wireline BB
Divide
84% of the highest 20% in
HHs income are served
by incumbent wireline BB
Only 53% of the 20% most
rural HHs are served by
incumbent wireline BB
Divide
92% of the 20% least rural
HHs income are served
by incumbent wireline BB
20m “Broadband” homes
are still service with Why? Cost to serve significantly higher, lower service take-up
copper DSL wires. because of lower incomes
In both circumstances the wireless industry has been a better
Source: FCC 2018 Broadband Deployment Report service provider than the wireline industry. 39T-Mobile’s June 2018 Public Interest Statement on Merger
40Public Interest Statement (PIS)
Speed & Capacity Enhancement
2021 & 2024
Merger vs. No-Merger
The area between the black line
and stand-alone lines represents
the improved public utility/value
of the merger to the nation
41Public Interest Statement (PIS): Speed & Capacity Enhancement
The take-way here is
Throughput is the quantity
that there is no of data transferred per unit
comparable of time
mechanism to
create this much
coverage, capacity
and social value. Its
just physics.
3X Capacity improvement calculation:
All rights reserved, Inflection Capital Management, LLC
Network Capacity = # of Cell Sites x Spectrum per Site x Spectral Efficiency
1 2 3
The New T-Mobile vs. T-Mobile & Sprint as stand-alones
1 79K T-Mobile sites + 11K Sprint sites vs. Separate
2 Urban High-band + 2.5 GHz + 600 MHz vs. Separate
3 More deployed to 5G is MORE spectrum vs. Spectrum shared to serve existing 4G
For sake of comparison, T-Mobile on its own without Sprint’s cell sites and spectrum would
need to have 162K sites in place to reach equivalent capacity. That is not likely to happen.
42Sprint Stand Alone Option: Best case scenario (now in doubt 12 months later)
~$5.5B in network cap ex/yr in ‘18-20 focused on densifying and optimizing metro and suburban areas and
deploying equipment to eventually launch 5G in its top markets. NO EXPANSION of coverage is contemplated.
Sprint invests in metro markets where it can win in QoS consumer affinity.
While Sprint’s 4G LTE network covers 302m POPS, only 133m are covered with 5G compatible spectrum and cell
sites. Sprint’s 5G plans only envision covering 150m POPs, with commercially competitive service less than that.
2.5 GHz
Because of Sprint’s limited geographic footprint, its more reliance on roaming arrangements, particularly in
rural areas that relegates these regions with low business economics and poor QoS means that Sprint will never
market to these populations.
Sprint intends to launch 5G on its 2.5 GHz spectrum and maintain its other networks on its 800 MHz and 1.9 GHz.
Sprint also states that its 5G network will have substantial coverage gaps within a covered area due to 2.5
limitations. The 800 MHz could resolve those, but its incumbered by 4G.
Sprint also does not have the financial capacity to green-field build in these regions. Consequently, it will not
use the attractive/highest speed 2.5 GHz spectrum in these regions.
43The New T-Mobile Option: Combine spectrum, cell networks, & split cells
1/2 mile
High-Band service radi
> 20 GHz
High penetration:
rain, leaves,
2.5 GHz windows, and walls
4 mile
service radi 600 MHz
18 mile
service radi
Low penetration:
windows and walls
High-Band
2.5 GHz
> 20 GHz
MHz = capacity/site 600 MHz
2.5 GHz is 4X more
capacity per cell site 2.5 GHz
vs. 600 MHz site.
More capacity is 600 MHz
needed per site as
population density rises
44T-Mobile + Sprint = More Network Investment The Companies’ Public Interest Statement
(PIS) states that because of the network’s
spectrum synergies and higher investment
~$6B/year in savings, Re-invested in Near-Term that more subscribers will have 5G than
otherwise.
We have pulled apart the companies’
statements and the PIS to analyze the level of
increased investment. This shows that New T-
Mobile intends to spend $15B, or 64% more
than the stand-alones during the next three
years.
There is no reason to believe that the level of
investment in ‘22 – ’24 would not be of a
similarly higher level. All total that’s $30B in
more investment.
Assuming that competition demands the
same from AT&T and Verizon, that’s $90B in
additional 5G network investments. That’s a
$90B better national 5G wireless network than
~$5B/year in increased 5G Network investment vs. stand-alones
the status quo.
billions 2019 2020 2021 Total
Assuming a 5X multiplier (WAG) of economic
Sprint
benefit from this investment, that’s $450B in
5G $3.6 $3.6 $3.6 $10.8 added economic growth than the status quo.
T-Mobile Moreover, we expect Sprint as a stand-alone
5G $4.3 $4.3 $4.3 $12.9 to actually retrench and lower its investment
from these stated targets as we detail
New T-Mobile subsequently.
5G $14.0 $12.0 $13.0 $39.0
We suspect that the FCC shares these views
Difference $6.1 $4.1 $5.1 $15.3 and that is why it supports the merger. It wants
more capital investment in the nation’s
communication networks, not less.
All rights reserved, Inflection Capital Management, LLC 45T-Mobile + Sprint = National Coverage
$15B in additional network investment (cell sites, density, etc.) over 3 years, or 60% more than what the stand
alone companies intend to spend, to be funded by network and back-office synergies.
This added investment, plus spectrum synergies will allow The New T-Mobile to have better indoor coverage than
the stand alone companies.
Also, in terms the network cost it is important to understand that while tower companies lease their space on their
towers, it’s the operators that need to provision for the power, backhaul, and cell sites. Leases are based upon
square inches of space. Power and backhaul have price breaks based upon volume. Less cost in one coverage
area for the New T-Mobile equates to more investment in coverage and capacity elsewhere.
While communities want coverage, nobody want’s the tower and cables in their backyard; thus, there is a
scarcity value to these assets and community efficiencies and environmental benefits.
Customer satisfaction = coverage & signal strength; Signal strength = strength + consistency of strength
46The New T-Mobile Coverage
4748
More 5G Coverage = More 5G Subscribers
The Companies’ PIS states that because of the network’s spectrum synergies and higher investment
that more subscribers will have 5G than otherwise.
The 10% lift is the result of more market share of subscribers (+5.2m) and higher 5G penetration. The only
way that The Companies can count on more market share is if the merger allows them to offer more
consumer value than otherwise, which is consistent with management’s public statements.
49On May 20th the FCC
Regulatory Considerations: DOJ Chairman Ajit Pai announced
that he supported the merger
The DOJ will be concerned about the merger’s impact on competition and the associated impact on overall
wireless service coverage & quality and consumer prices.
Perspective:
The White House is rumored to be in favor of the merger.
The DOJ has stated that it has no pre-conceived views about three vs. four competitors.
U.S. Attorney General Bar has recused himself from the Justice Department's deliberations.
Assistant Attorney General of the Antitrust Division Makan Delrahim, the White House’s appointed
Division leader, has said that he has no pre-conceived opinions on the merger. However, he is known to
want structural remedies, not behavioral remedies, for granting approval (i.e. selling the pre-paid
business vs. promises to not raise prices.)
The DOJ staff has been rumored to be against the merger from the start on the belief that they
prevented AT&T from acquiring T-Mobile in ‘12 and that lead to substantial price competition and
consumer benefits. DOJ staff are also rumored to hold a conventional, or strict view of how the market
is to be defined.
All rights reserved, Inflection Capital Management, LLC 50Regulatory Considerations: DOJ
Competitive intensity is typically measure by the HHI index. Industries with HHI’s above 2500 are characterized
as “relatively” concentrated. Mergers that increase an industry’s HHI by over 200 pts are expected to attract
more regulatory scrutiny and objection.
Perspective:
The wireless industry when conventionally defined has an HHI of 2615. The merger as introduced would increase the
index by nearly 500 pts to 3104 and into the range characterized as “highly concentrated.”
HHI for Market as Conventionally Defined
Wireless Connections
(million) YE-2021 Mkt Sh ^ 2 YE-2021 Mkt Sh ^ 2
AT&T 150.3 33.5% 1119 150.3 33.5% 1119
Verizon (incl. 15.6m MVNO) 137.7 30.7% 940 137.7 30.7% 940
T-Mobile 89.7 20.0% 399 144.7 32.2% 1038
Sprint 55.0 12.2% 150 0.0 0.0% 0
US Wireless 5.2 1.2% 1 5.2 1.2% 1
Other 11.3 2.5% 6 11.3 2.5% 6
Total 449.2 100.0% 2615 449.2 100.0% 3104
Change 489
Source: Fact Set 11.1.18 & FCC compet it ion report (397m connect ions + 2.5% annual growt h)
All rights reserved, Inflection Capital Management, LLC 51DOJ HHI Index Calculations
Should The Companies say they are willing to spin their pre-paid business, then the HHI is nearly
undisturbed by the merger. This will be The Companies’ regulatory path.
The May 20th FCC leaderships’ support for the merge is conditional upon The Companies divesting the Sprint pre-
paid business. We suspect that this was The Companies initial offer and that they will eventually spin the entire pre-
paid business to meet the DOJ part way.
HHI Index for SpinCo of the Prepaid Business
Phone Connections
(million) YE-2021 Mkt Sh ^ 2 YE-2021 Mkt Sh ^ 2
AT&T 79.4 23.9% 571 79.4 24.6% 606
Verizon 94.1 28.3% 803 94.1 29.2% 852
T-Mobile (ICM) 75.4 22.7% 515 71.7 22.2% 494
Sprint (ICM) 36.0 10.8% 117 0.0% 0
TracFone 23.0 6.9% 48 23.0 7.1% 51
Other MVNO 13.0 3.9% 15 13.0 4.0% 16
Pre-Paid Spin-Co 30.0 9.3% 87
US Wireless 5.2 1.6% 2 5.2 1.6% 3
CMCSA (MS est.) 5.0 1.5% 2 5.0 1.5% 2
CHTR (GS est.) 1.1 0.3% 0 1.1 0.3% 0
Total 332.2 100.0% 2075 322.5 100.0% 2111
Change 36
All rights reserved, Inflection Capital Management, LLC 52Regulatory Considerations Continued
The DOJ will be concerned about the consolidation’s impact on competition and the associated impact on
overall wireless service coverage & quality and consumer prices.
Perspective:
The Public Interest Statement addresses service coverage and quality and these shouldn’t be objections.
That leaves “price.” The Companies argue that The New T-Mobile has significant economic incentive to
lower prices to fill its substantial increase in capacity by taking substantial market share. Moreover, the
companies argue that Sprint is an ineffective competitor and that its business is fragile and not durable in
the longer-term. As such, the Companies imply that the current four competitor situation is not sustainable
and that it will not be a longer-term governor of prices. Moreover, T-Mobile points to its long-term practices
of un-carrier moves and its disruption on industry prices. It argues that should it act otherwise that it would
severally damage its brand and consumer trust.
We think that the capacity argument lacks historical precedent and is such, it is unlikely to not be an
effective argument for approval.
We believe that the DOJ is unlikely to be swayed by the Sprint fragility argument because that would require
taking a speculative view, something that the DOJ is unlikely to do.
This is unfortunate because even if Sprint were to re-capitalize, it would not have the assets to sustainably
grow profits. In addition, Sprint has had negative free-cash-flow for the past five years and there is no
discernable improvement recently. Moreover, the industry’s capital intensity is rising, not falling. Therefore,
there is no logical argument to be made that Sprint stand-alone will have any influence on industry pricing
for most consumers in the medium- to long-term.
Sprint can concentrate its resources (which it says it will do), but that will result in the only selective benefits of
4-player competition. Those selected benefits will be more affluent- and metro-markets. That’s sad.
All rights reserved, Inflection Capital Management, LLC 53Wireless Prices
What is the price for wireless service?”
Perspective:
It is not CPI, because the consumer expects “unlimited” data, or units of consumption. CPI is more of a measure of
the increased value that consumers are receiving. ARPU (average revenue per user) is likely the better measure
because that is what the consumer experiences and budgets monthly.
T-Mobile’s ARPU trend is distinctly downward (as it is for the other carriers) despite better coverage, speed, app
services, and more data consumption. This is what being the Un-carrier was all about.
The industry has experienced improved consumer sentiment (seen on the next slide) as the consumer has noticed
that it is getting “more for less.” This improved sentiment has also coincided with an industry-wide decline in churn
rates, declining customer acquisition costs, and handset subsidy costs, all of which have other economic benefits.
The wireless industry’s improvement contrasts to the downward trend exhibited for the ISPs and paid-TV industries.
This deviation in consumer sentiment is what opens the opportunity for the wireless industry to encroach upon these
two adjacent markets. Given network and scale economics, there is more long-term value creation if a wireless
operator can make $5/mo in gross profits being the primary broadband provider and $5/mo being the paid-TV
provider, than raising wireless prices by $10. Serving these adjacencies require little in added customer care,
marketing, or billing costs, but there is a substantial benefit of lower wireless churn.
T-Mobile ARPU ‘10 to ‘18 down despite more data usage US Wireless CPI -3.2%/year per Census Bureau
54Consumer Satisfaction: Wireless up, Wireline down
55T-Mobile and Price
If T-Mobile were to raise price, not consistently increase the consumer value, and not act as a disrupter,
it would severally damage its brand and consumer trust.
Perspective:
This consideration is the strongest argument for why the New T-Mobile will continue to be disruptor and
competitive deterrent to higher prices. (From press reports we know that DOJ staff are not giving weight to
this argument. However, we suspect that the Administration and Delrehim may be swayed.)
Examples of strong brands that lost their customers’ trust include Samsung, eBay, and Chipotle, from which
they never recovered their prior mojo. Consumer trust is now one of the most tenuous but powerful assets as
Airbnb, Netflix, Costco, and Amazon have demonstrated. High trust is what allows companies to cross sell
more services and why customers remain loyal. Given the wireless industry’s high customer acquisition cost,
churn is the significant metric for customer LTV and an operator’s terminal value. As such, it would be self-
detrimental and value destructive for The New T-Mobile to do anything that detracted from consumer trust
and that increased churn.
T-Mobile has built a brand and business model based upon giving the consumer more flexibility and value.
Should T-Mobile invert and give the customer less value (via price vs. service) by soft-following Verizon and
AT&T package prices higher, the consumer would know and revolt. This behavior can be tested in consumer
surveys and academic research show that price elasticity in wireless service exceeds -0.5 and the value-tier
exceeds -1.0. Prices rise and churn increases. Prices remain stable and churn falls. The industry’s opportunity
for revenue growth is to sell more volume, not to sell for more price.
Unfortunately, T-Mobile has damaged this argument recently by “promising to not raise prices for three
years” if the deal were to be approved. T-Mobile should have made the argument that consumers would
not allow them to raise prices and provided the evidence. By declaring that it “promised to not…” suggests
that it would be possible for them to do so.
T-Mobile will not raise prices
T-Mobile will not raise prices
T-Mobile will not raise prices
T-Mobile will not raise prices
All rights reserved, Inflection Capital Management, LLC 56Sprint Stand-alone: Looks Bad, but not catastrophic
The following estimates for Sprint are as a stand-alone where they pull back from the national markets to concentrate
their 5G investment in affluent- and metro-markets. At that point, they begin to loose significant subscriber share.
We do not envision positive free-cash-flow (FCF) during this time horizon due to Sprint’s scope and capital limitations.
That said, our FCF estimates are rough given that cap-ex is a large component and we have no insight as to their
plans under more stressed conditions will be. Management’s current statement is $5-6B/yr through 2020.
Sprint may have spectrum or other asset to divest (Boost) that could help lower its debt levels.
subs in thousands, dollars in millions 2016 2017 2018 2019E 2020E 2021E 2022E 2023E
Postpaid Subs 31,694 31,942 32,605 30,722 26,879 21,902 18,327 17,689
Postpaid PhoneChurn 1.5% 1.6% 1.7% 1.7% 1.9% 2.2% 2.1% 2.0%
Wireless Service Revenue 24,218 22,736 21,980 22,131 20,575 18,027 15,478 14,328
(-) Cost of Service (7,148) (5,748) (5,735) (5,710) (5,341) (4,993) (4,609) (4,551)
(-) SG&A (7,665) (7,779) (7,285) (6,876) (6,270) (5,470) (4,714) (4,344)
All rights reserved, Inflection Capital Management, LLC
(+/-) Other (518) (342) (606) (400) (300) (200) (100) 0
10% of industry 5G economics 68 233 636 1,169
Cash EBITDA from Wireless Services 8,887 8,867 8,354 9,145 8,731 7,597 6,691 6,601
% of Wireless Service Revenue 36.7% 39.0% 38.0% 41.3% 42.4% 42.1% 43.2% 46.1%
Net Cash Flow from Equipment Sales and Leasing (4,931) (5,011) (2,299) (1,043) (912) (743) (622) (600)
% Grow th -5.2% 1.6% -54.1% -54.6% -12.5% -18.5% -16.3% -3.5%
Cash EBITDA from Wireless Services 8,887 8,867 8,354 9,145 8,731 7,597 6,691 6,601
Net Cash Flow from Equipment Sales and Leasing (4,931) (5,011) (2,299) (1,043) (912) (743) (622) (600)
Net Cash Flow from Wireless Operations 3,956 3,856 6,055 8,102 7,819 6,854 6,069 6,001
(-) Net Interest Expense (2,395) (2,385) (2,471) (2,599) (2,663) (2,620) (2,588) (2,565)
(-) Cash Taxes, Net of Refunds 0 0 0 0 0 0 0 0
(+/-) Other 1,671 2,863 200 0 0 0 0 0
Cash Operating Income 3,342 4,293 3,658 5,432 5,092 4,176 3,426 3,383
(-) Cash Capex on Network (2,212) (3,157) (4,762) (6,020) (5,300) (4,500) (4,250) (4,000)
Adjusted Free Cash Flow 1,130 1,136 (1,104) (588) (208) (324) (824) (617)
Cash $6,868 $6,280 $6,072 $5,748 $4,924 $4,307.11
Debt $39,884 $39,884 $39,884 $39,884 $39,884 $39,884
Net Debt $33,016 $33,604 $33,812 $34,136 $34,960 $35,577
Net Debt / EBITDA 4.0x 3.7x 3.9x 4.5x 5.2x 5.4x
57Regulatory Considerations: The States
The Companies have secured all of the necessary state PUC approvals, save California and New York. California is
suspected of leaning towards approval. New York is rumored to be looking for “benefits.”
State AG’s could sue to oppose the merger both on state and federal levels; however, to appose the DOJ would
be unusual. Clearly these are unusual and highly political times. New York and California AGs have particularly
been outspoken. Alabama, Massachusetts, Mississippi, and five others states also say that they are still reviewing.
For a state AG to contradict the DOJ it generally requires that there be state specific concern that the DOJ failed
to address. That bar seems to set a high threshold for state AGs in this circumstance. Jobs and network coverage
gaps would be two likely focal points of these AG. Interestingly, The Companies have that they are going to create
five new customer service centers post merger. Two locations are New York and Kansas, the other three are to be
named.
All rights reserved, Inflection Capital Management, LLC 58Regulatory Considerations: The Pre-paid Market
The DOJ and FCC will be concerned about the merger’s impact on the pre-paid market which serves low-
income HHs. In the prior slide we show how a spin of The Companies’ pre-paid business (Spin-Co) would
favorably impact the HHI such that the resulting industry structure has no increase in the HHI.
Should there by no increase in the HHI, can there be any regulatory opposition to the deal? We suspect not.
However, regulators would be concerned in this scenario about the financial robustness in Spin-Co and its
ability to bring 5G to lower-income HHs. Given the scale economics of the network business, there may be a
quid pro quo available to The Companies and regulators in the form of service agreement between the
Companies and Spin-Co with The Companies being a wholesaler to Spin-Co. The price of the service for Spin-
Co would be set at a level that allows The Companies to only recover their cost of capital.
Spin-Co would take the Metro brand and retail locations. Effectively this would be a reverse of the 2012 Metro
PCS merger. Additionally, Spin-Cp would be responsible for the network equipment in some of its service areas
with The Companies providing the spectrum, the technical expertise, and the nationwide network. This would
make the consistency of coverage Spin-Co’s responsibility and relieve the regulators of enforcing any
behavioral remedies.
The remaining concern for regulators would be the financial strength of Spin-Co and its ability to properly
serve the pre-paid market in the long-term. As a condition of the merger, Spin-Co would have no debt and
sufficient cash to invest in its service areas network, and equivalent terms to The Companies’ network for
national coverage (i.e. Spin-Co customers receive the same speed and coverage as The Companies’
customers).
All rights reserved, Inflection Capital Management, LLC 59You can also read