Public bus transport service satisfaction: Understanding its value to urban passengers towards improved uptake
←
→
Page content transcription
If your browser does not render page correctly, please read the page content below
Transactions on Transport Sciences
                                                                                                   Peer-Reviewed Open Access Journal
                                                                                                           Vol. 1/2021 DOI: 10.5507/tots.2021.002
                                                                                                                 journal homepage: www.tots.upol.cz

Public bus transport service satisfaction: Understanding its
value to urban passengers towards improved uptake
UMAIR HASAN a,c* , ANDREW WHYTE a, HAMAD AL JASSMI b,c

a. School of Civil and Mechanical Engineering, Curtin University, Perth, WA, 6845, Australia
b. Department of Civil and Environmental Engineering, United Arab Emirates University, Al Ain, United Arab Emirates
c. Roadway, Transportation and Traffic Safety Research Center (RTTSRC), United Arab Emirates University, Al Ain, United
Arab Emirates

KEYWORDS: public transport; traffic; travel perception/satisfaction/          tributes as antecedents of bus service’s perceived value for money (VfM)
bias; mode use; quality attributes                                            and satisfaction from level of service (LoS) and mode choice (car vs. bus)
                                                                              as the ultimate consequence. Findings revealed that any previous biased
ABSTRACT: To accurately direct investments towards sustainable transit,       opinions of travellers adversely affected satisfaction and perceived value,
current transport status and factors driving passengers towards pri-          while quality attributes had a positive effect. Mode use was influenced by
vate cars instead of public transport (PT) should be identified first. Past   satisfaction from LoS (frequency of buses and network coverage), which
research advocated improvements in PT to shift mode-usage but has             was a positive consequence of perceived VfM (quality of ride and level
yet to model the different causal effects that direct bus users to cars in    of fare trade-off). Journey time and bus-stop waiting area quality also
rapidly developing yet congested areas. On-board questionnaire survey         positively influenced satisfaction from fare level while passenger socio-
data from intra-city Abu Dhabi bus passengers (n = 1520, variables = 31)      demographic distribution showed that most respondents travelled more
over a month were gathered in this study during both weekends and             than five times a week by bus and were full-time workers and transport
weekdays. The study modelled existing bias of travellers and quality at-      agencies may target service improvements around office-hours.

1. INTRODUCTION 1                                                             that provides some value for money (VfM), are modelled in
                                                                              this study against mode choices. Past research shows that
Individual travel mode use over time affects personal well-                   public transit (e.g., bus) mitigate public reliance on private
being of travellers and sustainability performance of roads                   vehicles. However, the mode choices of passengers are in-
(Hasan, Whyte, & Al Jassmi, 2019), particularly in case of                    creasingly becoming more complex as their understanding of
overreliance on cars. Cities around the world and specifi-                    ride quality, network coverage, and service affordability, etc.,
cally in developing countries heavily rely on public bus ser-                 is changing (Hasan, Whyte, & Al Jassmi, 2020). These factors
vices to decrease public dependence on private automobile                     constrain passenger willingness to choose PT over private
usage. Transport agencies constantly develop strategies to                    vehicles as it increases traveller likeness (dell’Olio, Ibeas,
maintain public transit as a more sustainable (Kwan, Sutan,                   & Cecin, 2011) towards private cars and prejudice against
& Hashim, 2018) service. These strategies include increasing                  public transit (hereby referred to as travel bias).
service frequency and accessibility (Renne, Hamidi, & Ewing,                      Mugion et al. (2018) modelled PT quality attributes of jour-
2016), reducing journey time on buses and priority lanes                      ney time, on-board crowding and accessibility as predictors
(Wu & Pojani, 2016), discounting bus fares, improving bus-                    of passenger satisfaction. Other researchers (Chaloux, Bois-
stop quality. These imperatives are often based on sound                      joly, Grisé, El-Geneidy, & Levinson, 2019; Echaniz, dell’Olio,
transportation research such as theory of planned behaviour,                  & Ibeas, 2018) tested hypotheses based on transit theories
degree of circuity, attitude theory and consumer behaviour                    that travel bias affect perceived quality and satisfaction level
theories. These studies and initiatives provide viable initial                from PT. Abou-Zeid and Fujii (2016) noted that passengers
steps, however the causal effect of these attributes towards                  favoured private cars over PT if they perceive the latter fails to
passengers’ perception of public transport (PT) service and                   meet their expectations and as such, satisfaction from LoS can
their mode choices, remains uncertain. Furthermore, there                     be conceptualised as a composite variable inclusive of both
has been little research on prioritising policy decisions sensi-              factors. Although these studies have identified the impact of
tive to practical issues.                                                     perceived quality and travel bias on passenger satisfaction
   This paper provides a model for analysing transit data,                    and perception, there are some gaps in transport research.
collected for indicating the underlying roles played by these                 The concept of a transport service’s value to passengers has
factors towards mode use. This study analyses passenger                       been studied in travel behaviour research (Hasan, Whyte,
behaviour along the same lines by attempting to investigate                   & Al Jassmi, 2018a). Yet, there is little empirical research as
the relation between their satisfaction from level of service                 to what these service consumers perceive as “value” and how
and the subsequent mode use. The effects of user satisfac-                    it may influence their overall satisfaction. Moreover, many
tion from PT level of service (LoS) and its status as a product               antecedents of mode choice and satisfaction are given in the
                                                                              literature, e.g., journey time (Chaloux et al., 2019), network
                                                                              coverage (Fu, Zhang, & Chan, 2018), ride quality (Sam, Ha-
* Corresponding author. Email: umair.hasan@uaeu.ac.ae                         midu, & Daniels, 2018), fare level (Kamaruddin, Osman, & Pei,

25                                                                                                  Transactions on Transport Sciences | Vol. 1/2021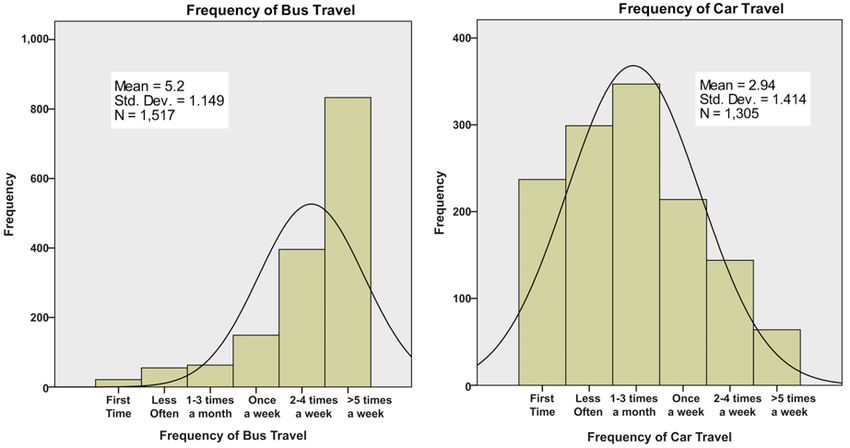
2017), bus-stop distribution and service frequency (Echaniz       Ye (2017) incorporated theory of planned behaviour (TPB) to
et al., 2018). But these are usually individually analysed in     predict passengers’ intention to reduce private vehicle usage.
travel research and relationships between these variables are     Their results showed that passenger biases, habits, behav-
not investigated using concise models.                            ioural characteristics, and perception affected mode choice of
    This paper contributes to the literature by developing        passengers. Another study by Yuda Bakti et al. (2020) evalu-
a model that can identify the important variables (from travel    ated passengers’ perception of PT service as value for money.
data) influencing the satisfaction level and mode choice of       They explored passengers’ willingness to recommend PT as
travellers for any studied location. Once the exact effect of     a measure of passengers’ perception of the service by com-
important variables is validated, optimisation (and in-depth      bining personal norm, customer satisfaction and planner
analysis) can then be performed in the subsequent stage           behaviour theories. Their results also found that passenger
(transit project proposal evaluation studies) towards PT up-      biases and behavioural characteristics affected passengers’
take. The goal is to test assorted hypotheses from transport      perception of PT.
research (based on transit theories) that passenger biases,          Shen, Xiao, and Wang (2016) analysed satisfaction from
perceived service quality and value affect satisfaction level,    LoS as a function of quality perceived by the passengers and
which then affects mode choices. Travel survey data from          their expectations and travel biases towards different travel
a case study region (Abu Dhabi city) is utilised to indicate      modes. Echaniz et al. (2018) point out that even though pas-
the roles played by passenger satisfaction and perceived (bus     senger satisfaction is a dependent variable (affected by afore-
service) value towards PT usage. Since, such users are already    mentioned variables), it can be used to predict passengers’
familiar with the LoS, reliability and routes, they may provide   mode choice pattern. Kroesen, Handy, and Chorus (2017)
more informed responses (Mouwen, 2015).                           suggested that improved ride quality, low level of fares and
    The remainder of this paper is organised as follows. Lit-     better service on part of the policymakers may entice more
erature review discusses the theoretical background and           travellers towards PT. It should be noted at this stage that
gaps in existing research. Research hypotheses based on           improving ride quality does not necessarily imply oversupply
mode choice, satisfaction, quality and passenger perception       of service (Abenoza, Cats, & Susilo, 2017; Friman & Felles-
literature are then presented. Next, case study area, travel      son, 2009), rather implies that travellers are perhaps seeking
survey data collection and analysis technique are discussed.      value for money in the service for customer attraction and
Structural equation modelling (SEM) is used in this study         client retention.
for testing the hypotheses because of the following reasons.         Heinen and Chatterjee (2015) propose that passenger psy-
It is largely advocated in transport literature (Hadiuzzman,      chologies due to age, social status, access to car and PT, etc.,
Das, Hasnat, Hossain, & Rafee Musabbir, 2017) to model            somewhat limits mode choice by influencing their satisfac-
the relation between passenger psychologies, satisfaction,        tion from the service. These passenger psychological varia-
mode choices and transport quality attributes. Additionally,      bles are essentially a three-dimensional problem; spatial (e.g.,
transport literature (van Lierop & El-Geneidy, 2016) shows        journey purpose and accessibility), structural (e.g., financial
passenger biases, satisfaction, service perception and mode       and work commitments) and socio-demographic constraints
choices to have complex relationships where these variables       (e.g., age, gender, and social status). It can be summarised
affect each other. SEM allows modelling of any variable as        that this three-dimensional travel bias of passengers towards
both dependent and independent variable (Guirao, García-          transit mode influence satisfaction from the LoS. Research
Pastor, & López-Lambas, 2016) unlike other approaches (e.g.,      into passengers’ travel bias showed that quality attributes
multiple-regression, multinomial models, bivariate correla-       (journey and waiting time, distance to bus-stop and travel
tions, etc.), like the real-world relationships between these     comfort, etc.,) significantly influence passenger perception.
variables.                                                        Guirao et al. (2016) proposed that the socio-demographic
                                                                  constraints of travellers also affect their respective rankings
2. LITERATURE REVIEW                                              of quality attributes. Lavery, Páez, and Kanaroglou (2013)
                                                                  found that respondents expressed PT of higher value provided
Increased dependence on private vehicle usage produces con-       journey time is optimised. Shen et al. (2016) found passen-
gestion on intra-city roadways. Cities around the world and       gers’ perceived VfM of service is positively affected by their
specifically in developing countries heavily rely on public bus   ranking of service quality attributes. These studies imply that
services to decrease public dependence on private automobile      the bias held by passengers affects their perceived ranking of
usage (Hasan et al., 2018a). a shift from PT to private cars is   quality attributes while both factors influence the perceived
a common issue as the purchase of cars becomes more afford-       VfM of the transport service. Two studies (Abou-Zeid & Fujii,
able due to low production costs and competitive car financ-      2016; Mugion et al., 2018) found that the satisfaction level of
ing schemes, which renders private cars more accessible. The      passengers from PT indirectly stems from their perception of
attitude of people towards transportation systems is also         the transit service quality.
increasingly becoming more complex as their understand-              Moreover, most of these studies found quality attributes
ing of ride quality, network coverage, and fare level, journey    of journey time and ease of travel as the most significant
purpose, travel duration and service frequency is changing        indicators of satisfaction from LoS followed by distribution
(Renne et al., 2016).                                             and quality of bus-stops, cost, and on-board crowding and
   For the PT operating agencies to gain a competitive ad-        seating. Kamaruddin et al. (2017) found passenger satisfac-
vantage over private automobiles, transportation decision-        tion as an antecedent of mode use choices. They further sug-
makers need to understand the attributes valued most by           gested the importance of improved ride quality, low level of
passengers so that their attention can be focused on those        fares and better service towards improved PT uptake. How-
critical attributes. Transport researchers (Hadiuzzman et al.,    ever, Lovelock and Wirtz (2016) describe the perceived VfM
2017) are now focusing on establishing the relationship be-       as some sort of a middle ground between perceived cost and
tween passenger characteristics and biases, service afford-       benefits. Interestingly, few studies in transportation litera-
ability, perceived quality and satisfaction level. Kamaruddin     ture (e.g., Shen et al. (2016)) empirically investigated this
et al. (2017) used structural equation modelling (SEM) and        relationship. It should be noted that improving ride qual-
descriptive statistics to show passenger loyalty and satisfac-    ity does not necessarily imply oversupply of service, rather
tion levels as the attributes that cause them to prefer a par-    implies that travellers are perhaps seeking value for their
ticular mode of transport. Liu, Sheng, Mundorf, Redding, and      money. The current study models perceived VfM as a trade-off

26                                                                                  Transactions on Transport Sciences | Vol. 1/2021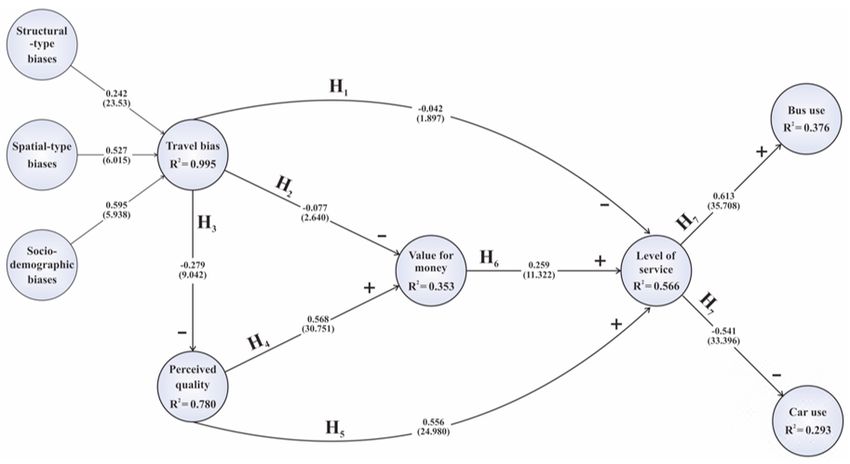
between ride quality satisfaction and level of fare to study the below are thus formulated. These hypotheses are based on
effect on the satisfaction from LoS. An early qualitative study the travel theories in the above transit literature, such as util-
(Beirão & Cabral, 2007) found that mode choice is affected by ity/value-based theory (De Vos, Mokhtarian, Schwanen, Van
exogenous variables of latent “satisfaction from LoS” variable: Acker, & Witlox, 2016), customer attitude theories (Abenoza
quality attributes, traveller bias and user characteristics. van et al., 2017), expectation-confirmation (Fu et al., 2018) and
Lierop and El-Geneidy (2016) used SEM to find that passenger planned-behaviour theory (Skarin et al., 2019).
satisfaction from PT is positively related to its preference as
travel mode by Canadian passengers. This further implies H1: Passenger satisfaction from LoS is influenced by travel
the role of affective elements (Abenoza et al., 2017; Guirao bias of passengers.
et al., 2016) such as level of fare, journey time and purpose, H2: Passengers’ perceived VfM of the bus service is related to
network coverage and service frequency, etc., in determining their travel bias.
the mode choice of transit users. H3: Travel bias of passengers affects their ranking of quality
The transit studies reviewed above acknowledge that trave attributes.
bias, perceived quality and value of PT services affect the H4: Passengers’ ranking of quality attributes positively affects
satisfaction level and mode choices, with less emphasis on perceived VfM of service.
the interlinked relationship between all variables. Transit H5: Relative ranking of quality attributes is indicative of pas-
research still lacks a general research model capable of un- senger satisfaction from LoS.
derstanding interconnection between several variables of H6: Passenger perceived VfM has a positive effect on their
service quality, value and satisfaction that promote mode satisfaction from LoS.
choices towards PT uptake. The real-world complex relation- H7: Passengers’ satisfaction from LoS positively affects their
ships between these travel survey variables are both depend- choice to travel by bus and negatively influences their car usage.
ent and independent, and research model and hypotheses
should be aimed to fill the literature gap by modelling this 4. METHOD
relationship.
4.1 Travel survey location, procedure and sampling
3. PROPOSED RESEARCH MODEL AND HYPOTHESES Traditionally, data regarding travel patterns is collected
through travel surveys (Guirao et al., 2016). They are broadly
Based on the above literature, the research model proposed categorised into household and self-administered surveys,
by this study (Figure 1) explores the interlink between travel where the latter category is usually considered to remove
bias, perceived quality, VfM, satisfaction from LoS and mode most of the systematic bias (Taylor, Young, Wigan, & Ogden,
choice variables; to understand the critical variables that 1992). The current analysis is based upon a travel dataset
can promote PT use. This research model argues that if pas- of intra-city bus passengers in the Emirate of Abu Dhabi,
sengers are treated as consumers and public transit systems United Arab Emirates (UAE). Having witnessed a period of
(e.g., a bus service) as a marketable product, understanding rapid growth following the oil-exploration era in the Middle
their motivations may help increase “sale” of the supplied East, it is quite similar to cities like Riyadh, Dubai, Kuwait
“product”. To that end, passenger behaviour is analysed by City, etc., (Currie & De Gruyter, 2018; Mezghani, 2006), with
developing a multipartite model. The effects of user satisfac- a predominant reliance on private vehicles instead of PT.
tion from PT LoS and its status as a product that provides Qamhaieh and Chakravarty (2020) note that Abu Dhabi
some value for passenger money, are modelled as antecedents contains 359 private vehicles for every 1000 residents com-
of car vs. bus mode use in this study. Moreover, the mani- pared to 68, 144, 101, 213 and 305 private vehicles per 1000
fest variables of these exogenous latent variables “VfM” and residents in cities like Mumbai, Shanghai, Singapore, London,
“LoS” are also established. The seven research hypotheses and New York, respectively. International transport policy
Figure 1. Proposed structural equation model based on the research hypotheses.
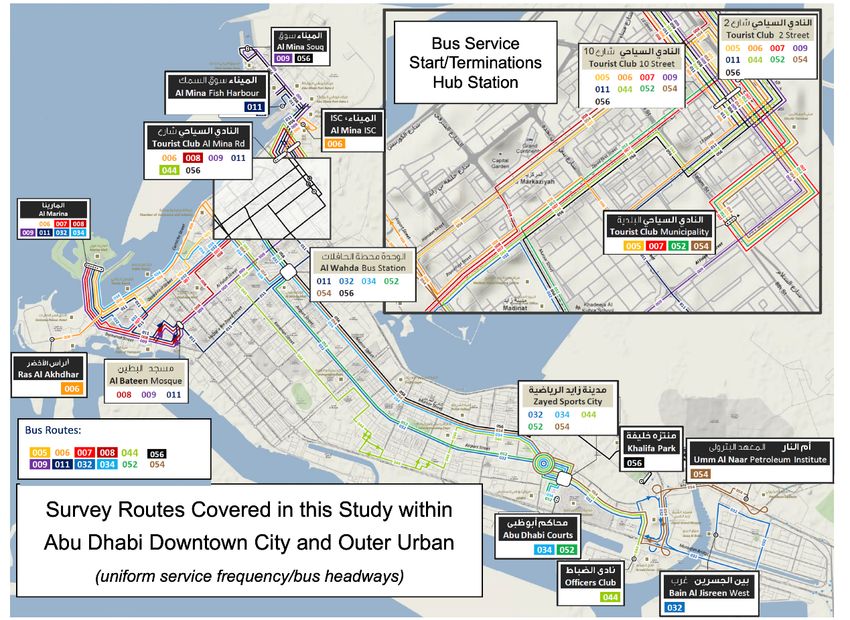
27 Transactions on Transport Sciences | Vol. 1/2021experts have noted that “there is very little urban space and ing private cars. In comparison, 70% of peak-hour trips in service for pedestrians within the Abu Dhabi CBD when com- other similar metropolitans such as Singapore are made by PT pared with European cities, be it for the climate, societal or (DoT Abu Dhabi, 2009). This is despite the extension of paid cultural reasons” (DoT Abu Dhabi, 2009). The local population parking zones (up to $1.5/hour, planned to be further hiked in Abu Dhabi and rest of the UAE have traditionally associ- to $3/hour) in downtown area and removal of free parking in ated car ownership with modernity, social status and eco- these locations. The PT fares have been fixed at a discounted nomic prosperity since the rapid modernization that began rate of $1 per trip and the DoT Abu Dhabi is planning to fur- in 1970s. On the other hand, Buehler, Pucher, Gerike, and ther cut PT fares to either free or as low as $0.5 for the short- Götschi (2017) noted that the annual average car ownership distance trips around downtown areas. These PT fare levels growth rate in Europe and other OECD countries has been are significantly lower than those in other metropolitans from continuously declining since 1970, falling to the lowest in developed countries, such as up to $2.5 (for a non-concession 2010s at 0.9% from 3.9% for 1970 – 1980. daily trip ticket) in Sydney (Transport for NSW, 2021); and Similarly, Qamhaieh and Chakravarty (2020) noted that $1.88 – to $2.48 per trip in Singapore (SBS Transit Ltd., 2019). although the socio-demographic, income level and cultural Thus, instead of arbitrarily adding more bus lines, reducing divisions in the society are visible in globalizing cities (such fares, or adding more bus-stations along the routes; this pa- as Sydney, London, Paris, and New York), they are more ap- per suggests that passenger mode choice, satisfaction and parent in the UAE due to large presence of expatriates. Na- perception of travel service quality may be studied to advise tionals represent only 15% of Abu Dhabi’s population, while local authorities in creating dedicated transport policies in expatriates (South Asians, East Asians, other Middle Eastern- favour of PT usage. Several meetings were held with the Abu ers and Westerners) making up the majority (SCAD, 2014). Dhabi Department of Transport to gain a detailed understand- These expatriates are employed in many industries, ranging ing of the city and its passenger demographics. from modestly paid labourers to professional class individu- Travel data was collected through on-board surveys as the als. Many of these expatriates are already accustomed to study focuses on identifying factors that may discourage their wide-spread public transportation usage in their countries, bus travel patterns and may be improved to cause public bus thus other factors such as infrequent PT services, unreliable transport uptake. a survey questionnaire (Table 1) was de- schedules, low network coverage, and overcrowded PT may signed for soliciting travel information of existing bus users be responsible for the strong car culture in Abu Dhabi and and their perception of the existing bus network, demograph- rest of the UAE (Hasan, Whyte, & Al Jassmi, 2018b). Ala- ic profile of the service users and their respective attitude wadi and Benkraouda (2017) note that the cities in the UAE towards travelling attributes: network coverage, quality and are designed as North American style suburban spaces with satisfaction, level of fare and potential improvement strate- a notable resistance against dense urban residencies. This dif- gies that may improve their bus ridership. The questionnaire ferentiates Abu Dhabi and other cities in UAE and other Gulf was limited to 11 multiple-choice questions and 31 variables Cooperation Council countries (Saudi Arabia, Oman, Qatar, designed to take less than five minutes time. Kuwait, etc.) from their European counterparts where urban The surveyed routes consisted of both outer urban and sprawl is dominant (Rahman et al., 2017; Dong et al., 2019). downtown city routes (Figure 2). Teams designated by Abu Another contributing factor could be the high temperature Dhabi Department of Transport were used to gather pas- in Abu Dhabi that can reach above 45°C, hindering PT use senger travel behaviour and psychometric data for the pas- (Qamhaieh & Chakravarty, 2020). sengers that travel along the pre-existing bus travel routes Past research (Hasan et al., 2018b, 2019) highlights that illustrated by coloured lines in Figure 2. The mode use and approximately 60% of trips in Abu Dhabi are performed us- travel bias (structural-type, spatial-type and socio-demo- Figure 2. Surveyed outer urban and downtown bus routes (based on plans from Abu Dhabi DoT). 28 Transactions on Transport Sciences | Vol. 1/2021
29
                                                   No.    Questions                                                                                              Responses (Please circle as appropriate)

                                                   MU     Mode use variables

                                                   MU1    How often do you travel by bus?                   1. First time          2. Less often      3. 1–3 times/month       4. Once a week       5. 2–4 times/week    6. Over 5 times/week   7. Never

                                                   MU2    How often do you travel by private car or taxi?   1. First time          2. Less often      3. 1–3 times/month       4. Once a week       5. 2–4 times/week    6. Over 5 times/week   7. Never

                                                   LoS    Level of service variables

                                                   LoS1   How satisfied are you with the current            1. Very dissatisfied   2. Dissatisfied    3. Neutral               4. Satisfied         5. Very satisfied
                                                          frequency of buses on this route?

                                                   LoS2   How satisfied are you with the current level      1. Very dissatisfied   2. Dissatisfied    3. Neutral               4. Satisfied         5. Very satisfied
                                                          of network coverage on this route?

                                                   VfM    Value for money variables

                                                   VfM1   How satisfied are you with the current            1. Very dissatisfied   2. Dissatisfied    3. Neutral               4. Satisfied         5. Very satisfied
                                                          quality of ride on buses on this route?

                                                   VfM2   How satisfied are you with the current level      1. Very dissatisfied   2. Dissatisfied    3. Neutral               4. Satisfied         5. Very satisfied
                                                          of fare of buses on this route?

                                                   ST     Travel Bias (Structural-type Constraints Questions)

                                                   ST1    Your accommodation type?                          1. Villa               2. Apartment       3. Hotel                 4. Labour camp       5. Other

                                                   ST2    What is your employment status?                   1. Retired/Other       2. Visitor         3. Student               4. Unemployed        5. Work part-time    6. Work full-time

                                                   ST3    What is your annual rent? (AED)                   1. Under 10,000        2. 10,000–20,000   3. 20,001–40,000         4. 40,001–60,000     5. 60,001–100,000    6. Over 100,000

                                                   SP     Travel Bias (Spatial-type Constraints Questions)

                                                   SP1    Where do you live?                                1. Al-Bateen           2. Downtown        3. CBD                   4. Al-Mina           5. Al-Wahdah         6. Shakhbout St to     7. Out of city
                                                                                                                                                                                                                         city edge

                                                   SP2    Where did you start this journey?                 1. Al-Bateen           2. Downtown        3. CBD                   4. Al-Mina           5. Al-Wahdah         6. Shakhbout St to     7. Out of city
                                                                                                                                                                                                                         city edge

                                                   SP3    Where are you travelling to?                      1. Al-Bateen           2. Downtown        3. CBD                   4. Al-Mina           5. Al-Wahdah         6. Shakhbout St to     7. Out of city
                                                                                                                                                                                                                         city edge

                                                   SP4    Purpose of your journey today?                    1. Work                2. Study           3. Business              4. Personal reason   5. Shopping          6. Leisure

                                                   SP5    Type of ticket you purchased today.               1. Cash                2. Daily pass      3. Monthly pass          4. Seniors pass      5. Disability pass

                                                   SD     Travel Bias (Socio-demographic Constraints Questions)

                                                   SD1    Age (years)                                       1. Under 16            2. 16 – 24         3. 25 – 34               4. 35 – 44           5. 45 – 64           6. Over 65

                                                   SD2    Number of cars in the household                   1. No cars             2. 1 to 2 cars     3. 3 to 5 cars           4. Over 5 cars

                                                   SD3    Do you hold a UAE driving license?                1. Yes                 2. No

                                                   SD4    Ethnicity/Nationality                             1. UAE                 2. Caucasian       3. Middle Eastern        4. African           5. South Asian       6. Southeast Asia      7. Other

                                                   SD5    Gender                                            1. Male                2. Female

                                                   SD6    Your gross monthly income in AED                  1. Under 10,000        2. 1,000–3,000     3. 3,001–5,000           4. 5,001–10,000      5. 10,001–20,000     6. Over 20,000

Transactions on Transport Sciences | Vol. 1/2021
30
SQ Perceived Service Quality Questions
SQ1 I am satisfied with the journey time 1. Strongly disagree 2. Disagree 3. Neutral 4. Agree 5. Strongly agree
SQ2 The buses are too crowded 1. Strongly disagree 2. Disagree 3. Neutral 4. Agree 5. Strongly agree
SQ3 Bus travel is the easiest way for me 1. Strongly disagree 2. Disagree 3. Neutral 4. Agree 5. Strongly agree
SQ4 I am satisfied with the bus-stops 1. Strongly disagree 2. Disagree 3. Neutral 4. Agree 5. Strongly agree
SQ5 Travel by car or taxi is expensive 1. Strongly disagree 2. Disagree 3. Neutral 4. Agree 5. Strongly agree
SQ6 Traffic congestion delays my journey 1. Strongly disagree 2. Disagree 3. Neutral 4. Agree 5. Strongly agree
SQ7 I chose to live further from work (i.e., near 1. Strongly disagree 2. Disagree 3. Neutral 4. Agree 5. Strongly agree
family and friends) and longer commute
time is insignificant to me
SQ8 I chose to live closer to work as shorter 1. Strongly disagree 2. Disagree 3. Neutral 4. Agree 5. Strongly agree
commute time is significant to me
SQ9 Willing to pay more for bus travel if I always 1. Strongly disagree 2. Disagree 3. Neutral 4. Agree 5. Strongly agree
had a seat
SQ10 I am satisfied with the existing distribution 1. Strongly disagree 2. Disagree 3. Neutral 4. Agree 5. Strongly agree
of bus-stops on the current travel route (over 25 min) (16 to 25 min) (10 to 15 min) (5 to 10 min) (under 5 min)
(Today it took me longer/many minutes to
get to bus-stop)
Table 1. Questionnaire sample (English version) used for this study.
Transactions on Transport Sciences | Vol. 1/2021graphic) questions were coded for categorical responses graphic constraints. The latent variable of “Perceived Quality”
and perceived quality attributes were based on a Likert-type constituted the second formative construct with some of the
scale ranging from “1 = strongly disagree” to “5 = strongly most used quality attributes as exogenous variables. VfM,
agree” and LoS and VfM were measured on a Likert-type satisfaction from LoS and frequency of bus and car travel were
satisfaction scale. modelled here as reflective constructs. All the exogenous
The survey procedure primarily focused on capturing intra- variables remained independent throughout the model. The
city travellers, based on the DoT observations, in an area framework is shown in Figure 1 and the model is composed
between Corniche and Hazaa Bin Zayed. It was noted that of two components, both used to confirm the validity of our
as some car users may be unaware of the existing quality of hypotheses. First, the measurement model describing the
PT service and its attributes (due to having never used the relationship between the latent variable and manifest vari-
service), their responses may introduce an unintentional ables of a formative construct, defined as:
systematic bias in the results. Conversely, if the survey is
predominantly focused on bus users, it may also introduce (1) x = Λxξ + δ
some systematic bias. However, based on the expert opin-
ions at the Abu Dhabi Department of Transport, the survey for exogenous variables with structural coefficient matrix
was primarily aimed to capture the data of bus travellers q × n by Λx
with data skewed towards bus travellers necessarily as the
improved service was planned to first retain existing users (2) y = Λy η + ε
and improve their perception of the service. This may in turn
enhance their willingness to promote PT service to non-users for endogenous variables with structural coefficient matrix
through word-of-mouth, as has been noted by other research- by p × m with a second, structural model describing the re-
ers (Yuda Bakti et al., 2020). To increase the range of the col- lationship between the different constructs themselves, de-
lected sample, interviews were conducted on both weekdays fined as:
and weekends under two eight-hour shifts. a total of 769
interviews for weekend and 751 interviews for weekdays were (3) y = βη + Γξ + ζ
completed (incomplete questionnaires were discarded). Two
eight-hour shifts, 6am to 2pm and 2pm to 10pm were under- Where, the endogenous latent variable vector m × 1 is
taken to complete the fieldwork to collect responses from defined by η, path coefficient m × m matrix by β, residual
a diversified group of passengers. As per the local department m × 1 vector by ζ with m × n path coefficient matrix Γ and,
of transport policies, the survey respondents were selected the exogenous latent variable n × 1 vector by ξ. The number
at random and were not paid. In addition to data screening of structural model equations depends upon the number of
and filtration by the authors, Abu Dhabi DoT experts (in 2015) endogenous latent variables. Equations (1) – (3) are a simpli-
initially reviewed the collected raw data to facilitate validity fied version of the PLS equations (Henseler, Hubona, & Ray,
(Şimşekoğlu, Nordfjærn, & Rundmo, 2015) of the question- 2016) in behavioural data sciences and statistical analyses,
naire responses. to define the relationship between the variables modelled
through a PLS algorithm.
5. DATA ANALYSIS
6. RESULTS AND DISCUSSION
In the current study, mode use is conceptualised as a function
of latent variable satisfaction with LoS, itself a consequence 6.1 Socio-demographic distribution of passengers
of latent variable perceived VfM of the existing bus service. Table 2 shows the detailed passenger distribution while the
As stated earlier, SEM is frequently used to calculate the la- results for observed travel mode frequency (bus and cars) is
tent variables in a collected dataset that may be otherwise shown in Figure 3. These statistical distribution results are
unobservable through direct estimations. For example, de provided to not only characterize the surveyed population but
Oña, de Oña, Eboli, and Mazzulla (2013) used SEM analysis also validate the findings of this study against already pub-
to estimate the latent “passenger satisfaction” variable from lished research in terms of “local population representation”.
the manifest “bus service quality” variables. Traditionally, Initial descriptive statistical analysis suggests that traveller
a multivariate normal distribution is assumed in the col- distribution was skewed towards males (86%-weekdays and
lected manifest variables and linear structural relationship 89%-weekends) of South-Asian descent (57%, 57%). This de-
is used to develop the relationship model. This practice has mographic distribution is representative of the Abu Dhabi
been debated by other researchers (Shen et al., 2016). They city population; where more than 50% residents are of South
have argued that the data collected through travel surveys Asian descent, 66% are under 34 years old, 62% are male with
rarely follow this distribution and the observed variables are an average salary under 3500 AED/month (SCAD, 2018; Tong,
usually dependent on each other, which can only be modelled 2017). Survey respondents predominantly (82.5%) fall into the
using modified SEM technique. fulltime workforce category (ST2 mean=5.55), that earned an
Partial Least Squares (PLS) method for SEM has little reli- average gross monthly income in the range of 1,000-5,000
ance on normal distribution assumptions and can be used to dirhams (SD6 mean=2.47). These results are similar to the
explicitly estimate the latent variables. It is also more suit- findings in a detailed report (Daleure, 2017), where majority
able for the work presented here due to its ability to handle of Abu Dhabi’s population was found to be expatriate fulltime
complicated models with both formative (where indicators workers, and a mean monthly salary in the Emirate of Abu
cause latent variable) and reflective (where latent variable Dhabi was found to be 3500 dirhams.
cause indicators) constructs (Hair, Sarstedt, Ringle, & Mena, Similarly, majority of the respondents lived in apartments
2012). SmartPLS 3.2.6 (Ringle, Wende, & Becker, 2015) was (ST1 mean=2.5), which is representative of the Abu Dhabi pop-
used in this work to validate the hypotheses by explaining ulation (Hasan et al., 2018b). Most of the respondents agreed
the presence of a causal relationship between the variable that buses were not crowded (SQ2 mean=0.6), still, bus travel
constructs. Following the above literature review, this work was not the easiest mode for them (SQ3 mean=0.66). This can
modelled “Travel Bias” as a second-order formative construct be explained by the following reasons. Firstly, the respondents
(where indicators are also latent variables) with endogenous were largely dissatisfied with the existing bus-stop distribution
variable constructs of spatial, structural and socio-demo- (SQ10 mean=2.10), which implies that they travelled more than
31 Transactions on Transport Sciences | Vol. 1/2021Figure 3. Distribution of frequencies of bus and car travel among the surveyed passengers. No. Variables Valid Cases Mean Standard Deviation Variance MU1 Frequency of bus travel 1517 5.20 1.149 1.321 MU2 Frequency of car travel 1305 2.94 1.414 2.000 LoS1 Satisfaction with frequency of buses 1512 3.70 0.899 0.809 LoS2 Satisfaction with network coverage 1494 3.74 0.890 0.793 VfM1 Satisfaction with quality of ride 1501 3.98 0.976 0.953 VfM2 Satisfaction with level of fare 1505 3.37 1.351 1.824 ST1 Your accommodation type? 1509 2.52 1.390 1.933 ST2 What is your employment status? 1505 5.55 1.103 1.216 ST3 What is your annual rent? (AED) 1384 2.09 1.252 1.566 SP1 Where do you live? 1519 3.76 1.814 3.291 SP2 Where did you start this journey? 1518 3.35 1.845 3.405 SP3 Where are you travelling to? 1515 3.38 1.823 3.323 SP4 Purpose of your journey today? 1514 3.25 2.130 4.539 SP5 Type of ticket you purchased today 1516 1.32 0.732 0.536 SD1 Age (years) 1507 3.21 0.923 0.851 SD2 Number of cars in household 1440 0.17 0.392 0.153 SD3 Do you hold a UAE driving license? 1503 1.79 0.411 0.169 SD4 Ethnicity/Nationality 1507 5.02 1.070 1.145 SD5 Gender 1509 1.13 0.333 0.111 SD6 Your gross monthly income in AED 1385 2.47 1.048 1.099 SQ1 I am satisfied with the journey time 1508 3.95 0.826 0.682 SQ2 The buses are too crowded 1519 0.60 0.489 0.240 SQ3 Bus travel is the easiest way for me 1519 0.66 0.475 0.226 SQ4 I am satisfied with the bus-stops 1496 3.38 1.125 1.265 SQ5 Travel by car or taxi is expensive 1519 0.45 0.497 0.247 SQ6 Traffic congestion delays my journey 1519 0.35 0.478 0.228 SQ7 I chose to live further from work 1519 0.66 0.472 0.223 SQ8 I chose to live closer to work 1319 4.70 2.70 7.301 SQ9 Willing to pay more for bus seat 1519 0.36 0.479 0.229 SQ10 Satisfied with existing bus-stop distribution 1519 2.10 0.676 0.457 Table 2. Statistical descriptive distribution of the collected variables. 32 Transactions on Transport Sciences | Vol. 1/2021
16 minutes to reach the nearest bus-stop. Secondly, majority of     following the guidelines by Andreev, Heart, Maoz, and Pliskin
the respondents either had a neutral perception or agreed with      (2009). Indicator validity was tested using t-statistics values of
the existing bus-stop quality (SQ4 mean=3.35) and journey           path coefficients (Figure 4). Only origin and residential areas,
time (SQ1 mean=3.95). Additionally, similar perceptions of the      employment status and possession of driving license were
frequency of buses, quality of ride and fare level were observed.   noted as somewhat insignificant indicators.
a separate study by the authors (Hasan et al., 2018b) found            Variance inflation factors (VIF) scores were used to test for
that the passengers’ perception of journey time and fare level      multi-collinearity. The VIF values ranged from 1.017 – 1.796
were highly correlated to the ride quality rating, and longer       (Table 3), which confirms that all formative latent variables
journey time resulted in a negative service perception. This        met the required thresholds of VIF
consistency through Cronbach’s alpha. Convergent and dis-                      violations were explainable due to the nature of the data. This
criminant validity were also examined by the average vari-                     exhibits an ability to significantly define the respective latent
ance extracted (AVE).                                                          variable constructs and as such the current study was then
   Results (Table 4) exhibit that all composite reliability and                able to proceed to test the research hypotheses by evaluating
Cronbach’s alpha scores were above the recommended mini-                       the structural model.
mum threshold of 0.7 (Hair et al., 2012), indicating that in-
ternal consistency and reliability were confirmed. As all AVE                  6.3 Evaluation of structural model: hypotheses testing
values were above the 0.5 cut-off (Hair et al., 2012), the con-                The results of the PLS structural model are shown in Figure 4.
vergent validity of the constructs was also established. The                   Henseler et al. (2016) recommend that the primary criterion
bolded values along the diagonals in Table 4 show the square-                  for assessing the validity of a structural model is “explained
roots of AVE for each construct (e.g., 0.896 for LoS). For the                 variance level” based on R2 values of the endogenous latent
discriminant validity to be true, these values should exceed                   variable constructs. The non-parametric method of bootstrap-
the inter-construct correlations (Kim, Lee, & Bonn, 2017),                     ping was conducted, which performs re-sampling to evaluate
which was also confirmed. Overall, even though there were                      the significance and conformance of the model (Kim et al.,
some violations in the measurement models, the constructs                      2017). The R2 values of the endogenous latent variables are
had appropriate validity and most of the indicators passed                     illustrated in Figure 4 and most of the values were in the
the required reliability and validity tests. Furthermore, the                  0.376 – 0.995 range, showing a substantial degree of overall

 First-order constructs     Second-order formative sub-constructs            Path Coefficient      Sample mean          SD       t-statistics        VIF
 Travel bias                Structural – type travel biases
                            Your accommodation type?                               0.349                0.336          0.138         2.527**        1.792
                            What is your employment status?                        0.193                0.202          0.132          1.467         1.796
                            What is your annual rent? (in dirham)                  0.805                0.795          0.073         11.024***      1.017
                            Spatial – type travel biases
                            Where do you live?                                     0.200                0.188          0.11           1.818         1.075
                            Where did you start this journey?                      0.145                0.136          0.103          1.401         1.061
                            Where are you travelling to?                           0.402                0.396          0.087         4.593***       1.024
                            Purpose of your journey today?                         0.698                0.686          0.07          9.953   ***
                                                                                                                                                    1.045
                            Type of ticket you purchased today.                    0.304                0.305          0.083         3.646***       1.023
                            Socio-demographic travel biases
                            Age (years)                                            0.171               -0.164          0.071          2.401*        1.039
                            Number of cars in household                            0.277                0.272          0.088         31.16**        1.287
                            Do you hold a UAE driving license?                     0.031                0.028          0.091          0.347         1.343
                            Ethnicity/Nationality                                  0.626                0.616          0.068         9.196***       1.085
                            Gender                                                 0.405               -0.411          0.08          5.042   ***
                                                                                                                                                    1.019
                            Your gross monthly income in AED?                      0.309                0.29           0.104         2.964**        1.155
 Perceived quality          I am satisfied with journey time?                      0.649                0.648          0.028         22.841   ***
                                                                                                                                                     1.23
                            The buses are too crowded                              -0.015              -0.104          0.027         3.864***       1.226
                            Bus travel is the easiest way for me                   0.068                0.069          0.026          2.64**        1.105
                            I am satisfied with the bus-stops                      0.504                0.501          0.029         17.57***        1.24
                            Travel by car or taxi is expensive                     -0.014              -0.013          0.028         2.489   **
                                                                                                                                                    1.204
                            I chose to live further from work                      0.026                0.027          0.027         1.975**        1.243
                            I chose to live close to work                          0.048                0.048          0.027         1.966   ***
                                                                                                                                                    1.169
                            Pay more to travel by bus for a seat                   -0.015              -0.016          0.026          2.571*        1.283
                            Satisfied with bus-stops’ distribution                 0.070                0.069          0.024         2.974   **
                                                                                                                                                    1.019
                            Traffic congestion delays my journey                   0.026                0.026          0.025         3.029**        1.114
 SD = Standard deviation. Listed values are for second-order formative constructs. *** p < 0.001, ** 0.001 ≤ p < 0.01, * p < 0.05.

Table 3. Path analysis and multi-collinearity results.

 Constructs                   Composite reliability           Cronbach’s alpha              AVE                         Correlations
                                                                                                        LoS          VfM              Car           Bus
 Level of service (LoS)                0.891                         0.757                 0.804       0.896
 Value for money (VfM)                 0.781                         0.745                 0.647       0.597         0.804
 Car use (Car)                         0.712                         0.726                 0.616       -0.553       -0.311           0.785
 Bus use (Bus)                         0.773                         0.849                 0.724       -0.613       -0.434           0.669          0.851

Table 4. Path analysis and multi-collinearity results.

34                                                                                                   Transactions on Transport Sciences | Vol. 1/2021
Hypotheses β t-statistic Outcome
H1: Passenger satisfaction from LoS is influenced by travel bias of passengers. – 0.042 *
1.897 Invalid
H2: Passengers’ perceived VfM of the bus service is related to their travel bias. – 0.077** 2.640 Validated
H3: Travel bias of passengers affects their ranking of quality attributes. – 0.279*** 9.042 Validated
H4: Passengers’ ranking of quality attributes positively affects perceived VfM of the service. 0.568*** 30.751 Validated
H5: Relative ranking of quality attributes is indicative of passenger satisfaction from LoS. 0.556 ***
24.980 Validated
H6: Passenger perceived VfM has a positive effect on their satisfaction from LoS. 0.259*** 11.322 Validated
H7: Passengers’ satisfaction from LoS positively affects their choice to travel by bus and Bus 0.613 ***
35.708 Validated
negatively influences their car usage. Car
*** p < 0.001, ** 0.001 ≤ p < 0.01, * p > 0.05
Table 5. Hypotheses testing results.
goodness-of-fit. The criteria specified by Chin (1998) proposes satisfaction as a function of perceived value, service qual-
that an R2 value between 0.33 – 0.66 indicated a moderate es- ity attributes and passenger travel bias. The bus or car use
timation while lower and higher values respectively describe frequencies of passengers were established as the two model
a weak and substantial estimation. consequences through Abu Dhabi passenger response survey
Although the manifest variables from the “car use” latent data. The validity of these hypotheses between the various
variable passed the significance criteria, the latent variable endogenous latent variables (mode choice, LoS, VfM, qual-
itself had a low R2 value, probably due to the comparatively ity attributes and travel bias) and their manifest variables,
lower response rate in the collected sample. Hypotheses test- was then tested.
ing results in Table 5 show that all the proposed hypotheses The results show strong effects of bus service quality at-
were supported except hypothesis H1, which failed both t-sta- tributes, notably journey time and bus-stop waiting area
tistics and p-value tests. Although the travel bias of passen- distribution and quality as a reinforcing factor for perceived
gers negatively influenced their perceived VfM (H2: path coef- value and satisfaction. Additionally, infrequent and over-
ficient = – 0.077, pAcknowledgements in the United States, Europe, and China. Science of
This research project is supported by an Australian Govern- the Total Environment, 671, 632-643. DOI: 10.1016/j.
ment Research Training Program (RTP) scholarship. The scitotenv.2019.03.269
authors also thank the Integrated Planning Department at DoT Abu Dhabi. (2009). Surface Transport Master Plan - a Vision for
the Department of Transportation (DoT) Abu Dhabi for their Connecting Abu Dhabi. Abu Dhabi, United Arab Emirates
support of data collection and assistance. Echaniz, E., dell’Olio, L., & Ibeas, Á. (2018). Modelling perceived
quality for urban public transport systems using weighted
REFERENCES variables and random parameters. Transport Policy, 67, 31-39.
DOI: 10.1016/j.tranpol.2017.05.006
Abenoza, R. F., Cats, O., & Susilo, Y. O. (2017). Travel satisfaction Friman, M., & Fellesson, M. (2009). Service supply and
with public transport: Determinants, user classes, regional customer satisfaction in public transportation: The quality
disparities and their evolution. Transportation Research Part A: paradox. Journal of Public Transportation, 12(4), 57-69. DOI:
Policy and Practice, 95, 64-84. DOI: 10.1016/j.tra.2016.11.011 10.5038/2375-0901.12.4.4
Abou-Zeid, M., & Fujii, S. (2016). Travel satisfaction effects of Fu, X.-m., Zhang, J.-h., & Chan, F. T. (2018). Determinants of loyalty
changes in public transport usage. Transportation, 43(2), to public transit: a model integrating Satisfaction-Loyalty
301-314. DOI: 10.1007/s11116-015-9576-3 Theory and Expectation-Confirmation Theory. Transportation
AECOM. (2015). Working Paper No. 1: Task 3 Review and Research Part A: Policy and Practice, 113, 476-490
Recommendations on the Proposed Travel Surveys. Abu Dhabi, Guirao, B., García-Pastor, A., & López-Lambas, M. E. (2016).
United Arab Emirates The importance of service quality attributes in public
Alawadi, K., & Benkraouda, O. (2017). The Debate over transportation: Narrowing the gap between scientific research
Neighborhood Density in Dubai: Between Theory and and practitioners’ needs. Transport Policy, 49, 68-77. DOI:
Practicality. Journal of Planning Education and Research, 39(1), 10.1016/j.tranpol.2016.04.003
18-34. DOI: 10.1177/0739456X17720490 Hadiuzzman, M., Das, T., Hasnat, M. M., Hossain, S., & Rafee
Andreev, P., Heart, T., Maoz, H., & Pliskin, N. (2009). Validating Musabbir, S. (2017). Structural equation modeling of user
formative partial least squares (PLS) models: Methodological satisfaction of bus transit service quality based on stated
review and empirical illustration. Paper presented at the 13th preferences and latent variables. Transportation Planning and
International Conference on Information Systems, Phoenix, Technology, 40(3), 257-277
Arizona Hair, J. F., Sarstedt, M., Ringle, C. M., & Mena, J. A. (2012). An
Beirão, G., & Cabral, J. S. (2007). Understanding attitudes towards assessment of the use of partial least squares structural
public transport and private car: a qualitative study. Transport equation modeling in marketing research. Journal of Academy
Policy, 14(6), 478-489 of Marketing Science, 40(3), 414-433
Benbasat, I., & Wang, W. (2005). Trust in and adoption of online Hasan, U., Whyte, A., & Al Jassmi, H. (2018a). Framework for
recommendation agents. Journal of the Association for Delivering an AV-based Mass Mobility Solution: Integrating
Information Systems, 6(3), 4 Government-Consumer Actors and Life-cycle Analysis of
Buehler, R., Pucher, J., Gerike, R., & Götschi, T. (2017). Reducing Transportation Systems. Paper presented at the 46th European
car dependence in the heart of Europe: lessons from Germany, Transport Conference, Dublin, Ireland
Austria, and Switzerland. Transport Reviews, 37(1), 4-28. DOI: Hasan, U., Whyte, A., & Al Jassmi, H. (2018b). Life-cycle asset
10.1080/01441647.2016.1177799 management in residential developments building on transport
Campbell, D. T., & Fiske, D. W. (1959). Convergent and system critical attributes via a data-mining algorithm.
discriminant validation by the multitrait-multimethod matrix. Buildings, 9(1). DOI: 10.3390/buildings9010001
Psychological Bulletin, 56(2), 81-105 Hasan, U., Whyte, A., & Al Jassmi, H. (2019). a life-cycle decision-
Chaloux, N., Boisjoly, G., Grisé, E., El-Geneidy, A., & Levinson, D. making framework to assess the need for autonomous mobility.
(2019). I only get some satisfaction: Introducing satisfaction Transportation Research Procedia, 42, 32-43. DOI: 10.1016/j.
into measures of accessibility. Transportation Research Part F: trpro.2019.12.004
Traffic Psychology and Behaviour, 62, 833-843. DOI: 10.1016/j. Hasan, U., Whyte, A., & Al Jassmi, H. (2020). a review of the
trf.2019.03.008 transformation of road transport systems: Are we ready for
Chin, W. W. (1998). The partial least squares approach to structural the next step in artificially intelligent sustainable transport?
equation modeling. In G. A. Marcoulides (Ed.), Modern methods Applied System Innovation, 3(1), 1
for business research (Vol. 295, pp. 295-336). London, U.K.: Heinen, E., & Chatterjee, K. (2015). The same mode again?
Lawrence Erlbaum Associates An exploration of mode choice variability in Great Britain
Currie, G., & De Gruyter, C. (2018). Exploring links between the using the National Travel Survey. Transportation Research
sustainability performance of urban public transport and land Part A: Policy and Practice, 78, 266-282. DOI: 10.1016/j.
use in international cities. Journal of Transport and Land Use, tra.2015.05.015
11(1), 325–342. DOI: 10.5198/jtlu.2018.957 Henseler, J., Hubona, G., & Ray, P. A. (2016). Using PLS path
Daleure, G. (2017). Wages, Salaries, and Expatriate Labor. In modeling in new technology research: Updated guidelines.
Emiratization in the UAE Labor Market (pp. 57-71): Springer Industrial Management and Data Systems, 116(1), 2-20. DOI:
de Oña, J., de Oña, R., Eboli, L., & Mazzulla, G. (2013). Perceived 10.1108/IMDS-09-2015-0382
service quality in bus transit service: a structural equation Kamaruddin, R., Osman, I., & Pei, C. A. C. (2017). Customer
approach. Transport Policy, 29, 219-226 expectations and its relationship towards public transport in
De Vos, J., Mokhtarian, P. L., Schwanen, T., Van Acker, V., Klang Valley. Journal of ASIAN Behavioural Studies, 2(4), 29-39
& Witlox, F. (2016). Travel mode choice and travel satisfaction: Kim, M. J., Lee, C.-K., & Bonn, M. (2017). Obtaining a better
bridging the gap between decision utility and experienced understanding about travel-related purchase intentions among
utility. Transportation, 43(5), 771-796. DOI: 10.1007/s11116- senior users of mobile social network sites. International
015-9619-9 Journal of Information Management, 37(5), 484-496
dell’Olio, L., Ibeas, A., & Cecin, P. (2011). The quality of service Kroesen, M., Handy, S., & Chorus, C. (2017). Do attitudes cause
desired by public transport users. Transport Policy, 18(1), behavior or vice versa? An alternative conceptualization of the
217-227. DOI: 10.1016/j.tranpol.2010.08.005 attitude-behavior relationship in travel behavior modeling.
Dong, T., Jiao, L., Xu, G., Yang, L., & Liu, J. (2019). Towards Transportation Research Part A: Policy and Practice, 101,
sustainability? Analyzing changing urban form patterns 190-202. DOI: 10.1016/j.tra.2017.05.013
36 Transactions on Transport Sciences | Vol. 1/2021Kwan, S. C., Sutan, R., & Hashim, J. H. (2018). Trip characteristics Transport for NSW. (2021). Adult Fares. Retrieved from https:// as the determinants of intention to shift to rail transport transportnsw.info/tickets-opal/opal/fares-payments/adult- among private motor vehicle users in Kuala Lumpur, Malaysia. fares Sustainable Cities and Society, 36, 319-326. DOI: 10.1016/j. van Lierop, D., & El-Geneidy, A. (2016). Enjoying loyalty: The scs.2017.10.030 relationship between service quality, customer satisfaction, Lavery, T. A., Páez, A., & Kanaroglou, P. S. (2013). Driving out of and behavioral intentions in public transit. Research in choices: An investigation of transport modality in a university Transportation Economics, 59, 50-59. DOI: 10.1016/j. sample. Transportation Research Part A: Policy and Practice, 57, retrec.2016.04.001 37-46. DOI: 10.1016/j.tra.2013.09.010 Wu, I., & Pojani, D. (2016). Obstacles to the creation of successful Liu, Y., Sheng, H., Mundorf, N., Redding, C., & Ye, Y. (2017). bus rapid transit systems: The case of Bangkok. Research in Integrating norm activation model and theory of planned Transportation Economics, 60(Supplement C), 44-53. DOI: behavior to understand sustainable transport behavior: 10.1016/j.retrec.2016.05.001 Evidence from China. International journal of Environmental Yuda Bakti, I. G. M., Rakhmawati, T., Sumaedi, S., Widianti, T., Research and Public Health, 14(12), 1593 Yarmen, M., & Astrini, N. J. (2020). Public transport users’ Loch, K. D., Straub, D. W., & Kamel, S. (2003). Diffusing the WOM: an integration model of the theory of planned behavior, internet in the Arab world: The role of social norms and customer satisfaction theory, and personal norm theory. technological culturation. IEEE Transactions on Engineering Transportation Research Procedia, 48, 3365-3379. DOI: Management, 50(1), 45-63 10.1016/j.trpro.2020.08.117 Lovelock, C., & Wirtz, J. (2016). Services marketing: People, technology, strategy (K. Samsudin Ed. 8th ed.). Singapore: World Scientific Mezghani, M. (2006). North Africa and the Middle East: a promising region for public transport. Public Transport International, 55(2) Mouwen, A. (2015). Drivers of customer satisfaction with public transport services. Transportation Research Part A: Policy and Practice, 78, 1-20. DOI: 10.1016/j.tra.2015.05.005 Mugion, R. G., Toni, M., Raharjo, H., Di Pietro, L., & Sebathu, S. P. (2018). Does the service quality of urban public transport enhance sustainable mobility? Journal of Cleaner Production, 174, 1566-1587. DOI: 10.1016/j.jclepro.2017.11.052 Qamhaieh, A., & Chakravarty, S. (2020). Drive-through cities: Cars, labor, and exaggerated automobilities in Abu Dhabi. Mobilities, 15(6), 792-809. DOI: 10.1080/17450101.2020.1822103 Rahman, S. M., Khondaker, A. N., Hasan, M. A., & Reza, I. (2017). Greenhouse gas emissions from road transportation in Saudi Arabia – a challenging frontier. Renewable and Sustainable Energy Reviews, 69, 812-821. DOI: 10.1016/j.rser.2016.11.047 Renne, J. L., Hamidi, S., & Ewing, R. (2016). Transit commuting, the network accessibility effect, and the built environment in station areas across the United States. Research in Transportation Economics, 60(Supplement C), 35-43. DOI: 10.1016/j.retrec.2017.02.003 Ringle, C. M., Wende, S., & Becker, J.-M. (2015). SmartPLS 3. In. Bönningstedt: SmartPLS Sam, E. F., Hamidu, O., & Daniels, S. (2018). SERVQUAL analysis of public bus transport services in Kumasi metropolis, Ghana: Core user perspectives. Case Studies on Transport Policy, 6(1), 25-31 SBS Transit Ltd. (2019). Fares and Concessions. Retrieved from https://www.sbstransit.com.sg/Uploads/Whats%20New/ Press%20Release%20Attachments/2019/Flyer%20-%20Bus%20 and%20train%20fares%20from%2028%20Dec%202019.pdf SCAD. (2014). Statistical Yearbook of Abu Dhabi. Abu Dhabi, United Arab Emirates: Statistics Centre - Abu Dhabi (SCAD) Retrieved from https://www.scad.ae/Release%20Documents/ SYB-2014_V1.1_EN.pdf Shen, W., Xiao, W., & Wang, X. (2016). Passenger satisfaction evaluation model for Urban rail transit: a structural equation modeling based on partial least squares. Transport Policy, 46, 20-31. DOI: 10.1016/j.tranpol.2015.10.006 Şimşekoğlu, Ö., Nordfjærn, T., & Rundmo, T. (2015). The role of attitudes, transport priorities, and car use habit for travel mode use and intentions to use public transportation in an urban Norwegian public. Transport Policy, 42, 113-120. DOI: 10.1016/j. tranpol.2015.05.019 Taylor, M. A. P., Young, W., Wigan, M. R., & Ogden, K. W. (1992). Designing a large-scale travel demand survey: New challenges and new opportunities. Transportation Research Part A: Policy and Practice, 26(3), 247-261. DOI: 10.1016/0965-8564(92)90035-6 37 Transactions on Transport Sciences | Vol. 1/2021
You can also read