Role of Bus Aggregators in improving City Bus Services in India - A product of WRI Ross Center for Sustainable Cities
←
→
Page content transcription
If your browser does not render page correctly, please read the page content below
Role of Bus Aggregators in
  improving City Bus Services in
  India

A product of WRI Ross Center for Sustainable Cities
About Shakti:
Shakti Sustainable Energy Foundation works to strengthen the energy security of India by
aiding the design and implementation of policies that support renewable energy, energy
efficiency and the adoption of sustainable transport solutions.

Disclaimer:
The views/analysis expressed in this report/document do not necessarily reflect the views of
Shakti Sustainable Energy Foundation. The Foundation also does not guarantee the accuracy
of any data included in this publication nor does it accept any responsibility for the
consequences of its use.

*For private circulation only.

                                                                1 | www.WRIcitiesIndia.org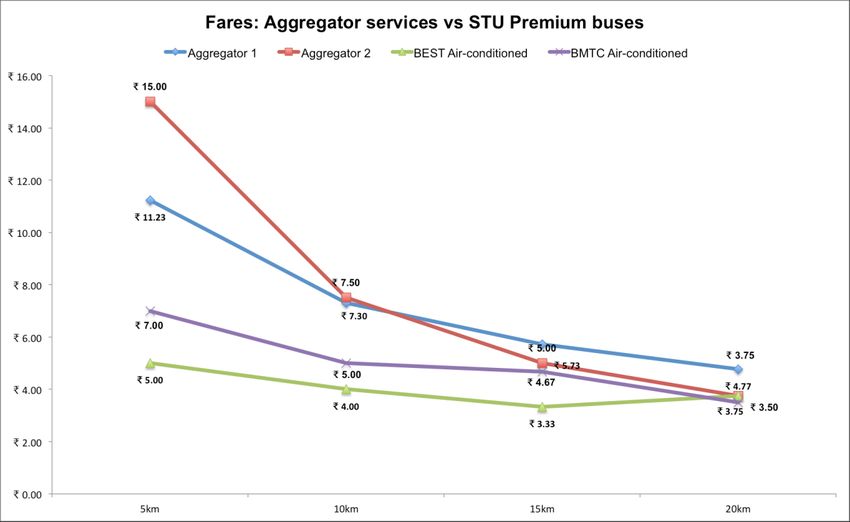
EXECUTIVE SUMMARY

Technology start-ups across the country have begun to aggregate privately-owned buses to
provide transport services. These “Bus Aggregators” typically own no assets other than
Information Technology infrastructure and Fare-collection tools, and enter into agreements
with private bus owners for operations. Aggregator bus services differ from those offered by
State Transport Undertakings (STUs) by enabling passengers to track bus timings and
arrival, and guarantee seats for the duration of their journey. However, several STUs are also
in the process of adopting Intelligent Transport System (ITS) technology to improve the
reliability of their services.

Aggregator buses have been in service in major cities including Bengaluru, Delhi, Hyderabad
and Mumbai, plying along corridors that connect major business or technology parks with
residential areas and operate alongside STU bus services. In Gurgaon, however, aggregators
are running services in the absence of a mature public transport network.

Though governed by the Motor Vehicles Act of 1988, as all road transportation in India is,
bus aggregator services do not always lie within its scope due to private ownership and the
business model of operations. For example, aggregators are recognized by the Act as agents
in the sale of tickets, rather than technology providers fulfilling the role of a system planner
in a public transport network.

The provision of public bus services by the private sector, including aggregator firms,
presents both opportunities and challenges. The private sector may be able to respond to
growth in demand with expansion of public bus capacity sooner than State-run corporations.
However, in cities with mature public transport system, the private sector may compete
along routes facilitated by STUs. Rather than complementing existing services to bring
about a net addition of bus services and shifting private vehicle users to the aggregator
services, these services may capture the demand being served by STUs.

This paper attempts to understand the various regulatory, economic and social
considerations presented by the aggregator model to serve as the basis for further research
on the impact of the aggregator model in an urban context. Through an assessment of
current operations, the paper acknowledges that aggregators need to be regulated and a level
playing field needs to be created.

                                                                  2 | www.WRIcitiesIndia.org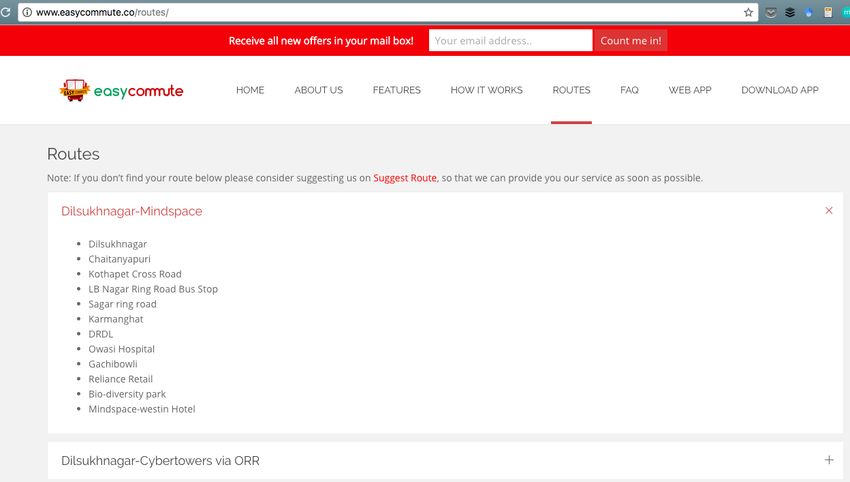
CONTENTS
Sl.   Section                                                               Page

1     Introduction                                                      5

      Overview of Public Bus Systems in India
2                                                                       6
      2.1 Decline in quality of bus services in India
                                                                        8

      The Bus Aggregator Service Concept                                9
3
      3.1 Business Models                                               9

      Regulatory Considerations                                         13
      4.1 Motor Vehicles Act                                            13
      4.1.1 Views of STUs                                               15
      4.1.2 Views of Aggregators                                        16
      4.1.3 Recent Regulation                                           18
      4.2 Economic Considerations                                       20
      4.2.1 Costs of Operations                                         20
      4.2.2 Viability of Operations                                     24
4     4.2.3 Service Obligations                                         26
      4.2.4 Impact of Fares                                             26
      4.3 Social Considerations                                         27
      4.3.1 Driver Wages                                                27
      4.3.2 Risks for Lessors                                           28
      4.3.3 Passenger Safety and Security                               28
      4.3.4 Vehicle Maintenance                                         29
      4.3.5 Stops and Parking                                           29
      4.3.6 Congestion and Environment                                  29

5     Way Forward                                                       31

6     References                                                        32

7     Appendix                                                          34

                                                        3 | www.WRIcitiesIndia.org
ABBREVIATIONS USED

Abbreviation   Full Form
BEST           BrihanMumbai Electric Supply and Transport Undertaking
BMTC           Bangalore Metropolitan Transport Corporation
DTC            Delhi Transport Corporation
INR            Indian Rupees
IPT            Intermediate Para Transit
JnNURM         Jawaharlal Nehru National Urban Renewal Mission
MTC            Metropolitan Transport Corporation (Chennai)
NCR            National Capital Region
STU            State Transport Undertaking

                                                         4 | www.WRIcitiesIndia.org
1. INTRODUCTION
Historically, public transportation in India has been largely bus-based. As of 2014-15, an
estimated 74% of total passenger-trips in the country were completed by formal public
transport services (MoRTH, 2016a), operated mostly by the 62 State-owned Road Transport
Corporations (referred to as State Transport Undertakings (STUs) henceforth).

Exponential vehicular growth in India – a 6.2 fold increase (MoRTH, 2016b) in the last two
decades – driven primarily by an increase in private vehicle growth, has resulted in reduced
traffic speeds and endemic congestion in most cities. Due to the proliferation of single or
low-occupancy vehicles, the decline in modal share of public buses is a cause for concern.
Increased congestion levels have contributed to the lack of reliability of public bus services.
Uncertainty in bus arrival timings and its impact on waiting times at bus stops discourage
public bus usage. Though most STUs are financially constrained, some are investing in
Intelligent Transport Systems (ITS), including Vehicle Tracking Units and Passenger
Information Systems (PIS), to improve the reliability of their services

In parallel, technology start-ups across the country have begun to aggregate privately owned
buses, typically seating 20 passengers, to provide transport services. These “Bus
Aggregators” typically own no assets other than the Information Technology infrastructure
and fare-collection tools, and enter into agreements with private bus owners for operations.
Aggregator bus services differ from those offered by STUs by enabling passengers to track
bus timings and arrival, and assuring them seating for the duration of their journey.

Aggregator buses have been in service in major cities including Bengaluru, Delhi, Hyderabad
and Mumbai, plying along corridors that connect major business or technology parks with
residential areas, and operate alongside STU bus services. In Gurgaon, however, aggregators
are running services in the absence of a mature public transport network.

The legal framework for aggregator bus services is governed by the Motor Vehicles Act of
1988, the provisions of which pre-date advances in Information Technology. The Act regards
aggregators and limits their roles to that of agents in the booking of tickets to travel, rather
than system planners in a public transport network. The Act also does not regulate such
technology-enabled bus services to best serve the interests of society at large, as described in
later sections of this report.

This report finds it important to not view bus aggregators in isolation, but also consider their
ramifications for urban Indian society. Towards this end, an initial assessment of the
feasibility of bus aggregator services in India is undertaken here, by applying to them the
political, economic and social considerations that govern public bus services. The report
begins with a comparative analysis of private bus aggregator operations vis-à-vis public bus
transit systems as they currently operate. At the same time, bus aggregators may provide
alternative service in cities and employment opportunity to several drivers. As such, bus
aggregators are currently not subject to the same social and regulatory constraints that STUs
are subject to, leading to an unleveled playing field with implications for stakeholders and
cities alike.

                                                                  5 | www.WRIcitiesIndia.org
2. OVERVIEW OF PUBLIC BUS SYSTEMS IN INDIA
The 2011 Census of India found 31.16% of India’s population living in urban areas, up 3.35%
from the previous census in 2001 (Census of India, 2011). Average trip lengths have
increased in cities as economic opportunities, residences, schools and other serv ices are
scattered across the city. Table 1 shows the increase in trip length between 2007 and 2011 in
cities of different sizes and populations.
Table 1 Per capita trip rates and trip lengths in Indian cities
Population range Per capita trip rate Motorised trip length (km)
(in million) 2007 2011 2007 2011
Less than 0.5 0.7-0.76 0.7-1.6 1 - 3.5 3.8 - 4.5
0.5 to 1 0.81-1.02 0.36-1.56 2.2 - 3.6 3.5 - 7.2
1 to 2 0.88-1.08 0.93-1.5 4.1 - 6.04 5.8 - 13.8
2 to 4 1.06-1.22 1.02-1.26 3.8 - 7.7 5.6 - 8.03
4 to 8 1.18-1.40 1.23-1.46 7.1 – 10 8 - 11.3
Above 8 1.23-1.36 1.27-1.42 9.3 – 13 11.2 - 15.8
Source: CSTEP (201 4)
Growing urbanization coupled with rapid motorization has resulted in public transport
agencies being caught up in a vicious cycle impacting their efficiency (Figure 1). Increased
congestion level across major cities has led to peak hour speeds dropping below 15kmph,
thus increasing the cycle lengths of bus operations. As a result, fleet sizes need to be
expanded to ensure acceptable frequencies. However, due to limited funding support from
governments, STUs have not been able to expand their fleet size and keep pace with growth
in cities. In fact, in the last 4 years all major STUs have hardly seen any expansion in their
fleet. This has led to decline in their bus ridership. Data available for 2010-15 indicates
stagnant or shrinking ridership for three of the four largest metropolitan transport
corporations in the country (Figure 2).
6 | www.WRIcitiesIndia.orgFigure 1: Impact of increase in private vehicle ownership
SOURCE: WRI India
Figure 2: Bus ridership of major STUs
21000
19000
Passengers carried (lakhs)
17000
15000
13000
11000
9000
7000
2009-10 2010-11 2011-12 2012-13 2013-14 2014-15
Year of operation
Bangalore Metropolitan TC BEST Delhi TC Metro TC (Chennai) Ltd.
SOURCE: Government of India (2016)
In Delhi, both DTC and cluster bus operators combined were only able to supply 5,531 buses
on the road against a requirement of 11,000 buses in 2015, a net shortage of almost half the
total number of required buses (CAG, 2014). Cluster bus operators are private bus owners
providing public bus services on certain route clusters, as allocated in their public-private
partnership agreement.
7 | www.WRIcitiesIndia.orgIn Bengaluru, despite BMTC’s ridership remaining relatively high in comparison with other
metropolitan cities, a decline in the modal share of buses is evident (Table 2). Data compiled
from various studies over the years show that buses have lost modal share over the years to
two wheelers, cars and IPT. BMTC’s fleet has been steadily decreasing since 2013-14, as
older vehicles are scrapped and not enough new buses have been added to the fleet (BMTC,
2017).
Table 2 Modal share of buses in Bengaluru
ILFS RITES Bangalore Mobility
Mode of travel
(1994) (2002) Indicators 2011
Bicycle 9.05 2 4.4
Two-wheeler 22.45 36.31 36.8
Car 2.38 5.44 8.8
Bus 60.19 48.91 39.7
Auto-rickshaw 5.28 6.9 10.29
Others/ taxi 0.65 0.44 0
SOURCE: Pangotra and Sharma (2006), UMTC (2011)
2.1 DECLINE IN QUALITY OF BUS SERVICES IN INDIA
Verma et al (2013) used the SERVQUAL framework to study the gaps in quality of service
provided by Bangalore Metropolitan Transport Corporation (BMTC), among the country’s
major State Transport Undertakings (STUs) with service levels comparable with other STUs
in the country. Gaps were assessed over five dimensions: Reliability, Responsiveness,
Assurance, Empathy and Tangibles, which addressed relevant determinants of quality of
service on public buses (Table 3). A gap-analysis conducted as part of their study indicated
that BMTC’s bus services were perceived to be below passenger expectations across all the
five dimensions mentioned.
Table 3 Dimension of Public Transport Service
Dimension Determinants of Quality of Service assessed
Reliability Availability of bus schedule and route information, Availability of buses during
peak hours, Frequency on routes, network coverage in the city.
Responsiveness Convenient location of bus stops, Response time to resolve complaints.
Assurance On board safety, Crew well trained in safety measures, Availability of fire and
emergency exits.
Empathy Seat availability, convenience for the differently abled.
Tangibles Cleanliness and maintenance of buses and stops
SOURCE: Verma et al (2013)
8 | www.WRIcitiesIndia.org3. THE BUS AGGREGATOR CONCEPT
Bus aggregator models use algorithms to chart routes based on demands, sourced from
potential customers, employee travel data available from major technology parks and
current routes of clandestine bus operations in the city. The model allows convenient
boarding points for passengers along predetermined routes, providing direct trips to
passengers. The model sources demand for a trip through its front-end interface, typically a
smartphone application, that allows passengers to reserve and pay for seats for a journey. In
addition to seat assurance and electronic payments, the smartphone application also serves
as a passenger information system, allowing passengers the real-time tracking of bus
schedules and arrival at the nearest stop.
In addition, these buses may be equipped with amenities such as air-conditioning and
wireless internet. Further, these buses may also be equipped with CCTV cameras to improve
passenger security during the commute, in line with similar measures taken by buses
operated by STUs.
The Indian market is served by aggregators including those listed in Table 4.
3.1 BUSINESS MODELS
As the bus aggregator model is still evolving, there are few variations in the market. For
instance, San Francisco’s Chariot leases its buses and employs its drivers directly, while
Singapore’s Beeline acts as an aggregator to provide services to its users through existing bus
operators. Bus aggregators in India follow the latter, aggregating privately owned buses for
the services. Lessors of buses are compensated an agreed sum every month (Source: WRI
Phone Interviews with aggregators), for the provision of driver, fuel, vehicle depreciation,
maintenance and insurance. Aggregators and bus owners fulfil the roles of system planner
and bus operator, as explained in Figure 3.
Figure 3: Roles of Aggregators and Lessors
Buses
Driver
Lessors of Fuel
Buses
Maintenance
Insurance
Bus
aggregation Permits
model Service routes, stops and timings
Fare setting and collection
Aggregator Fleet management
User interface and information
system
SOURCE: WRI India
9 | www.WRIcitiesIndia.orgTable 4: Bus aggregators in India
Operating in Delhi Delhi NCR &
Mumbai Delhi NCR Hyderabad
NCR & Bengaluru Bengaluru
Commenced
May 2015 April 2015 August 2015 September 2015
September 2015
SOURCE: WRI India
Aggregators in India currently focus on routes linking business and technology hubs in a city.
For instance, three of five routes (Cityflo website, February 2017) operated by CityFlo in
Mumbai serve Bandra Kurla Complex, a hub for leading businesses and the Stock Exchange.
Figure 4: Aggregator bus service routes – Mumbai
SOURCE: CityFlo website
1 0 | www.WRIcitiesIndia.orgFigure 5: Aggregator bus service routes – Hyderabad
SOURCE: EasyCommut website
While bus routes are typically chosen based on an estimation of demand through
reservations, aggregators have also recently used crowdsourcing schemes.
Buses aggregated thus far have mostly been mini buses, typically seating between 12 and 20
passengers. These buses typically are leased for shorter periods thus the continuation of
these services remains questionable.
Some of the features of bus aggregators in India and elsewhere are indicated in Table 5.
1 1 | www.WRIcitiesIndia.orgTable 5: Features of bus aggregators
Operator
Leap Beeline Ola Shuttle Shuttl
San Francisco, Bengaluru &
Location Singapore Delhi NCR
USA Delhi NCR
Seat
Assurance
Demand-
Responsive P P
Routing
Air-
conditioning
Wireless
N/A N/A N/A
Internet
Passenger
N/A N/A N/A
Insurance
SOURCE: WRI India;
P = predetermined through demand estimation and crowdsourcing
1 2 | www.WRIcitiesIndia.org4. REGULATORY CONSIDERATIONS
Bus aggregator services have been mostly provided by the private sector around the world.
While many providers began services, some have terminated operations within months,
including Limo in Mumbai. Often the reasons for failure may be traced back to the lack of
viability of the business model and regulatory challenges in India. This section provides the
regulatory assessment for the operations of bus aggregator services and the view point of key
stakeholders. Table 6 describes key stakeholders to define the environment in which bus
aggregators operate in India. The influence and perspective of these stakeholders are covered
as follows.
Table 6: Mapping Stakeholders in the Bus Aggregator Model
Stakeholder Role
Transport Department & Issue of licenses, permits and fitness certificates for vehicles; Fare
Regional Transport setting; Emission checks; Levying taxes and fees; Setting rules for
Authority (RTA) Parking, etc.
State Transport Public bus service provision; Route selection for operation of bus
Undertaking (STU) services; Ability to form a Special Purpose Vehicle (SPV) or forge
partnerships with private sector.
Bus Aggregator Provision of technology to match passenger demand with supply of
buses; Fare collection.
Asset owners Operation of bus services; Lease of assets including buses to other
operators
Commuters Citizens travelling using services of STUs or Bus Aggregators
Unions Protection of employee interests in various STUs
SOURCE: WRI India
4.1 MOTOR VEHICLES ACT
Road transportation in India is governed by the Motor Vehicles Act of 1988. The Act
classifies public bus services to be of two types based on the nature of service provided: stage
carriage or contract carriage (Table 7).
1 3 | www.WRIcitiesIndia.orgTable 7: Public bus types in India
A “stage carriage means a motor vehicle constructed or adapted to carry more than six passengers
excluding the driver for hire or reward at separate fares paid by or for individual passengers, either for
the whole journey or for stages of the journey”.
- Section 2(40) of Motor Vehicles Act, 1988
A “contract carriage means a motor vehicle which carries a passenger or passengers for hire or
reward and is engaged under a contract, whether expressed or implied, for the use of such vehicle as
a whole for the carriage of passengers mentioned therein and entered into by a person with a holder
of a permit in relation to such vehicle or any person authorized by him in this behalf on a fixed or an
agreed rate or sum –
(a) on a time basis, whether or not with reference to any route or distance; or
(b) from one point to another,
and in either case, without stopping to pick up or set down passengers not included in the contract
anywhere during the journey, and includes –
(i) a maxicab; and
(ii) a motorcab notwithstanding that separate fares are charged for its passengers”
- Section 2 (7) of Motor Vehicles Act, 1988
Permits to operate stage carriage services are mostly reserved for STUs in major Indian cities
including Bengaluru, Chennai and Mumbai. This has been deemed essential by Courts to
prevent uneconomic competition from impacting essential public services. An example may
be found in the Supreme Court ruling (BA Lingareddy vs KSRTC) discussed below:
In October 1962, the Karnataka State Road Transport Corporation (KSRTC) notified the Bellary
Scheme by which the Corporation proposed operating stage carriage services on the 86 routes in the
Bellary sector. The notification was approved and subsequently published by the State Government in
the gazette, providing for the operation of stage carriages by STUs only and allowed no exemptions.
There were however, stage carriage permit holders other than the STUs before and at the time of
such a gazette notification. The Bellary scheme was modified in 1980 to allow such permit holders to
operate stage carriages on routes that did not overlap the 86 notified by the scheme.
Subsequently, a case in the Supreme Court of India – BA Lingareddy vs KSRTC- set out to quash the
orders modifying the Bellary Scheme awarding monopoly to the Bangalore Metropolitan Transport
Corporation (BMTC), the successor of KSRTC in operating stage- carriages in Bengaluru. As such,
under the current scenario, a private operator will not be granted a stage carriage permit under
ordinary circumstances.
Privately owned buses are, therefore, mostly awarded permits to operate contract carriage
services. Under this permit, aggregator bus services may not stop en route to pick up or set
down passengers, a practice indicated by the route details published on their webpages
(Figures 4 & 5). As learnt from multiple interactions, however, STUs share a view that bus
1 4 | www.WRIcitiesIndia.orgaggregator services currently halt at various points along a route to pick up or set down
passengers.
In such cases, Regional Transport Authorities have been instrumental in suspending
aggregator services citing their violation of the STU monopoly. Such a situation may be the
result of a subjective interpretation of the contract carriage definition (Table-7).
The Contract Carriage definition,
Requires transport operators to enter a contract with passengers, who are to be
transported from one destination to another.
Does not allow those not party to the contract to be picked up or set down en route.
The ambiguity in this definition lies in the nature and validity of the contract mentioned.
While a contract may be any agreement, expressed or implied, between passengers and a
transport service provider, the definition lacks clarity on the number of contracts that may
be entered into.
Clarity on the issue may be found in the Supreme Court’s ruling in The State of Andhra
Pradesh vs B.Noorullla Khan, which states that the words “under a contract” in Sec 2(7) of
the Act refer to a single contract made for the vehicle as a whole, that is under ‘a contract’. It
remains valid from the time of departure of the public service vehicle from its origin, to its
arrival at the stated destination. The creation of a second contract with a new passenger en
route, therefore, would conclude the validity of the initial contract. In such a case, picking up
new passengers from different points along the route would amount to operating as a stage
carriage.
While aggregators may not be creating multiple contracts and may only allow the boarding
or alighting of passengers included in the initial contract, RTAs have been challenged in the
monitoring of operations. In the absence of regulation requiring transparency from the
aggregators, therefore, the possibility of creation of multiple contracts has been linked to the
violation of the stage carriage monopoly granted to STUs, serving as grounds for the
suspension of aggregator services.
Private buses may, however, apply for a stage carriage permit where STUs have not been
granted exclusive rights to operate public transport. Examples include Delhi and smaller
cities such as Coimbatore.
4.1.1 VIEWS OF STUS
Opinions on the potential impact of bus aggregator services have been mixed across the
country. While STUs in some cities, such as Jaipur, have initiated assessments to study the
ability of bus aggregator services to reduce road congestion and urban pollution, others view
the model as a challenge to their operations. In Bengaluru and Mumbai, bus aggregator
services have been perceived as a direct competition to their city bus operations. This
resulted in STUs urging the transport departments in the states of Karnataka and
Maharashtra to suspend these services (Bhat and Bharadwaj, 2015; Korde, 2016).
1 5 | www.WRIcitiesIndia.orgAll major STUs operate air-conditioned bus services to improve comfort levels for
passengers and encourage private vehicles users to shift to buses. The fleet allocation by
major STUs is listed in Table 8.
Table 8: STU bus fleets by type
STU Total Fleet Premium buses Premium fleet %
BEST 4143 262 6.32
BMTC 6169 650 10.54
DTC 4501 1223 27.17
MTC 4032 97 2.40
SOURCE: Interviews with STUs
While small in proportion, demand for premium public transport is restricted primarily to
routes linking key business and technology hubs in a city to residential districts. Focus group
discussions (Appendix-1) conducted as part of the research for this paper indicated that
STUs were concerned about the detrimental financial impact of a rise in capacity along
premium routes due to aggregator services. In many cities, premium routes are the profit-
making routes for STUs that help in cross subsidizing the services along regular routes
serving low income communities. The rationale behind the concern is due to comparable
fares presented in Fig-7 of this report.
STUs, however, recognize a potential to regulate clandestine stage carriage bus operations
through aggregators. Clandestine bus services are typically contract carriage permit holders
operating stage carriage services to complement earnings from their regular operations. The
existence of such services may reflect the unmet demand in the city by STU services. As
clandestine services are often the services aggregated, STUs share an opinion that they may
be regulated through partnerships with Aggregators (Appendix-1).
4.1.2 VIEWS OF AGGREGATORS
Aggregators stress on compliance with the contract carriage permit with the claim that most
of their boarding and alighting of passengers happens only within the first and last few
kilometers of the journey and not during the entire journey. Their other contention is that
passengers are not hailed on-road and the operator has information about the passengers
before the beginning of the journey as required under the contract carriage permit.
Further, the aggregators contend their services are on routes that have unmet passenger
demand that may rely on private vehicles, thus contributing to congestion. In view of their
potential to alleviate congestion in such cases, the aggregators seek clarity on regulations,
the ambiguity in which has led to their services being suspended. Both claims, however, may
be questionable, as understood from the route and stop information offered on the webpages
of aggregators (Fig-4 and Fig-5) and route information published by STUs.
1 6 | www.WRIcitiesIndia.orgFigure 6: Bus aggregation in India: A Timeline
SOURCE: WRI India
1 7 | www.WRIcitiesIndia.org4.1.3 RECENT REGULATION
The recognition of bus aggregators as an evolution of conventional bus systems, with
potential to reduce urban road congestion, has resulted in the following government-led
initiatives to regulate the model:
Rules for aggregators in the Road Transport Safety Bill 2015
App-based Premium Bus Scheme formulated by the Government of Delhi
Though neither are in effect at the time of writing this report, for reasons described below,
these rules reflect the views of governments and provide an idea of what might be expected
from future regulation.
Regulation of bus aggregators may be essential to create a level playing field in the provision
of urban public bus services, as aggregators and STUs currently face different regulations
(Table 9). As existing rules favor one provider of public buses over another in various
instances, the consequences for urban society makes the case for regulation.
Table 9: Regulatory constraints for STUs and bus aggregators
Stage Contract
Regulation
Carriage Carriage
Fare Setting
Route Selection +
(While applying for permits)
Timetable Adherence
(On record)
Minimum Service Obligations
Vehicle Insurance *
Vehicle Fitness Certification
SOURCE: WRI India.
+ = Contract Carriage application requires areas of operation to be specified
* = STUs may be exempt under Section 146 of the Motor Vehicles Act of 1988
Road Transport and Safety Bill 2015
In 2015, the Ministry of Road Transport and Highways drafted the Road Transport and
Safety Bill (RTSB). Primarily concerned with various aspects of improving road safety, the
bill address contemporary issues with public transport, as part of which it defines the role of
aggregators.
As per the definition, aggregators are ‘digital intermediaries or marketplace for a passenger
to connect with a driver’ of a passenger vehicle, who may not own or lease vehicles
1 8 | www.WRIcitiesIndia.orgthemselves, or employ drivers unless they register themselves to be ‘taxi operators’ (Section
3(40) of the RTSB, 2015).
Further, Section 160 of the draft sets out guidelines for improving transparency in
aggregator operations. Aggregators are directed to share the following information with
transport authorities:
Number of trips operated and passengers served
Fare structure used
Scheduled and effective kilometers operated.
While Section 93 of the Motor Vehicles Act of 1988 treats aggregators as agents in the sale of
tickets for travel on buses, Section 3(40) of the RTSB 2015 defines aggregators and the
manner in which they may conduct their operations. Section 160, however, may not result in
the transparency required to conclusively establish any violation of stage carriage monopoly
as described in Section 4.1.2 of this brief. The Bill also recommends the drafting of national
standards for vehicle safety (Section 50) following relevant stakeholder consultation, which
may impact aggregator and STU bus operations.
The Road Transport and Safety Bill 2015 was introduced at Parliament in August 2016, when
it was cleared by the Union Cabinet. Its provisions are yet to come into force at the time of
writing this paper, as the bill awaits being passed into law by the Parliament.
App-based Premium Bus Services Scheme 2016
The Scheme for App-based Premium Bus services, drafted by the Government of the
National Capital Territory of Delhi in May 2016, was premised on limitations of conventional
bus services in encouraging private vehicle use, the growth of which had resulted in
congestion and air pollution in the National Capital Territory. Bus aggregator services were
viewed as a means of reducing private vehicle dependence.
The scheme was to apply to all contract and stage carriage buses in the region that an
aggregator or provider of information technology services could connect passengers with.
Aggregators were directed to ‘engage at least 50 premium buses’ and determine the routes
on which they may ply. Fares were to be determined by the market and regulated by the
government only if a need arose to prevent predatory pricing.
Passengers and aggregators were required to enter a contract, for the use of a premium bus
in whole and not a part. The latter were directed to post a ‘passenger manifest’ on their web-
based applications no later than five minutes prior to the commencement of a service. This
would prevent any disagreements between transport authorities and aggregators with
regards to the creation of contracts under Sec 2(7) of the Motor Vehicles Act of 1988.
The guidelines also set standards for operations under various circumstances. In the event of
a breakdown of a premium bus, for instance, the guidelines recommended aggregators
arrange alternative modes for the completion of the trip, or risk incurring a penalty. For
ensuring the safety of women, aggregators were to enable a ‘panic button’ on their mobile
application.
1 9 | www.WRIcitiesIndia.orgThrough the publishing of these guidelines, the Government of National Capital Territory of
Delhi formally recognized bus aggregator services as a requirement for large cities. These
guidelines, however, did not address a few issues crucial for the efficient operation of app-
based premium buses:
Prevention of competition between bus aggregators and conventional bus operators.
Optimum fare setting recommendations.
Service level benchmarks
Sharing of specific data to enable future improvements of public transport
For political reasons beyond the scope of this paper, the guidelines did not come into force
on the date mentioned therein. No such guidelines have since been published by other state
governments for the implementation of bus aggregator services in their cities.
4.2 ECONOMIC CONSIDERATIONS
At the time of compiling this report, aggregators have been in operation for two years in
various Indian cities. While gaps in conventional public transport service quality may explain
the demand for aggregator services, sustained service provisions may also be attributed to
lower costs of operations in comparison with STUs.
4.2.1 COST OF OPERATIONS
With the exception of Gurgaon, bus aggregators in India operate in cities with mature public
transport networks. In the absence of partnerships in such an environment, lower costs of
operations play a significant role in sustaining operations, which aggregators have been able
to achieve with the use of mini buses and technology, and through their business model.
The differences in costs of operations between STUs and aggregators may be understood as
follows:
20 | www.WRIcitiesIndia.orgTable 10: Costs of Operation (per km) for various public transport providers
Private
STU BEST BMTC DTC Aggregator^
Operator*
Staff ₹ 53.68 (30.4%) ₹ 26.14 (34.1%) ₹ 35.57 (46.1%) ₹ 17.45 (38.3%) ₹ 5 (17.2%)
Fuel ₹ 22.87 (13%) ₹ 24.28 (31.6%) ₹ 18.47 (23.9%) ₹ 16.57 (36.4%) ₹ 8.57 (29.5%)
Maintenance ₹ 17.75 (10%) ₹ 8.91 (11.6%) N/A ₹ 5 (11%) ₹ 4 (13.8%)
Depreciation ₹ 18.08 (10.2%) ₹ 7.95 (10.3%) ₹ 10.21 (6.6%) ₹ 6.21 (13.6%) ₹ 4 (13.8%)
Tax N/A ₹ 3.63 (4.7%) ₹ 0.59 (0.07%) ₹ 0.27 (0.6%) ₹ 3.87 (13.3%)
Other
₹ 77.35 (43.8%) ₹ 5.74 (7.4%) N/A Nil ₹ 3.56 (12.3%)
Costs**
TOTAL ₹ 176.29 ₹ 76.65 ₹ 77.02 ₹ 45.50 ₹ 29
Bus Type Standard-sized Standard-sized Standard-sized Standard-sized
Mini bus (20)
(seats) (42) (42) (42) (42)
CPKM per
₹ 4.19 ₹ 1.82 ₹ 1.85 ₹ 1.08 ₹ 1.45
seat
SOURCES: Interviews with BEST, BMTC DTC and Aggregator in Bengaluru;
* = Public-Private Partnership in Bhopal;
^ = Aggregator; CPKM = Costs per Kilometer;
**= Other costs for STUs include interest on capital expenditure. Similarly, aggregators incur technology and
marketing costs.
Table 10 describes the costs incurred by various public bus operators for every kilometer of
service provided. While the total cost of operations per kilometer for aggregators was
confirmed through interviews, its breakdown was deduced using market averages, tax
guidelines and standard practices in computing fuel consumption and depreciation. The
assumptions made in this regard, including the technology costs involved in the bus
aggregator model, are presented later in this section, where the viability of the bus
aggregator model is assessed. Other costs and savings for aggregators may be further
understood through the following assessment of individual cost components listed in the
table. These assessments reflect lower costs incurred by aggregators when compared w ith
STUs, as indicated by the cost per kilometer per seat in the table above.
Crew and Staff Costs
While STUs and other conventional bus service providers employ a crew of two personnel
per bus: a driver and a conductor, the use of technology enables bus aggregators to eliminate
the need for a conductor. In addition, wages paid to the drivers for aggregator services do not
include welfare components that are standard provisions at STUs (Table 11)
21 | www.WRIcitiesIndia.orgTable 11: Standard employee benefits included in STU crew wages
Though there may be variations at different STUs, the following benefits are among those offered to
employees, including the bus driver and conductor:
Provident Fund Children’s education allowance
House Rent Allowance Dearness Allowance
Free health check ups Rewards for safe driving
Contributions to pension Incentives for fuel saving
SOURCE: Interviews with STUs
Further, the staff requirements of STUs are higher to support their citywide operations and
due to the shift system used to provide extended hours of service. These include driver
trainers, maintenance workshop staff, lawyers and public relations staff. Currently,
Aggregators are not involved in any maintenance of buses and may require fewer human
resources given their smaller scale of operations and business model, which places the
responsibility of vehicle maintenance on its owners.
Fuel Efficiency
Among the many factors influencing the fuel efficiency of a vehicle, its size and the nature of
operations play a significant role. Physical parameters such as vehicle weight and vehicle
load significantly impact the fuel efficiency of a vehicle, with fuel consumption increasing
with weight. (Pelkmans et al, 2001: 657). While STUs provide premium public transport
services on standard-sized buses seating over 40 passengers, aggregator services have thus
far been run on lighter, mini buses with about 20 seats that have higher fuel efficiency.
Table 12: Fuel consumption of various buses
Fuel Consumption
Bus Type
km per litre ml per seat km
Standard-sized (42 seats), air-conditioned 2 - 2.5
9.5 – 12 ml
bus
Standard-sized, regular bus 3.5 - 4 6 – 6.80 ml
Mini bus (20 seats), air-conditioned 8-9 5.5 – 6.25 ml
SOURCE: Interviews
Though the mini buses used by aggregators may consume less fuel per kilometer run (Table-
12), fuel consumed by such buses on a per seat kilometer basis appears to significantly
reduce any cost savings in comparison with STU operated bus services.
Maintenance Costs
Table 13 shows the average daily kilometers’ usage of buses by leading STUs in the country.
High usage of buses in urban areas increases costs due to frequent spare parts, tyre and
battery replacements. The purchase of spares from original equipment manufacturers
(OEM), and the cost of in-house maintenance by STUs keeps their costs high in comparison
to bus aggregators, who are not responsible for any maintenance today. The distance
22 | www.WRIcitiesIndia.orgcovered by an aggregator bus each day may be understood from relevant costs as shown in
Table 17.
Table 13: Vehicle Productivity at STUs
STU 2014-15 (Kms/day)
BEST 157.29
BMTC 194.02
DTC 158.04
MTC 254.27
SOURCE: MoRTH (2016c)
Depreciation
High usage of buses by STUs also impacts their depreciation. Depreciation of buses is
measured from the cost of a vehicle and the distance it covers in 8 years, which is the useful
life of a bus as prescribed by the Companies Act of 2013. Useful life is the time period over
which an asset, in this case a bus, may be available for use. Therefore,
Depreciation = P/[M x 12months x 8years]
Where,
P = price of the bus, and M = monthly usage of a bus, in Kilometers.
Currently, bus aggregators operate fewer kilometers each day compared to STUs, and mini
buses used by aggregators cost less (Rs.10-15 lakhs) than standard-sized buses (Rs.35-40
lakhs) used by STUs. From the formula above, therefore, it may be noted that STU-operated
buses face higher depreciation costs, thus increasing the overall cost of operations.
Taxation
The assessment of the impact of taxation on cost comparisons between STU and aggregator
services may not be as direct as the other components discussed above. With states
responsible for its setting, Motor Vehicles Tax varies from one state to another, both by rate
and method of computation. Taxation also varies for stage and contract carriages.
For instance, while the tax rate for contract carriage buses with more than 12 seats is set at
₹ 1500 quarterly per seat (Transport Department, 2017) in Karnataka, it is set at ₹ 1700
annually per seat in Maharashtra, if the vehicle seats fewer than 25 passengers (Motor
Vehicles Department, 2017). For STU operated stage carriage buses, on the other hand,
Karnataka and Maharashtra tax ₹ 3957 and ₹ 71 annually per seat (Motor Vehicles
Department, 2017) respectively.
23 | www.WRIcitiesIndia.orgTable 14: Annual taxation for Karnataka and Maharashtra
Permit Type Karnataka Maharashtra
Contract Carriage, per bus* ₹ 252,000 ₹ 79,800
Contract Carriage, per mini bus ₹ 120,000 ₹ 34,000
Stage Carriage, per bus* ₹ 166,194 ₹ 2982
SOURCE: Transport Department (2017); Motor Vehicles Department (2017);
* = standard-sized bus with 42 seats ; mini bus assumed here to seat 20 passengers.
As indicated by Table-14, though STU operated stage carriage buses appear to be taxed less
in general, Aggregators pay less in tax per contract carriage minibus operated in Bengaluru.
The tax environment may, therefore, favor the aggregators depending on the state where
operations are based. The periodic revision of tax rates applicable in various states limits this
paper’s ability to make long-term projections.
4.2.2 VIABILITY OF OPERATIONS
The viability of their business model holds key to the future of aggregator bus services in
India. Aggregators have thus far leased privately owned buses for an agreed period and sum ,
the details of which have been confirmed through interviews and secondary sources. This
information is used here to derive relevant costs to ascertain the viability of aggregator bus
operations for both stakeholders: the technology providers or aggregators, and the owners of
buses. Table 15 details the assumptions made and calculations performed.
24 | www.WRIcitiesIndia.orgTable 15: Viability of aggregator bus services
1. Known Variables:
(i) Costs per Kilometre (CPKM) of operating a 20-seater mini bus: ₹29
(ii) Amount paid to Lessors of buses, per month (as learnt from interviews with aggregators):
₹75,000
2. Assumptions made:
(a) Average trip length: calculated from routes operated by aggregators in Bengaluru
(b) Fare range for a trip length of 25kms: estimates from aggregator websites; assumption made
to be ₹100 in light of dynamic fares used.
(c) Cost of High Speed Diesel (HSD) assumed to be ₹60 per litre.
(d) Maintenance costs (₹4 per kilometer) & Insurance per month per bus (₹1250) derived from
market average.
(e) Driver wages (₹15,000 per month) derived from market average.
(f) Admin costs for aggregators:
- Number of employees assumed to be 20.
- Average salary of employees assumed to be ₹500,000 annually.
- assuming 50 buses leased, admin costs per bus per month estimated to be:
[(500,000 x 20)/12]/50 = ₹16,667 …(iii)
(g) Dead kilometres assumed to be 25% of total distance covered per day.
(h) Depreciation: P/(Mx12x8), as described in Section 4.2.1. Here, P = price of mini bus, which
market estimates indicate to be around ₹10,00,000.
3. Viability for Aggregators:
From (i) and (ii), kilometers paid for per bus = 2586.21km
Therefore, daily kilometers paid for per bus = 99.47km
From (a), average trip length = 25km.
Accounting for dead kilometers (g), number of revenue trips per bus per day = 3 trips.
Revenue required per trip to break even = [(ii + iii)/30]/3 = ₹1018.52
From (b), load factor per trip required for aggregator to break even = 51%
4. Viability for Bus Owners:
If fuel economy is 7kmpl, fuel required to cover 2586.21km = 369.45 litres.
From (c), cost of fuel = ₹22167
From (h), Depreciation per km = ₹10,00,000/ (2586.21x12x8) = ₹4.02
Therefore, Depreciation per month = ₹10396.56
Total costs for bus owners = 22167 + 10396.56 + 15,000 + 1250 + (2586.21 x 4) = ₹59158.40
SOURCE: Interviews with aggregators; WRI India
Calculations based on the information available indicate a profit per bus for its owners, and a
bus over half full for the length of a trip as a requirement for aggregators to recover costs.
These costs are before the computation of tax, which if included may impact breakeven loads
required for profitability depending on the State in which operations are based. The
calculations here have not taken into account the technology costs incurred by aggregators.
25 | www.WRIcitiesIndia.org4.2.3 SERVICE OPERATIONS
The viability assessment presented above reflects the current regulatory environment where
aggregators have not been expected to fulfill minimum service obligations, offer alternative
arrangements in the event of breakdown en route, or adhere to schedules. Aggregators are
currently not bound by regulation to provide services throughout the day and may restrict
operations only to peak hours or cancel a trip if adequate seats have not been booked.
STUs, on the other hand, are required to operate services regardless of demand or the time
of the day, which increases their fleet and manpower requirements. Such differences in
operations allow aggregators to keep costs low .
4.2.4 FARES
As the Delhi government’s Scheme for App-based Premium bus services noted, bus
aggregator services have the potential to shift users of single occupancy vehicles to mass
transit and help alleviate urban road congestion. While the ride comfort offered by bus
aggregator services may be attractive it is yet to be seen if private vehicle users will switch to
these services.
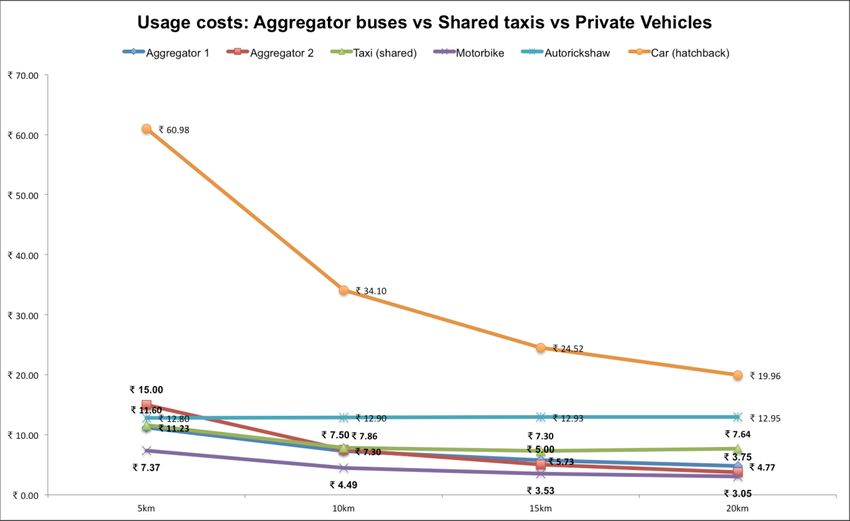
Figure 7 and Figure 8 compare fares on aggregator bus services with other modes of urban
transport. This comparison uses average costs of usage of shared taxis, two-wheelers and
hatchback cars, which were determined through inputs from respective users.
Figure 7: Fare comparison of bus aggregator with STU premium buses
SOURCE: WRI India
26 | www.WRIcitiesIndia.orgThe pricing of bus aggregator services may currently be located in Indian cities between air-
conditioned STU bus services and shared taxi services. For the first 10 kilometers of a journey,
however, bus aggregator fares and shared taxi fares have been found to be similar.
Figure 8: Fare comparison of bus aggregators with private vehicles
SOURCE: WRI India
While these shared taxis and bus aggregators compete for demand from the users of cars and
taxis, their ability to shift users of two-wheelers appears to be limited only on the basis of
cost comparisons.
4.3 SOCIAL CONSIDERATION
State Transport Undertakings fulfill the social obligation of providing essential transport
links in Indian cities. Yet the national discourse on the bus aggregator subject has been
limited to regulatory issues without taking into consideration the social concerns. This
section seeks to introduce such concerns to discussions on aggregator bus services through
the following issues.
4.3.1 DRIVER WAGES
In addition to the basic salary, State Transport Undertakings provide benefits including
medical allowances, insurance and pension contributions (Table 16) to their drivers, and
other staff. As per their current business model, the private sector may not extend these
benefits to their drivers. However, it is possible that drivers of aggregator services may be
paid higher wages compared to drivers of informal public transport services, which will be
confirmed through surveys.
27 | www.WRIcitiesIndia.orgTable 16: Wages and benefits for bus drivers
Basic Pay Annual
Operator Pension Gratuity
(monthly) Increments
BMTC ₹ 15,000
Private
₹ 17,000
Operator
Aggregators ₹ 13000-15000
SOURCE: Interviews, Purple Bhopal webpage
4.3.2 RISKS FOR LESSORS
The model may leave bus owners in a similar financial predicament as drivers. While bus
owners are compensated monthly by aggregators, the tenure of the lease for the bus may be
impacted by estimation of future demand and political risks (Section 4.1).
Uncertainty in the extension or renewal of leases poses risks for lessors, who may be liable to
the debt incurred on assets such as their buses. These constraints may, in turn, impact the
salary paid to drivers by bus owners.
4.3.3 PASSENGER SAFETY AND SECURITY
Bus aggregators in India and around the world are equipped with provisions that ensure the
security of passengers. Passenger information collected during ticket reservation could be
used to ensure their accountability while CCTVs installed could enhance security. In the
matter of passenger safety during a commute, however, it remains uncertain if bus
aggregators offer passenger insurance, which is standard on similar services in other
countries.
State Transport Undertakings, on the other hand, have policies and procedures in place to
compensate passengers in the event of an accident (Table 17). Some STUs might offer
insurance as part of their monthly passes. For instance, BMTC offers insurance covers
amounting to ₹ 1, 00,000 and ₹ 5, 00,000 to their daily and monthly pass holders
respectively (BMTC, 2017).
Table 17: Accident Compensation paid by STUs
BMTC BEST
Year
Cases Amount Paid Cases Amount Paid
Compensated (Crore INR) Compensated (Crore INR)
2012-13 18 0.24 257 4.49
2013-14 76 1.76 231 5.13
2014-15 135 4.12 353 7.31
SOURCES: Interviews with STUs
28 | www.WRIcitiesIndia.orgWhile Chapter XI of the Motor Vehicles Act (1988) requires an insurance cover for a vehicle
and passengers, verification may occur only during the grant of a permit for the vehicle. In
the absence of periodic checks or verifications, private operators of bus services may not be
sufficiently incentivized to offer passenger insurance due to the additional costs involved in
its provision.
4.3.4 VEHICLE MAINTENANCE
The maintenance of public buses has implications for both the owners of the bus and its
users or passengers. Poor maintenance can result in disruption of public transport services
due to frequent breakdowns, which add to the costs of the owners of the bus.
Proper maintenance is also required to maintain optimum fuel efficiency of the vehicle
(Vasudevan and Mulukutla, 2014). While major State Transport Undertakings in India have
developed in-house capabilities to ensure the proper maintenance of buses, the bus
aggregator model limits itself to the allocation of costs for maintenance.
The frequency of bus maintenance is determined based on a number of factors including
distance covered, hours of operations, period between maintenance checks, and fuel
consumption. While compensating bus owners for maintenance, the bus aggregator model,
in its current form, may not explicitly bind bus owners to such maintenance schedules,
presenting setbacks for bus owners and passengers.
4.3.5 STOPS AND PARKING
The bus aggregator model similarly lacks clear guidelines for the stopping of buses en route,
and their parking when not in use. While STU operated buses are bound by Section 72 of the
Motor Vehicles Act of 1988 to stop only at specified locations, bus aggregator services may
stop at random along their routes. This could result in obstruction to road access and impact
road safety especially where intersections and turnings are involved.
Similarly, while State Transport Undertakings have invested in depots to park their buses
when not in use, the bus aggregator model currently relies on the availability of space on the
sides of major roads and residential streets in a city, as bus owners may not own or have
access to shelters.
4.3.6 CONGESTION AND ENVIRONMENT
As discussed earlier in Section 4.2.4, current fare levels on aggregator services are well suited
to incentivize a shift of car users to mass transit. The same, however, may not be true for
those using motorbikes for their daily commute. As such, the ability of bus aggregator
services to reduce single occupancy vehicle trips and, therefore, alleviate road congestion
and mitigate air pollution remains unclear due to their current scale of operations. Table 18
presents the summary of various challenges for the different public bus providers in India.
29 | www.WRIcitiesIndia.orgTable 18: Challenges for public bus providers in Indian cities
STU Aggregator
Regulatory Compliance
Procured as per Sec 93 of the
License Licensed by State
Motor Vehicles Act of 1988
Permit May benefit from monopoly Constraints vary by state
Fare Setting ↓ ↑
Minimum Service Obligations ↓ ↑
Economic Challenges
CPKM ↓ ↑
Fares ↓ ↑
Taxation ↓ ↑*
Social Impact
on Congestion PT usage alleviates congestion ?
PT usage combines trips,
on Emissions ?
reducing emissions
Employee welfare ↑ ↓
SOURCE: WRI India;
↑ = favoured/favours ; ↓ = constrained/does not favour;
? = unknown; * = varies by state
30 | www.WRIcitiesIndia.org5. WAY FORWARD
It is widely known that cities across the country require bus fleet augmentation. In this
context, regulation of bus aggregation could address the concerns described in Section 4 of
this paper and thus safeguard the interest of all relevant stakeholders.
From the perspective of the road space occupied per person and fuel consumed per person
kilometer both the bus aggregator model and the STU operations are comparable. Hence,
aggregator model could support fleet augmentation in cities and lead to a sustainable
alternative over personal modes. However, it needs to be seen if these operations are
complementing the STU operations.
The addition of a technology layer to public transit is welcome, as it allows for improving the
efficiency in demand management and overall customer experience. Providing affordable
transport services with alternative options for the citizens should be of prime importance.
The paper calls for further research and dialogue between various stakeholders to provide
bus services that are accessible to all.
The next steps could focus on the regulatory framework for public-private partnerships.
Impact analysis based on data from aggregators will help in framing the regulations around
minimum service level benchmarks and contracting procedures for bus operations by the
aggregators, and maintenance norms of buses for ensuring passenger safety thus improving
the overall service provision in a city.
31 | www.WRIcitiesIndia.org6. REFERENCES
Agarwal, O.P. (2006) “Urban Transport” in Rastogi, A. (2006) India Infrastructure Report.
New Delhi: Oxford University Press, pp 106-128.
Bhat, A. and Bharadwaj, K.V. (2015) App-based aggregator suspends shuttle bus services for
want of permit, The Hindu, 20 September. Available from:
http://www.thehindu.com/news/cities/bangalore/appbased-aggregator-suspends-shuttle-
bus-services-for-want-of-permit/article7670500.ece
BMTC (2017) Performance Indicators [online] Available from:
https://www.mybmtc.com/performance-indicator [Accessed 12 Feb 2017]
BMTC (2017) Press release titled Introduction of Volvo feeder services special daily pass of
Rs. 80/- and Monthly pass of Rs.1500/- for services operating from Swami Vivekananda
Metro Station to ITPL. Dated 16 Feb 2017
CAG (2016) Report of the Comptroller and Auditor General of India on Revenue and Social
& Economic Sectors (PSUs) for the year ended 31 March 2015 [online] Available from:
http://www.cag.gov.in/sites/default/files/audit_report_files/Report%201%20of%202016%
20-%20PSUs%20-
%20Revenue%2C%20Social%2C%20Economic%20Sector%20Government%20of%20Delhi.
pdf [Accessed 12 Feb 2017]
CSTEP (2014) Review of Urban Transport in India [online] Available from:
http://www.indiaenvironmentportal.org.in/files/file/Review%20of%20Urban%20Transport
%20in%20India.pdf [Accessed on 14 Feb 2017]
Census of India (2011) Rural Urban Distribution of Population. Ministry of Home Affairs,
Government of India
Government of India (2016) Performance of State Road Transport Undertakings (SRTUs)
[online] Available from: http://morth.nic.in/index2.asp?slid=946&sublinkid=545&lang=1
[Accessed 14 Feb 2017]
Korde, K. (2016) 5 app-based buses seized in RTO crackdown, Hindustan Times, 21 April.
Available from: http://www.hindustantimes.com/mumbai/5-app-based-buses-seized-in-
rto-crackdown/story-MJlgdz7FgheBxT9EtJKUXM.html
MoRTH (2016a) State-wise physical performance of State Road Transport Undertakings
(SRTUs) in India – Part IV (online). Available from:
http://www.indiastat.com/table/transport/30/physicalperformanceofstateroadtransportun
dertakings19852015/452574/916071/data.aspx
MoRTH (2016b) Total number of registered motor vehicles in India (online). Available from:
http://www.indiastat.com/table/transport/30/registeredvehicles/16443/6121/data.aspx
32 | www.WRIcitiesIndia.orgMoRTH (2016) Review of the Performance of State Road Transport Undertakings
(Passenger Services) for April 2014-March 2015 [online] Available from:
http://morth.nic.in/showfile.asp?lid=2025
Motor Vehicles Department (2017) Basic Taxation, Government of Maharashtra [online]
Available from: https://transport.maharashtra.gov.in/1117/Basic-Taxation
Pangotra, P. and Sharma, S. (2006) Modeling Travel Demand in a Metropolitan City: Case
Study of Bangalore, India. Indian Institute of Management, Ahmedabad.
Paulley, N., Balcombe, R., Mackett, R., Titheridge, H., Preston, J.M., Wardman, M.R.,
Shires, J.D. and White, P. (2006) The demand for public transport: the effects of fares,
quality of service, income and car ownership. Transport Policy 13(4): 295-306.
Pelkmans, L., de Keukeleere, D., and Lenaers, G. (2001) Emissions and fuel consumption of
natural gas powered city buses versus diesel buses in real city traffic. Transactions on the
Built Environment 52: 651-660.
Pucher, J., Korattyswaroopam, N., Ittyerah, N. (2004) The Crisis of Public Transport in
India: Overwhelming needs but limited resources. Journal of Public Transport 7(3): 95-113.
Transport Department (2017) Schedule – Part A (Tax for Home State Vehicles), Government
of Karnataka [online] Available from:
http://transport.karnataka.gov.in/index.php/information/details/sechdule_part_A
UMTC (2011) Bangalore Mobility Indicators 2010-11. [online] Available from:
http://www.urbantransport.kar.gov.in/Bangalore%20Mobility%20Indicators_(22-12-
2011).pdf [Accessed 14 Feb 2017]
Vasudevan, P. and Mulukutla, P. (2014) Bus Karo 2.0: Case Studies from India. WRI Ross
Centre for Sustainable Cities.
Verma, M., Verma, A., Ajith, P., Sindhe, S. (2013) “Urban Bus Transport Service Quality and
Sustainable Development: Understanding the Gaps” in 13th World Conference on Transport
Research. Rio de Janeiro, 15-18 July 2013.
33 | www.WRIcitiesIndia.orgYou can also read