Energy, Resources & Marine Travel Forecast 2018 - Carlson Wagonlit ...

Page created by Jimmie Grant
 
CONTINUE READING
Energy, Resources & Marine Travel Forecast 2018 - Carlson Wagonlit ...
2018
Energy,
Resources
& Marine
Travel Forecast

     FLIGHTS
     ENERGY
MAKE THE WORLD WORK FOR YOU
     RESOURCES
     MARINE

                  Published September 2017
Energy, Resources & Marine Travel Forecast 2018 - Carlson Wagonlit ...
Table of contents
                                                                       Global macroeconomic overview     4

                                                                       Energy                            5

                                                                       Resources                         6

           “It's taken several years, but                              Marine                             7
          companies are now set up to
                                                                       Impact on travel                  8
         operate with profits despite the
       lower price of oil. As a result, we're                          Regional forecasts:
                                                                        > Americas                       10
         seeing increased investments in                                > Europe, Middle East & Africa   12
        the industry. It's invigorating the                             > Asia Pacific                   14

                entire supply chain.”                                  Recommendations                   16
                          – Raphaël Pasdeloup, Senior Vice President
                                 CWT Energy, Resources and Marine

© CWT 2017                                                                                                     2
Energy, Resources & Marine Travel Forecast 2018 - Carlson Wagonlit ...
Welcome                                                                                          INDUSTRY SPOTLIGHT FROM OUR SPONSOR
                 Welcome to our 2018 travel forecast for the Energy, Resources and
                 Marine (ERM) industries. While an unstable global economy leaves                              United Airlines is proud to continue our strong
                 the ERM industries in a state of uncertainty, the tides of recovery are                       partnership with Carlson Wagonlit Travel in providing
                 slowly rippling through sections of all three industries. However, the                        this Energy, Resources and Marine forecast to help
                 immediate future isn’t bright for all players—the deeper we delve                             guide and develop the planning of your travel program
                 into each industry, the more variations we unearth.                                           for the year ahead.
The energy sector is still affected by volatility in the oil and gas industries, as both                      As Houston’s largest airline and major area employer,
adapt to oil prices fluctuating around $40-50 a barrel. However, modest increases in         we have shared in the challenges the energy sector has faced in recent
price have seen the Big Five increase their capital expenditures and this confidence has     years, but our commitment to you has been unwavering through good
trickled down the supply chain. Times have been tough but hopefully this marks the           times and bad.
beginning of the recovery.
                                                                                             The ERM business is one of perpetual uncertainty, change and volatility.
The mining industry has more regional variation. For example, activity is picking up         Our “easy to do business with” philosophy enables us to help you
in Australia, as well as various places in Africa and Asia. Gold remains an important        meet these challenges by increasing flexibility in your travel program.
commodity as other prices remain relatively static.                                          Recent policy enhancements, a customer-focused sales approach and
It’s a more fragmented story in the marine industry. While a shortage of oil tankers         our newly-launched United Jetstream self-service business portal are
leaves them in demand, ships lie idle in the cargo market because supply currently           testament to this philosophy. In addition, we strive to add value to your
outweighs demand. The fortunes of fisheries vary, though generally speaking they             company by employing a consultative approach to addressing your
are on the rise: demand continues to grow but it has to be balanced against stock            unique needs.
preservation.                                                                                Based on signs of recovery in energy-related travel, we are optimistic
What does is it all mean for travel? Unlike so many other forms of travel, travel in         about further improvements in the industry in the coming year, and
the ERM industries is a necessity. A ship can’t sail and a rig can’t drill without crew.     anticipate that 2018 will see more focus on maximizing efficiency.
Managing the costs of that travel is paramount. The $40-50/barrel cost base means            Reliability is critical to your company’s efficiency, and we have raised the
many more people now travel at the back of the cabin and there is an increased focus         bar, regularly finishing number one amongst U.S.-based network carriers
on policy compliance.                                                                        in key metrics such as on-time performance, completion factor and
                                                                                             baggage delivery reliability.
The most important trend is a shift towards harnessing technology, both to ease the
journey for travelers and to streamline the entire travel management process. The            All of us at United feel privileged to be a part of your travel program,
collection, collation and analysis of data is set to transform how we all approach travel.   and look forward to continuing our work with our partners at CWT
                                                                                             to provide solutions that address the unique travel needs of ERM
In this forecast, we give you an overview of the key sectors, followed by analysis of        customers like you.
the travel conditions expected in the coming 18 months, region by region. As well
as a few pointers for managing travel in the ERM markets.                                    Thank you for your business.

I hope you find this travel forecast both interesting and helpful.                           Dave Hilfman
                                                                                             Senior Vice President
Raphael Pasdeloup
                                                                                             Worldwide Sales
Senior Vice President
                                                                                             United Airlines
CWT Energy, Resources & Marine

© CWT 2017                                                                                                                                                                  3
Energy, Resources & Marine Travel Forecast 2018 - Carlson Wagonlit ...
Global macroeconomic overview
There is a backdrop of uncertainty for any global industry. However, the Energy,
Resources and Marine (ERM) industries are more exposed. Operations are often in remote
areas, making travel essential, and often to the more dangerous parts of the world.                                  The Exchange Rate Effect
Security is always a concern.
                                                                                                                     This Forecast is conducted and presented in U.S. dollars
Tied in with that is politics. Going back to the Arab spring, to the recent elections across                         (USD), which offers easy geographical comparison
Europe and the US, the political climate is unstable. Economies are becoming less                                    and consistency with previous forecasts. Forecasts are
sensitive to change, but the end result is still very unclear. A good example is the post-                           influenced by each local market’s currency and whether
Brexit future of the European Union. It’s clear that the EU trading bloc will be smaller                             it appreciates or depreciates against the USD in 2018. As
when the UK leaves. But it will be quite a while before we discern exactly how it will                               an example, the Argentine peso is expected to depreciate
manifest itself in the real economy. Nor can we predict the outcome of political problems                            7.7% against the dollar in 2018. So while we expect
in places like North Korea and South America, Brazil and Venezuela in particular.                                    Argentina’s average air price in USD terms to increase by
As most economists agree, global growth is being led by China and India, with the US                                 only 0.2%, the expectation in local terms would be for a
and the EU continuing to grow at a similar rate the past few years. When you take                                    gain of 7.9%. The expected gain in purchasing power in
inflation into account, and fluctuating exchange rates, the only real demand is coming                               USD accounts for the difference between the two rates.
from China and India; everywhere else is quite flat. This picture, with its uncertainties,
is set to continue through 2018.
                                                                                                                     2018 Foreign Exchange Forecast
These three factors will continue to impact every global industry; the ERM industries are                            (year-over-year growth vs US$)
                                                                                                                                                                                                 Euro Area
not immune. However, they will be impacted in different ways as this Forecast examines.                                   Argentina
                                                                                                                                                                                                  France
                                                                                                                                                                                        S. Korea Germany
                                                                                                                          Venezuela                           Mexico                   Singapore   Italy      U.K.
                                                                                                                                               Japan                         Australia
                                                                                                                                                             Denmark                               Spain
                                                                                                                                                                              India
                                                                                                                    -8%                        -4%             -2%            China
                                                                                                                                                                                           3%                 7%
                                                                                                                                                                                     2%             5%
       Global GDP                                                                                                   -8%   -7%   -6%      -5%   -4%     -3%    -2%    -1%
                                                                                                                                                                           0%

                                        3.1% 3.5% 3.6%
                                                                                                                                                                                1%   2%   3%   4%   5%   6%    7%    8%
       Growth                                                                                                                   -6%                    -3%
                                                                                                                                                                                               4%        6%
       Accelerating                                                                                                             Brazil
                                                                                                                                                  Colombia
                                                                                                                                                  Indonesia
                                                                                                                                                                         $USD
                                                                                                                                                                       (baseline)         New Zealand Russia
                                                                                                                                                                                            Canada
       SOURCE:
       International Monetary Fund,
       World Economic Outlook                                                                                       SOURCE: IHS Global Securities, International Monetary
       Update, April 2017                     2016                          2017                             2018   Fund, Wells Fargo Securities, Rockport Analytics

Forecasted rates are indicated in USD and might have different values when translated to local currencies.

© CWT 2017                                                                                                                                                                                                       4
Energy, Resources & Marine Travel Forecast 2018 - Carlson Wagonlit ...
Energy
Much of the work carried out by the energy industries is in remote parts of the world.
Travel is, therefore, an essential and challenging aspect of working in the industry.                               Operations were profitable when oil
While there has been plenty of production activity in the past three years, exploration                             was well over $100/barrel, it was a
fell prey to dramatic and essential cost savings.                                                                   different story at $40/barrel.
The past few years have been challenging. Previous downturns have been V-shaped—
this one is more like a yo-yo. The market goes up, bringing expectations with it and
then drops suddenly. That said, most expect we are now at the beginning of an
up-take that will have some staying power.                                                                             Crude Oil WTI (NYMEX)                   Price/Barrel
                                                                                                                                                                     (USD)

But prices won’t return to the highs of years gone by. So, the industry’s cost basis                                                                                 60.00
has been forced to change. And it has. Companies have been forced to innovate                                                                                        58.00
and produce more efficiently; they have reviewed everything, every contract, every
                                                                                                                                                                     56.00
supplier. They’ve re-emerged leaner, using different processes and typically with a
reduced headcount.                                                                                                                                                   54.00

An increase in mergers and acquisitions (M&A) activity is expected to instill more                                                                                   52.00
                                                                                                                                                         49.37
stability in the oil and gas industry. That stability is reflected in plentiful examples                                                             (Aug. 8 2017)
                                                                                                                                                                     50.00
of recovery in action. For instance, one driller in Asia Pacific (APAC) was running 12
                                                                                                                                                                     48.00
rigs in 2015 but just two in 2016. It is now preparing to start operating five again
by the end of 2017, bringing the total back to seven. There are examples of similar                                                                                  46.00
recoveries hatching all over the world.                                                                                                                              44.00
Renewable energy continues to be a growing part of the energy sector. Wind and                                                                                       42.00
solar farms continue to sprout across all three regions. While, it isn’t as dependent
                                                                                                                                                                     40.00
on traveling to remote and challenging places, new challenges are created based on                           Sep    Nov    Jan    Mar     May          Jul
where these renewable energy sources are being harvested. We anticipate renewable                            2016   2016   2017   2017    2017        2017
energy will continue to increase, driven both by political and public opinion and by                                                           SOURCE: WWW.NASDAQ.COM

the reduction of hardware costs, in particular turbines and solar panels.

Forecasted rates are indicated in USD and might have different values when translated to local currencies.

© CWT 2017                                                                                                                                                               5
Energy, Resources & Marine Travel Forecast 2018 - Carlson Wagonlit ...
Resources
The two main influences on the resources sector are China and the US. However, there are significant variances depending on
exactly which sector of resources you’re talking about and which mineral. Some of them are subject to wider global trends.
Silver has an important role to play in solar power, so its future is looking good, while lithium ion battery technology is at the
tipping point. On the other hand, lead-acid based batteries are set to decline, so lead prices are likely to drop.

China is important because it is such a huge market, so any shifts in demand have a major impact on world markets. Global
projections show increasing GDP in China but growth could be flattening, the impact of which would be felt throughout the
entire resources industry.

The US is both a major producer and a major market. Again, there is a lot of uncertainty. The US Federal Reserve Open Markets
Committee is set to raise interest rates at least one more time in 2017, which will have an impact on the strength of the US
dollar and on borrowing. Whether it strengthens or weakens, there will be a significant knock-on effect felt by the market.
Likewise, the current US administration’s stated intention to terminate certain trade agreements could send shock waves
through the market.

The Dakota pipeline in the US—set to bring crude from Canada to the Gulf of Mexico—is likely to have a major impact on the
steel industry. There are also indications that mines will re-open in northern parts of the US, particularly Minnesota. This could
lead to even more steel competition.

                                                         If the promised infrastructure spending in the US materializes, it will provide
                                                         a boost to the resources industry. The resurgence of coal mining in the US,
                                                         again if it materializes, will change some dynamics in the mining industry.

While positive, these scenarios remain hypothetical and therefore create uncertainty, which is never good from an investment
standpoint. The result is that, while 2017 will see positive growth for the mining sector in the US, that growth won’t be as
strong as 2016’s.

However, commodity prices are strengthening so cash flow is better. This is having a positive impact in some parts of the
world; the sector is looking particularly strong in APAC, where there are lots of projects offered in Western Australia. Tech
metals—lithium, rare earths, and other minerals—are driving the surge.

© CWT 2017                                                                                                                                 6
Energy, Resources & Marine Travel Forecast 2018 - Carlson Wagonlit ...
Marine
When we look at the short-medium term, there are three distinct areas of the
marine industry that stand out for analysis: tankers, general cargo and fishing.
Each has a very different future.

TANKERS                                      CARGO                                         FISHING
Of the three, those operating tankers        The opposite is true for the general cargo    On the surface, it seems the fishing industry should have a
are in the strongest position. While oil     market. There has been a major slow-          strong future: after all, a growing global population needs
exploration has struggled in the past        down in the past 18 months and, for the       more food. As they say in the industry, ‘Eat More Fish’.
few years, production has continued          first time in a long time, the big shipping   Indeed, the major conglomerates, especially in the Far East,
at full speed. And there simply aren’t       companies are looking at cost savings.        are seeing strong growth.
enough tankers to meet demand.               The industry is reshaping, with Maersk’s
                                                                                           However, adverse climate change is making its mark on the
Prices have therefore gone up, as have       acquisition of the German container line
                                                                                           industry. Rising sea temperatures are affecting habitats and
profits. There is every sign this trend      Hamburg Süd being a good example; the
                                                                                           sustainability is becoming a major threat. Despite efforts
will continue.                               bankruptcy of Korea’s Hanjin Shipping
                                                                                           from a number of different organizations—from the United
                                             is another. And we expect there will be
                                                                                           Nations down—there is no global agreement on acceptable
                                             more consolidation.
                                                                                           catch levels.
    SUPPLY               DEMAND              An over-supply of shipping capacity is
      OF                   FOR                                                             Indeed, the imposition of a common regulatory framework
   TANKERS       +       TANKERS
                                             driving costs down. Despite the fact
                                             that fewer vessels are being built, and
                                                                                           could well be impossible, thwarted by contradictory local

       ⇓                    ⇑                more and more are being taken out of
                                                                                           practices and attitudes. However, some regional sustainable

                 =                           commission, the problem of overcapacity
                                                                                           models have been put in place, often based around seasonal
                                                                                           fishing. Because some regions don’t have sustainable policies
       PR                                    will continue into 2018.
          ICE IN REASES                                                                    in place, there is potential for disputes.
                C
                                                                                           The result is that we expect the fishing industry, despite
                                                                                           the obvious increase in demand, to have a relatively flat
                                                                                           immediate future.

© CWT 2017                                                                                                                                              7
Energy, Resources & Marine Travel Forecast 2018 - Carlson Wagonlit ...
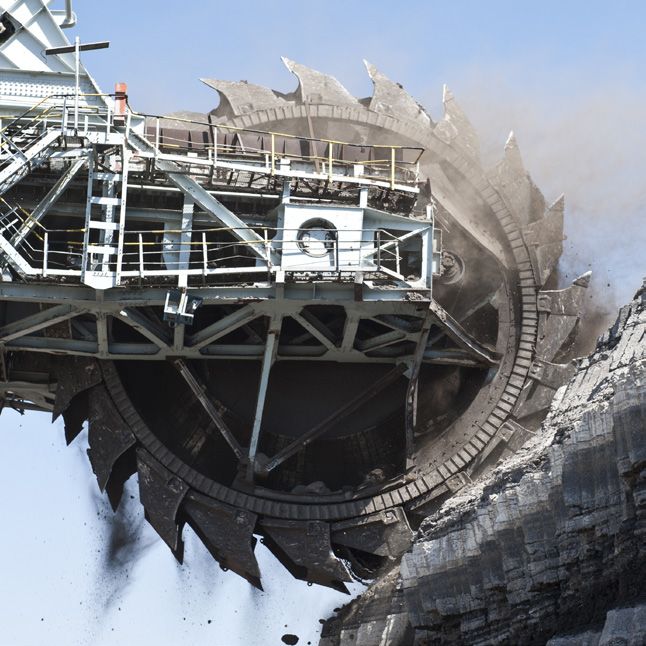
Impact on travel                                                       TOP 5 WAYS TO REDUCE
                                                                                    YOUR TRAVEL COSTS:

                                                                                    1
             Travel costs rise and fall, driven by the rapidly changing
                                                                                     	Consolidate travel
             circumstances of industries in a state of flux. While the oil and
                                                                                       management company
             gas industry is still in recovery from a once-in-a-generation
                                                                                       (TMC) and processes
             change, costs that were subject to deep cuts are returning to the

                                                                                    2
             status quo, including the ability to travel for further exploration.
                                                                                        	Manage supplier deals and
             For most people, travel is not an absolute necessity. Yes, it’s              their performance closely
             very important to meet people face-to-face and the networking
             opportunities at conferences are often more important than
             the content of the conference itself. Yet, if the CEO of even the
             biggest bank in the world doesn’t make it because the flight was
                                                                                    3    Invest in travel technologies

             delayed, the conference can carry on. But if a ship’s cook isn’t on
             the dock at the right time, the ship simply can’t sail. In the ERM
             industries, travel is critical to business.
                                                                                    4   	Optimize policy compliance
                                                                                          through pull strategies

             Therefore, the savings examination hasn’t focused on reducing
             travel; instead, it’s been about reducing travel costs. A starting
                                                                                    5   	Outsource selected travel
                                                                                          categories to experts

             point was shifting people from the front of the plane to the
             back. We expect to see more business class travel as the industry
             picks up, which might help those tasked with staff retention.

             There is also a focus on planning ahead because last-minute
             booking is always more expensive. Likewise, companies are
             using a variety of carriers and we’re seeing an increase in the
             usage of low cost carriers, although that name is becoming a
             misnomer when you factor in purchase options. This all falls
             under a tightening of travel policies and strengthened policy
             enforcement. We don’t expect that to change.

© CWT 2017                                                                                                            8
Energy, Resources & Marine Travel Forecast 2018 - Carlson Wagonlit ...
Impact on travel
Another growing trend is for companies to outsource selected travel categories. As they
examine the cost base of their operations, more and more companies realize they need
                                                                                                      SHIFTING MORE FOCUS TO
to focus on their core activities. Drillers need to drill and shippers need to ship. They
shouldn't be caught up in the logistics of booking flights. Why would you take on travel
                                                                                                      CORE COMPETENCIES ...
management when you can outsource it to a specialist who can help you generate real                   Business process outsourcing (BPO) involves
savings, while freeing up resources?                                                                  third party management of non-essential
                                                                                                      business activities and functions, though control
Looking specifically at air and hotel costs, the basic premise, as always, is to follow the           ultimately still resides within the organization.
money. The market dictates airline routes and their prices, as well as hotel availability             The incentive for doing so is the dramatic
and prices.                                                                                           cost-savings which can be made. Done right,
                                                                                                      BPO improves the speed and efficiency of a
For example, if there is an increase in mining activity in Queensland—and there                       company’s business processes, allows it to invest
is—there will be more demand for flights. If oil exploration in Texas increases, hotel                more time in its core business strategies and
capacity will increase accordingly. Where there is demand, supply will follow. The                    shift more focus to its core competencies.
background is that plenty of routes have been cut in the past few years and hotel                     But there are still some challenges involved
capacity reduced, or at least prices have certainly come down.                                        in making the transition: limited visibility and
                                                                                                      control over operational data, geographical
                                                                                                      disparity, and location-specific operating models
                                                                                                      are the sort of obstacles companies often face.
                                              BPO BENEFITS                                            Companies, together with a BPO specialist,
                                                                                                      should map current operating models and
                                                                                                      processes to figure out which services can be
                                                                                                      outsourced for the maximum benefit while
               Focus on          Benefit from latest       Reduced overhead          Process speed    causing minimum disruption. On top of ground
             core business      expertise and trends        and complexities         and efficiency   logistics and transportation, companies can
                                                                                                      also consider outsourcing administrative tasks,
                                                                                                      rosters, charters, certifications, qualifications

© CWT 2017                                                                                                                                            9
Energy, Resources & Marine Travel Forecast 2018 - Carlson Wagonlit ...
Americas                                                                                                                        2018 Air Projections
                                                                                                             5.0%      4.6%
                                                                                                                                  4.2%
The United States is the dominant player in the region. However,                                             4.0%
the gridlock caused by disagreements on all sides of the US political                                        3.0%
                                                                                                                                                       2.1%     2.0%
arena shows no signs of giving way any time soon. Given this                                                 2.0%                           1.5%
uncertainty and the material impact it has on currency fluctuations,                                          1.0%
continued US dominance really is unknown and very hard to predict.                                           0.0%
                                                                                                             -1.0%
However, the market again dictates what happens to air travel and
                                                                                                             -2.0%
hotels. While demand for hotels in North America has leveled off                                                                                                          -2.0%
                                                                                                             -3.0%
since mid-summer 2016, we still expect supply to continue growing                                                      TÁ         RY            S         R         N        O
                                                                                                                    O           GA         ACA       R BO      S TO       EIR
steadily throughout 2018, although below the global rate. It’s a                                                 OG           AL         R        HA         U        A N
                                                                                                                B          C          CA        H         HO        EJ
similar story for air fares.                                                                                                                T C                   D
                                                                                                                                                                O
                                                                                                                                        DU                   RI
Some air routes have been discontinued during the past several
years, especially to what used to be oil-rich markets. That is
expected to change as the market improves. Houston is set to be
                                                                                                                              2018 Hotel Projections
one of the major beneficiaries although there are uncertainties                                              5.0%
related to the recent historic flooding. Other cities set to benefit                                         4.0%                 3.8%
include those with strong competition either between domestic                                                3.0%                                     2.5%
                                                                                                                       2.2%
carriers, like in the Chicago hub, or where international competition                                        2.0%
is high, such as Los Angeles.                                                                                 1.0%
                                                                                                             0.0%
In South America, we’re seeing the emergence of more low cost                                                                               -0.1%
                                                                                                             -1.0%
capacity, with Brazilian airline, GOL, increasing its fleet. We’re also                                      -2.0%
seeing the unbundling of fares. The overall impact is a reduction in                                         -3.0%
                                                                                                                                                                -2.2%
ticket prices, with Brazil leading the way, even if ancillary costs mean                                     -4.0%
                                                                                                                                                                          -3.8%
the price for the entire journey is not actually reducing that much.
                                                                                                                        TÁ           RY     CA
                                                                                                                                               S
                                                                                                                                                      BO
                                                                                                                                                         R         N
                                                                                                                                                                            IR
                                                                                                                                                                              O
Hotel prices in North America are set to increase roughly in line with                                                 O         GA        A        R         S TO        E
                                                                                                                    OG         AL        R       HA        OU        JA
                                                                                                                                                                        N
the global rate.
                                                                                                                B           C         CA       H         H         E
                                                                                                                                            TC                   D
                                                                                                                                                               O
                                                                                                                                        DU                  RI

Forecasted rates are indicated in USD and might have different values when translated to local currencies.

© CWT 2017                                                                                                                                                                        10
Americas
                                          Oil prices, and therefore industry activity, really do have a major impact.
                                          For example, Houston continues to be challenged by low oil prices, with
                                          low hotel occupancy levels just above 60%.

                                          In Canada we anticipate slightly stronger positive growth for the hotel
                                          market with a strengthening Canadian dollar likely to lead to increased
                                          demand, higher prices, and more growth than the US.

                                          The hotel market in South America is very fragmented, with robust
THE NEXT FRONTIERS...                     competition from a large number of brands and from independent
                                          operators. On the other hand, there is M&A activity, particularly with the
There are two areas that stand out
                                          Brazil Hospitality Group’s agreement with Accor Hotels, by which Accor
as the up and coming places for
the ERM industries: northern Brazil
                                          will reflag and manage a portfolio of 26 hotels and 4,400 rooms.
and northern Mozambique. They
                                          Rio de Janeiro has an over-supply of hotel capacity, following the FIFA
share two things: huge potential and
                                          World Cup and the Olympic Games. Prices are likely to drop even further
minimal infrastructure. When there
are roads they are, at best, sketchy.     as we see business travel declining in the region.
Railway infrastructure is almost non-
existent and the best runways are
made of dust or grass. It’s nothing,
however, compared to the challenge
of shipping out the produce, be it oil,
gas or mineral.                                                                                       The gridlock caused by disagreements on
This exposes the eternal cost/benefit                                                                 all sides of the US political arena shows
equation. Our projection is inevitably                                                                no signs of giving way any time soon.
that the potential of both Brazil
and Mozambique will lead to the
development of the necessary
infrastructure.

© CWT 2017                                                                                                                                   11
For the ERM industries, the result is minimal changes in commerical
                                                                                                                                              airline prices with an increase for the more specialist routes.

Europe, Middle East & Africa
For what is a very broad and diverse region, it’s perhaps unsurprising to see significant disparity between growth rates in its different countries. While
we expect air fares to experience strong growth in Western and Eastern Europe, Africa is set for moderate growth. It’s a similar tale for hotel costs and
capacity, with relatively strong growth expected in Europe and a much flatter trajectory in the Middle East and Africa.
As with other regions, air fares are largely driven by demand, or in some instances by the lack of it. For example, oil exploration is set to increase
demand and, therefore, prices on Norwegian routes in 2018. Double-digit growth in international arrivals is expected next year based on a
combination of the oil industry and tourism, particularly from China.
Other hot places are the obvious ones: Angola, Kazakhstan, Nigeria and Saudi Arabia. Mozambique is set to become a key ERM destination, though
we are some way off being able to predict pricing because the infrastructure simply isn’t yet in place.

                                                                    2018 Air Projections                                                                                         The international community is closely monitoring
 9.0%
         8.2%
                                                                                                                                                                          8.5%   relations between Qatar and its neighboring countries,
 8.0%
 7.0%
                                   6.9%
                                                                                                                6.6%      6.6%                                                   given the significant impact they could have on the price
                                                                                                                                     6.1%                        6.3%
                     5.8%
 6.0%                                                                                                                                                                            of oil and gas. Strained relations could also reduce traffic
 5.0%
 4.0%                                                                                                                                                                            demand in the region.
 3.0%                                                    2.7%
 2.0%                                                                                                                                                                            Airline competition is also playing its part. The most
                                                                                                    1.1%
 1.0%
0.0%
                                                                                                                                                                                 obvious impact is in the Middle East, though since many
-1.0%                                                                                                                                                                            of the airlines are major international players, their
-2.0%                                                              -1.5%
-3.0%                                                                                                                                                  -2.6%
                                                                                                                                                                                 competition has wider ramifications than just in the region.
-4.0%
-5.0%                                      -4.5%
                                                                             -4.2%                                                                                               A further factor impacting price is ticket distribution. British
                                                                                       -5.1%
-6.0%
                                                                                                                                              -6.2%
                                                                                                                                                                                 Airways’ move to follow Lufthansa’s lead by introducing a
          EN          P              S        O            N         EN                  AM         AI         G           KI          L         S      DA          M        R   GDS surcharge will push prices up for corporate travel. As
                    ER          EN          IR       OW                         AM               B           UR        SIN        BU          GO                 DA       GE
        DE       W             H          CA        T             AG         LA       MM       DU           B         L         AN          LA       AN       ER       AN
  BE
     R
             AN
                T           AT                   PE           N H        S A
                                                                                   DA                    AM        HE        IST                   LU     T T        AV          yet, the detail of the impact is unclear but it will certainly
A                                              CA          PE         ES        N/
                                                                                                     H
                                                                                                                                                       RO          ST
                                                        CO      DA
                                                                   R         RA
                                                                         A H                                                                                                     make flying more expensive.
                                                                     DH

Forecasted rates are indicated in USD and might have different values when translated to local currencies.

© CWT 2017                                                                                                                                                                                                                                          12
Europe, Middle East & Africa
Hotel pricing is following a very similar pattern. Generally speaking, there hasn’t been
major investment in hotel infrastructure recently, though there are local variations.
                                                                                                                                                                              SECURITY
The UK is one such example: 13,000 new hotel rooms opened in the UK in 2016 and
another 8,000 rooms are expected to open in London alone in 2017. The opposite is                                                                                             Security has always been a concern for the
true in Amsterdam, where the city council has put a stop to all hotel developments in                                                                                         ERM industries. To put it very simply, oil, gas,
                                                                                                                                                                              minerals and fish often come from challenging
and around the city center.
                                                                                                                                                                              environments and dangerous places. The result is
But fluctuations in major currencies are expected to impact the market heavily. They                                                                                          stringent security processes have been in place for
are also playing havoc with our ability to predict prices with any degree of certainty,                                                                                       many years, well before the current concerns arose.
particularly when combined with local currency changes, which we’re seeing in Egypt,
                                                                                                                                                                              Stopping travel simply isn’t a possibility because
Nigeria and Turkey, among others. There is more uncertainty to come.                                                                                                          the industries have to carry on. We’re seeing
                                                             2018 Hotel Projections                                                                                           two trends:
 12.0%                                                                                                                                                                11.5%
 11.0%                                                                                                                                                                        THE LIST OF DANGEROUS
 10.0%                                                                                                                                                                        PLACES IS GROWING
  9.0%
  8.0%   7.7%
                                                                                                         7.1%
                                                                                                                                                                              Security challenges have occurred frequently in
  7.0%               6.4%       6.1%                                                                                   6.1%
                                                                                                                                                             5.7%
                                                                                                                                                                              Nigeria and Somalia. We can now add Belgium,
  6.0%
  5.0%
                                                                                                                                 4.9%                                         France and the UK to the list. The risk is no longer
  4.0%
                                                     2.8%
                                                                                                                                                                              isolated to specific parts of the world so security
  3.0%
  2.0%
                                                                                                                                                                              policies are relevant everywhere.
  1.0%
                                                               0.0%
 0.0%                                                                                                                                                                         COMPANIES ARE REASSESSING
 -1.0%                                                                  -0.5%
 -2.0%
                                                                                                                                                                              SAFETY AND SECURITY COVERAGE
 -3.0%
                                                                                  -2.9%        2.9%                                                -3.0%                      We're seeing the tightening of corporate security
 -4.0%
 -5.0%                                                                                                                                    -4.7%                               policies and a greater emphasis on adherence.
                                        -5.2%
 -6.0%
                      P                                                                          I                      KI         L         S                           R
         EN       ER             NS      IR
                                           O
                                                     W
                                                       N         EN         AM      AM      BA            RG        IN        BU          GO        DA       DA
                                                                                                                                                                M
                                                                                                                                                                      GE
     RD
        E
                TW             HE      CA          TO         AG         LA      MM       DU          MB
                                                                                                         U         S
                                                                                                                            AN          LA       AN       ER       AN
                            AT                   E          H          A                                        EL                             LU
   BE       AN                                 P
                                                       PE
                                                          N
                                                                  ES
                                                                     S
                                                                             /D
                                                                               A
                                                                                                HA             H         IST                          T T
                                                                                                                                                               ST
                                                                                                                                                                 AV
 A                                          CA                            AN                                                                       RO
                                                    CO      DA
                                                               R        R
                                                                     AH
                                                                 DH

Forecasted rates are indicated in USD and might have different values when translated to local currencies.

© CWT 2017                                                                                                                                                                                                                    13
Asia Pacific
                                                                                                                                     2018 Air Projections
                                The trend in Asia Pacific will be for air and hotel prices to increase           8.0%                        7.7%
                                                                                                                                   7.0%
                                in 2018, particularly for ERM travel, as activity increases. In the              7.0%
                                                                                                                                                      6.0%
                                major economies of China and India, rises are inevitable because                 6.0%
                                                                                                                                                                4.9%      4.8%
                                of the macro-economic picture of ever-increasing domestic                        5.0%
                                                                                                                 4.0%
                                                                                                                                                                                    3.9%
                                demand. Indeed, there are potential capacity issues on the
                                                                                                                 3.0%
                                horizon if demand in the region stays on its current trajectory.                         1.9%
                                                                                                                 2.0%
                                That said, airlines are developing their business models and                     1.0%
                                governments are acting to impose some control on the market,                     0.0%
                                                                                                                                                       I
                                in an effort to increase capacity in line with demand.                                NG        RT
                                                                                                                                  A       ILA       BA       RT
                                                                                                                                                                H         AI         E
                                                                                                                    O         A         N         M        E          G H       P OR
                                                                                                                   K        K         A         U        P
                                Tokyo is a good example of increasing volume, as it prepares for                 G       JA         M         M                    AN        GA
                                                                                                             HON                                                SH       SIN
                                the 2020 Olympic Games. Both hotel and air capacity are being
                                built, limiting cost increases. However, Tokyo will remain an
                                expensive destination.

                                Low cost carriers are set to play a greater role in business travel
                                                                                                                                   2018 Hotel Projections
                                with route expansion and the provision of premium cabins.                                          5.3%      5.3%      5.3%
                                                                                                                 5.0%
                                AirAsia X, for example, is introducing business class that includes                                                              4.1%     4.0%
                                                                                                                 4.0%
                                lie-flat beds.                                                                                                                                      3.2%
                                                                                                                 3.0%

                                The Chinese government has liberated airfares on routes                          2.0%
                                                                                                                 1.0%
                                competing with high speed trains to keep prices down. However,
                                                                                                                 0.0%
                                because of high demand, prices still continue to increase. On
                                                                                                                 -1.0%
                                the other hand, the Indian government has sought to limit
                                                                                                             -2.0%
                                seat expansion with bilateral restrictions, though demand from                           -2.0%
                                markets such as UAE, Singapore, Hong Kong and Malaysia                                                                    I
                                                                                                                         NG         TA       ILA       BA        TH         AI         E
                                is growing. These moves will result in increasing airfares,                            O         A R       N         M        E R       G H       P OR
                                                                                                                      K        K         A         U        P
                                                                                                                    G       JA         M         M                   AN        GA
                                compounded by new taxation rules.                                            H   ON                                               SH       SIN

Forecasted rates are indicated in USD and might have different values when translated to local currencies.

© CWT 2017                                                                                                                                                                             14
Asia Pacific
Centers of ERM activity in APAC have all felt, and in some cases, still feel the impact of a particularly bad few years. Some key ERM
destinations like Mumbai, Singapore and Tokyo are rebounding, while others like Perth are still struggling. But change is coming. The
direct flights between Perth and London, which Qantas will introduce in the spring of 2018, are in response to increased demand and
will command premium pricing. In turn, that generally will push prices up. That demand comes from increased mining activity and from
the gas industry. The arrival of the 600,000 ton, 488m Shell Prelude floating liquefied natural gas platform is indicative of the future.

                                                               With mining picking up again, there will be pressure on specific routes,
                                                               particularly in Australia. Companies have a legal duty to impose
Prelude by numbers:
                                                               minimal impact on the local community and that includes working with
> 488m long, more than four soccer fields                      the airline(s) to make sure there is enough capacity, at a reasonable
> 7 4m wide, nearly three times the size of the               price, even when the mining industry is taking up every available seat.
  biggest blue whale                                           We’re starting to see this happen already and co-operation between
                                                               ERM companies and airlines will become more important in 2018.
> Construction used 260,000 tons of steel
> D
   isplaces 600,000 tons, six times the world’s
  biggest aircraft carrier
                                                                                TRAVEL: COMMERCIAL vs. LOGISTICS...
> M
   oored to 16 steel piles. The anchor chains are 17km
  long and each link is a meter long and weighs a ton                           For the ERM sectors, the logistics of travel can be exceptionally complicated.
                                                                                Managing the travel of someone who needs ground transportation from the
> C
   apacity to produce at least 5.3 million tons
                                                                                airport to an airfield; a night in a small motel; a light aircraft or helicopter to
  of liquids per year                                                           the mine, ship or rig is more complex than simple commercial travel. In most
> 5 00 million liters of cold water                                            companies, commercial travel and logistics travel are managed totally separately.
  will help cool the natural gas                                                That works fine until something goes wrong. If the commercial flight is delayed,
                                                                                who tells the bus driver? If a chopper is weather-bound, what happens when the
> L ocated 475km north east of
                                                                                traveler gets to the airport?
  Broome, Western Australia
                                                                                It’s even more complex when unusual destinations are involved. Increasingly, major
> 2 0 to 25 years lifespan in its
                                                                                companies have regular operations in remote and, sometimes, hostile destinations.
  present location
                                                                                Atyrau in Kazahkstan, for example, combines relative isolation with extreme
> Crew of over 200
                                       IMAGE © SHELL OIL
                                                                                weather, with temperatures ranging from -4°F in winter to 104°F in summer.

© CWT 2017                                                                                                                                                      15
Recommendations
As this forecast shows, there are
many factors influencing travel
pricing, most of which are external,
volatile and unpredictable. Your
focus therefore has to be on your                             ROBUST TRAVEL POLICY
span of control.                              BE PREPARED     The best way to keep the unit costs of your travel down is
                                                              to build a strong travel policy, with cost-effective supplier
                                                              agreements in place, and then make sure your travelers

BE PREPARED                                   ROBUST TRAVEL   adhere to the policy.

Hopefully the worst is over. With             POLICY          In particular, negotiate with hotel suppliers, on price, last
economies improving, now is the time                          room availability, bed and breakfast deals, inclusion of
to build the travel program you want                          Wi-Fi in the price and so on. It’s worth seeking two-year
and need. That is our first and most                          agreements now, while the rates are low.
important recommendation.
                                              LEVERAGE
                                                              Once you have your agreements in place, enforce the
                                              TECHNOLOGY      policy. Don’t allow employees to book travel outside of
Whatever route you take, your start
point should be unit cost optimization                        your channel. Make sure people book as early as possible:
and asset utilization. That way you can                       question every booking made within two weeks of travel.
be sure you’re getting the very best           E MINDFUL
                                              B               Don’t always accept the lowest fare offered, even if that
                                                              has been your policy recently. Make sure your travelers
value from your travel program. That will
                                              OF SAFETY       always stay in your selected hotels, to keep costs down and
involve a program that recognizes travel
is an enabler, not a cost. It also involves                   strengthen your hand in the next round of negotiations.
a close examination of the return on
                                                              Deviation from the policy always ends up being more
investment for every type of travel.
                                                              expensive and may raise security concerns, especially
                                                              around hotel bookings. It also weakens your hand when it
                                                              comes to negotiating with suppliers next time round.

© CWT 2017                                                                                                               16
BE MINDFUL OF SAFETY
Recommendations                                                                              Security is another area where technology can
                                                                                             enhance the measures you already have in place. New
                                                                                             technology enables you to track the whereabouts
LEVERAGE TECHNOLOGY                                                                          of your employees in real-time, while the ubiquity of
                                                                                             mobile means you can almost always contact them.
Businesses throughout the ERM industries use the most advanced and sophisticated             And there are other viable communications channels
technology in the world. The same standards need to be applied to travel, both to            in the rare event a mobile network is down, such as
reduce costs and increase efficiency.                                                        Whatsapp or WeChat. This is particularly important
The logical start point is to use software tools to manage the entire travel process.        in parts of the world where security is an increasing
There are several available that can handle rosters and logistics, including uniforms,       concern—Turkey and Venezuela are good examples.
site security, charter manifests, room check in/out and so on. It’s about optimizing the     We are seeing new pandemic and epidemic threats
logistics process and, perhaps, the interaction between the commercial and logistics, to     emerging across previously unaffected areas of the
create a single version of the truth between travel managers and the traveler.               world. Transmittable illnesses are even appearing in
This consolidation provides efficiency savings in itself. But, that is only the beginning.   places where health care is considered advanced—
Because all the information is collected in one place, that data can then be collated and    the Zika virus in Brazil and US, for example. We
analyzed to provide a highly accurate basis for your decision-making.                        recommend that companies review their pandemic
Access to travel data is more instantaneous than ever for companies, giving them near        and staff healthcare plans including travel healthcare
real-time overviews of key considerations such as spend. Every single part of the journey    procedures. This is especially important for companies
can be included, even those that are generally quite inaccessible. Those scenarios can       moving their operations to new locations where there
then be used to predict the impact of certain decisions, for example changing hotel          are lower health care standards.
provider, changing airlines, booking further ahead, or changing your crew rotation day
from Friday to Thursday.
                                             The second angle is that there is a cohort      Having a firm grip on the things you can control
                                             of people retiring from the industry, being     will minimize the impact of the things you can’t.
Predictive analytics of Big                                                                  We hope the insights and advice you’ve read
                                             replaced by the millennial generation. They
Data means you can be much                                                                   throughout this forecast will put you in a strong
                                             have different demands and expectations.
smarter about your use of data               They expect everything to be digitized,         position to offset the turbulence of fluctuating
and therefore make better                    from travel tickets to expense forms.           markets and evolving business models.
decisions and reduce costs.                  Ideally, neatly contained in a mobile app.

 © CWT 2017                                                                                                                                       17
United Airlines' perspective
             on the energy industry
             The current airline environment includes higher fuel prices, heightened competition,
             an uncertain political environment, higher labor costs and unprecedented attention on
             customer service. Despite all these challenges, demand is at an all-time high, economies
             are improving, airlines are investing in their products and the focus on the customer is
             increasing every day.

             Improved industry profit margins are allowing carriers to re-invest in products and services,
             vastly improving the customer travel experience. In 2016, airlines took delivery of 353
             new aircraft, nearly one every day and as an industry, invested an average $1.5 billion per
             month in improvements to product and customer experience. Almost 200 new routes
             were added in the U.S. alone with another 150 expected for all of 2017. For 2018, Airlines
             will again seek markets worthy of new or increased service to match demand and continue
             to update items like aircraft seats and add technology to the travel experience.

             Keeping up with all this change is crucial to a travel programs success. The introduction of
             airline portals like United Jetstream are designed with the corporate travel buyer in mind.
             These tools provide 24/7 access to the information you need to make informed decisions
             by providing reports on spending trends, total savings, traveler experience, carbon
             footprint and more. They help reduce costs by simplifying administrative processes and
             provide transparency as it relates to the overall product offering.

             Understanding when, where and how travelers are canvassing the world is an important
             key to driving overall savings in a travel portfolio. Savings do not always relate specifically
             to the price of the ticket and tools like United Jetstream help show the entire picture.

             We are excited about 2018 and continuing to partner with you and CWT. We look forward
             to welcoming your travelers on a United flight soon!

© CWT 2017                                                                                                18
Methodology                                                About CWT Energy, Resources & Marine
The projections in the 2018 Energy, Resources              CWT Energy, Resources & Marine provides specialized travel management
and Marine Forecast are based on:                          solutions for organizations operating in oil and gas, diversified resources and
                                                           mining, offshore, marine services and renewable energies. Building on more
       A statistical model developed by market and         than 30 years of experience, we work closely with clients worldwide to find
       economic research firm, Rockport Analytics,         the right solutions for their complex travel needs, providing first-class service
       that evaluates historical price behavior and        and leading-edge technology and products. CWT Energy, Resources & Marine
       forecasts future price references                   is part of Carlson Wagonlit Travel – a global leader in travel, hotel booking
       The market-specific expertise and                   and meetings and events. www.carlsonwagonlit.com
       travel industry knowledge of
       CWT Energy, Resources and Marine and                For more information visit:
                                                            www.cwt-energy-resources-marine.com.
       CWT Solutions Group personnel worldwide
                                                           Follow us:
       Macroeconomic information sourced from
       International Monetary Fund Research
       Department and other sources as indicated.

Projects were derived based on transaction data
from the global client portfolio of Carlson Wagonlit
Travel (CWT), including clients’ travel footprints
and patterns, over the past recent years. Key
macroeconomic and per-country indicators, such as
current and expected GDP growth, the consumer
price index, unemployment rates and crude oil
prices, were used in the statistical model, as well as
key supply-side drivers sourced from OAG and STR
Global. All air statistics represent point of origin and
include all trip types (long and short haul/domestic,
continental and intercontinental).

© CWT 2017                                                                                                                                     19
You can also read