EFFECTS OF SASB SUSTAINABILITY REPORTING ON SHARE PRICING IN THE CONSUMER GOODS SECTOR
←
→
Page content transcription
If your browser does not render page correctly, please read the page content below
EFFECTS OF SASB SUSTAINABILITY REPORTING ON

SHARE PRICING IN THE CONSUMER GOODS SECTOR

                                  by

                      ALISSA CAMPISTA

                              A THESIS

              Presented to the Department of Accounting
                and the Robert D. Clark Honors College
      in partial fulfillment of the requirements for the degree of
                          Bachelor of Science

                              June 2021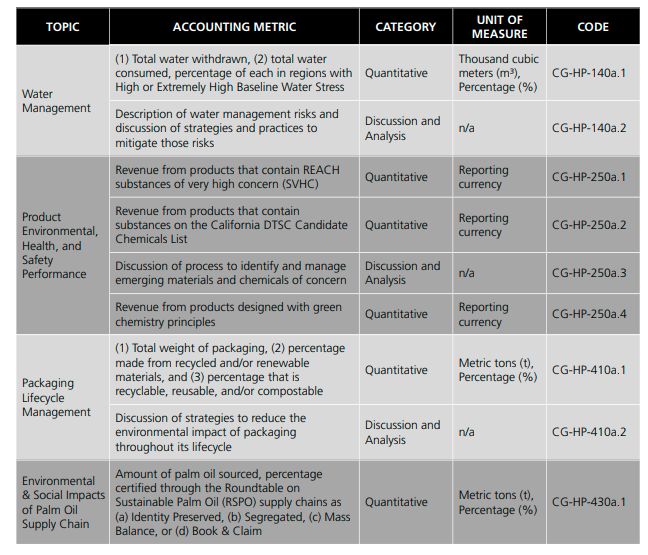
An Abstract of the Thesis of
              Alissa Campista for the degree of Bachelor of Arts/Science
               in the Department of Accounting to be taken June 2021

Title: Effects of SASB Sustainability Reporting on Share Pricing in the Consumer
                                  Goods Sector

           Approved:              Michele Henney, CPA, MS, PhD________
                                   Primary Thesis Advisor

       As the fight for the recognition of climate change and sustainability as drivers of

value becomes increasingly important, consumers, investors, and professionals seek to

understand how social and environmental issues can be measured and disclosed. I seek

to understand how using the standards set by the Sustainable Accounting Standards

Board (SASB) can facilitate the disclosure of better information about a company’s

performance. My research uses the share prices of publicly traded companies that

disclose according to the SASB to calculate the rate of return and abnormal return to

observe and measure the effect on their performance.

                                            ii
Acknowledgements
       I would like to thank my thesis committee Professor Michele Henney, Professor

Stephen McKeon, and Professor Samantha Hopkins for guiding me through this

strenuous but rewarding process and serving on my Thesis Committee. I would like to

thank Genifer Snipes for her support in researching and citing. Thank you to the

professors in the Lundquist College of Business for helping me examine financial

reporting and ethical sustainability practices in business and for helping me consider the

various perspectives and contexts related sustainability reporting.

       Thank you to my Mom and Dad, Ainsley, my roommates, my friends and

family, and Maddy Hubbard. Thank you for listening to my ideas and supporting me

through this journey. Maddy, thank you for being my Honors College teammate and

partner.

                                            iii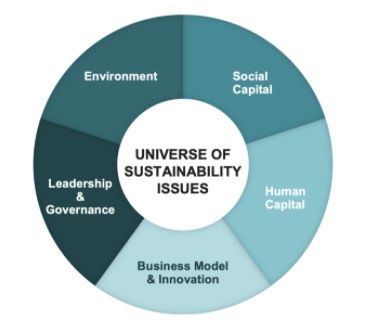
Table of Contents

Chapter 1: Introduction                               1
  Background Information                              3
Chapter 2: Research and Methodology                  11
  The SASB Standards                                 11
  The Consumer Goods Sector                          12
    Apparel, Accessories, and Footwear               13
    Household and Personal Products                  18
  Methodology                                        22
    Stock Pricing                                    22
    Example of the data collected for each company   23
Chapter 3: Data and Results                          24
  Abnormal Returns Data                              24
  Results and Discussion                             25
Chapter 4: Conclusion                                27
Glossary                                             28
Appendix                                             29
Bibliography                                         30

                                         iv
Chapter 1: Introduction
When we think of what is most important to businesses and their owners, we
think of buzz words like revenue, profits, expense, the bottom line, stock prices. There
is a clear expectation that businesses solely exist to maximize profits for their
shareholders. However, consumers and company management are beginning to
understand that it should be, and needs to be more than that. Social and environmental
issues such as climate change and sustainability are dominating the media headlines and
impacting the lives of current and future humans across the globe. A Harvard study
argues that “at the current rate of global greenhouse gas emissions, climate change
could displace two billion people due to rising ocean levels, cost the U.S. economy
billions of dollars, and cause upwards of 250,000 additional deaths per year — all
before 2100” (Hyman, 2020). While the impact of climate change and the fight to
encourage humans to lead sustainable lives is debated, this paper assumes that climate
change, sustainability, and other social and environmental issues are real. With that
being said it is important to define the terms. It is crucial that we explore methods and
reflect on our habits to continue to live in harmony. However, the non-profit advocacy
group, National Resources Defense Council (NRDC), reported that corporations are the
primary driving force behind climate change, and not in a good way. NRDC reports that
100 energy companies are responsible for 71% of all industry emissions since the
declaration that climate change was human-driven (Axelrod, 2019). They note that the
energy sector is not the only one to blame. The top 15 US food and beverage
companies generate more greenhouse gases than the entire country of Australia at
nearly 630 million metric tons every year (Axelrod, 2019). Scholars at Harvard concur,stating the corporations are disproportionately responsible for the climate change impact
(Hyman, 2020). Given these statistics, consumers, corporate managers, and, frankly, all
global citizens should be concerned with corporate contribution to climate change. If
the concern of climate change is not enough to scare consumers, strategists, and
managers about the future of human well-being, in January of 2019 CEO of BlackRock
investments, the largest asset manager in the world, with $6.84 trillion under
management, stated in a letter to the public and shareholders that going forward they
plan to place sustainability at the center of their investment approach (Fink, 2020). With
this being said companies who do not share or disclose their sustainability reports are in
danger of losing investor interest. While every individual needs to make changes in
their daily habits to create and maintain a sustainable environment, this paper aims to
focus on corporate sustainability.
After learning that corporations are significant players in climate change, I
became curious about what if they were doing to change it. It is clear that companies are
aware of their impact, I noted while online shopping that companies began marketing
and publicizing their sustainability efforts. For example, when shopping on Nike’s
website, they note in large font near their leggings that they are made with “sustainable
materials” or on Patagonia’s website, the entire home page is about their sustainability
efforts, noting a “self-imposed Earth tax”. As a consumer, I found myself confused by
what these statements meant. As a student of the accounting field, I found myself
intrigued by how companies could be subject to or claim a self-imposed earth tax and
how companies report these statements and information to ensure it is valid. I had
2learned and studied about financial reporting and was curious about how it could be
applied to information regarding sustainability.
Background Information
Financial Reporting
Created in 1933, the Securities and Exchange Commission (SEC), a
federal agency, was tasked with protecting investors, maintaining fair, orderly, and
efficient markets, and facilitating capital formation (Securities and Exchanges
Commission, n.d.). The SEC requires public companies to regularly disclose significant
financial and other information, so investors have the timely, accurate, and complete
information they need to make confident and informed decisions about when or where
to invest (Securities and Exchanges Commission, n.d.). Financial reporting includes
information regarding their properties, management, publicly traded stock, financial
performance, and business operations (Battilana & Norris, 2019). Financial reporting is
communicated and released in a series of financial statements, which are prepared by
accountants according to specific rules and generally accepted accounting principles
(GAAP) created by the Financial Accounting Standards Board (FASB). It is crucial for
investors to have access to this information in order to make informed investments.
Investors want to know the revenues, profits, expenses and more about a company.
Importantly, the FASB is responsible for ensuring that the information, no matter the
company or accounting firm that prepared it, is standardized and can be accurately
compared with other companies to help make informed investing decisions. Given that
3this is an integral part of the study of accounting, myself and other accountants
questioned how this framework could be applied to nonfinancial information.
Sustainability Reporting
The United Nations (UN) describes corporate sustainability reporting as a
potential mechanism to generate data and measure the progress of companies and their
performance in all dimensions of sustainable development, set goals, and support the
transition towards a low carbon, resources efficient, and inclusive green economy (UN
Environment Programme, n.d.). Plainly put, sustainability reporting measures non-
financial impacts of business with specific attention to environmental, social, and
governance factors or commonly referred to as ESGs. Sustainability reporting differs
from financial reporting in that while financial reporting is legally required for publicly
traded companies, sustainability reporting is not.
History of Sustainability Reporting
While this may seem like a new and upcoming topic, sustainability reporting or
the idea of it dates back 1940. Theodore J Kreps, a business and economics professor at
Stanford University, coined the idea of a “social audit” (Minguel, 2017). He began the
discussion surrounding “social measurement” and characterized it as follows:
“The American people want their economic system of free
enterprise to promote (1) the growth, health, and education of the
population; (2) resourcefulness and invention; (3) the democratization of
business organization; (4) reason and effectiveness in labor
organizations; (5) international peace; (6) the enlargement of individual
liberty; (7) increased opportunity for each individual to develop to the
full all his intellectual, aesthetic, spiritual, and economic capacities”
(Minguel, 2017).
4While the name and characteristics have evolved, the message rings true, calling for
businesses and corporations to look beyond profit margins and financial information.
Since the 1940s, sustainability reporting has evolved with attempts toward
standardization. In 1987, the United Nations World Commission on Environment and
Development described sustainable development and outlined the starting framework
for reporting the information. They outlined the strategy for the need to integrate
“economic and ecological considerations in decision making” (United Nations, 1987).
Since the UN’s declaration for sustainable development and to find a “strategic
framework” to achieve it, there have been additional movements and attempts to create
sustainability standards (D'Aquila, 2018).
Current State of Sustainability Reporting
Since the 1980s there have been many efforts to create a framework for
measuring and reporting sustainability efforts and ESG’s. Companies around the globe
are beginning to understand the value of sustainability reporting. A survey by the
Governance and Accountability Institute found in 2011, only 20% of S&P 500
companies published a sustainability report, however in 2015, nearly 81% of the S&P
500 companies were reporting (see Figure 1 for percentage of companies who shared
sustainability reports) (Environmental Leader, 2016).
5Share of S&P 500 companies who published sustainability reports in the US 2011-2015
Figure 1: Share of S&P 500 companies who published sustainability reports in the US
from 2011 to 2015.
Source: (Environmental Leader, 2016)
The figure demonstrates that US companies agree that this information should be shared
because it is of value or they would not be willingly disclosing this information.
However, there is varying methods for this information to be reported. In the most
recent 20 years, there have been six commonly referenced standard setting and
reporting initiatives (D'Aquila, 2018). As Jill M. D’Aquila of the CPA Journal reports,
there are many challenges to setting up a system of sustainable activity including
competing frameworks, the absence of uniform reporting standards, different measures
of materiality, language differences, difficulty comparing companies, and the disparity
between company and investor views (D'Aquila, 2018). As mentioned earlier, there are
six common initiatives:
6• Carbon Disclosure Project (CPI),
• Dow Jones Sustainability Index (DJSI),
• Global Initiative for Sustainability Ratings (GISR),
• Global Reporting Initiative (GRI),
• International Integrated Reporting Council (IIRC),
• Sustainability Accounting Standards Board (SASB).
The year founded, audience, focus and form of report for each initiative are as presented
in Table 1.
Year Type Audience Form of Focus
Founded Report
CPI 2000 Reporting Investors CDP Provide Investors with
and and other Questionnaire climate change, water,
Rating stakeholders and carbon data
DJSI 1999 Rating Investors RobeccoSAM Evaluate the
Questionnaire sustainability
performance of the
largest 2,500 S&P
firms through a family
of indices
GISR 2011 Rating Investors Center of Steward an ESG
and other Ratings ratings standard to
stakeholders Excellence accelerate the
(CORE) contribution of
Program organizations
worldwide to
sustainable
development
GRI 1997 Reporting Broad set of Sustainability Empower sustainable
stakeholders Report decisions through the
established standards
and a global multi-
stakeholder network
IIRC 2010 Reporting Providers of Integrated Establish integrated
financial annual report reporting and thinking
capital or standalone within mainstream
report business practice for
both public and
private sectors
7SASB 2012 Reporting Investors in SEC 10-K, 20-F Establish and improve
US public Filings industry specific
companies metrics for investors
in the US
(D'Aquila, 2018)
Table 1: Commonly Referenced Standard Settings and Reporting Initiatives
Importantly, the GRI, IIRC, and SASB focus on the reporting of the
sustainability information while CDP, DJSI, and GISR focus on their ratings. Of these
initiatives, the Global Reporting Initiative was the first and these guidelines were the
same for all businesses, regardless of industry, size, nationality, or ownership (Battilana
& Norris, 2019). Importantly, as Julie Battilana of the Harvard Business School notes,
GRI reports were not audited, and Rogers, the founder of the Sustainability Accounting
Standards Board (SASB), noted that they were not used by investors (Battilana &
Norris, 2019). So, in 2011, SASB set out to create sustainability accounting standards
for each sector of the economy by 2016 (Battilana & Norris, 2019).
The Sustainability Accounting Standards Board
Founded in 2011 by Dr. Jean Rogers, the SASB aims to connect businesses and
investors on the financial impact of sustainability (SASB, n.d.). The standards are
financially material and industry specific (SASB, n.d.). Information is material
according to the US Supreme Court if there was “substantial likelihood that the
disclosure of the omitted fact would have been viewed by the reasonable investor as
having significantly altered the total mix of information available” (Battilana & Norris,
2019). SASB used studies and the concept of materiality to show that investors were
interested in this data and would use the data if it were standardized across industries.
The board understood that sustainability issues manifest differently depending on a
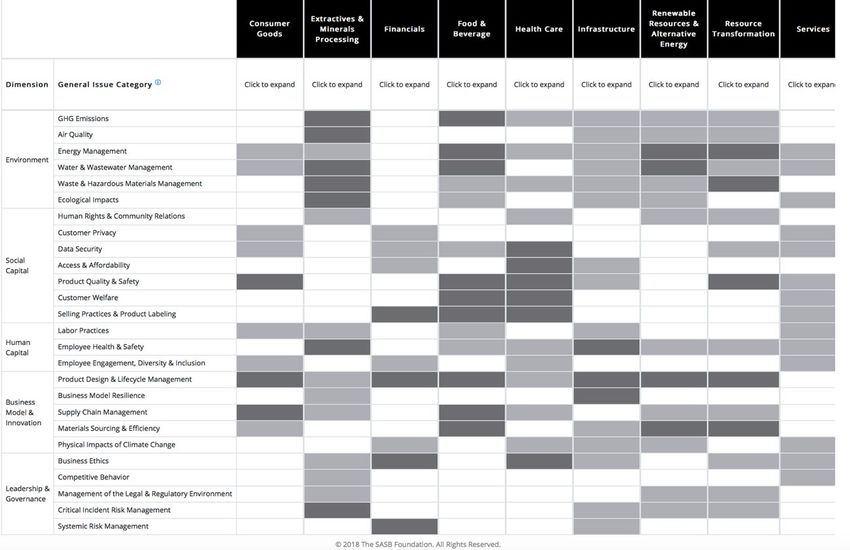
8company’s industry, sector, and size. SASB created a materiality map to demonstrate
the importance across industries using the five dimensions of sustainability (See
Appendix 1) (SASB, n.d.). The standards show information about corporate
performance as well the five dimensions of sustainability: the environment, social
capital, human capital, busines model and innovation, and leadership and governance
(See Figure 2 for graphic).
Figure 2: Five Key Dimensions of Sustainability
(SASB, n.d.)
The SASB breaks down each dimension of the five dimensions of sustainability for
each industry to target exactly what ESG issues an industry is facing. The SASB offers
standards for 77 industries across 11 sectors to ensure companies are accurately
applying the five dimensions of sustainability to their corporate activities. These 77
standards allow for standardization and comparability for companies in each industry
(SASB, n.d.).
9Current Literature about SASB
The current literature regarding SASB and sustainability reporting, current
literature has explored many connections between sustainability and a variety of
variables. Kim et al. (2012) explored the relation between sustainability scores and
earnings quality. Moser and Martin (2012) provided an overview of the materiality of
sustainability issues and called for further research on sustainability activities. Waddock
and Graves (1997), Barnett and Salomon (2012), Margolis et al. (2009), Eccles et al.
(2014) all question the relation between sustainability or sustainability ratings and firm
performance. Hoi et al. (2013) examined the relation between irresponsible
sustainability activities and corporate tax avoidance. On the other side, Davis et al.
(2015) explored the correlation between socially responsible firms and paying more
taxes. Khan et al. (2015) examined the relationship between material sustainability
issues and sustainability ratings. These papers contribute to current literature and help
companies and the accounting industry to create better measures of a company’s
sustainability performance. The results of this paper will examine the relation between
SASB sustainability disclosures and equity pricing.
10Chapter 2: Research and Methodology
The SASB Standards
The Purpose of SASB Standards
The SASB standards identify sustainability topics and performance metrics that are
financially material and are likely to impact companies in 77 industries. The standards
are designed to support internal and external reporting, build systems of internal control
and governance for key performance metrics, and capture reliable information about
key operational matters to drive long term value creation (SASB, n.d.). The standards
are designed to communicate corporate performance about relevant “sustainability
issues in a cost-effective and decision useful manner using existing disclosure and
reporting mechanisms” (SASB, 2018).
Overview of SASB Standards
Companies can use Sustainable Industry Classification System (SICS) to
determine which industry standards best identify relevant sustainability issues to their
company and similar companies. Once an appropriate industry standard is chosen, the
standards will include: disclosure topics, accounting metrics, technical protocols, and
activity metrics:
Disclosure A minimum set of industry-specific disclosure topics reasonably likely to
Topics constitute material information, and a brief description of how management or
mismanagement of each topic may affect value creation.
Accounting A set of quantitative and/or qualitative accounting metrics intended to measure
Metrics performance on each topic.
Technical Each accounting metric is accompanied by a technical protocol that provides
Protocols guidance on definitions, scope, implementation, compilation, and presentation,
all of which are intended to constitute suitable criteria for third-party assurance.
11Activity A set of metrics that quantify the scale of a company’s business and are
Metrics intended for use in conjunction with accounting metrics to normalize data and
facilitate comparison.
(SASB, 2018)
Table 2: Overview of the components of SASB standards
The standards described are to be used in conjunction with the SASB Standards
Application Guidance, the SASB Conceptual Framework, and the SASB Rules of
Procedures.
The Consumer Goods Sector
The consumer goods sector is a category of companies that provide goods that
are bought and used by consumers, individuals, or households rather than manufacturers
and industries (Scott & Investopedia Staff, 2020). These companies make and sell for
everyday private consumption. Companies of the consumer goods sector are involved in
distributing a wide range of items including food productions, packaged goods,
beverages, automobiles, electronics, clothing, household items, toys and many others
(Scott & Investopedia Staff, 2020). The consumer goods market must continuously
adapt to consumers demands and trends. Digital innovation, technology, and increased
focus on sustainable and healthy habits are some of the biggest influences on the sector
in recent years (Statista, n.d.). Given the industry trends and high demand for
sustainable products in this sector, this paper focuses on the application of SASB
standards in the consumer goods sector. The consumer goods sector can be broken
down into many different industries however, this paper focuses on two of them as
defined by SASB: (1) Apparel, Accessories and Footwear, and (2) Household and
Personal Products. The companies of interest were chosen from these industries. I used
all the public companies in each industry that disclosed according to SASB.
12Apparel, Accessories, and Footwear
The Apparel, Accessories, and Footwear industry includes companies involved
in the design, manufacturing, wholesaling, and retailing of various products, including
men’s, women’s, and children’s clothing, handbags, jewelry, watches, and footwear.
Products are largely manufactured by vendors in emerging markets, thereby allowing
companies in the industry to primarily focus on design, wholesaling, marketing, supply
chain management, and retail activities (SASB, 2018). For the players in the Apparel,
Accessory, and Footwear industry, the demand and companies are characterized by
fashion trends or consumer tastes, successful marketing campaigns to demographic
groups, and managing international operations, productions, and exportation (“Footwear
Manufacturing”, 2020; “Apparel Manufacturing”, 2021). The following table shows the
topic and accounting metrics of interest for companies in the Apparel, Accessories, &
Footwear industry:
13Sustainability Disclosure Topics & Accounting Metrics
(SASB, 2018)
There are nine publicly traded companies that disclose according to the SASB
Apparel, Accessories, and Footwear framework: Burlington Stores (BURL), Columbia
Sportswear (COLM), Deckers Outdoor (DECK), Gap (GPS), Hanesbrand Inc. (HBI),
Nike (NKE), PVH Corp (PVH), Ralph Lauren (RL), and VF Corp (VFC).
14Burlington Stores
Founded in 1972, Burlington is a holding company who sells merchandise
through their subsidiaries Burlington Coat Factory, Cohoes Fashion, Super Baby Depot
and MJM Designer shoes. They sell women’s ready to wear apparel, menswear, youth
and baby apparel, footwear, accessories, home, toys, and coats. They market and sell
their products to moderate, middle to higher price range (Burlington Stores Inc., n.d.)
and (“Burlington Stores Inc”, 2021).
Columbia Sportswear
Founded in 1938, Columbia Sportswear’s primary business activities include
designing, sourcing, marketing, and distributing active and outdoor lifestyle apparel,
footwear, accessories, and equipment. Their primary brands include Columbia, SOREL,
Mountain Hard Wear, and prAna. The Columbia line includes apparel, accessories,
footwear, and equipment for all seasons, activities, and age groups. The SOREL brand
primarily provides footwear for women, men, and youth consumers. Mountain Hard
Wear includes apparel, accessories, and equipment specifically for climbers and their
lifestyle. Lastly, prAna focuses on clothing and apparel for an active lifestyle (Columbia
Sportswear Co., n.d.) and (“Columbia Sportswear Co”, 2021).
Deckers Outdoor Corporation
Founded in 1973, Deckers Outdoor’s primary business activities include
footwear, apparel, and accessory design, marketing, and distribution. They have five
primary brands including UGG, Koolaburra by UGG, HOKA, Teva, and Sanuk. The
UGG and Koolaburra by UGG focus is on apparel, accessories, and footwear fashion
15for women, men, and children using sheepskin and other plush materials. HOKA is a
line of athletic footwear and apparel. Teva’s product line includes sandals, shoes, and
boots. Sanuk’s line focuses on sandals and the casual shoe categories (Decker's Outdoor
Corporation, n.d.) and (“Deckers Outdoor Corporation”, 2021).
Gap Incorporated
Founded in 1969, Gap Inc is a collection of brands that provide apparel, and
accessories for women, men, and children. Their brands include Gap, Old Navy,
Banana Republic, Athleta, Intermix, and Janie and Jack. Gap Inc is an omni-channel
retailer with stores in Unites States, Canada, United Kingdom, Asia, Europe, Latin
America, Middle East, and Africa (Gap Inc., n.d.) and (“Gap Inc.”, 2021).
HanesBrands Incorporated
HanesBrands Inc. manufactures and markets everyday basic apparel such as
bras, panties, shapewear, sheer hosiery, men’s underwear, children’s underwear, socks,
t-shirts, sweatshirts, fleece, and other activewear. Their innerwear and outerwear
apparel brands include Hanes, Champion, Playtex, Bali, Maidenform, JMS/Just My
Size, Wonderbra, and Gear for Sports. Outside the Unites States, they have additional
brands such as DIM, Nur Die/Nur Der, Lovable, Abanderado, Shock Absorber, Zorba,
Sol y Oro, Rinbros, Track N Field, and Ritmo (HanesBrands Inc., n.d.) and
(“HanesBrands Inc”, 2021).
Nike
Founded in 1964, Nike primary business activities are the design, development,
and marketing of athletic footwear, apparel, accessories, and equipment. Their products
16generally range in six categories including: Running, Basketball, the Jordan Brand,
Soccer, and Training & Sportswear products. Additionally, they market and sell
products for other sports such as football, baseball, cricket, golf, lacrosse, tennis,
skateboarding, volleyball, wrestling and other outdoor activities (Nike Inc., n.d.) and
(“Nike Inc.”, 2021).
PVH Corporation
Founded in 1881, PVH Corp. is primarily an apparel company which designs
and markets dress shirts, neckwear, sportswear, jeanswear, performance and intimate
apparel, underwear, swimwear, handbags, accessories, and footwear. PVH has several
notable brands including Calvin Klein, Tommy Hilfiger, Van Heusen, IZOD, Arrow,
Warner’s, Olga, Geoffrey Beene, and True & Co. The company divides its business
based on North America and International Segments (PVH Corp, n.d.) and (“PVH
Corporation”, 2021).
Ralph Lauren Corporation
Founded in 1967, Ralph Lauren designs, markets, and distributes premium
lifestyle products that include apparel, accessories, home, fragrances, and hospitality.
Their brand names include Ralph Lauren, Ralph Lauren Collection, Ralph Lauren
Purple Label, Polo Ralph Lauren, Double RL, Lauren Ralph Lauren, Polo Ralph Lauren
Children, Chaps, and Club Monaco (Ralph Lauren Corporation, n.d.) and (“Ralph
Lauren Corporation”).
17VF Corporation
Founded in 1899, VF primary business activities include designing, producing,
marketing, and distributing products such as outerwear, footwear, apparel, backpacks,
luggage, and accessories. VF has 16 brands that are divided by three segments:
Outdoor, Work, and Active. Their Outdoor brands are designed for outdoor based
lifestyle activities such as apparel, footwear, and equipment. Notable Outdoor brands
include Altra, Icebreaker, Smartwool, The North Face, and Timberland. Their Work
brand offers work and work-inspired apparel, footwear, and accessories. Those include
Bulwark Protection, Dickies, Horace Small, Kodiak, Red Kap, Terra, VF Solutions, and
Walls. Lastly, their Active brand offers active and active-inspired apparel, footwear,
and accessories. VF Active brands include Eagle Creek, Eastpak, JanSport, Kipling,
Napapijri, Supreme, and Vans (VF Corporation, n.d.) and (“VF Corporation, 2021).
Household and Personal Products
The Household and Personal Products industry comprises companies that
manufacture a wide range of goods for personal and commercial consumption,
including cosmetics, household and industrial cleaning supplies, soaps and detergents,
sanitary paper products, household batteries, razors, and kitchen utensils (SASB, 2018).
Usually operating globally, household and personal products companies typically sell
their products to supermarket chains, mass merchandisers, grocery stores, membership
club stores, drug stores, convenience stores, distributors, and e-commerce retailers
((SASB, 2018), “Soap and Other Detergent Manufacturing”, 2021; “Personal Care
Products Manufacturing”, 2021). For companies in the Household and Personal
Products industry, demand is driven from population growth, economic growth, and
18trends for cruelty free, clean, or sustainable ingredients (“Soap and Other Detergent
Manufacturing”, 2021; “Personal Care Products Manufacturing”, 2021). The following
table shows the topic and accounting metrics of interest for companies in the Household
and Personal Products industry:
Sustainability Disclosure Topics & Accounting Metrics
(SASB, 2018)
There are five publicly traded companies that disclose according to the SASB
framework for Household and Personal Products: Church and Dwight (CHD), The
19Clorox Company (CLX), Estee Lauder Companies (EL), Kimberly-Clark (KMB), and
The Proctor & Gamble Company (PG).
Church and Dwight
Founded in 1846, Church and Dwight’s primary business activities include the
development, manufacturing, and marketing a range of consumer products and brands.
Their notable brands and products respectively: ARM & HAMMER baking soda, cat
litter, laundry detergent, carpet deodorizer and other baking soda based products;
TROJAN condoms, lubricants and vibrators; OXICLEAN stain removers, cleaning
solutions, laundry detergents and bleach alternatives; SPINBRUSH battery-operated
toothbrushes; FIRST RESPONSE home pregnancy and ovulation test kits; NAIR
depilatories; ORAJEL oral analgesic; XTRA laundry detergent; L'IL CRITTERS and
VITAFUSION gummy dietary supplements; BATISTE dry shampoo; WATERPIK
water flossers and showerheads (Church & Dwight Co., Inc., n.d.) and (“Church &
Dwight”, 2021).
The Clorox Company
Founded in 1913, The Clorox Company manufactures and markets consumer
products in three segments: Health and Wellness, Household, and Lifestyle. Notable
brands and products include Clorox cleaning and disinfecting wipes and products, Pine-
Sol cleaners, Liquid-Plumr clog remover, Poett home care products, Fresh Step cat
litter, Glad bags and wraps, Kingsford charcoal, Hidden Valley dressing and sauces,
Brita water filtration products, Burt’s Bees natural personal care products, and several
20lines of vitamins, minerals, and supplements (The Clorox Company, n.d.) and (“The
Clorox Company”) .
Estee Lauder Companies
Founded in 1946, Estee Lauder Companies’ primary business activities include
the manufacturing and marketing of skin care, makeup, fragrance, and hair care
products. Estee Lauder Companies is made up of over 25 brands. Notable brands
include Aerin Beauty, Aramis, Aveda, BECCA, BOBBI BROWN, Bumble and bumble,
CLINIQUE, DARPHIN Paris, DKNY, DONNA KARAN, Dr. Jart+, Editions de
Parfums Frederic Malle, Ermenegildo Zegna, Estee Lauder, GLAM GLOW, Jo Malone
London, Kilian Paris, LA MER, Lab Series, LE LABO, MAC, Origins, RODIN olio
lusso, smashbox, Tom Ford Beauty, and Too Faced (Estee Lauder Companies, n.d.) and
(“Estee Lauder Companies”, 2021).
Kimberly-Clark Corporation
Established in 1872, Kimberly Clark’s primary business activities include the
manufacturing and marketing of household and personal products. Their brands and
products are segmented into five areas and their notable brands respectively: Adult
Care: Depend, Poise, Plentitud; Baby & Child Care: Huggies, Pull-Ups, GoodNites,
DryNites, Little Swimmers; Family Care: Kleenex, Cottonelle, Scott, Wondersoft;
Feminine Care: U by Kotex, Kotex; and K-C Professional: Kleenex, Scott, WypAll,
KleenGuard (Kimberly-Clark, n.d.) and “Kimberly Clark Corporation”, 2021).
21The Proctor & Gamble Company
Established in 1837, Proctor and Gamble provides consumer packaged goods in
five different segments: Beauty; Grooming; Health Care; Fabric and Home Care; Baby,
Feminine, and Family Care. Notable brands for each segment respective to the segments
include: Aussie, Head & Shoulders, Herbal Essences, Old Spice, Pantene, Olay, Secret,
Native; Braun, Gilette, joy+glee, Venus; Align, Clearblue, Meta, Pepto-Bismol, Prilosec
OTC, Vicks, ZzzQuil, Crest, Oral-B, Scope; Ariel, Bounce, Cheer, Downy, Gain, Tide,
Cascade, Dawn, Febreeze, Microban, Mr. Clean, Swiffer; Luvs, Pampers, Bounty,
Charmin, Puffs, Always, Just, Tampax (Proctor & Gamble Co., n.d.) and (“Proctor &
Gamble Co”, 2021).
Methodology
Stock Pricing
The purpose of this paper is to determine whether disclosing ESG information
according to SASB framework influences stock prices of a company. A stock price
reflects the company’s value or what the public is willing to pay for the piece of a
company (Corporate Finance Institute, n.d.). Furthermore, the law of supply and
demand demonstrates that companies with a higher stock price are companies the public
and investors are more interested in. A variety of factors can cause the stock price to
change in either direction. It was hypothesized that ESG information disclosed
according to SASB would positively affect share prices and demonstrate that disclosing
this information would be a material method to measure a company’s performance.
Comparing a company’s stock price in the days surrounding the release of the ESG
22information according to SASB can help determine if the information relayed in these
reports is of interest to the public and investors. To determine this information, the
change in stock price surrounding the release of the information was gathered and
analyzed.
Example of the data collected for each company
To perform this study, data was collected for each company to determine if ESG
information according to SASB framework resulted in a positive rate of return and
abnormal return. The following table is an example of the data analyzed for each
company:
Event Date: 9/27/20 BURLINGTON STORES
Date BURL SPY
-3 9/23/20 $ 196.97 $ 3,236.92
+3 9/30/20 $ 206.09 $ 3,363.00
Rate of Return 4.6% 3.9%
Abnormal Return 0.7%
For each company, the event date or when the information was released to the public
was collected. The stock price of the company three business days prior and three
business days following the event date was recorded as seen in column two and three.
Column four shows the recorded share prices for the S&P 500, a stock market index, on
the same dates recorded in column two. Row six shows the computed rate of return for
each company and the S&P 500 on the dates of interest. Row seven uses both values
from row six to compute the abnormal return on the event. This methodology was used
for all 14 companies.
23Chapter 3: Data and Results
Abnormal Returns Data
Using the selected methodology, the abnormal return was calculated for each
company and expressed as a percentage. The percentages were used as a data set to
analyze the results. The following table shows the results for each company by their
ticker symbol on the stock market.
Company (Ticker Symbol) Abnormal Return (%)
BURL .74%
CHD .77%
CLX -.22%
COLM 1.90%
DECK -1.93%
EL 1.71%
GPS .75%
HBI -1.36%
KMB -1.55%
NKE -2.25%
PG -.82%
PVH -5.30%
RL .71%
VFC 4.77%
24Statistical Data
The abnormal returns created a data set to be analyzed using hypothesis tests
and tests of significance. Using this data set, the mean, standard deviation, test statistic,
and p-value was computed with alpha set at .05. The following table shows these
values:
Mean -0.15%
Standard Deviation 0.00633167
Test Statistic -0.2347018
P-Value 0.40904819
Results and Discussion
After statistical analysis on the data set, the results are inconclusive at this time.
The test statistic and p-value suggest that the evidence is not strong or robust enough to
conclude that the evidence is of statistical significance. Our range of abnormal returns
included a minimum of -5.30% and a maximum of 4.77%. From these results, it is
concluded that there may have been some confounding factors that influenced the
results.
Primarily, there may not have been enough evidence. This paper examines 14
companies across two different industries. Majority of these companies just started
compiling and releasing this information in the last two years. For future studies, using
more companies may provide a more solid trend and conclusion. Other confounding
factor could be the investor and public reception and attitude. The SASB index is
usually enclosed in the annual or sustainability report and is often scheduled to be
25released. They may have been expecting this information and were not surprised by the
information. Furthermore, SASB disclosures are not required. Companies opt in and
choose to spend their resources on these reports. It is likely investors, and the public
expected the information to be released and expected the results of the SASB
disclosures therefore their presence did not drastically affecting the stock prices.
Another confounding variable is the market landscape itself. It can be difficult to
account for all the changing factors of the business world. To account for this and
minimize daily market factors, the S&P 500 market price was used. However, there is a
possibility that there is other noise, such as the COVID-19 pandemic, affected the
results. The results may have been inconclusive, but this study contributes to overall
literature surrounding sustainability disclosures and the implementation of SASB.
26Chapter 4: Conclusion
In conclusion, this paper aimed to discover the effects of ESG information
disclosed according to SASB on share prices of 14 companies in the consumer goods
sector. By using share prices to find the rate of return and abnormal return, this study
found the results to be inconclusive and in need of more data. This paper comments on
the current literature and discussion surrounding ESG disclosures and the
implementation of SASB. While the results of this study may have been inconclusive,
sustainability reporting is important and in demand. In 2020, nearly 90% of the
companies in the S&P 500 published sustainability reports and 14% of them align with
SASB (G&A Institute Inc., 2020). Importantly, these reports are not required.
Companies choose to invest their resources in collecting, compiling, and disclosing this
information. They are choosing to do it for a reason. From a strictly financial point of
view, companies would not use their resources if they did not see value creation or a
return on this investment. This paper aimed to prove that through share prices and while
this study is inconclusive, more companies and more SASB report releases will allow
for a larger sample size and more accurate statistical significance.
27Glossary
All definitions are referenced from Oxford’s Dictionary of Finance and
Banking. See Bibliograph for citation.
Abnormal Return: A rate of return for taking a particular risk that is greater than that
required by the market.
Financial Accounting Standards Board (FASB): In the USA, a non-government body
founded in 1973 with the responsibility of promulgating generally accepted accounting
principles. This is achieved by the issue of Statements of Financial Accounting
Standards, which certified public accountants are expected to follow. Owing to the
FASB’s close relationship with the Securities and Exchange Commission, US
companies that desire a market listing have to comply with the standards it issues.
Materiality: The extent to which an item of accounting information is material.
Information is considered material if its omission from or misstatement in a financial
statement could influence the decision making of its users. Materiality is therefore not
an absolute concept but is dependent on the size and nature of an item and the particular
circumstances in which it arises.
Rate of Return: The annual amount of income from an investment, expressed as a
percentage of the original investment. This rate is very important in assessing the
relative merits of different investments. It is therefore important to note whether a
quoted rate is before or after tax, since with most investments, the after-tax rate of
return is most relevant.
S&P 500: A US credit rating agency and financial services company based in New
York. S&P rates the bonds issued by companies, public corporations, and sovereign
states on a scale from AAA downwards to D: a rating of BBB or above denotes
‘investment grade’, lower ratings ‘speculative grade’. The company also publishes a
series of stock-market indexes, the widest being the S&P 500.
28Appendix
Appendix 1:
Sasb Materiality Map by Industry.
29Bibliography
Axelrod, J. (2019, February 26). Corporate Honesty and Climate Change: Time to Own
Up and Act. Retrieved from NRDC: https://www.nrdc.org/experts/josh-
axelrod/corporate-honesty-and-climate-change-time-own-and-
act#:~:text=Corporations%20produce%20just%20about%20everything,climate
%20change
Barnett, M. L., & Salomon, R. M. (2012). Does it pay to be really good? addressing the
shape of the relationship between social and financial performance. Strategic
Management Journal, 1304-1320.
Battilana, J., & Norris, M. (2019). The Sustainability Accounting Standards Board
(Abridged). Boston: Harvard Business School.
Burlington Stores Inc. (n.d.). Investor Relations: Corporate Profile. Retrieved from
Burlington: https://www.burlingtoninvestors.com/investor-relations
Church & Dwight Co., Inc. (n.d.). Investor Relations: Company Profile. Retrieved from
Church & Dwight: http://investor.churchdwight.com/investors/company-profile
Columbia Sportswear Co. (n.d.). Investor Relations: Company Information. Retrieved
from Columbia Sportswear Co.: https://investor.columbia.com/company-
information
D'Aquila, J. M. (2018, July). The Current State of Sustainability Reporting. Retrieved
from CPA Journal: https://www.cpajournal.com/2019/08/01/icymi-the-current-
state-of-sustainability-reporting/
Davis, A. K., Guenther, D. A., Krull, L. K., & Williams, B. M. (2015). Do Socially
Responsible Firms Pay More Taxes? The Accounting Review.
Decker's Outdoor Corporation. (n.d.). Investor Relations. Retrieved from Deckers
Outdoor: https://ir.deckers.com/ir-home/default.aspx
Eccles, R. G., Ioannou, I., & Serafeim, G. (2014). The Impact of Corporate
Sustainability on Organizational Processes and Performance. Management
Science, 2835-2857.
Environmental Leader. (2016, June 30). Share of S&P 500 companies who published
sustainability reports in the United States from 2011 to 2015 [Graph]. Retrieved
from Statista: http://www.statista.com/statistics/574031/sandp-companies-who-
published-sustainabilty-reports-in-the-us/
30Fink, L. (2020, January). Letter to CEOs. Retrieved from A Fundamental Reshaping of
Finance: https://www.blackrock.com/corporate/investor-relations/larry-fink-ceo-
letter
Gap Inc. (n.d.). Investor Relations: About . Retrieved from Gap Inc.:
https://www.gapinc.com/en-us/about
HanesBrands Inc. (n.d.). Investor Relations: Our Company. Retrieved from
HanesBrands: https://www.hanes.com/corporate
Hoi, C. K., Wu, Q., & Zhang, H. (2013). Is Corporate Social Responsibility (CSR)
Associated with Tax Avoidance? Evidence from Irresponsible CSR Activities.
The Accounting Review, 2025-2059.
Hyman, E. (2020, January 2). Who's Really Responsible for Climate Change. Retrieved
from Harvard Political Review: https://harvardpolitics.com/climate-change-
responsiblity/
Khan, M., Serafeim, G., & Yoon, A. (2016). Corporate Sustainability: First Evidence on
Materiality. The Accounting Review, 1697-1724.
Kim, Y., Park, M., & Wier, B. (2021). Is earnings quality associated with corporate
social responsibility. The Accounting Review, 761-796.
Law, J. (2018). Standard and Poor’s. In A Dictionary of Finance and Banking. : Oxford
University Press. Retrieved 13 May. 2021, from
https://www.oxfordreference.com/view/10.1093/acref/9780198789741.001.
0001/acref-9780198789741-e-3595.
Margolis, J., & Walsh, J. (2003). Misery love companies: rethinking social initiatives by
business. Administrative Science Quarterly, 268-305.
Mergent. (2021, May 3). Apparel Manufacturing: Industry Overview Profile. First
Research. mergent.firstresearch-
learn.com/industry_detail.aspx?pid=147&chapter=1.
Mergent. (2020, December 21). Footwear Manufacturing: Industry Overview
Profile. First Research. mergent.firstresearch-
learn.com/industry_detail.aspx?pid=130&chapter=1.
Mergent. (2021, January 11). Personal Care Products Manufacturing: Industry
Overview Profile. First Research. mergent.firstresearch-
learn.com/industry_detail.aspx?pid=329&chapter=1.
31Mergent. (2021, January 11). Soap & Other Detergent Manufacturing: Industry
Overview Profile. First Research. mergent.firstresearch-
learn.com/industry_detail.aspx?pid=223&chapter=1.
Mergent. (2021). Burlington Stores Inc. company details. Mergent Online.
mergentonline.com/companydetail.php?compnumber=137065&pagetype=synop
sis
Mergent. (2021). Columbia Sportswear Company company details. Mergent Online.
mergentonline.com/companydetail.php?compnumber=94545&pagetype=synops
is
Mergent. (2021). The Clorox Company company details. Mergent Online.
mergentonline.com/companydetail.php?compnumber=1813&pagetype=synopsis
Mergent. (2021). Deckers Outdoor Corporation company details. Mergent Online.
hmergentonline.com/companydetail.php?compnumber=78314&pagetype=synop
sis
Mergent. (2021). Estee Lauder Companies company details. Mergent Online.
mergentonline.com/companydetail.php?compnumber=86890&pagetype=synops
is
Mergent. (2021). Gap Inc. company details. Mergent Online.
mergentonline.com/companydetail.php?compnumber=3551&pagetype=synopsis
Mergent. (2021). HanesBrands Inc. company details. Mergent Online.
mergentonline.com/companydetail.php?compnumber=114128&pagetype=synop
sis
Mergent. (2021). Kimberly-Clark Corporation company details. Mergent Online.
mergentonline.com/companydetail.php?compnumber=4738&pagetype=synopsis
Mergent. (2021). Nike Inc. company details. Mergent Online.
mergentonline.com/companydetail.php?compnumber=16861&pagetype=synops
is
Mergent. (2021). Proctor & Gamble Company company details. Mergent Online.
mergentonline.com/companydetail.php?compnumber=6814&pagetype=synopsis
Mergent. (2021). PVH Corporation. company details. Mergent Online.
mergentonline.com/companydetail.php?compnumber=6632&pagetype=synopsis
Mergent. (2021). Ralph Lauren Corporation. company details. Mergent Online.
mergentonline.com/companydetail.php?compnumber=91214&pagetype=synops
is
32Minguel, G. (2017, August 22). The evolution of sustainability reporting. Retrieved
from University of Tilburg: http://arno.uvt.nl/show.cgi?fid=143881
Moser, D. V., & Martin, P. R. (2012). A Broader Perspective on Corporate Social
Responsibility Research in Accounting. The Accounting Review, 797-806.
Nike Inc. (n.d.). Investor Relations. Retrieved from Nike: https://purpose.nike.com/
PVH Corp. (n.d.). Investor Relations. Retrieved from PVH:
https://www.pvh.com/investor-relations
Ralph Lauren Corporation. (n.d.). Investor Relations: Company Profile. Retrieved from
Ralph Lauren: https://investor.ralphlauren.com/investor-overview
SASB. (2018). Apparel, Accessories & Footwear. San Francisco: SASB.
SASB. (2018). Household & Personal Products. San Francisco: SASB.
SASB. (n.d.). About Us. Retrieved from SASB: sasb.org/about/
Scott, G., & Investopedia Staff. (2020, March 27). Consumer Goods Sector. Retrieved
from Investopedia: https://www.investopedia.com/terms/c/consumer-goods-
sector.asp#:~:text=The%20consumer%20goods%20sector%20is,than%20by%2
0manufacturers%20and%20industries.&text=This%20sector%20includes%20co
mpanies%20involved,beverages%2C%20automobiles%2C%20and%20electroni
c
Securities and Exchanges Commission. (n.d.). What We Do. Retrieved from SEC.gov:
https://www.sec.gov/about/what-we-do
Statista. (n.d.). Consumer Goods & FMCG. Retrieved from Statista:
https://www.statista.com/markets/415/consumer-goods-fmcg/
UN Environment Programme. (n.d.). UN Environment Programme. Retrieved from
Corporate Sustainability Reporting: https://www.unep.org/explore-
topics/resource-efficiency/what-we-do/responsible-industry/corporate-
sustainability
United Nations. (1987). Report of the World Commission on Environment and
Development: Our Common Future. Oxford: Oxford University Press.
United States Environmental Protection Agency. (2021, February 2). Learn About
Sustainability. Retrieved from EPA.gov:
https://www.epa.gov/sustainability/learn-about-
sustainability#:~:text=To%20pursue%20sustainability%20is%20to,support%20
present%20and%20future%20generations.
33VF Corporation. (n.d.). Investor Relations: Company Information. Retrieved from VF:
https://www.vfc.com/investors/company-information
Waddock, S., & Graves, S. (n.d.). Stakeholder performance implications ofcorporate
repsonsibility. Journal of Business Performance Management, 113-124.
34You can also read