INVESTOR PRESENTATION - March 2021 - First Abu Dhabi Bank
←
→
Page content transcription
If your browser does not render page correctly, please read the page content below

INVESTOR PRESENTATION
March 2021
Economic and banking
    sector review

Investor Presentation March 2021   2
UAE economic overview
Diversified economy with a strong fiscal position

                                                                                ~10.7Mn people (2019e)1
A cosmopolitan country                                                             Expatriates ~85%
                                                                                                                                             • The UAE’s policy response to the COVID-19 pandemic was
                                                                                                                                               proactive and decisive in the form of fiscal and monetary stimulus
2nd largest economy in GCC                                                  USD 421Bn 2019e Nominal GDP1                                       packages, including an AED 256Bn (USD 69.7Bn) stimulus plan
(30th largest in the world)                                                   USD 39,180 GDP per capita                                        launched by the UAE Central Bank (more details on slide #51)

                                                                                                                                             • Despite ongoing uncertainties, the country’s best in class COVID-19
                                                                       ~98Bn boe (~8% of global oil reserves)3
6th   largest proven oil reserves                                       Current capacity ~4.0Mn barrels/day                                    vaccination programme is expected to drive UAE’s economic
                                                                                                                                               outlook with the real GDP5 expected to grow by 2.5% in 2021,
                                                                                                                                               further supported by tailwinds including stabilized oil prices and
One of the highest rated                                                                Aa2 / AA-                                              government stimulus measures
sovereigns                                                                             Moody’s/ Fitch

                                                                               Real GDP Growth5
                                                                       5%
GDP growth expectations                                                0%
                                                                      -5%
                                                                     -10%                                                                                                    UAE

Diversified & competitive                                                     75%                 16th
                                                                         non-oil sector       ease of doing
economy                                                                   contribution          business
                                                                           to nominal           rankings4                                    UAE federation established in 1971 comprising 7 Emirates
                                                                             GDP2
                                                                                                                                             One of the 6 GCC (Gulf Cooperation Council) states

1 IMF World Economic Outlook - October 2020                                                  3 OPEC Annual Statistical Bulletin 2020; boe (barrel of oil equivalent)   5 In-house GDP forecast for FY21 and FY22; IMF forecasts for prior years
2 Federal Competitiveness and Statistics Authority, 2019 Nominal GDP Preliminary Estimates   4 World Bank’s Ease of Doing Business Rankings 2020

Investor Presentation March 2021                                                                                                                                                            Economic & Banking sector review                      3
UAE well on track to inoculate 50% of the population by end of Q1’21
Vaccine doses administered per 100 people1 As of Feb 28 2021
UAE is a vaccination • 2nd globally1 (after Israel) by # of doses
93.7 2nd highest leader, although the administered (60.9 per 100 people, 6.0
globally
number of infections Mn in total)
60.9
have risen • ~40% of the UAE population received the
31.1
22.5 considerably vaccine; currently on track to inoculate
21.1 17.6 17.5 10.6 10.1 9.8 50% of its population by end of Q1’21
• Availability of multiple vaccines –
Israel UAE UK USA Serbia Chile Bahrain Denmark Turkey Morocco AstraZeneca, Pfizer, Sinopharm &
Sputnik V
Daily Covid-19 cases2 As of Feb 28 2021
4,500 Apr-5: Dubai May-12: Jun-2: Abu Jul-7: Dubai re- Sep: Dubai & Sharjah Dec: Start of Dec-Jan: Dubai Feb: New Government attempts • Ongoing restrictions in entering the
full lockdown businesses are Dhabi full opens for tourism students return to vaccination drive visited by 560k restrictions
re-opening in lockdown (40k a month) classrooms for wider society tourists implemented to to prevent further emirate of Abu Dhabi (incl. Covid test)
4,000 Dubai contain spread
spread… • Limits tightened as of Feb for restaurants,
3,500 social events, malls, live entertainment
etc
3,000
2,500 …while keeping the • Dubai hotels occupancy rose to an
economy open average of 71% in December, the busiest
2,000
month for hospitality since the pandemic
1,500 began
1,000 • Major sports events and galas relocated
to the UAE from other countries
500
-
Mar-20 Apr-20 May-20 Jun-20 Jul-20 Aug-20 Sep-20 Oct-20 Nov-20 Dec-20 Jan-21 Feb-21
1 Our World in Data (Countries with population greater than >1Mn; this is counted as a single dose, and may not equal the total number of people vaccinated)
2 National Emergency Crisis and Disasters Management Authority
3 Other sources include Gulf News, Financial Times
Investor Presentation March 2021 Economic & Banking sector review 4Abu Dhabi - the capital
Highest rated ‘sovereign’ across MENA reflecting strong fiscal and external metrics
Highest sovereign ratings in MENA
Aa2 / AA / AA “The ‘AA’ rating reflects Abu Dhabi's strong fiscal and
Moody’s / S&P / Fitch external metrics and high GDP per capita…
“Long term growth outlook is supported by continued
USD 249Bn 2019e Nominal GDP1
Major contributor to UAE GDP 59% of UAE’s 2019e Nominal GDP
structural reforms. The government is undertaking further
reforms (…) including opening some sectors to 100% foreign
ownership and a relaxation of visa rules.”
2nd highest GDP per capita
USD 85,6842 Extract from Fitch report published on 29 October 2020, reaffirming Abu
in the world Dhabi’s AA credit rating, with a stable outlook
Sovereign foreign assets – 218% of GDP3
Strong fiscal position Government debt – only 16% of GDP4
87% of UAE land area Ras al Khaimah
Ajman Umm al Quwain
Estimated population4 : 2.9 Mn Sharjah
Dubai
On clear path to economic 59% non-oil sector contribution to nominal GDP1, Fujairah
diversification up from 45% in 2013
Abu Dhabi
To transform Abu Dhabi into a knowledge-
based economy and reduce its dependence on
Long term vision
the hydrocarbon sector
(2030 Economic Vision, Ghadan 2021)
In the context of COVID-19, Abu Dhabi announced that previously budgeted capital
expenditure plans would be maintained, and that oil production would be proactively
managed to stabilise oil prices and revenues
1 Statistical Yearbook of Abu Dhabi 2020 as of 13th May 2020, preliminary estimates 3 Fitch Ratings (29 October 2020)
2 After Luxembourg - IMF World Economic Outlook, October 2020; GDP per capita based on 2019e Nominal GDP, 2016 Population (SCAD) 4 S&P Global Ratings (26 March 2020)
Investor Presentation March 2021 Economic & Banking sector review 5Resilient economy despite Covid-19 impact
Both, PMI and Oil prices, have significantly recovered from April’20 lows
A robust and diversified economy1 UAE remains top FDI destination in GCC (USD Bn)2
2021e Nominal GDP 2021e Fiscal Balance 2021e Gross Debt Avg breakeven oil price
(USD Bn) (% GDP) 2020e (% GDP) (2021-22) USD/bbl UAE 13.8
KSA 735 (6.0) (10.6) 34.3 69 Saudi Arabia 4.6
UAE 373 (5.1) (9.9) 38.2 48
Oman 3.1
Qatar 156 3.3 3.0 60.6 55
Bahrain 0.9
Kuwait 116 (8.5) 36.6 72
(10.7)
Kuwait 0.1
Oman 65 (18.7) 88.7 75
(16.8)
Bahrain 37 (9.2) (13.1) Qatar (2.8)
85
130.6
Stablising oil prices supported by
production cuts by OPEC+3 UAE PMI has recovered from lockdown lows4 COVID-19 impacted projects awarded in Q4’205
Oil Production (Mn bl/day) (LHS) Abu Dhabi Dubai Other Emirates
4.0 Brent Monthly Average (USD/bl) (RHS) 90
60
80 15
3.5
3.0 62 70 55
60
2.5 10
50.6
USD Bn
2.6 50
2.0 50
40
1.5
30 5
1.0 20 45
0.5 10
- - 40 0
Jun-20
Jun-19
Mar-19
Mar-20
Dec-19
Dec-18
Dec-20
Sep-19
Sep-20
Q1'20
Q1'18
Q2'18
Q3'18
Q4'18
Q1'19
Q2'19
Q3'19
Q4'19
Q2'20
Q3'20
Q4'20
Jun-19
Jun-20
Mar-19
Mar-20
Dec-20
Dec-18
Dec-19
Sep-19
Sep-20
1 IMF World Economic Outlook, October 2020; Fitch
4 Markit Economics-PMI (Purchasing Manager Index) (Mar 2021)
2 World Investment Report 2020 - UNCTAD Federal Competitiveness and Statistics Authority
5 Meed Projects, Dec 2020
3 Bloomberg OPCRUAE Index, Feb 2021
Investor Presentation March 2021 Economic & Banking sector review 6Real estate market sees signs of stabilisation in Abu Dhabi
Visa and citizenship reforms to support demand for long-term and permanent residences
Nominal GDP breakdown1 UAE real estate market total existing stock vs FY’21e supply3
UAE FY'21e deliveries Total existing stock • The real estate market in UAE continues
USD 414Bn
8,900 761 to be oversupplied
(2018) 26% 9%
Construction and Real
41%
Estate 4,100 • Contraction in Abu Dhabi’s real estate
3,800
Mining and quarrying
13% 585 2,800 sale prices has been moderating, while
6% 264
Abu Dhabi Manufacturing 185 293 Dubai is expected to witness higher
USD 249Bn 105
6% 15 53 2.5 16 project deliveries in FY’21e
14%14% (2019) Trade, Restaurants & 30 131
8% 9% Hotels
Finance
Abu Dubai Abu Dubai Abu Dubai Abu Dubai • UAE’s real estate market is expected to
Dhabi Dhabi Dhabi Dhabi
25% benefit from the launch of new programs
Others2 Office Residential Retail Hospitality and initiatives, including the UAE
29% Gross lettable area Units (‘000) Gross lettable area Hotel keys (‘000)
(‘000 sqm) (‘000 sqm) citizenship reforms and long-term
residency programs for foreigners like
Sale prices - mainstream residential market property4 Rental prices - mainstream residential market property4 the “Thrive in Abu Dhabi” program
Abu Dhabi - All Properties (YoY Change) Abu Dhabi - All Properties (YoY Change)
Dubai - All Properties (YoY Change) Dubai - All Properties (YoY Change)
0% 0%
-1% -2.0%
-2%
-2%
-4.2%
-3% -4%
-4%
-6%
-5%
-6% -8%
-7.1%
-7% -10%
-8% -12.2%
-12%
-9%
-10% -14%
Dec'19 Feb'20 Apr'20 Jun'20 Aug'20 Oct'20 Dec'20 Dec'19 Feb'20 Apr'20 Jun'20 Aug'20 Oct'20 Dec'20
1 Federal Competitiveness and Statistics Authority 3 JLL Real Estate Market Overview – Q1’21
2 Others include Agriculture, Utilities, Transportation, Communication, Government and Other activities 4 REIDIN, UAE Monthly Report Dec 2020
Investor Presentation March 2021 Economic & Banking sector review 7Sound and highly capitalised banking sector
Ample liquidity; subdued credit growth in 2020 reflects Covid-19-led slowdown
UAE Banking Sector Key Indicators1 FAB has a dominant market share amongst a crowded UAE banking sector3
Figures in USD Bn Dec’20 Dec’19 YoY • UAE banking sector : 21 Local and 38 Foreign banks (Incl. 11 wholesale banks)
• FAB is one of the 4 Domestic Systematically Important Banks (DSIBs) in UAE
Total Assets, net2 826 803 2.7%
Loans and Advances, net2 442 443 -0.1% Total Assets Gross Loans Deposits
(UAE listed banks3) USD 815Bn USD 475Bn USD 521Bn
Customer Deposits 513 509 0.8%
LDR2 86% 87% -77bps 79% 78% 78%
Top 4 (incl FAB)
Lending to Stable Resources Ratio4 78% 81% -340bps
FAB
CAR (Basel III) (Dec’20) 18.2% 17.7% +50bps
31% 23% 29%
CET1 (Basel III) (Dec’20) 14.9% 14.7% +20bps
Loan and deposit historical growth trend1 Key Highlights
Credit growth, net (YoY) Deposits growth (YoY) • While gross credit growth was +1.2% yoy, increase in provisions led to -0.1%
decline in net loans driven by Private sector (-2.3%); Gross credit growth was
8.0% 7.9% 6.5% driven by growth in Public sector lending
6.2%
4.1%
0.8% • Expected economic recovery should support sector credit growth with
5.8% 5.7%
3.5% 4.3% Government and Public sector as one of the key drivers
1.7% -0.1%
2015 2016 2017 2018 2019 2020
LDR (%) 93 93 90 87 87 86
1 Source: UAE Central Bank, FAB Data as of 31 Dec 2020 3 Source: Bloomberg, based on FY’20 financials reported by 14 listed UAE banks as of 28 Feb 2021
2 Net of Provisions 4 Total advances (net lending + net financial guarantees & stand-by LC+ Interbank placements more than 3 months)/ sum of (net free capital
funds + total other stable resources)
Investor Presentation March 2021 Economic & Banking sector review 8FAB in Brief
9The UAE’s leading bank, and one of the world’s largest and safest financial
institutions
▪ The largest bank in the UAE by total assets and market
capitalisation, with the strongest combined credit ratings of any
other bank in MENA
▪ A dominant and diversified banking franchise with market-
leading corporate and personal banking businesses, and a 919 250 141 38
presence across 5 continents AED Bn USD Bn AED Bn USD Bn
Total Assets Market Cap
Ranked #109 Amongst the Top 50 Banks
▪ Resilient profile amidst unprecedented economic backdrop in in the World1 in the World2
2020
AA-
Credit Ratings3
▪ Robust foundation with a strong balance sheet and solid
fundamentals
▪ On a clear path to deliver superior and sustainable One of the safest and strongest banks globally4
Ranked #16 safest commercial bank in the world
shareholder returns
13.0% 27.0% 13.3%
1 The Bankers’ Top 1000 World Banks, July 2020
2 Bloomberg
3 AA- and equivalent as rated by Moody’s / S&P / Fitch
4 #16 - Safest commercial banks worldwide ranking by Global Magazine; #85 - Tier 1 capital strength ranking by The Bankers’
5 All figures as on 31 Dec 2020
RoTE CI ratio
(ex-integration costs)
CET1
Investor Presentation March 2021 FAB in Brief 10The safest and strongest bank in the Middle East
MOODY’S S&P Fitch
LT Aa3 AA- AA-
Strongest combined credit ratings ST P-1 A-1+ F1+
amongst any other bank in MENA Outlook Stable Negative Stable
Recognised as one of the safest and strongest banks worldwide
Safest banks’ rankings by Global Finance1 Top 1000 banks’ rankings by The Banker2
#1 in UAE & Middle East #1 #2
in UAE in Middle East
by Tier 1 capital strength by Tier 1 capital strength
#4 in Emerging Markets
#85 #109
#16 Safest Commercial Bank Worldwide Worldwide Worldwide
by Tier 1 capital strength by Total Assets
1 Global Finance Magazine safest bank rankings, October 2020
2 The Banker’s 2020 Top 1000 World Banks Rankings, July 2020
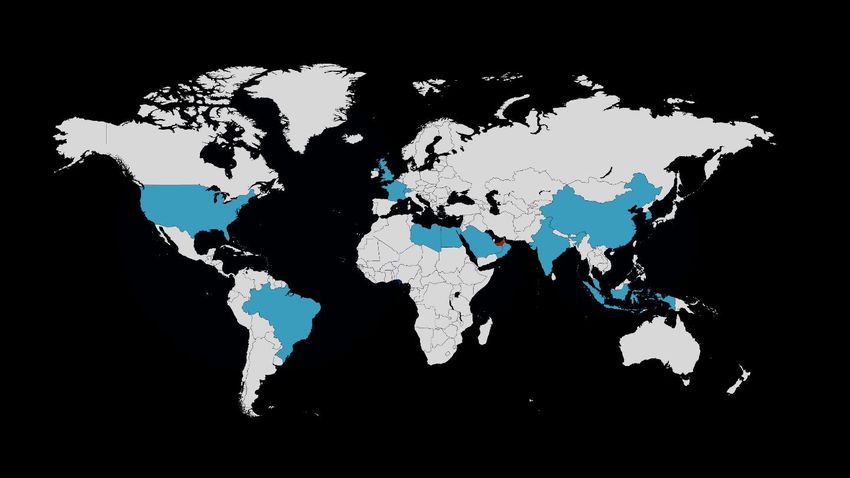
Investor Presentation March 2021 FAB in Brief 11Strong network facilitating trade and investment flows between key
international markets
Europe, Americas, Middle East & Africa (EAMEA) Asia Pacific (APAC)
5 France UAE Libya China/Hong Kong
Continents UK Bahrain Oman India
Global presence Switzerland Indonesia
Egypt Saudi Arabia
USA Kuwait Labuan (Malaysia)
Brazil Singapore
73 South Korea
Branches/ Cash
offices in UAE
499
ATMs/CDMs in UAE
5,054
Employees
globally (FTEs1)
>3 Million
UAE Customers2
All figures as on 31 Dec 2020
1 Full Time Employees, excludes outsourced staff
2 includes Ratibi (Wages Protection System) and E-dirham customers
The above map summarises market presence for FAB and its subsidiaries, where the Group currently has active operations; For information about legal presence please refer to Notes #3 and #37 of Dec-end 2020 financial statements
Investor Presentation March 2021 FAB in Brief 12A market heavyweight
Overview1 Strong shareholding3
• Listed on Abu Dhabi Securities Exchange (ADX)
ADIC PJSC,
• Symbol: FAB, ISIN: AEN000101016 33.3%
• Market capitalisation: AED 141Bn (USD 38Bn) Foreigners (ex-GCC),
14.6% MIC,
(Amongst the top 50 banks globally)
37.0%4
• No. of shares issued: 10,920Mn GCC (ex-UAE) 1.5%
Mamoura Diversified
• Foreign Ownership Limit (FOL): 40% Global Holding PJSC, 3.7%
• Free Float2: 44%
• Valuation multiples (based on FY’20 financials) Other UAE
P/TE – 13.9x I P/TB – 1.8x I D/Y – 5.7% Entities/Individuals 31.6% Abu Dhabi Ruling
(2020 dividend) Family,5 15.3%
The largest constituent on ADX, and one of the largest MENA constituents on Emerging Markets and ESG indices
Rebased to FABs share price
Index1 Ticker Weight% 20 FAB ADX MSCI EM Banks
Abu Dhabi Securities Market Index ADSMI 38.72%
15
Bloomberg EMEA Banks Index BEUBANK 3.46% 12.90
11.76
MSCI EM MXEF 0.12% 10
8.67
MSCI EM Banks MXEF0BK 0.95%
FTSE Emerging Index FTAG01 0.20% 5
MSCI EM ESG Leaders M1EFES 0.24%
-
FTSE 4 Good Emerging Markets (ESG index) F4GEM 0.44% Dec/17 Jun/18 Dec/18 Jun/19 Dec/19 Jun/20 Dec/20
1. Based on closing prices as of 31 Dec 2020 and FY’20 financials, where applicable 4. Through its 100% owned subsidiaries ADIC PJSC and Mamoura Diversified Global Holding PJSC (formerly known as Mubadala Development Company PJSC);
2. Free float designates FAB shares available for purchase in public equity markets which are not strategic in nature MIC is 100% owned by the Emirate of Abu Dhabi
3. Shareholding percentage based on outstanding shares (net of 9.0Mn treasury shares) as of Dec-end 2020 5. Members of/companies owned by the Abu Dhabi ruling family: Each investor (natural of legal person) within this group, owns less than 5% of the company’s
shares, and is free to buy or sell FAB shares
Investor Presentation March 2021 FAB in Brief 13Leading UAE and regional bank
FY’20
Banking sector assets1 National Net Profit2 Total Assets2 Equity2 Market Cap4 Credit Ratings4
(USD Bn) champion2,3 (USD Bn) (USD Bn) (USD Bn) (USD Bn) (Moody’s/S&P/Fitch)
868 FAB 2.9 250 29.7 38.4 Aa3 / AA- / AA-
UAE
794 NCB 3.0 159 21.3 34.6 A1 / BBB+ / A-
KSA
456 QNB 3.3 279 26.4 44.7 Aa3 / A / A+
Qatar
240 NBK 0.8 95 13.2 18.2 A1 / A / AA-
Kuwait
206 AUB 0.5 40 5.0 7.3 NA / BBB / BB+
Bahrain
Bank 32
94 0.4 5.3 3.4 Ba3 / B+ / BB-
Oman Muscat
1 Central Bank information as of the latest available data (31 Dec 2020); Assets are gross including provisions
2 Company information as of 31 Dec 2020, unless specified otherwise
3 Defined as the largest bank in the country by total assets
4 Based on 31 Dec 2020; Source Bloomberg
Investor Presentation March 2021 FAB in Brief 14Globally outstanding rating and returns
FAB is amongst the most profitable AA- rated banks globally
25%
Western banks
GCC banks
APAC banks
20%
NCB
Return on Tangible Equity (%)
RBC****
TDBank****
HDFC Bank*
QNB Macquarie*
15% CBA** JP Morgan
Scotia****
DBS Morgan Stanley
UOB BMO**** ICBC
UBS Agri Bank China
CBK
OCBC Bank of China
Handelsbanken Credit Agri GS
BCV BofA Bank RBS
10% Swedbank Woori
ING Saudi Fransi
BNP ENBD
Samba Credit Suisse
ADCB Nomura* ICICI* State Bank of India*
NBK Citigroup
Ind. Bank of Korea Sumitomo*
Lloyds
ANZ*** CBQ
Nordea Mizuho* Doha Bank Barclays
5% NAB*** Rabobank StanChart ABC
SocGen
Westpac*** HSBC
MUFG*
0%
AA+ AA AA- A+ A A- BBB+ BBB BBB- BB+ BB
Composite Rating
Notes: Based on the available financials on Bloomberg, RoTE for peer banks are estimated as: {net attributable profit less Tier-1 interest or Coupon payable on capital securities} / [average tangible equity]; ^Banks in the above peer group have
different financial year endings; FY ending other than 31-Dec are highlighted with special characters: * for 31-Mar; ** for 30-Jun; *** for 30-Sep & **** for 31-Oct; Source: Bloomberg
Investor Presentation March 2021 FAB in Brief 15FAB took decisive action in response to COVID-19
Prioritising the welfare of our employees, customers and the community at large
Customer and Community Business Continuity Employees
As the leading UAE bank, it is our duty to We continued to operate with a robust We took care of our employees, to safeguard
support our customers and communities through Business Continuity & Crisis Management their health and safety
these challenging times Plan enabling the bank’s functions to operate
with speed and efficiency
• Financial relief measures in-line with TESS • Activation of Work From Home (WFH) for 90% • Flexible working policies implemented
employees1 and Return to Work (RTW) plan
• Payment deferrals provided to customers • Tie up with health authorities to provide
for 30% employees
COVID-19 vaccines to employees
• Reduction of charges & fee waivers
• Retail branches 100% operational since 2nd
• Tele/Video doctor consultations
• Leveraged digital platform to provide Jan 2021
uninterrupted banking services, and innovative • Employee wellbeing programmes
• IT infrastructure scaled up to accommodate
products and solutions
WFH • Extensive sanitisation measures across our
• Facilitated UAE’s first ever virtual GAMs facilities
• Use of cloud-based virtual desktop capabilities
• Donated AED 1Mn to the Emirates
• Enhanced cybersecurity, fraud prevention and
Foundation, AED 2Mn to the Emirates Red
monitoring
Crescent (ERC) & AED 5Mn to provide laptops
to students
1 WFH is activated for 90% employees, excluding those in branches
Investor Presentation March 2021 FAB in Brief 16Our strategy is clear
Positioning FAB for long-term success
Group Purpose
To create sustainable value for our stakeholders by powering the UAE's growth
Why we exist
Group Mission To be the region's strongest and the most profitable bank, building deep and trusted relationships with
What we aspire to customers through simplified banking
become
Market leadership in CIB and PBG Affirm position of strength
• Customer obsessed ▪ Superior credit ratings
• Market leading product offerings ▪ Regional sustainability leader
• Smart expansion, leveraging Digital and Partnerships ▪ Abu Dhabi House Bank status
• Unwavering focus on sustainable returns ▪ Comprehensive banking offerings covering all segments
Digital-first mindset/
Key enablers Scale Talent and culture
Technology and data-driven
Investor Presentation March 2021 FAB in Brief 17We’ve made significant progress against our strategic priorities
Strategic Priorities What we delivered
Always put the • Double digit NPS improvement (since 2019)
Customer obsessed Customer First • Fastest improving bank in the UAE for customer satisfaction (RFi1)
• Launched innovative products & solutions across various areas
Enhanced product • Deepened client relationships, with a focus on cross-sell, and
Market leading product proposition, leading execution of landmark transactions for strategic clients
offerings capabilities • FAB is the only bank in the top 5 rank across all Middle East
Investment Banking league tables in 2020
• Achieved record client engagement
Leveraging • Building out the region’s largest direct custody network
Smart expansion partnerships, digital,
AI • Key enabler to UAE/Abu Dhabi digital strategy (AD Pay, eDirham)
• Established new partnerships (Visa, MOHRE, Tabby)
Executed targeted & • Re-focused international strategy
Unwavering focus on ROE accretive long • Signed agreement to acquire 100% of Bank Audi-Egypt
sustainable returns term strategic • Carving out payments business into a fully owned subsidiary
initiatives • 10% stake in ADQ’s digital bank
1 RFi group is global, data-driven business insights provider
Investor Presentation March 2021 FAB in Brief 18Accelerating our digital transformation
IMPROVED SELF-SERVICE INNOVATION IN PIONEERING
CAPABILITIES PAYMENTS SOLUTIONS IN CIB
Current account, credit card applications, and personal loan top-up, For merchants and retailers: Payment- Launch of FAB eSign, FAB ePay, FAB’s
done instantly via FAB Mobile as-a-platform, Digital Marketplace, Digital Corporate Mobile App
57% reduction in migratable teller-transactions; also enabled the Invoicing, “Pay by Link” Launch of UAE Trade Connect (UTC), the
launch of 12 digital branches (teller-less) Government solutions: Abu Dhabi Pay, region’s biggest blockchain-based trade
Use of RPAs to automate 27 additional services in 2020 (including E-dirham finance network – won ‘Fintech Partnership of
KYC, liability letter issuance, account closure processes) the Year’ award at the FinTech Abu Dhabi Awards
Payit won ‘Best NEO Bank’ and ‘Best
2020
User Experience’ at MEA Finance Awards
2020 Roll-out of new product and solutions across
NEW FUNCTIONALITIES various areas including cash management,
Launch of new card variants
clearing, and trade finance, etc.
Launch of an interactive voice response system and virtual agent (contactless cards, Apple Pay)
in our contact centre SME Digital Account (Basher)
BUILDING A WORLD-CLASS
INCREASED DIGITAL ADOPTION
TECHNOLOGY FOUNDATION
• Cloud-First technology strategy in progress
Bank
transactions1 +20% +100% >90% • Open Banking platform live
86% performed Mobile registrations Increase in GTB clients • Significant step up in pace of delivering new features
digitally and engagement registered users migrated to
digital channels • World-class technology leadership team hired, scaling
up agile ways of working within the bank
1 Defined as total digital (mobile + internet banking) transactions as a percentage of all transactions performed digitally or at the branch and call centers
Investor Presentation March 2021 FAB in Brief 19Our commitment to sustainability
Integration of ESG into risk management framework is a key focus for 2021
Carbon Disclosure Project (CDP) Score
Strong ESG Ratings
A MSCI ESG
A- FAB is the highest scoring bank in the region,
strengthening our commitment to continue to
improve our position in the years ahead
Robust framework anchored
on 4 strategic pillars Responsible
Sustainable Banking Governance, Integrity Positive Societal
and Risk Management Impact Employer
Aligned with national and
global frameworks
Q1’21 Q2’21
ESG scope of implementation
and timeline of completion • Group wide ESG strategy • Operationalisation of ESG
• ESG risk framework through roll out of ESG tools
Investor Presentation March 2021 FAB in Brief 20Our commitment to sustainability
Recent highlights
• Hana Al Rostamani was appointed as Group chief executive officer, promoting the first female
CEO to the top leadership position in the United Arab Emirates, demonstrating our
commitment to supporting and empowering women
• Became a corporate partner with Aurora50, a UAE-based social enterprise that aims to
increase board-level gender diversity while also creating and bolstering a female talent pipeline
for future independent director appointments
• Expanded our Green Bond Framework to a Sustainable Finance Framework to assist the UAE
Government’s commitment, and support the UN Sustainable Development Goals (SDGs),
through developing sustainable investing and lending options
• Leading bank for green / sustainable finance: issued a 5yr HKD 750Mn (USD 96.77Mn)
green bond; first HKD denominated green bond from MENA
• Priced the largest ever Swiss Franc (CHF) denominated Green Bond by an international
issuer and the first Green bond deal by a MENA issuer in Swiss Franc (CHF)
• Moved from a B to an A- score in our climate disclosure to Carbon Disclosure Project
(CDP), signifying our understanding of the importance of transparency of our reporting and
disclosure
• Contributed to the report “Capital as a Force for Good: Global Finance Industry Leaders
Please refer to the Sustainability section of our corporate website to learn more
Transforming Capitalism for a Sustainable Future” which was presented at the ‘Global about FAB’s sustainability practices and disclosures including FAB’s Corporate
Leadership in the 21st Century’ conference organised by the United Nations on 15 December, ESG, Green Bond and Equator Principles Reports:
https://www.bankfab.com/en-ae/about-fab/sustainability/reports
and in support of the UN Secretary General’s 2030 Agenda for Sustainable Development
Investor Presentation March 2021 FAB in Brief 21A strong financial track record
Balance Sheet & Income Statement
TOTAL ASSETS (AED Bn) LOANS & ADVANCES (AED Bn) CUSTOMER DEPOSITS (AED Bn)
CAGR 2017-FY’20: 11% CAGR 2017-FY’20: 5% CAGR 2017-FY’20: 11%
Dec'20 919.1 Dec'20 386.6 Dec'20 540.9
Dec'19 822.0 Dec'19 407.9 Dec'19 519.2
Dec'18 743.9 Dec'18 353.0 Dec'18 465.2
Dec'17 669.0 Dec'17 330.5 Dec'17 395.8
TANGIBLE EQUITY1 (AED Bn) OPERATING INCOME (AED Bn) NET PROFIT (AED Bn)
CAGR 2017-FY’20: 3%
Cash dividends
AED Bn
Dec'20 78.6 8.08 FY'20 18.6 FY'20 10.6
Dec'19 77.4 8.08 FY'19 20.2 FY'19 12.5
Dec'18 71.2 8.06 FY'18 19.4 FY'18 12.0
Dec'17 71.1 7.63 FY'17 19.5 FY'17 10.9
1 Post-dividend
Investor Presentation March 2021 FAB in Brief 22A strong financial track record (…contd)
Key ratios
COST-TO-INCOME RATIO - YTD (%)
NIM - YTD (%) NPL RATIO1 (%) PROVISION COVERAGE1 (%) (EX-INTEGRATION COSTS)
27.7 25.8 26.7 27.0
2.48 2.36 3.97 120
2.11 110
1.75 3.09 3.15 3.23 93 95
FY'17 FY'18 FY'19 FY'20 Dec'17 Dec'18 Dec'19 Dec'20 Dec'17 Dec'18 Dec'19 Dec'20 FY'17 FY'18 FY'19 FY'20
NON-INT INC / REVENUES (%) CET1 & CAR2 (%) ROTE3 - YTD (%) RORWA - YTD (%)
CET1 CAR
37 34 16.2 15.7 16.9 16.5 2.6
33 33 16.2 16.1 2.3 2.5
14.6 2.1
13.0
12.8 12.4 13.5 13.3
FY'17 FY'18 FY'19 FY'20 Dec'17 Dec'18 Dec'19 Dec'20 FY'17 FY'18 FY'19 FY'20 FY'17 FY'18 FY'19 FY'20
1 2017 figures are pre-IFRS9 implementation
2 Capital ratios are post dividend as per UAE CB’s Basel III framework
3 Return on Average Tangible Equity, annualised; based on attributable profit to equity shareholders' excl Tier 1 notes coupon
Ratios annualised, based on actual/365 day count, where relevant
Investor Presentation March 2021 FAB in Brief 23Q4/FY’20
Financial Performance
24RESILIENCE. STRENGTH. TRANSFORMATION.
FY’20 Performance Highlights
▪ A resilient financial performance against an extraordinary Net Profit Revenue
backdrop with multiple headwinds (AED) (AED)
▪ We maintained a robust foundation, successfully managing 10.6Bn 18.6Bn
key risks, and preserving strong liquidity and funding ↓16% yoy ↓8% yoy
ratios, and resilient asset quality
▪ FY’20 dividend of AED 0.74 per share, in line with our EPS (AED) DPS (AED)
15% ↔
commitment to deliver sustainable shareholder returns 0.93 ↓ yoy 0.74 yoy
▪ We’ve made significant progress against key strategic
initiatives, while accelerating our digital transformation RoTE CI Ratio CET1 LCR
(post-div)
▪ We enter 2021 in a position of strength to continue our
13.0% 27.0% 13.3% 143%
growth and transformation journey FY’19: 16.1% FY’19: 26.7% Dec’19: 13.5% Dec’19: 129%
Investor Presentation March 2021 Q4/FY’20
Q4/FY’20Financial Performance
Financial Performance 25A resilient performance
We have met or exceeded most FY’20 financial guidance metrics
FY’20 Actual FY’20 financial guidance
Loan growth +2% ytd Mid/high single digit
(ex. large one-off in Q4’19)
Downward pressure from rate cuts
and COVID-19-led economic
Revenue growth -8% yoy slowdown, to be partially offset by
strategic initiatives to enhance
revenue-generation capacity
C/I Ratio
(ex-integration costs)
27.0% < 30%
Cost of Risk 63bps 13.5%
Investor Presentation March 2021 Q4/FY’20 Financial Performance 26A resilient performance
Significant headwinds partly offset by solid execution momentum, targeted initiatives, cost and risk
discipline
Net profit bridge (AED Mn)
-16% yoy
+439
+48
12,520 (1,675) (777) 10,555
- Adverse impact from rate cuts and
• Prudent provisioning, with
COVID-19 disruption Disciplined cost tailwinds from recovery
+ offset by solid execution management amidst efforts
momentum and pick-up in activity in ongoing investments
in strategic and digital • Gross impairment charges
the second half
initiatives 3.7Bn
+ Higher other income from property-
related gains and sale of legacy FGB
license (+1.1Bn)
FY'19 Operating Operating Impairment Taxes & FY'20
NPAT Income Costs charges,net Minority NPAT
Interest
Revenue (AED Bn) Operating Profit (AED Bn) Net profit (AED Bn)
QoQ ↑14%, YoY↓3% YoY↓8% QoQ ↑18%, YoY↓1% YoY↓8% QoQ ↑29%, YoY↑5% YoY↓16%
20.2 14.8 12.5
18.6 13.5 10.6
5.1 4.6 4.8 4.3 4.9
3.7 3.2 3.6 3.1 3.6 3.1 3.2
2.4 2.4 2.5
Q4'19 Q1'20 Q2'20 Q3'20 Q4'20 FY'19 FY'20 Q4'19 Q1'20 Q2'20 Q3'20 Q4'20 FY'19 FY'20 Q4'19 Q1'20 Q2'20 Q3'20 Q4'20 FY'19 FY'20
Investor Presentation March 2021 Q4/FY’20 Financial Performance 27We maintained a robust foundation
Solid ratios demonstrate balance sheet strength in a challenging year
Strengthened liquidity highlighting FAB’s
Solid capital generation despite market disruption ‘flight-to-safety’ Superior credit ratings underline
fundamental strength
Capital adequacy ratios (%) (post-dividends) Liquidity coverage ratio (LCR%)
CET1 CAR
16.9 15.5 16.4 16.8 16.5 155 143
AA-
129 129
110
13.5 13.6 14.0
12.2 13.3
Dec'19 Mar'20 Jun'20 Sep'20 Dec'20 Dec'19 Mar'20 Jun'20 Sep'20 Dec'20 Moody’s* / S&P / Fitch
Conservative risk profile with one of the Credit ratings re-affirmed by all
lowest NPL ratios in the sector Adequate cash provision coverage, kept above 90% rating agencies in 2020
Non-performing loans ratio (NPL%) Provision coverage (%)
Dominant and diversified franchise
3.93 3.92 3.97 93 95 91 96 95 Superior earnings generation
3.23 3.53
Prudent risk management and solid capital ratios
Robust liquidity and funding profile
Dec'19 Mar'20 Jun'20 Sep'20 Dec'20 Dec'19 Mar'20 Jun'20 Sep'20 Dec'20
* Aa3 equivalent
Investor Presentation March 2021 Q4/FY’20 Financial Performance 28Strong CIB performance despite significant headwinds
Driven by strong business momentum, client engagement, and cost discipline
Operating Profit (AED Mn) FY’20 summary P&L (AED Mn)
+3% yoy FY’20 YoY%
(-7% ex-property-related gains)
+320 (1,166) +787 +59 Revenue 12,073 +2
+250
9,518 9,767 Costs (2,306) -2
+9% on strong -27% due to +6% driven by Primarily driven Costs declined 2% yoy
deal execution margin market volatility & by property- despite investments in Operating
9,767 +3
and higher IIS compression improved trading related gains our international Profit
reversals from rate cuts performance franchise (KSA)
Impairment
(1,241) +52
charges, net
FY'19 GCF revenue GTB revenue GM revenue Other revenue Operating costs FY'20
Operating profit Operating profit Taxes (266) +21
Quarterly Revenue trend (AED Bn) Loans (AED Bn) Deposits (AED Bn) Profit after taxes 8,259 -3
QoQ ↑21%, YoY ↑14% YoY ↑2% QoQ ↓1%, YoY(adj) ↑3% QoQ ↓13%, YoY(adj) ↑13%
NII
Non-int inc 317 437 525
11.9 12.1 CI Ratio 19.1% -79bps
3.4 441 457
3.0 3.2 287 293 296 299 296 407 420
2.6 2.8 40%
50%
41% 40% RoRWA 2.0% -15bps
52% 42% 39%
60% 50% 60%
48% 58% 59% 61%
Contribution to
65% +633bps
Q4'19 Q1'20 Q2'20 Q3'20 Q4'20 FY'19 FY'20 Dec'19 Mar'20 Jun'20 Sep'20 Dec'20 Dec'19 Mar'20 Jun'20 Sep'20 Dec'20 Group revenue
Note: Real estate businesses (previously structured under Subsidiaries) and SME business (previously structured under PBG) were re-organised under CIB effective 1 April 2020; prior
period numbers have been restated where applicable
Investor Presentation March 2021 Q4/FY’20 Financial Performance 29Resilient set of results in PBG
Pick-up in momentum in second half of 2020 partially mitigates impact from economic slowdown
Operating Profit (AED Mn) FY’20 summary P&L (AED Mn)
FY’20 YoY%
-8% yoy
(455) +178 Revenue 6,156 -8
(45)
3,956
+ Reflects shift towards digital
3,634 Costs (2,521) -7
channels
Primarily reflecting rate cuts, relief measures + Cost save initiatives taken to
provided to support customers, and economic
Operating
counter impact of slowdown 3,634 -8
slowdown due to the pandemic Profit
- Continued Investments in digital
infrastructure and international
network (KSA, Egypt) Impairment
(1,382) +22
charges, net
FY'19 Net interest income Non-interest income Operating costs FY'20
Operating profits Operating profits
Taxes (43) -39
Quarterly Revenue trend (AED Bn) Loans (AED Bn) Deposits (AED Bn)
Profit after taxes 2,209 -20
QoQ ↓3%, YoY ↓8% YoY ↓8% QoQ ↑1%, YoY ↔ QoQ ↑8%, YoY ↑1%
NII Non-int inc
6.7 6.2 89 88 87 88 90 79 81
1.7 1.6 1.6 1.5 20% 74 75 74 CI Ratio 41.0% +39bps
1.4 21%
23% 24% 23% 20%
18%
80% RoRWA 3.0% -58bps
77% 79%
76% 82% 77% 80%
Revenue
33% +27bps
Q4'19 Q1'20 Q2'20 Q3'20 Q4'20 FY'19 FY'20 Dec'19 Mar'20 Jun'20 Sep'20 Dec'20 Dec'19 Mar'20 Jun'20 Sep'20 Dec'20 Contribution
Note: Real estate businesses (previously structured under Subsidiaries) and SME business (previously structured under PBG) were reorganised under CIB effective 1 April 2020; prior
period numbers have been restated where applicable
Investor Presentation March 2021 Q4/FY’20 Financial Performance 30Sustained balance sheet strength
Excess liquidity prudently and tactically deployed
QoQ% YoY%
YoY change (AED Bn) Dec’20
change change
• Excess liquidity prudently and tactically
deployed into highly liquid assets
• LCR remains solid at 143%; HQLAs1
Cash & balances with CB's +58 228 -18% +34%
amounted to AED 316Bn
DFB & Reverse repos +30 71 +9% +71%
• Loan growth (excl one-off large deal at end-
FY’19), driven by core public sector and
corporate clients, partly offset by run-down Investments +18 153 +7% +13%
in FI trade loans (↓10.6Bn yoy)
• Healthy Govt/GRE lending pipeline, with (ex-Q4’19
demand expected to pick-up on rebound in Loans & advances (21) +9 387 -1% -5% 2% one-off)
economic activity
(Undrawn commitments ↑89% yoy)
DTB, Repos & CPs +49 145 +12% +51%
• Strong deposits growth highlights flight-to-
safety, and FAB’s status as bank of choice of +22 +52 541 -10% +4%
(ex-Q4’19
+11% one-off)
Customer deposits
the Abu Dhabi government
• CASA at record high levels of AED 223Bn,
up 28% yoy and represents 41% of total Term borrowings +7 63 ↔ +12%
deposits
Shareholders’ equity +1 109 +7% +1%
1 HQLA including cash and central bank placements
Investor Presentation March 2021 Q4/FY’20 Financial Performance 31Conservative asset mix
A highly liquid balance sheet: loans and advances only represent 42% of total assets
Total Assets - Dec’20
AED 919Bn High quality loan portfolio underpinned by our privileged
position as the banker to the Abu Dhabi government
1
• 33% exposure to Government & GREs
• ~6% of corporate exposures have the
Cash & CB 25% government as a significant shareholder
Balances Govt & GREs
Corporate/ Private 33% • 6% short-term trade loans
47% • Diversified exposure by economic sector
Due from Banks 8%
2% Banks
& Reverse Repos • Reduced unsecured lending following
18%
Loans to Individuals balance sheet de-risking post merger
Investments 17%
Lending to clients benefiting from TESS relief measures2 at
AED 37Bn, representing 9.1% of our gross loan book • TESS allocation utilised at end-Dec 2020
was AED 3.5Bn, lower by AED 4Bn from
Loans and
Advances, net
42% (4% total assets)
PB, 1%
Sep’20 on repayments by customers
(original allocation of AED 8Bn by UAE
(387Bn) CB); expect utilisation to increase in
H1’21 following TESS extension
CIB, 99%
9.1% • Majority of clients benefitting from relief
measures are corporates, mainly from
Other Assets 9% trading, construction, real estate (incl.
hospitality) and services sectors
1 Portfolio split by counterparty based on gross loans
2 For further details, please refer to slide #43 in appendix, note #43.1 in FY’20 financials
Investor Presentation March 2021 Q4/FY’20 Financial Performance 32Resilient asset quality
NPL ratio at 3.97%, provision coverage at 95%
Impairment charges, net (AED Mn) & CoR1 (%) NPLs3 and ECLs4 (%)
CoR (L&A) (bps) CoR - gross (L&A) (bps) 2
Provision Coverage (%) NPL Ratio (%)
Net impairment charges Gross impairment charges 2 NPLs (AED Bn) Provisions (AED Bn)
122
90
67 93 95 91 96 95
108
70 63
48 44 37 48 3.93 3.92
3.23 3.53 3.97
3,700
15.8
15.6 15.7 15.1 15.0
1,283 13.5 13.9 13.2 14.2
12.6
2,620
1,060
619 1,843
738
499 504
318
Q4'19 Q1'20 Q2'20 Q3'20 Q4'20 FY'19 FY'20 Dec'19 Mar'20 Jun'20 Sep'20 Dec'20
1 Annualised
2 Gross impairment charges and gross CoR on loans and advances: excludes provision reversals as a result of partial resolution of a few large corporate accounts
3 NPLs = Stage 3 exposure + adjusted POCI (Purchase or originally impaired credit) of AED 4,885Mn as of Dec’20 considered as par to NPLs, net of IIS
4 ECL = ECL on loans & advances + ECL on unfunded exposures + IFRS9 impairment reserves
Note: Gross loans and advances and NPLs are net of interest in suspense; see Note #43.1 ‘Credit quality analysis’ in FY’20 financials for more details on IFRS9 exposures and ECL
Investor Presentation March 2021 Q4/FY’20 Financial Performance 33Solid capital generation despite market disruption
FY’20 dividend: AED 0.74 per share
CET11 ratio progression FY’20 • Risk discipline maintained despite balance sheet
growth by optimising loan portfolio in favour of higher
RoRWA yielding assets
• Capital ratios remain well above minimum
15.2% regulatory requirements; CAR and Tier 1 ratios at
14.9% 16.5% and 15.4%, respectively
DPS: 74 fils
1.67% AED 8.08Bn -23bps 1.60%
DPS: 74 fils • DPS of AED 0.74, flat yoy, in line with our
+218bps AED 8.08Bn
commitment to deliver sustainable shareholder returns
-61bps
13.5% 13.3% • Legacy AT1 notes USD 750Mn repaid in June on
first call date despite the pandemic-led slowdown;
Basel III
Issued FAB’s inaugural AT1 notes USD 750Mn at
regulatory 4.5% in Sep’20
minimum: 11%
- 26bps
Regulatory RoRWA (%ytd) and RWAs (AED Bn)
minimum
under TESS: 8% 2.56 1.97 1.97 1.97 2.13
CET1 Dec'19 Change in RWA FY'20 profits Other movements CET1 Dec'20
485.1 497.4 498.6 509.7 505.3
FY'19 Q1'20 H1'20 9M'20 FY'20
1 UAE CB has reduced the minimum CET1, Tier 1 and CAR requirement to 8%, 9.5% and 11.5% respectively until 31 Dec 2021 under TESS (previous minima of
11%, 12.5% & 14.5%, respectively)
2 ECL add-back to CET1 under IFRS9 prudential filter – AED 0.9Bn (18bps of CET1)
Investor Presentation March 2021 Q4/FY’20 Financial Performance 34Net interest income and margins
NIM impacted by rate cuts
(AED Mn) Net interest income Key highlights
LIBOR EIBOR
QoQ ↑8%, YoY ↑2% YoY ↓4% (USD 3M) (AED 3M)
• NII was 4% lower yoy, reflecting the
Dec-2018 2.8% 2.8% adverse impact of rate cuts, partly offset
12,775 12,256 by the placement of short-term liquidity with
3,080 3,244 3,079
Dec-2019 1.9% 2.2% Central Banks earning positive yields,
3,031 2,854 higher IIS reversals, and lending growth in a
subdued environment
Dec-2020 0.2% 0.5%
• P&L impact from a +/-25bps parallel
movement in interest rates is estimated at
Rate cuts of 225bps since 2019 approximately +/- AED 260Mn1, if no
Q4'19 Q1'20 Q2'20 Q3'20 Q4'20 FY'19 FY'20 Impact ~ AED 2Bn offsetting action is taken by management
• Continue to focus on volume growth and
Net interest margin (%) Performing loan yields (%) Cost of customer deposits (%) tactical deployment of excess liquidity
Quarterly YTD Quarterly YTD Quarterly YTD
2.11 4.72
1.41
1.80 Central bank placements2
1.75 3.91
4.37 0.85
1.89 1.90 1.90 3.62 3.55 1.28 Negative yielding Positive yielding
4.14 0.69 300
1.12 0.60
1.62 1.62 3.71 200
3.33 0.60
3.05 0.42 0.34
100
Q4'19 Q1'20 Q2'20 Q3'20 Q4'20 Q4'19 Q1'20 Q2'20 Q3'20 Q4'20 Q4'19 Q1'20 Q2'20 Q3'20 Q4'20
0
Q1'20 Q2'20 Q3'20 Q4'20
Note: All percentage figures are annualised 2 Daily average balances of placements on a quarterly basis with
1 For further details, please refer to Market Risk note 43.3 of FY’20 financial statements overseas central banks; Data rebased to 100 as of Jan 2020
Investor Presentation March 2021 Q4/FY’20 Financial Performance 35Non-interest income
Mainly reflects economic slowdown, lower income from liquidity arbitrage, partly offset by
targeted initiatives
• Fees and commissions in FY’20 vs. FY’19
Fees & commissions, net (AED Mn) FX & investment income (AED Mn)
- lower transactions and business volumes as a result
Loan-related Trade-related Other
4,107 of COVID-19 induced economic slowdown
1,196
3,169 + partly offset by continued strength in capital markets
2,903 and corporate finance/ advisory
839 527
783 777 435
166 651
• FX & investment income in FY’20 vs. FY’19
133 636 116 907 2,191
42 872 603 627 590 - lower income from our liquidity arbitrage activity
220 110 220
227 214 - lower liquidations year-on-year
217 371
- MTM revaluation on trading portfolio
423 452 441 395
1,735 1,597 + partially offset by continued strength in strategic
309 client flow products
Q4'19 Q1'20 Q2'20 Q3'20 Q4'20 FY'19 FY'20 Q4'19 Q1'20 Q2'20 Q3'20 Q4'20 FY'19 FY'20 • Other income in FY’20 vs. FY’19
+ Property-related gains (net) - AED 946Mn
+ Gain on sale of legacy FGB banking license to ADQ -
Non-interest income Q4’20 Q3’20 QoQ% FY’20 FY’19 YoY% AED 200Mn
(In AED Mn)
Non-interest income trends in CIB & PB
Fees & Commissions, net 651 777 -16 2,903 3,169 -8
CIB PB
1,566
FX & Investment income 590 627 -6 2,191 4,107 -47 1,287 1,380
1,096 1,110
Other income 588 46 n.r. 1,223 198 +519
387 400 256 362 302
Non-interest income 1,829 1,451 +26 6,317 7,474 -15
% of Group total income 37% 34% 34% 37% Q4'19 Q1'20 Q2'20 Q3'20 Q4'20
Investor Presentation March 2021 Q4/FY’20 Financial Performance 36Strong cost discipline
Opex -8% yoy amidst ongoing digital transformation; C/I ratio at 27.0%
Opex drivers YoY (AED Mn) Operating expenses trend (AED Mn) and C/I ratio (%)
C/I ratio (ex-integration)
Operating expenses improve 8% year-on-year 27.5 29.1 28.0
25.7 27.0
25.5 26.7
Pro-actively managing variable costs and QoQ↓2%, YoY↓14% YoY ↓8%
headcount adapting to the prevailing
business conditions 5,499 5,060
653
1,405 1,415 1,353 769
1,237 1,207 1,641
5,499 +116 178 233
(422) 313 227 146
1,508
416 427 369 386 327
(133) 5,060
3,205 2,784
811 755 671 734
624
Cost savings continue to be
invested in digital and Q4'19 Q1'20 Q2'20 Q3'20 Q4'20 FY'19 FY'20
technology infrastructure to
further enhance productivity, Staff costs Other G&A costs Depreciation & Amortisation
create future efficiencies and
an agile operating model
FY’21 C/I ratio guidance:Looking ahead
FY’21 financial guidance
FY’21 financial guidance
• We expect underlying operating performance to
Loan growth Mid-single digit improve, driven by a healthy Government/GRE
pipeline, continued focus on cross-sell, and M&A
(Egypt)
C/I RatioWrapping up
▪ We delivered a resilient performance in 2020 despite unprecedented market
conditions
▪ Our foundation is robust, and we enter 2021 from a position of strength
▪ Our strategy positions us well for long term success, as we leverage our
competitive differentiators and build on our transformation momentum
▪ We are fully confident in our capacity to continue to create sustainable value
for our stakeholders
Investor Presentation March 2021 Q4/FY’20 Financial Performance 39Appendix Investor Presentation March 2021 40
Asset & loan mix
Conservative asset mix with a well diversified, high-quality loan book
Asset mix Gross loans by counterparty
Dec’20 AED Bn
AED 919.0Bn 421.7 403.3 Banks
Cash & CB Balances
25%
Dec’19 21% 6% 2% Personal/ Retail
AED 822.0Bn DFB and Reverse Repos 18%
42% 17%
50% Investments Corporate/ Private
5%
43% 47%
16%
8% Others Public Sector
18% 23%
8%
Loans and Advances
16% Government
16% 10%
9%
Dec'19 Dec'20
Gross loans by economic sector Net loans by geography2 Gross loans by product
Manufacturing Construction
5% 3% Europe MENA America
Agriculture 9% 2% 2% Term Loans
Energy 78% Trade related
0.2%
10% Real Estate1 loans,6%
22% Asia
7%
Personal - Retail Personal Loans
Mortgage Trading 8%
GCC
5% AED 403.3Bn 6% AED 386.7Bn AED 403.3Bn
7% Credit Cards
Dec’20 Dec’20 Dec’20
1%
Personal - Loans & Transport and Vehicle financing
Credit Cards communication 9% loans, 0.3%
Banks
UAE
13% 73% Overdrafts
2%
Government 10% 7%
Other financial
Services 5% institutions 10%
1 Real Estate by geography: Abu Dhabi 45%, Dubai 24%, Other UAE 3%, UK 19%, Other Intl 9% 2 Based on loan origination / coverage
Investor Presentation March 2021 Appendix 41Strong liquidity position
LCR at 143% and LDR at 71%
Loans and advances, net (AED Bn)
QoQ ↓1%, YoY↓5% (+2% ex one-off) Gross loans & advances
• Loan growth in FY’20 (excl one-off large 407.9 381.8 384.6 388.8 386.6
Others 1.1
deal at end-FY’19), driven by core public 89.3 1.0 1.6 1.0 1.1 422 (28)
+8 +1
88.1 87.2 88.5 89.7 +16 (16)
sector and corporate clients, partly offset by PB 403
run-down in FI trade loans (↓10.6Bn ytd) 317.5 292.7 295.8 299.4 295.9
CIB
Dec'19 Mar'20 Jun'20 Sep'20 Dec'20 FY'19 Govt GREs Banks Corp/Pvt Personal/ FY'20
Sector Retail
• Short-term inflows in Q3’20 reversed in Customer Deposits (AED Bn)
Q4’20 driven by Government and a few QoQ ↓10%, YoY ↑4% (+11% ex one-off)
large corporate clients
601.8
519.2 518.7 540.9
• FAB’s international network is a key 497.1 +19 +1 +18
Notice, (19) +3
differentiator to source liquidity and funding; 541
Time & 385.9 317.7 519
international deposits were up 20% 345.2 316.1 322.5
Others
(+22Bn) yoy driven by our UK and US
offices attracting SWFs and asset CASA 174.0 181.0 196.2 215.9 223.2
managers looking for high-rated Dec'19 Mar'20 Jun'20 Sep'20 Dec'20 FY'19 Govt GREs Corp/Pvt Personal/ CDs FY'20
counterparties like FAB Sector Retail
• CASA +28% yoy to AED 223Bn, represents LCR(%)1 129 110 129 155 143
41% of customer deposits, highlights strong
momentum in cash management LDR (%) 79 77 74 65 71
1 Minimum regulatory LCR requirement is 100% effective Jan’19; relaxed to 70% until 31
Dec 2020 under TESS by UAE CB
Investor Presentation March 2021 Appendix 42Supporting our customers through payment deferrals
Payment deferrals provided under UAE CB’s TESS1 programme as well as Bank’s own initiatives
From April 1st 2020, relief measures were extended to The Group undertook a comprehensive portfolio review in Q2’20 in line with the UAE CB
our retail, SME and corporate customers in the form of guidance
payment deferrals on interest and principal between 3-6 • Preemptive action taken to identify clients benefitting under TESS under two main categories:
months, under the UAE Central Bank’s Targeted
⏵ Group 1: Borrowers temporarily and mildly impacted by COVID-19
Economic Support Scheme (TESS), as well as FAB’s
own initiatives. Initial deadline of 31 Dec 2020 was ⏵ Group 2: Borrowers expected to be significantly impacted by COVID -19 in the long term
further extended to 30 June 2021.
TESS utilisation
Payment % of Gross
Segment Total Loans & AED 3.5Bn
deferrals under Loans
(figures in AED Mn) Advances
• As of December-end 2020, our customers benefitted TESS (Dec’20)
Others, 5%
from deferrals under the TESS programme as well as Manufacturing, 3%
from Bank’s own initiatives: CIB
Services, 13%
AED Bn TESS Non-TESS Total Group 1 2,543 32,162 8.0%
as of Dec’20 3.5 0.7 4.2 Construction, 23%
Group 2 873 4,036 1.0%
Cumulative
9.0 1.0 10.0 PB
since Apr’20
Real Estate, 26%
Group 1 36 525 0.1%
• Majority of clients benefitting from relief measures are
corporates, mainly from trading, real estate (incl. Group 2 1 8 0.0%
hospitality), construction and services sectors Trading, 30%
Total 3,453 36,731 9.1%
1 For more information, refer to note 43.1 of FAB’s FY’20 financial statements
Investor Presentation March 2021 Appendix 43NPLs and Loans/ECL by stage
NPLs1 by segment NPLs1 by sector (%)
PB CIB (incl Subsidiaries) (AED Bn)
Real Estate & Construction,
5.4% 5.2% 6.2% 5.6% 5.1% 40%
NPL
ratio 2.6% Manufacturing, 6%
3.0% 3.3% 3.4% 3.6%
AED 15.8Bn
Energy, 2%
15.6 15.7 15.8 Dec’20 Trading, 15%
13.5 13.9 Others, 2%
37% 34% 36% 33% 30%
63% 66% 64% 67% 70% Transport & Communication, 1%
Loan to Individuals, 31% Services, 3%
Dec'19 Mar'20 Jun'20 Sep'20 Dec'20
Loans by stage ECL2 by stage
(AED Bn) (AED Bn)
AED 399.1Bn AED 15.0Bn
as of Dec’20
(Gross loans net of IIS) as of Dec’20
Ratio
% of gross loans
Stage 1 362.8 90.9% Stage 1 2.9
Stage 2 20.3 5.1% Stage 2 3.9
Stage 3 + Stage 3 +
15.8 3.97%1 8.2
Adj POCI Adj POCI
1 NPLs = Stage 3 exposure + adjusted POCI (Purchase or originally impaired credit) of AED 4,885Mn as of Dec’20 considered as par to NPLs, net of IIS; Stage 3 + POCI, net of IIS as per Note #43.1 in FY’20 financials is AED 16.0Bn
2 ECL = ECL on loans & advances (12.4bn) + ECL on unfunded exposures (0.7Bn) + IFRS9 impairment reserve (1.9Bn), IFRS9 specific reserve incl in Stage3 (1.2Bn), IFRS9 collective reserve incl in Stage2 (0.7Bn)
Note: Gross loans and advances and NPLs are net of interest in suspense; see Note #43.1 Credit Risk in FY’20 financials for more details on IFRS9 exposures and ECL
Investor Presentation March 2021 Appendix 44High-quality investment book
Investments by type Investment by ratings
A BBB
FVTPL - Debt, 13%
32% 9%
FVTPL - Equity & Funds, 1%
FVOCI - Debt, 84% BB & below
AED 152.8Bn AED 152.8Bn 12%
Dec’20 Amortised Cost (Debt Inv), 2% Dec’20
AA Unrated -
FVOCI - Equity, 0.4%
29% Debt 3%
Equity &
AAA Funds
13% 2%
Investments by geography Investments by counterparty
Europe Covered Bonds Banks, 21%
20% GCC (Banks & FIs)
16% 3% Corporate/ Pvt Sector
6%
GREs Supranatl, 2%
UAE MENA (ex-GCC&UAE) 16% AED 152.8Bn
AED 152.8Bn
28% 5% Dec’20
Dec’20
USA
11%
Sovereign
Others incl A&NZ
52%
Asia 2%
18%
FVTPL – Fair value through profit or loss (previously HFT), Amortised cost – previously HTM, FVOCI – Fair value through other comprehensive income (previously AFS)
Sovereign bonds include sovereign guaranteed bonds issued by GREs, banks & FIs
Note: All totals are Gross investments before ECL
Investor Presentation March 2021 Appendix 45Customer deposits
Customer Deposits Customer deposits by account type
Total Customer Deposits CASA 2 (AED Bn) (AED Bn)
519.2 540.9
1% 1%
601.8 6% 9% Margin Accounts
519.2 497.1 518.7 540.9 2% 2%
32% Certificates of deposits
39%
Saving Accounts
59% Current Accounts
49%
34% 36% 38% 36% 41%
Notice and time deposits
Dec'19 Mar'20 Jun'20 Sep'20 Dec'20 Dec'19 Dec'20
Customer deposits by counterparty Customer deposits by geography1
(AED Bn)
540.9
519.2
GCC 2%
6% 9% UAE Asia 2%
Certificates of deposits
16% 75% AED 540.9Bn
15%
Personal/retail sector Dec’20
28% 30% Europe
Corporate / private sector 12%
21% 21%
Public Sector MENA
29% 25% 2%
Government sector
America
Dec'19 Dec'20 4%
1 Based on deposit origination / coverage
2 Current, savings and call accounts; prior periods reclassified to include call accounts earlier grouped with notice and time deposits
Investor Presentation March 2021 Appendix 46Liability mix and funding profile
Leading issuer in the MENA region – conventional, Sukuks and Green bonds
Medium-term wholesale funding1 (AED Bn) Liability mix Senior Issuances - USD equivalent 4.4Bn in FY’20
• 5yr USD 500Mn public Sukuk at 2.5%
MTNs 53.2 • 3yr GBP 450Mn public Sterling at 1.375%
Customer
• 5yr AUD 350Mn public Kangaroo at BBSW +110bps
Sukuks 9.3 Deposits, Term Borrowings & • 3 separate 30yr multi-callable Formosas totaling USD 1.625Bn
67% Sub Debt, 8% • 2 separate 5yr CNY Formosa totaling CNY 5bn at 3.4%-3.5%
Subordinated debt 0.5 • 2-30yr USD 744Mn equivalent of private placements, including
Others, 7% a HKD 750Mn 5yr Green Bond - the first of its kind by an
Total 62.9 AED 810.0Bn offshore FI
Dec’20
Due to Banks & Recent issuances in FY’21:
Repos, 14%
• 5yr USD 500Mn public Sukuk at 1.411%
4.8
• 5yr CNY 1.5Bn Formosa at 3.150%
Commercial Paper, 4% • 2-30yr USD 556Mn equivalent of private placements across
2.5 1.9
HKD, JPY and USD
Cash & AAA/AA bonds vs. ST
13.4 0.5 Senior Maturities - USD equivalent 2.6Bn in FY’20
wholesale2
(AED Bn)
9.3 9.1 292 • 5yr USD 750Mn public bond at 2.250%
6.3 8.1 CDs & CPs
• 5yr USD 900Mn public bond at 2.625%
6.4 64 193 • USD 720Mn equivalent of private placements issued
80
DTB & Repos between 2014-2018
0.5 228 • 10yr MYR 500Mn public bond at 4.900%
114
AAA & AA
bonds
2021 2022 2023 2024 2025 2026 2027 & Cash & ST Wholesale
Beyond AAA/AA Funding Cash & Bal with Capital Issuance in FY’20
bonds CBs
• Perpetual NC6 USD 750Mn AT1 at 4.500%
1 Includes debt issuances upto 31 December 2020; For maturity profile, final maturity date rather than next call date is used
2 FAB has access to place deposits with ECB & FED
Investor Presentation March 2021 Appendix 47You can also read