Q4 2020 March 2021 Investor Presentation - A Banking-as-a-Service pioneer, enabling

Page created by Bob Duncan
 
CONTINUE READING
Q4 2020 March 2021 Investor Presentation - A Banking-as-a-Service pioneer, enabling
Q4 2020
             Investor Presentation

                March 2021

A Banking-as-a-Service  pioneer, enabling
         A Banking-as-a-Service             non-
                                  pioneer, enabling
   banks to build financial
      non-banks             services for
                  to build financial     their for their
                                     services
                   customers
                         customers
Q4 2020 March 2021 Investor Presentation - A Banking-as-a-Service pioneer, enabling
Disclaimer
BM Technologies is not a bank and it does not provide banking services. The BankMobile platform facilitates deposits and banking services between a customer and an FDIC insured partner bank. Any reference in this presentation to “banking” or “banking services” is
in reference to the BankMobile technology providing services between customers and a partner bank. The BankMobile brand and trademark is only used in reference to services being provided between a customer and an FDIC insured partner bank.

This presentation is for informational purposes only and should not be relied on for any other purpose. No representations or warranties, express or implied are given in, or with respect to, this Presentation. Industry and market data used in this Presentation have
been obtained from third-party industry sources as well as from research reports prepared for other purposes. The Company has not independently verified the data obtained from these sources and cannot assure you of the data’s accuracy and completeness. This
data is subject to change. This Presentation and the contents hereof are confidential.

No Offer or Solicitation
This Presentation is for informational purposes only and is neither an offer to sell or purchase, nor a solicitation of an offer to sell, buy or subscribe for any securities, nor shall there be any sale, issuance or transfer of securities in any jurisdiction in contravention of
applicable law. No offering of securities shall be made except by means of a prospectus meeting the requirements of section 10 of the Securities Act of 1933, as amended (the “Securities Act”), or an exemption therefrom.

Forward-Looking Statements
This Presentation includes “forward-looking statements” within the meaning of Section 27A of the Securities Act and Section 21E of the Securities Exchange Act of 1934, as amended. This information is, where applicable, based on estimates, assumptions and analysis
that management believes, as of the date hereof, provide a reasonable basis for the information contained herein. Forward-looking statements can generally be identified by the use of forward-looking words such as “may,” “will,” “would,” “could,” “expect,” “intend,”
“plan,” “aim,” “estimate,” “target,” “anticipate,” “believe,” “continue,” “objectives,” “outlook,” “guidance” or other similar words, and include statements regarding plans, strategies, objectives, targets, estimates, projections, and expected financial performance.
These forward-looking statements involve known and unknown risks, uncertainties and other factors. Actual results, performance or achievements may differ materially, and potentially adversely, from any projections and forward-looking statements and the
assumptions on which those projections and forward-looking statements are based. There can be no assurance that the data contained herein is reflective of future performance to any degree. You are cautioned not to place undue reliance on forward-looking
statements as a predictor of future performance as projected financial information, cost savings, synergies and other information are based on estimates and assumptions that are inherently subject to various significant risks, uncertainties and other factors. There can
be no assurance that the estimates and assumptions made in preparing the financial projections and forecasts will prove accurate, that the projected results will be realized or that actual results will not be significantly higher or lower than projected. The Company's
financial performance and results of operations will be subject to a variety of risks, including but not limited to general economic conditions, consumer adoption, technology and competition, the ability to enter into new partnerships, regulatory risks, risks associated
with the higher education industry and financing, and the operations and performance of its partners, including white-label partners. These risks and uncertainties include, but are not limited to, those factors described in the section entitled “Risk Factors” and in the
Company’s periodic filings with the SEC. The Company’s SEC filings are available publicly on the SEC website at www.sec.gov.

All information herein speaks only as of the date hereof unless otherwise specified. Management undertakes no duty to update, add to or otherwise revise or correct any of the information contained herein, whether as a result of new information supplied, future
events, inaccuracies that become apparent after the date hereof or otherwise. Forecasts and estimates regarding industry and end markets are based on sources believed to be reliable, however, there can be no assurance these forecasts and estimates will prove
accurate in whole or in part.

Use of Projections
This Presentation contains financial forecasts with respect to, among other things, income sources, revenue growth, and equity values. These unaudited financial projections should not be relied upon as being necessarily indicative of future results. The inclusion of the
unaudited financial projections in this Presentation is not an admission or representation that such information is material. The assumptions and estimates underlying the unaudited financial projections are inherently uncertain and are subject to a wide variety of
significant business, economic and competitive risks and uncertainties that could cause actual results to differ materially from those contained in the unaudited financial projections. There can be no assurance that the prospective results are indicative of future
performance or that actual results will not differ materially from those presented in the unaudited financial projections. Inclusion of the unaudited financial projections in this Presentation should not be regarded as a representation by any person that the results
contained in the unaudited financial projections will be achieved.

Non-GAAP Financial Measures
This Presentation includes certain non-GAAP financial measures that management reviews to evaluate its business, measure its performance and make strategic decisions. Management believes that such non-GAAP financial measures provide useful information to
investors and others in understanding and evaluating its operating results in the same manner as management. EBITDA is a non-GAAP financial measure that represents net income prior to interest expense, net, other expense, net, income taxes, and depreciation and
amortization, as adjusted to add back certain non-cash and non-recurring charge. EBITDA and any other ratio or metrics derived therefrom are financial measures not calculated in accordance with GAAP and should not be considered as substitutes for revenue, net
income, operating profit, or any other operating performance measure calculated in accordance with GAAP. Using these non-GAAP financial measures to analyze the business would have material limitations because their calculations are based on the subjective
determination of management regarding the nature and classification of events and circumstances that investors may find significant. In addition, although other companies in its industry may report measures titled EBITDA or similar measures, such non-GAAP
financial measures may be calculated differently from how management calculates its non-GAAP financial measures, which reduces their overall usefulness as comparative measures. Because of these limitations, you should consider EBITDA alongside other financial
performance measures, including net income and other financial results presented in accordance with GAAP.

                                                                                                                                                                                                                                                                  | 2
Q4 2020 March 2021 Investor Presentation - A Banking-as-a-Service pioneer, enabling
Table of Contents

I.     Introduction
II.    BM Technologies Overview
III.   Financial Information
IV.    Appendix
Q4 2020 March 2021 Investor Presentation - A Banking-as-a-Service pioneer, enabling
Management Presenting

                                           Luvleen Sidhu                                                     Bob Ramsey
                                           CEO and Co-Founder                                                Chief Financial Officer

                                                 FinTech Woman
                                                   of the Year(1)

                  Industry Experience                                                Industry Experience
                  9+ Years                                                           20+ Years

                  •    Luvleen Sidhu is the Chief Executive Officer and Co-           •   As BM Technologies' Chief Financial Officer, Bob Ramsey
                       Founder of BM Technologies, Inc.                                   oversees the bank’s financial operations, including
                                                                                          planning, risk, and reporting
                  •    After graduating from Harvard and Wharton she was a
                       management consultant at Booz & Co. in their financial
                       services practice
                                                                                      •   Prior to joining BM Technologies, Ramsey served as
                                                                                          senior equity research analyst at FBR Capital Markets,
                  •    Sidhu is a recognized leader in the industry and was named         where he covered community banks, regional banks,
                       one of Crain’s New York Business 2020 40 Under 40 and a            super-regional banks, consumer finance and fintech
                       “Rising Star in Banking & Finance” in 2020                         companies during his 13-year tenure
                  •    Before attending business school at Wharton, she was
                                                                                      •   Ramsey is a Chartered Financial Analyst (CFA). He holds a
                       analyst at Neuberger Berman and also worked as a director
                                                                                          Bachelor of Arts degree in Managerial economics from
                       of corporate development at Customers Bank. While at
                                                                                          Hampden-Sydney College and a Master of Business
                       the company, Sidhu introduced several growth projects,
                                                                                          Administration degree from the College of William and
                       including partnering with a New York City-based start-up to
                                                                                          Mary
                       improve the banking experience through innovative
                       technology
                  •    Sidhu has been featured regularly in the media including
                       on CNBC, Bloomberg Radio, Yahoo Finance, Fox News
                       Radio and in The Wall Street Journal, Forbes.com,
                       American Banker, Crain’s New York, FoxNews.com, among
                       others

1)   2019 LendIt Fintech Industry Awards
                                                                                                                                                      | 4
Q4 2020 March 2021 Investor Presentation - A Banking-as-a-Service pioneer, enabling
Q4 & 2020 Update
                                                                                                    •   Q4 pro forma core revenue of $17.3mm; 16% YoY growth
                                                                                                    •   2020 pro forma core revenue of $66.9mm, 9% YOY growth
                                Q4 Financial Overview                                               •   Q4 pro forma core EBITDA of $1.3mm
                                                                                                    •   2020 pro forma core EBITDA of $3.5mm
                                                                                                    •   Pro forma core EBITDA margin expanded to 5% in 2020 and 8% in 4Q20
                                                                                                    • Strong growth at consolidated BMTX
                                                                                                           • Nearly 450,000 new accounts opened in 2020
                                                                                                           • 2020 average serviced deposits increased 139% YoY
                                                             Strong Growth                                 • 2020 card spend increased 18% YoY
                                                                                                    • Strong growth in new businesses (White Label & Workplace) with rapidly improving account metrics
                                                                                                           • 167K new business new accounts opened in 2020
                                                                                                           • 2020 new business average serviced deposits increased 579% YoY
                                                                                                           • 2020 new business card spend increased 247% YoY

                                                                                                    • 99.4% retention of disbursement services by campuses in 2020
                                                                  Higher Ed                         • NACUBO reports that more than half of higher ed institutions are offering remote options for some or all classes,
                                                                                                      impacting the number of students on campus (1)
                                                                  Business Adapts                   • Disbursement dollars are highly persistent as 2020 disbursements were up 13% YOY; YTD organic deposits grew 33%
                                                                  to COVID                            and average 2020 serviced Higher Ed deposits are up 5% YoY

                                                                                                    • Corporate restructuring, implementation of automation projects, and vendor negotiations led to
                                                            Continued focus on                        approximately $1.7mm of Q4 cost savings and annualized $7mm of savings in 2021
                                                                                                    • Realization of $10mm annualized expense savings in 2020 resulting from vendor negotiations and contract
                                                            Operating Leverage                        restructurings in 2019

                                                                                                    •   Signed contract with Higher Education partner to expand SSE opportunity
                                                                                                    •   Signed LOI with potential bank partner
                                       Other Key Developments                                       •   Significant due diligence work as part of final stage evaluation by potential White Label partner
                                                                                                    •   Strategic new hires including Head of Business Development and Marketing
                                                                                                    •   Continued tailwinds from federal stimulus – the latest legislation includes $40 billion for higher education and students

1)   NACUBO Flash Poll: Fall 2020 Institutional Plans; NACUBO is National Association of College and University Business Officers
                                                                                                                                                                                                                    | 5
Q4 2020 March 2021 Investor Presentation - A Banking-as-a-Service pioneer, enabling
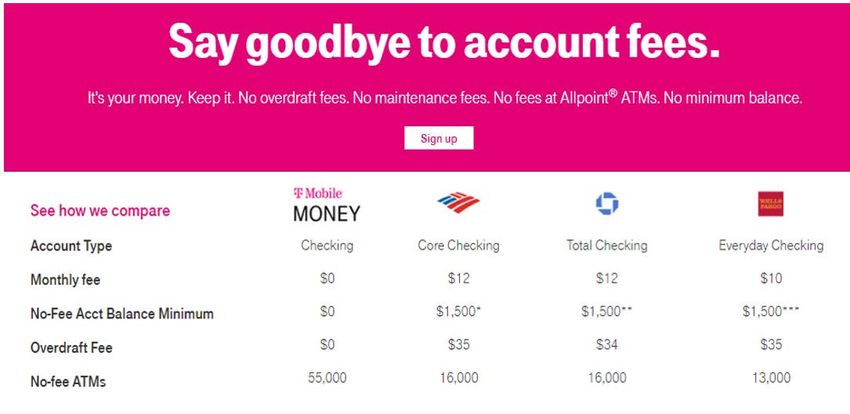
Where Does BM Technologies Stand Today?
Delivering Full-Featured Digital Banking Platform to Large Scale Non-Bank Partners

      One of America’s Largest Digital                                                                         Expert in B2B2C Banking…                                                                        …Award Winning Banking Technology,
           Banking Platforms…                                                                                                                                                                                    Focused on Banking Services for
                                                                                                                                                                                                                          Millennials &
                                                                                                                                                                                                                   Middle Income Americans…
 Over 2M accounts (1)                                                                          Proprietary Banking-as-a-Service (“BaaS”)                                                                       Customer-centric approach
                                                                                                 technology
 Nearly 450,000 accounts opened annually (2)                                                                                                                                                                    Provides an affordable, easy-to-use product
                                                                                                Allows for greater speed and cost effectiveness in
 ~$960M in serviced deposits as of 12/31/20                                                                                                                                                                     Simplifies banking for the consumer
                                                                                                 bank roll out for partners
 $67M in 2020 revenue                                                                                                                                                                                           Creates customers for life with full suite of
                                                                                                High-volume, low-cost customer acquisition
 $3.5M 2020 pro forma core EBITDA (3)                                                                                                                                                                            banking products, including checking,
                                                                                                 model
                                                                                                                                                                                                                  savings, personal loans, credit cards and
                                                                                                Serves ~1 in 3 U.S. students on approximately 725                                                                student refinancing
                                                                                                 campuses (4)
                                                                                                                                                                                                                 Creates attractive returns
                                                                                                Launched partnership with T-Mobile via the T-
                                                                                                 Mobile MONEY checking account
                                                                                                Planned 2021 launch of digital bank account with
                                                                                                 Google Pay

 1)   Data as of 12/31/2020
                                                                                               4)   Based on market share for Signed Student Enrollments (“SSEs”) (the number of students enrolled at higher-ed institutions); Assumes ~3M SSEs are considered non-addressable
 2)   Per BM Technologies management
 3)   EBITDA is a Non-GAAP financial measure; see page 42 and 43 for reconciliations to Non-
                                                                                                    (beauty schools, trucking schools, etc.); Data per BM Technologies’ internal sales database and estimated student market size and National Center for Education Statistics   | 6
                                                                                                    “Enrollment and Employees in Postsecondary Institutions, Fall 2015; Financial Statistics Academic Libraries, Fiscal Year 2015”, February 2017
      GAAP financial measures and disclaimers on forward looking financials
Q4 2020 March 2021 Investor Presentation - A Banking-as-a-Service pioneer, enabling
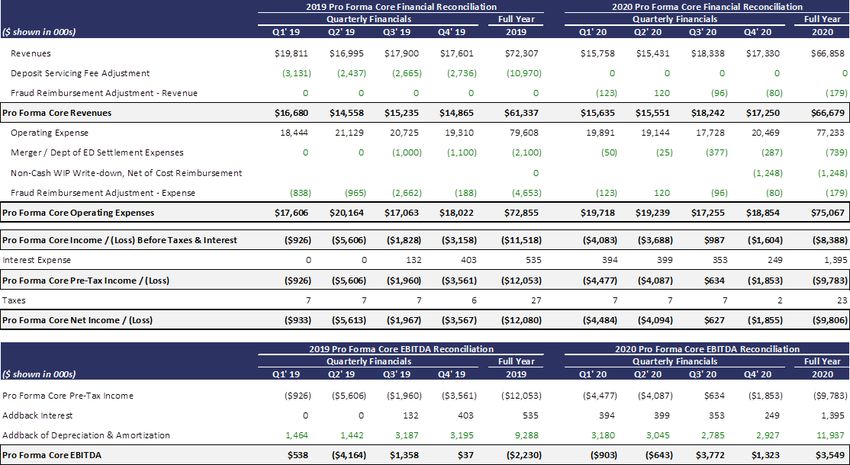
Consumers Are Recalibrating Their Banking Needs
 New Digital Options, Remote Necessities and Poor Customer Experiences Are Driving Change

 Consumer Preferences are Changing, with Banks Slow to Adapt                                                                    Consumers are Looking for an Affordable Banking Alternative(3)(5)

                                                                                                                                      1 in 3 Americans live paycheck to paycheck

                                                                                                                                      Americans pay $34B a year in overdraft fees

         1 in 2                                         1 in 3                                   10%                                  The average overdraft fee is $33.36
consumers switch their primary                 consumers switch primary             of income spent on fees charged
  banks due to discounts and                 banks for a better interest rate         by payday lenders and other
    promotions on fees(1)                         on their deposits(2)                 financial service providers(5)
                                                                                                                                      Big banks require at least $1,500 in a basic checking account to waive
                                                                                                                                       their monthly maintenance fee, which averages $10.99

                                                                                                                                      Women pay 18% more in overdraft fees than men (five per year) due to
                                                                                                                                       lower-than-average earnings

           63%                                            50%                                    59%                                  The average fee to withdraw money from an out-of-network ATM has
                                                                                                                                       hit a record high of $4.72, up 33% over the past decade
    of consumers are using                  of consumers likely will not open        of employees claim financial or
    mobile channels more                    their next account with the bank        money challenges as the #1 cause
         frequently(2)                             they currently use(2)                 of stress in their lives(4)

  1)   Accenture Consumer Retail Banking Survey Summary, July 2017                   4)   PWC Employee Wellness Survey, 2019
  2)   PWC Consumer Banking Survey, 2019                                             5)   The Cornerstone Performance Report, 2017                                                                   | 7
  3)   Forbes, “Consumers Shelled Out $1B in Monthly Bank Maintenance Fees”, 2019
Q4 2020 March 2021 Investor Presentation - A Banking-as-a-Service pioneer, enabling
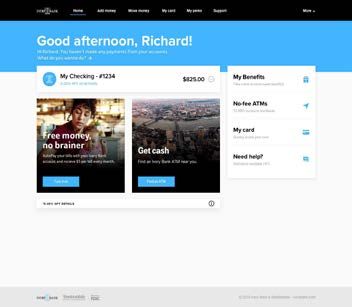
Non-Banks Want to Engage Customers via Financial Services
   Higher-Ed, Retailers and Large Employers All Have Untapped Financial Use Cases

   Higher-Ed Institutions                                     Consumer Focused Brands                                    Large Employers

Higher-Ed institutions send tens of billions in payments        Consumer-centric brands constantly refine                Large employers struggle with implementing
    each year to students, creating administrative               strategies to better attract, engage and                and integrating financial wellness capabilities
   complexity and resulting in high overhead costs                           retain customers                                    into their existing HR strategy

      Inefficient and expensive processing, fulfilment and       Traditional retailers struggle to differentiate in a      Employers struggle to retain talent when their staff
      reconciliation of student loan refund disbursements    commoditized market without creating “race-to-the-bottom”                 are not thriving financially

      Time-consuming interactions between schools, staff        Lack of passive income opportunities and centralized        Tighter labor markets have created an acute talent
                        and students                                         consumer data aggregation                        shortage, requiring employers to differentiate

          Onerous and complex regulations regarding             Competition and changing customer expectations are       Human resources departments lack compelling financial
               disbursement of federal funds                       exposing undifferentiated rewards programs                   wellness programs for their employees

                                                                                                                                                                      | 8
Q4 2020 March 2021 Investor Presentation - A Banking-as-a-Service pioneer, enabling
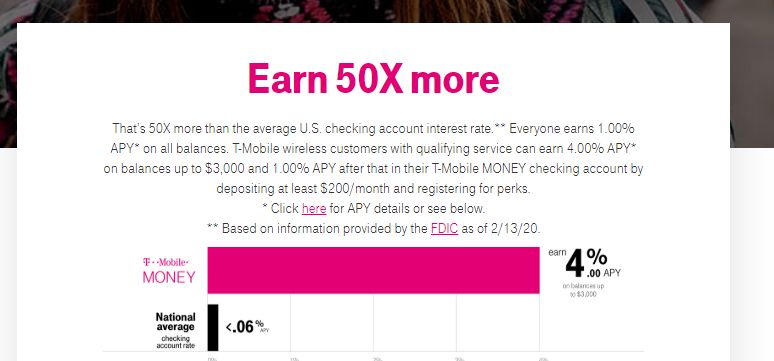
BM Technologies Solves Multiple Parties’ Pain Points in One Solution
Resulting in High-Volume, Low-Cost Customer Acquisition

B2B2C Approach                                                                                     Examples of BM Technologies Solutions within 3 Verticals

                                                                                                                                     Higher-Ed Banking
                                                                                                                   Distribute financial aid refunds and other disbursements                   Planned
                                                                                                                                                                                              Launch in
                                                                                                                   Eliminate administrative burden and complexity
                                                                                                                                                                                                 2021
                                                                                                                   Offer students access to banking services
                                                                                                                   Reduce processing costs annually by ~$125K / year(1)

                                                                                                                                    White-Label Banking
                                                                                                                  Offer financial services through white-label partnerships (2)
                                                                                                                  Attract customers by improving banking experience in historically-
                                                                                                                   underserved segments
                                                                                                                  Deliver customizable, partner branded rewards and special offers
                                                                                                                   to further drive loyalty
                                                                                                                  Create net-new, passive revenue streams for partners with lower
                                                                                                                   customer attrition

                                                                                                                                   Workplace Banking
                                                                                                                  Deploy differentiated financial services in conjunction with
                                                                                                                   financial wellness strategy
                                                             Bank Partners
                                                                                                                  Represents the first benefit that earns employee's money via
                                                                                                                   interest-bearing accounts, no fees and unique cost-saving
                                                                                                                   opportunities
                                                                                                                  Easily accessible benefits through HR portal
1)   Compared to existing campus processing costs; Approximation based on internal BM Technologies estimates
2)   Deposits are held with bank partner                                                                                                                                                | 9
Q4 2020 March 2021 Investor Presentation - A Banking-as-a-Service pioneer, enabling
Evolution into a Premier Brand
Fast Growing Digital Banking Technology Platforms
                                                                                                                                                                                                                                             Pipeline of White-Label and
                                                                                                                                                                                              Today
                                                                                                                                                                                                                                                Strategic Partnerships

                 Direct-To-
                                                                        Higher-Ed
                 Consumer
                                                                                                                               Higher-Ed                                                                                                              Higher-Ed
                                                                                                                                                                                            Higher-Ed

                                                                                                  BM Technologies’ Evolution and Continued Growth Elements

                     2015 - 2017: Early Days                                                   2018 – 2020: Business Model and Product Innovation                                                                        2020+: Rapid Expansion

                                                                                                                                                                                                                    Collaboration with Google Pay announced
                                                                                                                                                                                                                        August 3rd – Will plan to launch in 2021
                Founded in 2015 to “digitize” the traditional
                                                                                                                   Focused on expanding B2B2C strategy
                   banking experience                                                                                                                                                                               Continue to acquire new Higher-Ed clients
 Product                                                                                        Platform                                                                                                   Further expand within existing customer base
                                                                                                                                                                                                Long-Term
                Acquired Higher One’s Student Checking and                                                                                                                                      Growth  Continue to Add additional White-Label
            Refund Disbursement Business                                                                           Partnered to launch T-Mobile MONEY                                                                  Partners
           Integrated new functionality and technology                                                            T-Mobile MONEY extended to Sprint customers
                                                                                                                                                                                                                    Invest in strategic M&A opportunities
Higher-Ed  Repositioned the business (fees, compliance)                                     Partnerships

                                                                                                                   Built out the technological infrastructure to roll
                  Invested heavily to create its Banking-as-a-                                                       out white-label checking, savings, Point-of-Sale                                           Well-positioned for long-term growth
                     Service                                                                                          (“POS”) financing, credit card, personal loans                                            and continued EBITDA margin expansion
                                                                                                                      and student refinance
Investment                                                                                    Technology

   Note: BM Technologies is not a bank and does not provide banking services. BM Technologies is a technology provider that facilitates deposits and banking services between a customer and an FDIC insured partner bank. Any reference in this
   presentation to “banking” or “banking services” is in reference to BM Technologies providing services between a customers and a partner bank. The BankMobile brand and trademark is only used in reference to services being provided between                  | 10
   a customer and an FDIC insured partner bank. The BankMobile brand is only used in reference to services provided in collaboration with an FDIC insured sponsor bank.
Business
Overview
Key Investment Highlights

            1
                 Opportunity to Disrupt Massive U.S. Banking Market

                        2
                             High-Volume, Low-Cost, Customer Acquisition Strategy

                                  3
                                          Collaborations with Large, Highly Attractive Brands

                                      4
                                           Our “Banking-as-a-Service” Delivers a Full-Featured Digital Banking Platform to Partners

                              5
                                      Unique Competitive Position

                    6
                            Attractive Distribution Channel Through Market Leadership Position in Higher Education

        7
                Highly-Attractive Business Model

                                                                                                                                      | 12
1        Opportunity to Disrupt Massive U.S. Banking Market
Banks Have Consolidated, but Fragmentation Remains High

        Industry-wide headwinds have driven significant asset consolidation, with big banks holding 50% of deposits and struggling with
      customer satisfaction while the 99.8% of other banks hold the other 50% of deposits, yet struggle to acquire customers at a low cost

Asset Concentration in Banking, June 2019(1)                                                           The BM Technologies Solution

TOP ~0.2% OF                                                     MEGA BANKS
   BANKS                                                         ($1T+ ASSETS)
   COVER
  ~50% OF                                                         SUPER-REGIONAL BANKS
   ASSETS                                                           ($250B-$1T ASSETS)                    BM Technologies is pairing with white-label partners and
                                                                       CORE REGIONAL BANKS                  partner banks to beat large and small banks through
                                                                        ($50B-$250B ASSETS)               high-volume, low-cost customer acquisition driven by its
                                                                                                                        full-featured BaaS platform
                                                                            SMALL REGIONAL BANKS
ALL OTHER                                                                     ($10B-$50B ASSETS)
  BANKS
  COVER                                                                            MICROBANKS
REMAINING                                                                        ($1B-$10B ASSETS)
   ~50%

                                                                                     COMMUNITY BANKS
                                                                                       (
2      High-Volume, Low-Cost Customer Acquisition Strategy
Implemented B2B2C Approach in the Higher-Ed and Telecom Industries

               BM Technologies achieves a lower Customer Acquisition Cost relative to others in the banking industry by leveraging its
                        disruptive distribution model, which leverages its partners’ loyal customer base and brand affinity
BM Technologies Customer Acquisition                                                                 Estimated Industry Customer Acquisition Cost(1)(2)
                                                                                                       $1,600
 BM Technologies drives customer acquisition                                                                                         $1,500                                        $1,500
     and marketing engine through a                                                                    $1,400
     differentiated distribution model
                                                                                                       $1,200

 Rapid penetration into partners’ loyal,                                                              $1,000
     ingrained customer base
                                                                                                          $800                                                                                                           Implied CAC Cost
                                                                                                                                                                                                                         Differential up to
 Ability to leverage partners’ brand equity to                                                                                                                                                                                $1,490
                                                                                                          $600
     establish trust and accelerate adoption
                                                                                                                                                                                                                        $400
                                                                                                          $400

 Derives significantly lower customer                                                                                                                                               $350
                                                                                                                                                                                                                                          BM Technologies CAC: $9.63(3)
                                                                                                          $200                         $250                                                                             $250
     acquisition cost than a traditional bank by
     leveraging existing customer base
                                                                                                             $0
                                                                                                                                  Credit Cards                         Retail Checking Accounts                    Consumer Lending

1)   ARK Investment Management LLC, “Customer Acquisition Costs Per Customer For Financial Products”, 2018
2)   BM Technologies’ CAC is calculated based on LTM total Marketing and Client Operations expenses net of subscription fees paid to BM Technologies for Higher Ed clients; divided by LTM newly active accounts                                            | 14
3)   If the subscription fees paid by Higher Ed institutions to service their disbursements business were backed out of the net cost of acquisition, BM Technologies’ CAC would be $26.78
3a         Collaborations with Large, Highly Attractive Brands
White-Label Banking Case Study: T-Mobile MONEY

Relationship Overview                                                                                                                                                Partnership Highlights
 •        Partnered with T-Mobile to launch T-Mobile MONEY in 2019                                                                                                  “Traditional banks aren’t mobile-first, and they’re definitely not
 •        Offers no account fees and 4% interest on balances up to $3k for T-Mobile customers                                                                       customer-first. As more and more people use their smartphones to
 •        T-Mobile MONEY extended to the Sprint customers in August of 2020                                                                                         manage money, we saw an opportunity to address another customer
                                                                                                                                                                    pain point,” said John Legere, former CEO of T-Mobile (April 2019) (1)
 •        Contract was recently extended to 2023 with option to renew for additional 2-year
          periods                                                                                                                                                     “Today, more than ever, it is absolutely critical that people keep more
                                                                                                                                                                      of their hard-earned money in their pockets. T-Mobile MONEY
 Win – Win Relationship                                                                                                                                               customers get an industry leading return on their money, with zero
          Strong customer retention program for T-Mobile                                                                                                             fees, so they keep more, and grow more, the way it should be,” said
          New BM Technologies customers (deposits for Partner Banks)                                                                                                 Mike Sievert, CEO of T-Mobile (August 2020) (2)

     1)     Per T-Mobile press release; Bye, “Big Banks. Hello, T-Mobile MONEY Introducing Your No-Fee, Interest-Earning, Mobile-First Checking Account” – April 18th, 2019;
     2)     Per T-Mobile press release; “It Pays (Literally) To Be With The Un-Carrier; Full T-Mobile MONEY Benefits Extend To Sprint Customers” – August 24th, 2020                                                               | 15
3b        Collaborations with Large, Highly Attractive Brands
Recently Announced Collaboration with Google Pay

Relationship Overview                                                                                            Partnership Highlights
 On August 3rd, 2020, BM Technologies announced an execution of an agreement with
                      Google to introduce digital bank accounts.                                                 “Google is excited to partner with BankMobile in enabling a digital
                                                                                                                 experience that is equitable for all and meets the evolving needs of a new
                                                                                                                 generation of customers. We believe that we can use our technology
                                                                                                                 expertise to benefit users, banks and the entire financial ecosystem.” - Felix
                                                                                                                 Lin, Vice President at Google (August 2020) (1)

  Highlights
         Google Pay will provide the front-end user experience which will have some
          aspects unique to the higher education market from the standard Google Plex                            “We are thrilled to be collaborating with Google to offer our student
          account                                                                                                customers enhanced digital bank accounts. Many of our student customers
         The product will be built upon BM Technologies’ existing infrastructure                                today are struggling to manage their money as they work part-time and
         Product will be offered through BM Technologies’ existing higher education                             attend school. Through our collaboration with Google we believe we can
          distribution channel which serves approximately one in three college                                   provide these students with the appropriate financial tools to help them
          students through relationships with approximately 725 campuses
                                                                                                                 navigate through these difficult situations successfully” – Luvleen Sidhu,
         Planned launch in 2021                                                                                 CEO, BM Technologies, Inc. (August 2020) (1)
  Win – Win Relationship

         Increase the percentage of college students that choose to receive a
          disbursement through the opening of a BankMobile account
         Provide students new tools that will assist in budgeting and offer
          personal financial insights

 1)   Source per Press Release: BankMobile Announces a Collaboration to Offer Digital Bank Accounts – 8/3/2020
                                                                                                                                                                                    | 16
4a         BM Technologies Delivers a Full-Service Digital Banking Platform
Key Capabilities, Products and Technology Platform

BaaS Offering                                                                                     A.
                                                                                                  A Branded Digital Banking Apps                                                                    B.
                                                                                                                                                                                                    B Modern Cloud-Based Technology Platform
     BM Technologies brings the whole bank to
                                                                                                    … with a tailored signup and branded bank UX…                                                    … enabled by tech designed for partner integration
                   partners…

                                  Partner
                                                                                                                                                                                                                      BaaS Customer Hub APIs
              “Banking as a Service Offering”                                                                                                                                                                      Bank                     Digital
                                                                                                                                                                                                                                                               Partner
                                                                                                                                                                                                                  Product                   Activity
       A      Omni-Channel Digital Banking                                                                                                                                                                         Data                      Data
                                                                                                                                                                                                                                                                Data

       B      Modern Technology Platform                                                                                                                                                                                                Azure Cloud

       C      Full-Service Banking Support
                                                                                                                                                                                                                         Core Banking Systems
       D      Bank Partnerships                                                                                                                                                                              Payments            Checking            Savings    Credit

     All digital channels and bank technologies delivered                                            Frictionless onboarding and omni-channel apps                                                        Near-real-time APIs with aggregated data
      including mobile, web, Alexa, APIs and US payment                                                                                                                                                      enables partner-specialized, customer-centric
      systems                                                                                         Full primary bank relationship support, including                                                     experiences
                                                                                                       transfers, remote deposit capture, P2P, bill pay, ATMs,
     Out of the box capabilities supported including                                                  cash-in and physical/digital debit cards                                                             Core banking systems provide primary account
      customer care, compliance, fraud mgmt., deposit /                                                                                                                                                      features at ultra-high reliability
      loan operations and debit card printing                                                         Gamified cross-industry offers and perks
                                                                                                                                                                                                            Modern cloud enables consistent re-use across
     Flexible connections to banks via partner-specific                                                                                                                                                     multiple partners, tested on millions of accounts
      banking APIs

     Note: BM Technologies is not a bank and does not provide banking services. BM Technologies is a technology provider that facilitates deposits and banking services between a customer and an FDIC insured partner bank. Any reference in this
     presentation to “banking” or “banking services” is in reference to BankMobile providing services between a customers and a partner bank. The BankMobile brand and trademark is only used in reference to services being provided between a                  | 17
     customer and an FDIC insured partner bank
4b       continued -       Deliver Full-Service Banking Platform to Partners’ Customers
Attracts Customers Through Digital Channels and Provides Back-Office Support in One Solution

                BM Technologies delivers a full-service, centralized and customer-centric experience while alleviating the back-office and
                                                      administrative burden for white-label partners

                                       C.
                                       C Full-Service Banking Support                                                                                                                D          Access to a Partner Bank

            Deposit                                Compliance Solutions                                    Call Center
           Operations                              (KYC, AML, BSA, Etc.)                                   Operations

                                                                                                                                                               Established                                     Regulatory                                  FDIC
                                                                                                                                                              Bank License                                     Approvals                             Insured Deposits

           Debit Card                                        Physical                                     Information
            Issuance                                       ATM Access                                       Security

                                                                                                                                                               Integrated,                                   Streamlined                                 Loan
                                                                                                                                                              Flexible APIs                                 Payment Rails                             Underwriting
           Fraud                                         Data Analytics                                       Core
         Management                                       / Reporting                                      Processing

     Note: BM Technologies is not a bank and does not provide banking services. BM Technologies is a technology provider that facilitates deposits and banking services between a customer and an FDIC insured partner bank. Any reference in this
     presentation to “banking” or “banking services” is in reference to BankMobile providing services between a customers and a partner bank. The BankMobile brand and trademark is only used in reference to services being provided between a                | 18
     customer and an FDIC insured partner bank
5     Competitive Positioning
    Complete Digital Banking Platform

      Illustrative Competitive Landscape

                  Representative Firms                                                                                                                  Why BM Technologies Wins
                                                               Consumer Banks &                                  Fintech BaaS           White-Label       Partnership model offering
           Competitive Differentiation       White-Label                                  BaaS Banks
                                                                   Neo Banks                                       Providers             Charters         turnkey, fully branded digital
                                                                                                                                                          banking platform.
         Extreme partnership tailoring
  Deep customer experience integration           4                      0                      2                       2                      2
                                                                                                                                                          Deep experience and long
                     Full-BaaS Model
                                                                                                                                                          history in B2B2C banking
   Complete white label digital banking
        platform (compliance, deposit
      operations, fraud management,
                                                 4                      0                      3                       1                      1
                   customer care, etc)                                                                                                                    Superior service, delivering
                                                                                                                                                          executive oversight and fully-
                 Branded Digital Banking
                                                 4                      0                      0                       0                      0
                                                                                                                                                          supported implementation
Offer full white label digital bank app on
                          mobile and web
Revenue share / great consumer prices
                                                 4                      0                      4                       2                      2
                                                                                                                                                          Delivers interchange revenue
  Partnerships drive low CAC & blended                                                                                                                    share potential from all account
   offers. Planned Durbin exempt bank                                                                                                                     activity

                                               BM Technologies’ ability to customize and integrate a fully branded front and back end experience is a
                                              differentiating approach and key to partners who have a strong brand relationship with their customers

                                                                                                                                                                          | 19
6         Distribution Through Market Leadership Position in Higher-Ed
Deeply Embedded Campus Relationships Allow for Customer Acquisition and “Customer for Life” Strategy

U.S. Higher-Ed Student Disbursement Market Share(1)                                                                                                                   Benefit of the Higher-Ed Business
        Total Addressable Market is 20M students and replenishes every year(2)(3)                                                                                            Access to ~1 in every 3 college students in the U.S.

                                                                                                                                                                             Ability to create “customer for life” through selling additional financial services
                                                                                                                    Payment                                                   products as students graduate
                                                               Software                                             Providers
                                                                 19%
                                                                                                                                                                             Proven scale generating approximately $60M in annual revenues with nearly 2M
                                      31%                                                                                                                                     accounts currently on the platform

                                                                                                                                                                             Scalable technology distributing more than $10B of payments a year
                                                                         Other(5)
                                                                          18%

                                    In-House Capabilities
                                            30%                                                                     National
                                                                               2%                                    Banks                                         Recent Developments
                                                                                                                                                                             BMT is in active implementation and negotiations on 2 new Partnerships that are
                                                                                                                                                                              intended to increase product offerings to schools and increase adoption of BMT
Exclusive, Long-Term and Contractual Campus Relationships                                                                                                                     products by SSEs.
     Long-term embedded university client base of approximately 725 campuses                                                                                                BMT’s mix of SSE’s is weighted towards local, two-year institutions
     SSE retention rate of over                     98%(4)
                                                                                                                                                                             Management believes BMT’s segment exposure could perform better than more
     Average client tenure > 5 years                                                                                                                                         expensive, private, four-year schools, by offering a better value proposition
                                                                                                                                                                              particularly if remote learning becomes more common or required
     Typical new contract term is 3 – 5 years with auto-renewal periods of various lengths
     Active pipeline of ~1M students
                                                                                                                                                                                   ‒       87% of SSE at better value “public” schools
                                                                                                                                                                                   ‒       Active pipeline of schools with ~1M SSEs
     Expect prepaid providers to be a minimal threat as regulations have made it more
      difficult for prepaid operators
Note: SSEs refers to Signed Student Enrollment                                                                                                      3)   ~3M SSEs are considered non-addressable (beauty schools, trucking schools, etc.)
1)    Per BM Technologies internal sales database and estimated student market size based on SSEs                                                   4)   Represents one minus the annual SSE attrition over beginning of the year SSE count
2)    National Center for Education Statistics. “Enrollment and Employees in Postsecondary Institutions, Fall 2015; Financial Statistics Academic   5)   Includes credit unions, regional banks, other software providers, unknown, etc.               | 20
      Libraries, Fiscal Year 2015”, February 2017
7        Highly Attractive Business Model
Income Statement – Historical & Forecasted

Revenue Breakout by Major Categories                                                                                                        Historical & Projected Income Statement
                                                                                                                                                                                                           2019 Pro Forma Core(1)     2020 Pro Forma Core(1)             2021E                       2022E
                                                   Interchange and MasterCard incentive income based
     Card Revenue
                                                   on card activity and out-of-network ATM fees                                          Pro Forma Core Revenues ($mm)                                                      $61.3                       $66.7                     $104.0                      $144.4
          39%
                                                                                                                                           Less: Pro Forma Core OpEx (Excl. Deprec. & Amort.) ($mm)                           63.6                       63.1                       82.6                        94.1

                                                                                                                                         Pro Forma Core EBITDA ($mm)                                                         ($2.2)                      $3.5                      $21.5                       $50.3

 Deposit Servicing                                 Fee charged to partner bank(s) based on average                                         Less: Interest Expense ($mm)                                                        0.5                        1.4                           0.6                       0.3
      Fees                                         balances of serviced deposits                                                           Less: Deprec. & Amort. ($mm)                                                        9.3                       11.9                        14.7                        16.7
      33%
                                                                                                                                         Pro Forma Core Pre-Tax Income ($mm)                                                ($12.1)                     ($9.8)                      $6.2                       $33.3

                                                                                                                                           Less: Tax Expense ($mm)                                                             0.0                        0.0                           1.5                       8.0

                                                   Monthly account fees, wire fees and card                                              Pro Forma Core Net Income ($mm)                                                    ($12.1)                     ($9.8)                      $4.7                       $25.3
     Account Fees
                                                   replacement fees
          17%
                                                                                                                                         Average Serviced Deposits ($mm)                                                   $548.5                     $750.1                     $1,381.4                    $2,335.0

                                                                                                                                         YoY Growth
                                                   Subscription and transactional fees charged to                                          Average Serviced Deposits                                                                                     37%                        84%                         69%
     University Fees                               colleges based on enrollment size, competitive                                          Pro Forma Core Revenues                                                                                        9%                        56%                         39%
                                                   marketplace and disbursement channels and options
           8%                                                                                                                              Pro Forma Core OpEx (Excl. Depreciation & Amortization)                                                       (1%)                       31%                         14%

                                                                                                                                           Pro Forma Core EBITDA                                                                                               -                   505%                        134%

                                                                                                                                           Pro Forma Core Net Income                                                                                           -                          -                    442%

                                                   Various nominal other fees, including fees associated
       Other Fees
                                                   with cash deposits
           2%

                                   % of Total 2020 Revenues

 Note: 2020 – 2022 forecasted figures incorporate additional public company cost upon consummation of the SPAC merger transaction. Forward looking financial    1)     2019 financials are shown pro forma for BM Technologies’ current deposit servicing and expense agreements with
 projections assume white label business achieves significant forecasted growth. These figures are subject to significant business, economic, regulatory and
 competitive uncertainties and contingencies, many of which are beyond the control of the Company and its management.                                           2)
                                                                                                                                                                       Customers Bank; see page 42 for reconciliations to Pro Forma Core Financials
                                                                                                                                                                       EBITDA is a Non-GAAP financial measure; see page 43 for reconciliations to Non-GAAP financial measures
                                                                                                                                                                                                                                                                                              | 21
Demonstrating Strong Performance Across Key Metrics
 Key Performance Indicators – Metrics of Company Success
   Card Spend Q4                Card Spend YTD             EoP Serviced Deposits Q4 Organic Deposits YTD                         Higher Ed Account                     Interchange
            ($M)                          ($B)                            ($M)                              ($B)                     Retention                           Rate YTD
             23%                          18%                             139%                              33%
                                                                                                                                             1%                                -8%
                                                 $2.79                                                                                                                0.81%
                                                                                                                                   98.5%           99.4%                               0.74%
                                  $2.37                                           $960                              $1.88
                    $682

     $557                                                                                           $1.41

                                                                   $401

    Q4'19          Q4'20          2019           2020             Q4'19           Q4'20             2019            2020          3-Yr Avg          2020              2019             2020

 Comments:
 Strong growth driven by       After falling 2% YOY in       Growth driven by increase              Growth driven by               2020 retention is             Decline due to impacts of
  significant increases in     Q1, Debit Card spend             in accounts, organic              stronger performing              above average of             COVID (increase in average
both Higher Ed and White        grew 32% in Q2 and            deposits, and boosted by          accounts and boosted by             trailing 3 years’             ticket size and changing
           Label               24% in Q3, and 23% in         federal stimulus programs         federal stimulus programs               retention               consumer merchant mix). We
                                          Q4                                                                                                                   expect some positive revision
 Definition:                                                                                                                                                                in 2021
   The aggregate amount of      The aggregate amount of          Aggregate, end of period         Cash inflows to end user       Calculated as one minus the         Represents the amount of
  spend on debit cards in Q4     spend on debit cards in       balance of serviced customer         deposit accounts, not         annual SSE attrition over         revenue for each debit card
       2020 vs Q4 2019                2020 vs 2019              deposits across all business        attributable to higher        beginning of the year SSE      transaction, including interchange
                                                                           lines                 education disbursements or                 count                   maintenance paid by partner
                                                                                                 white label partner incentive                                   bank, net of network costs, as a %
                                                                                                          payments                                                         of debit spend

                                                                                                                                                                                | 22
Case Study: Higher Education Business
Illustrative Example of how Student Loans or Grants flow to Higher Education Institutions and onto Students (how proceeds flow)
                                                                                                                                                          Collaboration on enhanced
                                                                                                                                                       offering planned to launch 2021

              Federal & Private                                     Colleges & Universities                               Students
                                                                                                Disbursement                                                          +
                                                                                                                                                                       or

                                                                                                                                                             ACH Transfer to
                                                   Loan or Grant:                                 Refund:                                                 Another Bank or Check
                                                      $10,000                                     $1,500

                  $260 Billion                                             Tuition:
     Total Aid and Non-Federal Loans                                       $8,500
            for 2018 & 2019(1)

                                                                                                                                                                     Housing       Travel
                                                                                                                                                          Books
                                                                                                                                                                    and Food     and Other

                                                                      Disbursement          Department of           Service &            Technology             Audits & Record
     Eliminating Complexity for Schools:                               Timing                 Ed Compliance            Staffing Needs        Demands                 Keeping

     BM Technologies                                                    Higher-Ed Partners                               Student and Non-Student Customer Accounts
                                                                        • Subscription Fees from Higher-Ed Clients       • Interchange Revenue on Customer Activity
     Revenue Opportunities                                              • Transaction Fees from Higher-Ed Clients        • Service Fees for Wire, Foreign ATM Transactions
                                                                                                                         • Account Maintenance Fees for Non-Students
                                                                                                                         • Deposit Servicing Income from Serviced Deposit Balances

1)   CollegeBoard, “Trends in Student Aid 2019”.
                                                                                                                                                                                | 23
Higher-Ed Business Unit Value Creation

                                                          Bank Partners
                                                                                                                  Benefits of a BankMobile Account
                                                                          Low-Cost
                                         Fees from Bank                                              High tech digital banking            Free national ATM access
                                                                          Consumer                                                     
                                            Partners                                                  product                              Financial education
                                                                           Deposits                  Competitive interest rates
                                                                                                                                       
                                                                                                                                          Low fees
                                                                                                     Student focused special
                                                                                                      discounts from partners
                                                                                                      (digital study tools from
                                                                                                      Bartleby and financial support
                                                                                                      services from Billshark)

                      Subscription                                               Disbursement Distributed Through
                     and Other Fees                                                  BankMobile Vibe Account

  Higher-Ed Campus                                                                                                                     Account Holder
                        Manage Disbursement                                   Card Usage Drives Interchange Fees Paid by
                              Process                                         Merchant, Customer Pays Some Account and
                                                                               Usage Fees (e.g., ATM, Card Re-Issue, etc.)

                                                                                                                                                       | 24
New Business Verticals Performance

                 Number of Open Accounts                                                                              EOP Serviced Deposit Balances                                                                                              Card Spend
                                                                                                                                                  ($MM)                                                                                                 ($MM)

         Jan
          1 Feb
             2 Mar
                3 Apr
                   4 May
                      5 Jun
                         6                        Jul
                                                   7 Aug
                                                      8 Sep
                                                         9 Oct
                                                            10 Nov
                                                                11 Dec
                                                                    12                                              Jan Feb Mar Apr May Jun Jul Aug Sep Oct Nov Dec
                            Q1’20            Q2’20          Q3’20          Q4’20                                              Q1’20           Q2’20            Q3’20            Q4’20                                                 Q1’20           Q2’20              Q3’20      Q4’20
    QoQ Growth              18%             12%              21%             9%                         QoQ Growth           31%             52%               84%              86%                            QoQ Growth            22%  44%                            23%         7%
    YoY Growth              770%            123%             79%            74%                         YoY Growth           869%            250%              343%             579%
                                                                                                                                                                                                               YoY Growth           1159% 540%                           180%       129%

                                                                                                                                                                             Account Level Performance of the New Business Verticals
                                                                                                                                                             EOP Serviced Deposit Balances                                                          Card Spend per Quarter
     • Over the last twelve months, quarterly card spend has more than                                                                                              per Account ($)                                                                     Per Account ($)
       doubled and the number of accounts has grown by nearly 75%
     • Serviced deposit balances are growing exponentially and have grown by                                                                                                                                                      400
       over 570% in the last twelve months
     • Overall growth is driven by both increasing number of accounts and                                                                                                                                                         300
       average account performance
                                                                                                                                                                                                                                  200
     • New Business Account Level Metrics:
           • EOP Serviced Deposits Balances up 211% YoY per Account                                                                                                                                                               100
           • Quarterly Card Spend up 29% YoY per Account                                                                                                                                                                              -
                                                                                                                                                 Q4 '19        Q1 '20         Q2 '20         Q3 '20         Q4 '20                            Q4 '19 Q1 '20 Q2 '20 Q3 '20 Q4 '20
                                                                                                                                                     New Business                Total BMT             Higher Ed                          New Business                  Total BMT    Higher Ed
Note: New Business includes White Label Partners and Workplace Banking; EOP Serviced Deposits refers to End of Period Serviced Deposit Balances. Shaded portion of December 2020 “Number of Open Accounts” denotes adjustment for inactive accounts cleansed annually
                                                                                                                                                                                                                                                                                    | 25
White-Label BaaS Market Opportunity

                                  Massive Identified Addressable Market                                                                                                            Key Market Attributes of Target Partners

                            Existing Identified                                                       >50 Million
                            Market                                                                     Prospects                                                 Established Brand Equity                                        Immense, Captive Customer Base
                                                                                                                                                             Ability to leverage market-trusted                                  Massive, underserved customer bases
                                                                                                                                                              image in co-branded marketing                                        provide a deep pipeline of sticky
                                                                                                                                                              materials, as well as UX and App                                         customers to market to

                            Customer
                            Pipeline related                                                         ~150 Million
                                                                                                                                                                                                    Strong Customer Loyalty
                            to New White-                                                             Prospects                                                                            Immensely loyal, existing customer base
                            Label Partners(1)                                                                                                                                               in need of financial and digital banking
                                                                                                                                                                                                           solutions

                            Total Identified                                                         >200 Million                                              Diverse Marketing Channels                                    Numerous Natural Checkout Moments
                                                                                                                                                                Deeply ingrained marketing                                     Effortless, omni-channel checkout points
                            Market                                                                    Prospects                                              channels to promote co-branded                                        retain customer dollars within the
                                                                                                                                                             platform and increase awareness                                        Banking-as-a-Service ecosystem

                                  BM Technologies is targeting to add one new large partner per year and is currently in multiple RFP processes

1)   Represents customer reach of identified White-Label prospects initiated in partnership conversations with BM Technologies; BM Technologies acknowledges that there is likely to be customer overlap amongst white-label customers and industry
     verticals                                                                                                                                                                                                                                            | 26
Our B2B2C Differentiation

        Low Acquisition Costs,                                                                    Competitive                                                                   Competitive                                                                    Deep
         High Adoption Rates                                                                       Economics                                                                     Advantage                                                                   Experience

                                                                                                            “Durbin Exempt”                                                                 Large Banks Unable
                                  Digital First /                                                                                                                                                                                                                    Deep Expertise in
                                                                                                            Interchange-Only                                                                   to Compete on
                                   Branchless                                                                                                                                                                                                                         B2B2C Banking
                                                                                                                  Model                                                                      Interchange Alone

                                                                                                                                                                                            Small Banks Unable
                           Large Aggregators of                                                              Low Fee Banking                                                               Invest Adequate $ to
                               Consumers                                                                       with Benefits                                                                                                                                       > 2 Million Accounts
                                                                                                                                                                                            Build BaaS Platform

                                                                                                                                                                                            Regulators Wary of
                                                                                                                                                                                             Allowing Fintechs                                                           Launched
                                                                                                          Reduced On-Partner
                                Trusted Brands                                                                                                                                               Without Banking                                                          Partnership with
                                                                                                               Expense
                                                                                                                                                                                            Acumen to Scale(1)                                                       T-Mobile via TMM

                                                                                                                                                                                               Chartered,
                              Natural Checkout                                                                  Attractive                                                                                                                                            Proven Service &
                                                                                                                                                                                             FDIC-Insured,
                                 Moments                                                                      Revenue Share                                                                                                                                            Delivery Model
                                                                                                                                                                                          Not-Prepaid Partners

 1)    The Wall Street Journal; “Judge Denies Federal Authority to Issue Fintech Bank Charters” – October 2019
 Note: BM Technologies is not a bank and does not provide banking services. BM Technologies is a technology provider that facilitates deposits and banking services between a customer and an FDIC insured partner bank. Any reference in this presentation to “banking” or
 “banking services” is in reference to BM Technologies providing services between a customers and a partner bank. The BankMobile brand and trademark is only used in reference to services being provided between a customer and an FDIC insured partner bank
                                                                                                                                                                                                                                                                                  | 27
Experienced Management Team
Vision and Experience to Execute

Management Team                                                                                                                                                By the Numbers

                                                                                                                                                                         ~24
                                                                                                                                                                                         Average
                         Luvleen Sidhu                                              Bob Ramsey                                       Robert Diegel
                                                                                                                                                                                         Industry
                         CEO and Co-Founder                                         Chief Financial Officer                          Chief Operating Officer              Years          Experience
                                           FinTech Woman
                                             of the Year(1)

 Industry Experience
 9+ Years
                                                              Industry Experience
                                                              20+ Years
                                                                                                                Industry Experience
                                                                                                                35+ Years
                                                                                                                                                                         257             FTEs(2)

                                                                                                                                                                          Most
                         Warren Taylor                                              Andrew Crawford                                  Melanie Mathias                   Innovative
                                                                                                                                                                                         Industry
                                                                                                                                                                                         Recognition
                         Chief Customer Officer                                     Chief Commercial Officer                         Head of Marketing                    Bank
                         and Co-Founder
                                                                                                                                                               Key Industry Expertise
Industry Experience                                           Industry Experience                              Industry Experience
35+ Years                                                     23+ Years                                        20+ Years
                                                                                                                                                                     FinTech

                                                                                                                                                                     Banking
                         Jamie Donahue                                              Hans Fleming                                                                     Compliance / Risk Management
                         Chief Digital Officer                                      Head of Business
                                                                                    Development                                                                      Operations

                                                                                                                                                                     Finance
Industry Experience                                           Industry Experience
25+ Years                                                     25+ Years                                                                                              Digital Marketing

1)   2019 LendIt Fintech Industry Awards
2)   As of 12/31/2020                                                                                                                                                                    | 28
Tremendous Platform Growth Opportunity
Multiple Levers to Accelerate Growth

                                                                                                                                                 Strategic
                                                                                                                                                   M&A
                                                                                                            Expand Distribution
                                                                                                               Channels and
                                                                      Continue to Add New                    Product Offerings
                                                                      White-Label Partners
  Expand Student Adoption          Further Expand Within
   and Create Long-Term             Existing White-Label
 Customer Relationships by              Partnerships
 Expanding Access to Credit
         Products

 Continue to add new SSEs       Drive strong organic growth by    Continue RFP process and             Distribute the platform     Capitalize on robust universe of
                                   successfully executing on our      strategic discussions with            through new channels to      marketplace lenders, Personal
 Increase adoption rates          customer acquisition and           vetted blue-chip, white-label         open up incremental TAM      Financial Management (“PFM”)
   through new partnerships
                                   engagement strategies              partners to tap into their loyal                                   players, and vertical higher-ed
 Expand bank partnerships to                                         customer bases                                                     software acquisition targets
   expand access to credit

                                                                                                                                          CONFIDENTIAL | 29
Financial
Information
Financial Summary
Pro Forma Core Financial Metrics

                 ($ in millions)                                                             2020                        2019            YoY Chg        Commentary

                                                                                                                                                        •   Interchange and card revenues declined, despite 18%
                 Interchange and card revenue                                                        $26.3                      $28.1    ($1.8) (7%)        growth in card spend due to $1.3 mm drop in ATM
                                                                                                                                                            related revenue and reduced interchange fee rates
                 Deposit servicing fees                                                                22.3                      16.5     5.8   35%     •   Deposit servicing fees increase of 35% driven by
                                                                                                                                                            increase in average deposit balances
                 Account fees                                                                          11.3                      10.9     0.4      3%
                                                                                                                                                        •   University fees benefitted from COVID-related services
                 University fees                                                                         5.3                      5.0     0.4      7%       provided to new, non-subscription clients

                 Other                                                                                   1.5                      0.9     0.6   73%

                 Pro Forma Core Revenues                                                             $66.7                      $61.3    $5.3      9%
                                                                                                                                                        •   2020 expense levels benefitted from contract
                                                                                                                                                            optimization initiatives launched in 2H 2019
                 Pro Forma Core OpEx (Excl. Depr. & Amort.)                                            63.1                      63.6     (0.4) (1%)    •   Additional benefits expected to be realized from
                                                                                                                                                            operating leverage initiatives implemented in October
                                                                                                                                                            2020
                 Pro Forma Core EBITDA                                                                 $3.5                     ($2.2)   $5.8   NM

                                                                                                                                                        •   Interest on debt
                 Less: Interest Expense                                                                  1.4                      0.5     0.9      NM

                 Less: Depreciation & Amortization                                                     11.9                       9.3     2.6   29%     •   Increase in depreciation and amortization expense in
                                                                                                                                                            2020 driven by launch of white label products and
                 Pro Forma Core Pre-Tax Income                                                        ($9.8)                 ($12.1)     $2.3 (19%)         amortization of capitalized development expenses

                 "NM" refers to chagnes greater than 150%
                 Total Serviced Deposits - EoP                                                        $960                      $401     $559 139%      •   Significant growth in balances and spend in 2020
                 Total Debit Spend                                                                 $2,791                    $2,370      $422   18%

Source: Company management
Note: Refer to Reconciliation to Pro Forma Core Financials on page 43; Growth rates over 150% deemed not meaningful – “NM”                                                                                           | 31
Cost Controls and Revenue Growth Drive Operating Leverage
 Focus on Expense Control as BMT Initiatives Launch and Exit “Build” Phase
                                                                    2019                                                              2020                                                           2021                               Beyond
                                             Ongoing $10mm                                      Contract Optimization Initiative (1)                                                                                                                      Recurring
Focus on Expense                             Annualized Benefit                                                                                                                                                                         $17mm             Annual
                                                                                                                                                                                                                                                          Savings
    Management                               • Initiatives focused on
                                               contract optimization and                                                                                                                                                                                  OpEx
                                               process automation and
                                               resulted in permanent
                                                                                                               Ongoing $7mm Annualized
                                                                                                               Benefit
                                                                                                                                                                       Operating Leverage Initiative                                     25%              Savings
                                                                                                                                                                                                                                                          Rate(2)
                                               reduction to cost base
                                                                                                               • Operating leverage initiatives,
                                             • Benefits began in 2H 2019                                         including reorganization,
                                               and included $5mm savings                                         automation, and vendor
                                               in 2019                                                           negotiations launched in Q4
                                                                                                                 2020

       Maintaining
      Revenue High
           Growth
                                                                  2019 Pro Forma                                                      2020E                                                         2021E                                2022E +
                                                                                                                                                                                                                                         2022+
                                                                                                                                                BMT Forecast Revenues
 1)   Majority of savings related to reducing costs of variable services. 2020 projected savings of $10mm calculated by comparing actual costs with projected costs using 2020 account activity and previous agreements and processes
 2)   Based on 2019 total expenses minus depreciation and amortization                                                                                                                                                                             | 32
 Note: 2019 Pro Forma Revenues
Financial & Operating Highlights
  BM Technologies’ Model has enabled it to establish a highly attractive financial & operating profile

             >5mm                                                                         $11.7bn
                  *SSEs (1)

BM Technologies Serves Approximately                                                  Total Student Refund
   1 in 3 of all US College Students                                                   Dollars Processed (3)
                                                                                                                                                                       Revenue                                               Revenue                                              EBITDA Margin

             >2mm                                                                             $2.8bn                                                            $67mm                                                  $104mm                                                             21%
                                                                                              Debit Spend (3)                                                            2020                                                 2021E (4)                                                   2021E (4)
              Accounts (1)

               >98%                                                                      $960mm
       Higher-Ed Client                                                                       EoP Serviced
    Retention (by SSEs) (1)(2)                                                                 Deposits (3)

   •   Signed Student Enrollments (“SSEs”)
   Source: BM Technologies management

   1)    Non-GAAP, see slide 42                                                                         4)   Reflects forecasted full year 2021 data; Forecasted Revenue and EBITDA set forth on “Income Statement History and Forecast“ on slide 22 & 32; EBITDA is a Non-GAAP
                                                                                                             financial measure which can be reconciled on page 43; Forward looking financial projections assume white label business achieves significant forecasted growth. These
   2)
   3)
         Represents one minus the annual SSE attrition over beginning of the year SSE count
         Reflects 2020                                                                                       figures are subject to significant business, economic, regulatory and competitive uncertainties and contingencies, many of which are beyond the control of the Company and    | 33
                                                                                                             its management
Valuation Overview
                                                                                                                                                                                                                                                                                                                        Enterprise Value /
                                                                                                                                                                                                                                                                                                               2021E Rev.              2021E EBITDA
                Enterprise Value multiples are valued at a significant discount when looking at 2021E EBITDA and revenue                                                                                                                                                  Digital Financial Platform Comparables
                                                                                                                                                                                                                                                                           SoFi                                             15.0x                     NM
                                           Public Comparable Companies (1)                                                                                               Public Comparable Companies (1)
                                                                                                                                                                                                                                                                           Moneyl i on                                      17.3x                     NM
                                             EV / 2021E Revenue Multiples                                                                                                   EV / 2021E EBITDA Multiples                                                                    Median                                          16.1x                      NM

                                                                                                                                                                                                                                                                           Bank Tech Comparables
                                                                                                                                                                                                                                                                           FIS                                               8.0x                 17.9x
                                                                                                                                                                                                                                                                           Intui t                                          10.9x                 30.7x
                                                                                                                                                                                                                                                                           Fi s erv                                          6.5x                 16.6x
                                                                                                                                                                                                                                                                           ADP                                               5.3x                 21.4x
                                                                                                                                                                                                                                                                           Ja ck Henry                                       6.3x                 19.8x
                                                                                                                                                                                                                                                                           Temenos                                          11.2x                 24.5x
                                                                                                                                                                                                                                                                           Q2                                               13.0x                     NM
                               (2)                                                                                                                                        (2)
                                                                                                                                                                                                                                                                           ACI Worl dwi de                                   4.4x                 15.4x
                                                                                                                                                                                                                                                                           Bottoml i ne Tech.                                4.3x                 20.6x
                                                                                                                                                                                                                                                                           Median                                            6.5x                 20.2x

                Private market valuations for US and Int’l Neobanks using disclosed valuations and number of accounts (3)
                                                                                                                                                                                                                                                                           Payment Technology and Software Solutions Comparables
                                                                                                                      Valuation / Customers                                                                                                                                Pa yPa l                                         11.3x                 38.4x
                                                                                                                                                                                                                                                                           Squa re                                           8.2x                     NM
                                                                                                                                                                                             2019 Avg Rev per Customer (4)
                                                                                                                                                                                                                                                                           Repa y                                           12.1x                 28.3x
                                                                                                                                                                                                  BM Technologies: $30
                                                                                                                                                                                                      Revolut: $31                                                         Gl oba l Pa yments                                9.5x                 20.2x
                                                                                                                                                                                                      Monzo: $27                                                           i 3 Verti ca l s                                  4.5x                 17.1x
                                                                                                                                                                                                                                                                           Shi ft4 Pa yments                                 4.5x                 32.2x
 Average: $546 per Customer                                                                                                                                                                                                                                                Pa ya , Inc.                                      7.4x                 26.6x
                                                                                                                                                                                                                                                                           Median                                            8.2x                 27.4x

                            $71                                                                                                                                                                                                                                            B2B / Card Issuers & Processors Comparables
                                                                                                                                                                                                                                                                           Fl eetCor                                        10.2x                 18.5x
                                                                                                                                                                                                                                                                           WEX                                               6.9x                 17.1x
                                                                                                                                                                                                                                                                           Al l i a nce Da ta Sys tems                       4.9x                 16.1x
Valuation                                                                                                                                                                                                                                                                  Worl dl i ne                                      4.9x                 19.6x
 ($mm)              $156.9mm                      $14,500mm                       $1,400mm                      $25,000mm                       $3,500mm                        $5,500mm                      $1,548mm                   $1,000mm                          EML Pa yments                                     8.5x                 27.5x
Accounts(3)                                                                                                                                                                                                                                                                Median                                            6.9x                 18.5x
 (millions)            2.2 mm                         12mm                            5mm                           34mm                            5mm                          10mm                          4.8mm                          2mm

           Source: Capital IQ & FactSet Research Systems, Inc.; Market data as of 3/5/2021                                                                                                               3)     FT Partners Research, “The Rise of Challenger Banks”, Business Insider, TechCrunch and Bloomberg; References to number of
           Note: Multiples exclude valuations less than 0.0x and greater than 50.0x; Peer data reflects consensus estimates
           1)     Reflects median values for comparable companies in each respective industry                                                                                                            4)
                                                                                                                                                                                                                customers is assumed to apply accounts; BMT account data as of 12/31/2020
                                                                                                                                                                                                                See slide 39; 2019 Ending Revenue reported by Monzo and Revolut / Avg # of customers throughout the year. Conversion at 1.29   | 34
           2)     Forecasted Revenue and EBITDA are set forth on “Income Statement History and Forecast“ on slides 22 & 32; EBITDA is a Non-GAAP financial measure which can be reconciled on page 43           USD to GBP; https://sifted.eu/articles/a-comparison-of-uk-top-three-digital-banks/
Investment Thesis
Unique Opportunity to Invest in a Premier Brand Positioned for Significant Growth

      Recognized               Rapid Market         Best-in-Class              Positioned For                     Strong
     Market Leader              Expansion           Digital Bank             Significant Growth               Financial Profile

        Among the Largest
         Digital Banking
                                                         Sophisticated          Planned 2021 Launch
                                                                                of Collaboration with             $66.8M
                                                          Capabilities
           Platforms                                                                 Google Pay                  2020 Revenue
                                      Higher-Ed
                                                          Frictionless          White-Label Partner
                                                                                                                     26%
        Proprietary “BaaS”                                Onboarding                Expansion             2019 - 2021E Pro Forma Core
           Technology                                                                                            Revenue CAGR

                                     White-Label           Powerful              New White-Label                  $960M
                                     Partnerships     Customer Acquisition       Partner Additions        2020E EoP Serviced Deposits
      High-Volume, Low-Cost
        Acquisition Model
                                                          Proprietary           Distribution Channel                 37%
                                                         Infrastructure         and Product Offering
                                     Workplace                                                          2020E Avg. Service Deposit Growth
                                                                                      Expansion
       Full Suite of Banking          Banking
        Products Through                                   Dynamic
                                                                                   Strategic M&A
                                                                                                                     18%
          Partner Banks                                 Consumer Data
                                                                                                           2020E Debit Spend Growth

                                                                                                                          | 35
Appendix
BM Technologies Average Account Performance Comparison
     Key Operating Metrics Comparison against Leading UK based Digital Banks
     Illustrative Analysis                                                                                                                                                                                                                 Highlights
                                                                                $32
                                                                                                                                                                       $31                                                                    BM Technologies compares
                                                                                                             $30
           Revenue per Account                                    (1)
                                                                                                                                          $27
                                                                                                                                                                                                                                              favorably with both Monzo
                                                                                                                                                                                                                                              and Revolut on key metrics

                                                                          Category 1                   Category 2                   Category       3             Category 4
                                                                             2020                         2019                       Fiscal 2019 (4)                2019                                                                      Revolut reported 10mm
                                                                                                                                                                                                                                              customers at the end of 2019
                                                                               $434                                                      $460
               EOP Serviced                                                                                 $207
                                                                                                                                                                      $304                                                                    and was last valued at $5.5B
               Deposits per
               Account                                                                                                                                                                                                                        Monzo reported 4.8mm
                                                                          Category 1                   Category 2                   Category
                                                                                                                                     Fiscal 2019 3               Category
                                                                                                                                                                     2019 4
                                                                             2020                         2019
                                                                                                                                                                                                                                              customers as of 12/2/20 and
                                                                                                                                                                    $19.60                                                                    was last valued at ~$1.5B
                                                                                                           $13.50                      $13.80
               Card Rev per                                                   $12.70

               Account (2)
                                                                          Category 1                   Category 2                   Category(4)3                 Category 4
                                                                                2020                        2019                     Fiscal 2019                        2019

                                                                                                                       $550
               Valuation per                                                                                                                               $323
                                                                                    $75
               Account (3)
                                                                              Category 1                           Category 2                         Category 3

1)    Total reported revenue divided by average number of customers throughout the year calculated using beginning and end of year customer counts. Customer counts identified using either disclosed number of accounts or customers.; 2) Reported by Monzo as Net fee and commission income;
      Reported by Revolut as Card & Interchange; (3) Latest private market valuation divided by number of accounts for Monzo and Revolut; Transaction valuation divided by number of accounts for BM Technologies; See Page 34; (4) Net of $10.7mm Fee and Commission Expense
Source: https://sifted.eu/articles/a-comparison-of-uk-top-three-digital-banks; Revolut and Monzo Annual Reports; FT Partners Research, “The Rise of Challenger Banks”, Business Insider, TechCrunch and Bloomberg;                                                                         | 37
Note: Exchange Rate of GBP to USD = 1.29 for all Monzo and Revolut data; Monzo data is Fiscal year end Feb 29,2020 and Revolut data is year end Dec 31, 2019; BM Technologies Revenue is pro forma core revenue
Business Model Comparables

  Degree of                                              Similarities to BMT                                                                        Differences to BMT
Comparability

                  “NeoBanks”        •   Competitive product to the end consumer - digital checking and               •    Key business model differentiation is the BMT utilizes a B2B2C distribution strategy
   Higher                               savings accounts with features that include two-day paycheck , etc                rather than marketing to consumers directly which enables very low customer
                                                                                                                          acquisition costs
                                    •   Generates the vast majority of its economics from the digital bank
                                        accounts                                                                     •    BMT generates some subscription revenue

                Payments & Cards    •   The largest source of revenue for BMT is interchange fees generated      •       BMT also generates some revenue from deposit servicing and subscription services
                                        from card payment processing
                                                                                                                 •       BMT provides Banking-as-a Service functionality to third parties

                Bank-Technology     •   Provides Banking-as-a Service functionality to third parties, allowing   •       QTWO and many other bank technology providers primarily generate revenue through
                                        them to engage their existing customers with branded financial                   software subscriptions. BMT generates the majority of its revenue through usage of the
                                        services like checking and savings accounts                                      digital bank accounts

                 Chartered, Full-   •   Provides Banking-as-a Service functionality to third parties, allowing   •       BMT is not a chartered bank, whereas GDOT, Bancorp and others are banks
   Lower           Stack BaaS           them to engage their existing customers with branded financial           •       GDOT generates most of their revenue from prepaid cards whereas BMT does not
                                        services like checking and savings accounts                                      provide any prepaid cards
                                    •   Generate a mix of interchange income and deposit related income          •       BMT does not originate any credit or take any loans on their balance sheet

                                                                                                                                                                                                       | 38
You can also read