A UPS White Paper, March 2015
Brazil Study
←
→
Page content transcription
If your browser does not render page correctly, please read the page content below
A UPS White Paper, March 2015 Brazil Study
Pulse of the Online Shopper™ | A UPS White Paper | March 2015 | Brazil Study

        Table of Contents
        I. Introduction ............................................................................................................................................................... 3
            A. Study Goals ..................................................................................................................................................................................... 3

            B. Methodology .................................................................................................................................................................................... 3

            C. 2015 Research Focus Areas ........................................................................................................................................................... 4

            D. Key Takeaways: The Flex Shopper Emerges in a Fluid Multi-Device, Multi-Channel World .......................................................... 4

        II. The Retail Landscape ......................................................................................................................................... 9
            A. State of the Industry ........................................................................................................................................................................ 9

            B. Mobile’s Emerging Impact ............................................................................................................................................................. 11

            C. Changing Store Dynamics ............................................................................................................................................................. 15

            D. Social Exerts Influence .................................................................................................................................................................. 16

        III. The Path To Purchase: Expectations and Satisfaction .....................................................................20
            A. The Shopper and Their Mindset .................................................................................................................................................... 20

            B. Pre-Shopping: Search and Browse ............................................................................................................................................... 21

            C. Checkout and General Shipping Preferences ............................................................................................................................... 24

            D. Delivery and the Post-Purchase Experience ................................................................................................................................. 32

        IV. Conclusion ...........................................................................................................................................................37
            A. Reflections on the Flex Shopper ................................................................................................................................................... 37

©2015 United Parcel Service of America, Inc.                                                                                                                                                                         2
UPS Pulse of the Online Shopper™ | A UPS White Paper | March 2015 | Brazil Study

I. Introduction

                                                                               In a world of constant connectivity, amidst the frenetic pace of technological change for
                                                                               both consumers and retailers, today’s “flex shopper” has been born. This flex shopper is
                                                                               ruthlessly efficient, switching channels and devices to best suit personal convenience
                                                                               when evaluating and purchasing products. Information and control are paramount and
                                                                               retailers must offer near-perfect shopping experiences across every channel and device to
                                                                               thrive.

                                                                               To provide perspective for retailers on consumer behavior in today’s fluid shopping culture,
                                                                               UPS commissioned this research with comScore for the third consecutive year. This is the
                                                                               first year that Brazil was included in the survey. The opportunity and the challenges are
                                                                               here in equal measure for today’s retailer. Brazilian e-commerce registered R$16.06 billion
                                                                               in the first half of 2014, higher than the same period in 2013 (with $12,74 registered) which
                                                                               represents a 26% nominal growth for the sector. In m-commerce, sales had a significant
                                                                               increase in the total e-commerce share for the first six months of this year, going form
                                                                               3.8% (June 2013) to 7% (June 2014), which represented an 84% growth rate in one year.
                                                                               E-bit’s forecast is to get close to 10% in December 2014. 1

A. Study Goals
        This year’s study goes beyond other retail industry studies to give a 360˚ perspective of consumer shopping. The scope has been
        expanded on key customer experience topics and now explores what drives the full consumer path to purchase. It delivers insights into
        shopping preferences and current levels of satisfaction with online and omnichannel shopping, taking the consumer’s pulse on what
        tactics influence positive shopping experiences – from pre-purchase to purchase to post-purchase. Featured throughout this study is a
        series of “Retail Watch” recommendations that can help drive retail sales.

B. Methodology
        An extensive survey designed by comScore in conjunction with UPS was fielded between July 31 and August 10, 2014. Panelists were
        sent emails inviting them to participate in a custom online survey. The survey was blind, that is, participants were not informed that UPS
        was a sponsor. All shoppers surveyed had to meet the criteria of making at least two online purchases in a typical 3-month period and
        targets for usage levels as outlined below. Ultimately, a total of 1,070 respondents completed the survey, which were distributed as
        outlined below.

                    Purchases in 3-month period                                         % of participants
                    2-3                                                                 20%
                    4-6                                                                 40%
                    7+                                                                  40%

        1   http://img.ebit.com.br/webshoppers/pdf/30_report_webshoppers.pdf

©2015 United Parcel Service of America, Inc.                                                                                                                                            3
UPS Pulse of the Online Shopper™ | A UPS White Paper | March 2015 | Brazil Study
C. 2014 Research Focus Areas
What do consumers want in an online shopping experience?
How are mobile and social media channels changing consumers’ shopping habits and expectations?
How important is product and customer service information when making a purchase, and when and where
should it be presented?
What do consumers want to see from retailers in the online checkout and delivery process?
How important are returns in the overall shopping journey and when do consumers access this information while
shopping and post-purchase?
What drives customer retention and subsequent retailer recommendations?
What are consumers interested in as it relates to emerging capabilities?
What elements of the online experience are consumers receptive to when shopping in store?
What do omnichannel shoppers value most in loyalty programs?
D. Key Takeaways: The Flex Shopper Emerges in a Fluid Multi-Device, Multi-Channel World
Following are key findings from the study, highlighting some of the critical steps in the flex shopper’s path to purchase.
1. Convenience Dominates the Shopping Landscape Online and In Store
Rather than favoring one channel over another, convenience often drives that selection. With retailers continually improving on fulfillment
and delivery times, the differences among channels are less critical for consumers. Under this scenario, retailers are pressed to create
compelling online and in-store shopping experiences coupled with exceptional service.
Choice of channel is based on many variables and is in a constant state of flux as shoppers weigh personal circumstances,
shopping needs and logistics (or shipping) options
©2015 United Parcel Service of America, Inc. 4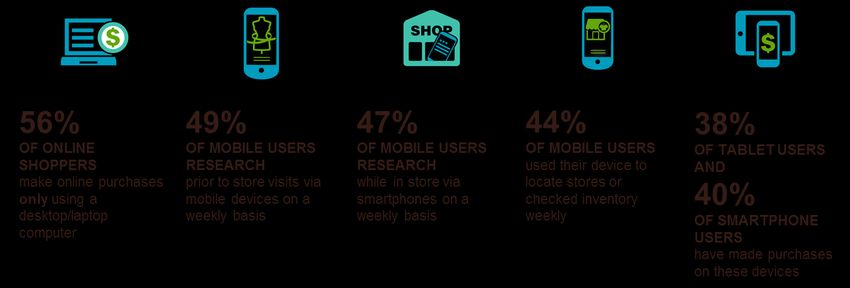
UPS Pulse of the Online Shopper™ | A UPS White Paper | March 2015 | Brazil Study

        Mobile usage stronger while in store with shoppers in Brazil than U.S. and gains ground as consumers seek convenience in
        accessing online shopping and connecting to retail stores for a variety of tasks

          2. Comprehensive Information Is Essential
        Information is central to decision-making and each retailer makes choices about how much information is ideal to satisfy the shopper.
        Investments in content – from photography to educational tools – must be weighed carefully. This information may never replace a
        well-informed sales associate, but properly delivered can support researching in advance of store visits. Information in the context of
        customer service is also a concern for shoppers wanting easy access and clarity on policies.

        Retailers are not always supplying enough information to facilitate shopper decision-making – from imagery to customer
        service elements (especially returns)

©2015 United Parcel Service of America, Inc.                                                                                                                   5
UPS Pulse of the Online Shopper™ | A UPS White Paper | March 2015 | Brazil Study

          3. Technology Adoption Is Changing the Dynamic in Unexpected Ways
        Web and mobile facilitate the ability to comparison shop at every stage of the shopping journey. Technology enhancements are
        continually made available to consumers and present new ways of shopping that are taking product recommendations and
        personalization to new levels. Retailers must now make it a top priority to deliver an efficient shopping experience for all devices –
        desktop/laptop, smartphone and tablet.

        Price-sensitive shoppers, living in a promotionally charged retail climate, take advantage of technology to secure best prices via
        every means possible

        Shoppers will make tradeoffs to save money and time, including a willingness to wait for packages

©2015 United Parcel Service of America, Inc.                                                                                                                  6
UPS Pulse of the Online Shopper™ | A UPS White Paper | March 2015 | Brazil Study
New technologies are making the shopping experience in store more dynamic while bringing some of the informational and
personalization advantages of online shopping to brick-and-mortar stores
Satisfied or dissatisfied shoppers will voice their opinions on social media
4. Logistics Plays a Key Role All Along the Path to Purchase
Logistics – defined here as fulfillment, delivery and returns – plays a major role in customer experience in the pre-purchase, purchase and
post-purchase phases. The availability of free or discounted shipping is an important factor for many shoppers at the outset of a product
search. Consumers’ desire for a full range of delivery options at checkout, as well as convenience and flexible returns should be key areas
of retailers’ focus.
While online shoppers seek out free shipping, successful retailers have to develop strategies to incent, reward and retain
customers
©2015 United Parcel Service of America, Inc. 7UPS Pulse of the Online Shopper™ | A UPS White Paper | March 2015 | Brazil Study
Shoppers are surprisingly willing to wait for most deliveries but want the option for expedited service
Returns remains an area highly valued by consumers but underserved by retailers
©2015 United Parcel Service of America, Inc. 8UPS Pulse of the Online Shopper™ | A UPS White Paper | March 2015 | U.S. Study
II. The Retail Landscape
A. State of the Industry
Today’s connected consumer has heightened the demands they place on retailers. Despite desktop’s reign, mobile’s emergence as a
significant revenue channel and social media’s ability to influence means retailers must up their game and differentiate to compete in an
omnichannel world.
The following were the most frequently cited categories in which shoppers have purchased in the last three months.
CATEGORY % PURCHASED
Books/Music/Movies 51%
Apparel 50%
Toys and Games 46%
Shoes 43%
Other Consumer Electronics (TVs, gaming devices, cameras, etc.) 43%
Computers 42%
Small Home Appliances 39%
This study reveals that boutique-in-a-box e-commerce (also known as curation services) is an emerging personalization tactic. Online
subscription services are already adopted by 58% of online shoppers and 38% say they would consider enrolling. The adoption rates are
higher for Millennials.
One in Three Start Their Search Directly Through a Retailers’ Channel
In order to find products of interest, many consumers begin their search for products through a search engine (23%) or by visiting a
shopping website, such as Buscapé or Mercado Livre (17%). Retailers’ channels account for a third of product searches via onsite
browsing (13%), in-store visits (12%), or catalog shopping and promotional circulars (8%).
©2015 United Parcel Service of America, Inc. 9UPS Pulse of the Online Shopper™ | A UPS White Paper | March 2015 | U.S. Study
Desktops/Laptops Are Still the Preferred Method for Online Researching and Buying
Consumer preference for researching and purchasing products remains online via desktop or laptop. With greater device adoption and
improved mobile-centric presentation, a shift to mobile purchasing will likely follow suit. This pattern is similar to the gradual adoption
online shopping that transpired during the early years of e-commerce.
Figure 1: Preferred Method of Access to Multi-Channel Retailers (n=1,070)
RB1. Thinking of your favorite retailer that has both physical stores and an online presence (i.e., website or mobile application), what channel do you prefer for researching and purchasing products?
Regardless of where online shoppers research, 65% prefer to buy online. Convenience is a driving force, so delivery is often a better fit.
In other circumstances, consumers need to literally touch and feel or try on the goods. Thus, it’s not surprising to see that many shoppers
will typically visit the store, and mobile may in fact be accelerating this behavior shift. This includes accessing store information – from
directions to store hours, checking inventory and even reserving products prior to their store visits. Among the avid online shoppers
surveyed in this study 44% of their purchases are made in stores. However, consumers who researched in store and then purchased
online, cited finding better prices online and the ability to do additional research as the top reasons for purchasing online.
Figure 2: Preferred Method of Purchase (n=1,070) Avg. Chip Allocation Out of 100
RB6. Thinking of all the purchases that you make, both online and in stores, how often do you purchase in the following ways?
©2015 United Parcel Service of America, Inc. 10UPS Pulse of the Online Shopper™ | A UPS White Paper | March 2015 | U.S. Study
Ship-to-Store Assumes Vital Role in Omnichannel Success
Over a third of consumers who purchase items online have opted to ship to store for pickup at some point, according to results of this
study. These store visits are valuable, as four in five consumers have made additional purchases during those trips. Mobile also plays a
role in facilitating these on-the-go purchases, and retailers must be in a position to accommodate consumers in every way possible. While
some retailers were pioneers in cross-channel capabilities, long-term infrastructure is needed to make important inventory and logistics
decisions.
B. Mobile’s Emerging Impact
Although the region poses challenges in the form of infrastructure issues with delivery, payments and broadband connectivity, Latin
America offers plenty of room for growth and brand-building opportunities for foreign web merchants. In fact, e-commerce growth in Latin
America is second only to the pace of growth in China—the 2014 Latin America 500 web merchants collectively grew their online retail
sales 22.8% in 2013 to $17.94 billion from $14.61 billion.2
In Brazil alone, Latin America's largest economy, e-commerce grew 28% to $12.82 billion in 2013 from $10.02 billion in 2012, according to
Brazilian e-commerce and information technology research firm eBit. Brazil's 10 largest e-retailers—B2W Digital, Cnova, Wal-Mart Latin
America, Netshoes, Máquina de Vendas, Magazine Luiza SA, Sariva e Siciliano SA, Fast Shop, TaQi and Dafiti BR—generated combined
sales of $7.99 billion in 2013, up 23% from $6.50 billion, according to the Latin America 500 data.
In m-commerce, sales had a significant increase in the total e-commerce share in the first six months of this year, going from 3.8%
(June/2013) to 7% (June/2014), which represented an 84% growth rate in one year. E-bit ́s forecast is to get close to 10% in December
/2014. Revenue from transactions conducted through mobile devices in Brazil more than doubled compared to the same period in 2013,
with R$ 1.13 billion in sales-compared to the R$ 560 million last year, a 102% variation. From January to June 2013, 1.278 million orders,
which during this same period in 2014 reached 2,890 million. The average ticket, however, was reduced by 11% registered as
R$ 391, in this same comparison.
Consumers Accelerate Mobile Behavior and Retailers Reap Rewards
The desktop/laptop still reigns supreme when it comes to online purchases, although 40% of smartphone and 38% of tablet users have
also made purchases on those devices.
2 http://img.ebit.com.br/webshoppers/pdf/30_report_webshoppers.pdf
©2015 United Parcel Service of America, Inc. 11UPS Pulse of the Online Shopper™ | A UPS White Paper | March 2015 | U.S. Study
Mobile Device Usage Is Multi-Dimensional
Mobile behavior occurs in all stages of shopping. On a weekly basis, 57% of users are tracking packages, 49% are researching products
prior to store visits, and 47% are taking advantage of in-store research to make those trips more productive. Mobile has also served as a
conduit to connect shoppers to retail stores, as 44% are seeking out store location information or checking inventory to select their store of
choice. The role of email should not be underestimated, as 46% of consumers made a purchase after opening a retailer’s email on a
mobile phone.
Figure 3: Frequency of Mobile Activities - Weekly (n=888)
MOB2. Thinking about the last three months, how often did you do each of the following via a mobile device (e.g. Smartphone or tablet)?
Retailers must ensure that email renders properly on all mobile devices to capture this traffic. Consumers are posting reviews (43%) and
contacting customer support (34%) on mobile devices on a weekly basis as well. Expect mobile engagement for customer service and
social media to grow even more as shoppers become more comfortable with mobile access.
Shoppers Embrace Mobile Wallet Activities
Paying bills (43%), scanning QR barcodes (38%), purchasing tickets (37%), couponing (33%), along with storing loyalty cards (33%), and
storing gift cards (32%), and payments in store (30%) are catching on for smartphone users. And many consumers are open to
considering such activities in the future.
©2015 United Parcel Service of America, Inc. 12UPS Pulse of the Online Shopper™ | A UPS White Paper | March 2015 | U.S. Study
Figure 4: Smartphone Activities Conducted Among Smartphone Users (n=816)
MOB5. Which of the following capabilities do you currently use or would you consider using your smartphone for?
Retail App Usage Lowers Abandonment Propensity
Six in ten smartphone/tablet owners take advantage of retailer mobile apps. A majority of consumers (93%) still comparison shop when
using retailers’ apps; however, for a third it reduces the frequency to do so compared to when shopping within a web browser. Of those
who use retailers’ mobile apps, 46% say they want to get up-to-date information and 39% say they want to be able to make purchases at
a retailer’s store using their smartphone. The notion of being a click away from any site is not as true with apps, given the selection of
retailer apps may be relatively limited. Additionally, shoppers who have chosen the retailer app route may be mission-driven with defined
retailer preferences and less likely to abandon their cart.
Early Stage Mobile Faces Challenges and Leads Some to Continue Shopping via PC
First and foremost, information is necessary to complete any purchase, and this includes both imagery and product details. The top
reason (39%) consumers move away from mobile is that the image of the product is simply not clear or large enough, so they lack
confidence to complete their purchase. Retailers have work to do to ensure that the imagery they present is device-appropriate and that
the product descriptions and details are ample and well displayed for all devices. Both of these reasons make it difficult to compare
products, pushing consumers to seek other options.
©2015 United Parcel Service of America, Inc. 13UPS Pulse of the Online Shopper™ | A UPS White Paper | March 2015 | U.S. Study
Figure 5: Reasons for Shopping on Computer vs. Mobile Device (n=450)
MOB1. What reasons lead you to shop on a desktop or laptop instead of on a mobile device (smartphone or tablet)? Please select all that apply.
Consumers Prefer Using a Retailer’s Full Website Even When Shopping on Smartphones and Tablets
Consumers prefer viewing a retailer’s full website when given a choice. Shoppers in this survey are clearly signaling to retailers here that
the mobile customer experience is not up to the quality of a full website. The inability to zoom in on photos on a mobile website or app
may also lead to consumer preference for the full website. The trend also extends to tablet users, as 61% prefer the full website. Further,
half of consumers who do not use retailers’ apps don’t use them because they prefer the full website better (54%).
Figure 6: Preferred Method of Shopping by Device, Among Consumers Who Made a Purchase on a Mobile Device
MOB3. When shopping on your smartphone or tablet, from which format do you prefer to purchase? Please select one option per device.
©2015 United Parcel Service of America, Inc. 14UPS Pulse of the Online Shopper™ | A UPS White Paper | March 2015 | U.S. Study
C. Changing Store Dynamics
Channels are converging and mobile has a unique ability to serve shoppers who are researching products. In fact, 9 out of 10 smartphone
owners use them in store to expand shopping capabilities. Becoming better informed is the driving force for in-store usage, and savvy
consumers are taking advantage of the ability to secure the right information prior to purchasing. The price-conscious nature of the on-the-
go flex shopper is revealed, as 48% report that they compare prices on their mobile phones while in store. To ensure making the right
selection, 42% are reading product details and 41% are reading reviews and feedback from their peers while in store. Beyond that, just
under one in four is calling, emailing or texting friends for further product approval. The impact of one-fourth of online shoppers reaching
out in this way carries exponential value into their networks. Shoppers also report searching for specific products as well as alternatives to
those products in consideration (25%) and one in five have placed an order in store to be shipped to them.
Figure 7: Use of Smartphone In-Store, Among Smartphone Users (n=816)
MOB4. When shopping in retail stores, how do you use your smartphone? Please select all that apply
Retailers Begin to Leverage Mobile to Enhance Store Shopping
Technology enhancements frequently make for superior experiences, and retailers are taking notice. Checkout was first to get the
attention of consumers, with many taking advantage of grocery self-checkout. They are now gravitating to the same option at other
retailers (38%). Mobile adoption is growing, as a third prefer checkout out through their smartphone or tablet. A fifth of consumers still
desire a personal touch in stores.
Figure 8: Preferred Method of Purchase (n=1,070)
RB8. When shopping in a retail store, assuming all of the following are available to you, how would you prefer to complete your purchase?
Consumers Find New Technologies That Bring Customized and Personalized Online Shopping Benefits to the Store Appealing
©2015 United Parcel Service of America, Inc. 15UPS Pulse of the Online Shopper™ | A UPS White Paper | March 2015 | U.S. Study
Almost two in three consumers find the ability to purchases items in a window display for same day delivery appealing. Almost six in ten
find electronic shelf labels appealing, reinforcing in-store phone usage tendencies, noted elsewhere in this study. Similar numbers want
electronic receipts. The notion of self-service takes on a new twist, as consumers already find appeal in controlling the shopping
experience by being able to use a kiosk to order out of stock products, interact via touch screen or checkout via a roaming associate.
Figure 9: Appeal of Shopping Conveniences and Capabilities (n=1,070)
FUT6. Technology is making advances in how we shop. On a scale of 1 to 7, how appealing are the following conveniences or in-store capabilities with “1” being Not at all appealing and “7” being Very Appealing?
D. Social Exerts Influence
It has been challenging for retailers to directly link social media exposure to product buying decisions. While consumers say that they are
influenced by what they see on social media sites, the non-linear buying journey of the flex shopper makes it difficult to attribute the
purchase to social media exposure. It is also important to remember that this consumer social behavior is first and foremost about
communication. Therefore, it is significant to note the influence uncovered by this study.
Majority of Online Shoppers Use Social Media to Make Purchase Decisions
©2015 United Parcel Service of America, Inc. 16UPS Pulse of the Online Shopper™ | A UPS White Paper | March 2015 | U.S. Study
When asked in the survey, five in six of all shoppers said their purchases are influenced by social networks. This points to a growing
influence of social media on retail in the future. The dominant network is Facebook, where 92% of the online shoppers surveyed
participate and 65% of those surveyed cite Facebook as influencing their purchase decisions. The next closest network is Google+/Orkut,
embraced by 68% of respondents for general use and 35% cite it as influencing their purchase decisions. Though their number is
significantly lower, Instagram may have an accelerated importance in the future for retailers, given their visual approach.
Figure 10: Social Media Usage (n=1,070)
SM1. Do you use any of the following social networking sites? Please select all that apply.
Social Media Extends Reach via Viral Means
Over three-fourths of Facebook users have “liked” a retailer and two in three pay a lot of attention to retailer updates.
This additional influence may be significant, as viral reach results from information sharing with friends and family, particularly among
younger segments.
Almost three-fourths of consumers who are happy with their purchase are very likely to promote that purchase on social media
(Figure 11), primarily on Facebook and then Twitter (Figure 12). Google disabled Orkut on September 30. These users can export table
data, communities and photos using the Google Takeout tool until September 2016.
©2015 United Parcel Service of America, Inc. 17UPS Pulse of the Online Shopper™ | A UPS White Paper | March 2015 | U.S. Study
Figure 11: Likelihood to Promote a Brand/Product on Figure 12: Social Medium Chosen to Promote Brand/Product
Social Media When Satisfied with Purchase (n=1,021) Among Shoppers Likely to Use Social Media to Promote
Brand/Product (n=901)
SM5. When satisfied with a brand or product you have purchased, how likely are you to promote the brand or product via social media?
SM6. Which social media site would you choose to promote a brand or product? Please select all that apply.
One in Five Consumers Complains via Social Media If Dissatisfied with a Purchase
Shopper dissatisfaction most often comes in the form of poor word of mouth to friends and family (69%). Over six in ten are likely to email
or call a company for a refund/complaint. While social media can be powerful when used by satisfied consumers, it is also be used by
dissatisfied customers. Half will complain on social media and/or post a photo on social media. Four in ten consumers will do nothing,
but will not purchase again. Retailers need to be even more vigilant and aggressive in addressing shopper concerns, always being
cognizant of how one’s brand is being portrayed.
Figure 13: Likelihood in Taking the Following Actions When Dissatisfied with a Purchase (n=1,070)
SM7. When you are not satisfied with a brand or product you have purchased, how likely are you to respond in any of the following ways?
©2015 United Parcel Service of America, Inc. 18UPS Pulse of the Online Shopper™ | A UPS White Paper | March 2015 | U.S. Study
RETAIL WATCH: THE RETAIL LANDSCAPE
The following suggestions should be assessed in the context of one’s business and adopted as appropriate.
MOBILE
Leverage responsive site design to deliver a mobile-optimized experience
Make sure emails render properly on all mobile devices
Define the optimal user experience for mobile and build a roadmap to achieve those goals
Review imagery needs and upgrade to ensure customers gain a clear view of the product to facilitate decision-
making
Evaluate the role of apps for your business
STORES
For store-based retailers, explore the technology that can be deployed to educate, inspire and service the shopper in
store
Allow shoppers to have choice in receipts (electronic, paper or both)
Utilize product locators online and in store to find inventory and deliver it to the customer
Be forward-thinking with POS (point of sale) systems and evaluate mobile tools
SOCIAL
Be creative in your marketing strategies to grow your social channels and utilize them to market, message and
merchandise to your fans
Monitor social media for both positive feedback and complaints and respond in a timely fashion
Encourage consumers to “like” your brand through onsite placement and extended marketing efforts
Reward those who “like” your brand with deals and offers
©2015 United Parcel Service of America, Inc. 19UPS Pulse of the Online Shopper™ | A UPS White Paper | March 2015 | U.S. Study
III. The Path to Purchase: Expectations and Satisfaction
A. The Shopper and Their Mindset
The Flex Shopper Covets Control and Convenience When Making Choices
Based on consumer expectations, retailers need to deliver exemplary customer experiences throughout the shopping journey (pre-
purchase, purchase and post-purchase) to achieve superior levels of satisfaction, and logistics are an important part of that foundation.
Satisfying today’s demanding shopper is no small feat and successful retailers have learned, often through trial and error, how to provide
the desired level of services sought by shoppers. Over the years, much research has been done around what is now coined
“omnichannel,” where the value of a shopper who uses multiple channels is exponentially greater.
Flex Shopper Demands Direct Retail Initiatives
In order to frame what’s important to individual shoppers, elements of the research have been summarized in the following
at-a-glance table.
Flex Shopper Demands Research Findings
Convenience 66% of shoppers are satisfied with access to customer service information within the
checkout experience
63% are satisfied with the ability to find a customer service phone number or other contact
option during search/browse phase of the shopping experience
58% are satisfied with the availability of live chat to ask a question
68% of customers rank storing profile information (name, address, preferences) important
when checking out online
22% of shoppers want to see a return label in the box
Among consumers who review returns polices before purchasing, 72% would be likely to
complete their purchase if free store returns were in place or a free pre-paid label was
provided by the retailer
62% of consumers are satisfied with the ease of actually making the return and 65% are
satisfied with the clarity of policies which is important to convenience
61% are satisfied with the flexibility post-shipment to choose another delivery date and
63% with the ability to reroute a package
Efficiency and Delivery speed was the second most important factor when comparing retailers prior to
selecting where to shop – behind retailer reputation, but before product information,
Communications consumer/peer reviews and return policy
56% of shoppers prefer to see the number of days to arrive in the cart
74% of shoppers have abandoned a cart due to lengthy delivery times or no date provided
42% of shoppers report that customer satisfaction post-delivery hinges on whether the
items were delivered on time
The Right Information 52% of shoppers find ratings and reviews about products they want to buy helpful
When comparing retailers where they might make a purchase, consumers value retailer
reputation (top choice), delivery speed and product information and photos
97% of shoppers will review the return policy and 67% will do so before purchasing
Personalized Shopping 47% of shoppers find appeal in having a store associate recommend products based on
smartphone data about products purchased in the past
Only 60% are happy with the ability to save purchase history and personal information as
part of the search/browse experience
46% find having retailers use their personal information to send offers influential on the
likelihood to shop with a retailer
40% of shoppers appreciate seeing recommendations on screen for items based on listed
preferences while 37% enjoy seeing those purchased by others
When checking out online, 55% find it important for retailers to “remember them” by saving
items already added to the cart and order information previously selected during an
abandoned shopping session
©2015 United Parcel Service of America, Inc. 20UPS Pulse of the Online Shopper™ | A UPS White Paper | March 2015 | U.S. Study
B. Pre-Shopping: Search and Browse
Customer Satisfaction Scores Significantly Higher Online
This survey reflects the views of omnichannel shoppers – those who shop online and in store. In fact, cumulatively they report having
made over half of recent purchases in store. Having the benefit of both online and in-store shopping experiences, 81% of all shoppers
expressed satisfaction with the online shopping experience, while 62% were satisfied with in-store shopping. Consumers continue to
gravitate towards non-store channels while expecting stores to evolve to meet their needs by integrating with online channels.
Product Information and Search Tools Power Productive Shopping
Shoppers were directed to share the factors that are important to them when searching for products. They were asked to allocate 100
chips based on the value they placed on each item. Retailer reputation topped the list and Figure14 reflects research findings that show
delivery speed, detailed information, influence of peer reviews and a focus on return policies are recurring themes.
Access to detailed information extends through the purchase journey, where detailed product information and photos is more important
than product selection. Consumers express that they won’t have the confidence they need to complete the sale without such information.
The retailer reputation remains paramount to completing the sale as well. These factors show that brand-, logistic- and front-end focused
factors all play a role when comparison shopping.
Figure 14: Considerations When Comparison Shopping Avg. Chip Allocation Out of 100 (n=1,070)
RB5. Thinking of factors you might take into consideration when searching for products (excluding product cost and shipping fees), how likely are you to consider each of the following factors.
Satisfaction is reasonably high overall for shoppers as they search and browse online (Figure 15). The highest satisfaction is with the
ability to find products, followed by product assortment. Those include everything from on-site search, customer reviews, product details
and personal profiling, along with customer service aspects of the shopping experience. While all factors show relatively high satisfaction,
there is opportunity to improve satisfaction with finding a retailers’ return policy, finding customer service contact information and the
availability to live chat.
©2015 United Parcel Service of America, Inc. 21UPS Pulse of the Online Shopper™ | A UPS White Paper | March 2015 | U.S. Study
Figure 15: Satisfaction With Aspects of the Search/Browsing Experience Online (n=1,070)
RB3. How satisfied are you with each of the following aspects of your search/browsing experience when shopping online? Please indicate your satisfaction on a scale of 1-7, where “1” is
Not At All Satisfied and “7” is Extremely Satisfied.
Factors Beyond Product Information, (Particularly Privacy) Impact Buyer Behavior
When selecting retailers to do business with, consumers often look beyond shopping-related elements and other values come into play.
“Privacy protection” is the top non-product influencer (72%) in consumers’ likelihood to shop with a retailer, closely followed by their track
record on fraud protection (69%). Commitment to social responsibility (56%) and providing sustainable products or packaging (55%) were
also highly rated.
Despite the turmoil that has taken place and the media attention to retail security breaches, the level of trust in online shopping has
increased for 65% of shoppers and remained the same for most others (32%). Few (3%) have had decreased trust in online shopping in
the past year.
Loyalty Lures Shoppers Where Savings and Access Spur Participation
This study reveals that the majority of online shoppers participate in retailer loyalty programs (89%). Among participants in loyalty
programs, shoppers most value savings, free shipping, or free products, gift certificates or cashback. From a savings perspective, 57%
favor product discounts, 53% prefer free shipping and free products, gift certificates, or cash back based on purchase frequency exerts
strong appeal (47%). Status, acknowledgement and/or customization based on preferences have low levels of appeal.
©2015 United Parcel Service of America, Inc. 22UPS Pulse of the Online Shopper™ | A UPS White Paper | March 2015 | U.S. Study
Figure 16: Rewards and Benefits Valued Most from Loyalty Programs Among Participants of Loyalty Programs (n=951)
LOYAL2. Which of the following types of rewards and benefits do you value most from a loyalty program? Please select up to five options.
©2015 United Parcel Service of America, Inc. 23UPS Pulse of the Online Shopper™ | A UPS White Paper | March 2015 | U.S. Study
RETAIL WATCH: SEARCH AND BROWSE
Much of the initial shopping time is spent searching and browsing, so consider these tips to help capture shoppers in the early stages of
their path to purchase.
Invest in photography with zoom capability and create copy with complete product information for both PC and mobile
channels
Integrate peer-based ratings/reviews within the shopping journey
Evaluate if a loyalty program is right for your brand and if so how best to build and market
Ensure your website is easy to search and suggests other products to buy based on consumer preferences or what
other consumers purchased
Ensure your contact information, including hours of operation, ways to contact customer service and your return
policy are accessible via the home page and checkout page as part of a one-stop customer service destination
Embrace touch points that are in line with shopper interest, such as live chat to solve problems quickly and efficiently
C. Checkout and General Shipping Preferences
Checkout Satisfaction Centers on Efficiency and Transparency
It is essential in today’s competitive landscape that checkout is quick and easy. Overall consumer satisfaction in the shopper experience is
relatively high. Consumers are most satisfied by the availability of alternative payment options, free shipping and the transparency of
expected delivery dates and inventory, and an ease of checkout (facilitated by one- and two-click checkout). Two in three shoppers are
satisfied with access to customer service information at checkout.
Figure 17: Satisfaction With Aspects of Purchase Experience (n=1,070)
Q10. Overall, how satisfied are you with your previous online purchasing experiences in the past three months?
CHECK1. How satisfied are you with each of the following aspects of your checkout experience when shopping online?
Cross-Device, Cross-Channel Profile Information a Plus
©2015 United Parcel Service of America, Inc. 24UPS Pulse of the Online Shopper™ | A UPS White Paper | March 2015 | U.S. Study
When checking out online, multiple payment options and free shipping options are most important to consumers. Over half find it
important for the retailer to “remember me” by saving items already added to the cart, including order information previously selected
during an abandoned shopping session. As mobile plays an increasingly important role in omnichannel shopping, transferring a
customer’s cart and profile information across channels becomes more valuable.
Figure 18: Importance of Options When Checking Out Online (n=1,070)
CHECK2. What information or options are most important to you when going through an online check-out process
92% of Shoppers Take Action to Quality for Free Shipping
Eight in ten consumers feel that free shipping is an important factor when making a purchase online, and shoppers will go to great lengths
for free shipping, as seen in Figure 19. Placing additional items in the cart is the most common action taken to qualify for free shipping, as
37% of consumers stated they have done this. A best practice is for retailers to prompt shoppers to add to their carts by showing the
incremental spend needed to meet the free shipping threshold.
Searching for a promo code online (34%) or joining a loyalty program to quality for free shipping (32%) were also common. Retailers
should evaluate how to position these promo codes from on-site to third party aggregators of coupons and other affiliate models. 26%
have chosen “ship-to-store” as a means to avoid paying shipping costs, which often benefits retailers since additional products are often
purchased while in store. A quarter chose to purchase a more expensive product or selected the slowest transit times to qualify for free
shipping.
©2015 United Parcel Service of America, Inc. 25UPS Pulse of the Online Shopper™ | A UPS White Paper | March 2015 | U.S. Study
Figure 19: Actions Taken to Qualify for Free Shipping (n=1,070)
CHECK3. How important is free shipping when you are making a purchase online?
CHECK4. Which of the following actions, if any, have you taken in order to qualify for free shipping? Please select all that apply.
Cart Abandonment Driven by Total Purchase Cost
Eight in ten consumers have abandoned a cart. Of those, almost six in then have said that shipping costs have made the purchase cost
more than expected. However, of those the majority say they were not ready to purchase anyway. Consumers are seeking easy to find
information about total purchase costs, including all delivery fees. Today’s flex shopper is frequently in browse mode, searching for
products when there is spare time throughout their busy day. To keep track of products they will consider buying, many use the cart like a
wish list, so many carts do not turn into conversions. Of those who have indicated they have abandoned a cart in the past, one in two
shoppers stated they have done so because their preferred payment option was not offered. Over four in ten also said that the checkout
process was too long or too confusing.
Figure 20: Reasons for Abandoning Shopping Cart (n=876)
CHECK12. When shopping online, have you ever placed items in the cart or basket but then left the site without making a purchase? Choice in
CHECK13. When shopping online, have you ever placed items in the shopping cart or basket but then left the site without making a purchase? Please select all that apply.
Delivery
©2015 United Parcel Service of America, Inc. 26UPS Pulse of the Online Shopper™ | A UPS White Paper | March 2015 | U.S. Study
Options and Clarity of Timing are Optimal when Shoppers Contemplate Purchases
According to survey results, while most consumers expect to see a range of shipping options (from same day to economy ground), they
still select economy ground a quarter of the time.
Figure 21: Expected and Most Often Selected Shipping Options for Brazil-based Retailers (n=1,070)
CHECK5. When shopping online, which of the following shipping options do you expect online retailers to offer for each of the following zones? Please select all that apply.
CHECK6. When shopping online, how often do you choose each of the following delivery options for each of the following zones?
Consumers Will Trade Longer Delivery Times in Exchange For Free Shipping
On average, consumers are willing to wait about 8 days for their online purchases. Over seven in ten are willing to wait 5 or more days for
delivery (Figure 22). There are two steep drop offs in the percentage of customers willing to wait – one after five days and another after
seven.
Free shipping again adds an interesting twist into the shipping equation, as shoppers clearly are willing to make trade-offs in the hope of
spending less. In fact, 86% of consumers are willing to wait an additional two days or more for their packages to arrive to receive free
shipping (Figure 23). Consequently, retailers may have a wider window to get their products to consumers than is perceived in the
marketplace. Patience with shipping times is also dependent on the type of product sold. For example, retailers selling commodity goods
that are readily available at local retailers may want to deliver quicker, while others that sell proprietary goods may have more leeway with
their delivery times.
Figure 22: Days Willing to Wait for Domestic Purchases (n=1,058)
CHECK9. What is the number of days that you are usually willing to wait for most of your online purchases from point of purchase to delivery from each of the zones below?
©2015 United Parcel Service of America, Inc. 27UPS Pulse of the Online Shopper™ | A UPS White Paper | March 2015 | U.S. Study
Figure 23: Additional Days Willing to Wait for Free Shipping for Domestic Purchases (n=1,034)
CHECK10. How many additional days are you usually willing to wait to receive free shipping from each of the zones below?
Long Delivery Estimates Cause Cart Abandonment
Despite indications that shoppers are willing to wait, retailers have to balance this with cart abandonment stats. Three in four shoppers
have abandoned a purchase due to lengthy delivery times or no date provided at checkout. That abandonment most often occurred when
estimated delivery times exceeded five days. Not providing a specific delivery date appears to be the surest way to lose sales.
Figure 24: Estimated Delivery Time That Resulted in Purchase Abandonment (n=787)
CHECK14. Have you ever decided not to make a purchase because the estimated time when you would receive your item(s) was too long or not provided?
CHECK15. What was the estimated delivery time (in days) from purchase that caused you not to make your purchase?
Customer Service Information Is Critical to Retailer Selection
©2015 United Parcel Service of America, Inc. 28UPS Pulse of the Online Shopper™ | A UPS White Paper | March 2015 | U.S. Study
There are typically choices to be made, as many retailers sell similar products. Reading the fine print is on the minds of today’s savvy
shoppers. 97% of shoppers review these policies and 67% do so before making a purchase, which may influence which merchant will
secure the sale.
Cost and Convenience Are the Top Returns Factors Influencing Purchase Decisions
Lost sales may result from inflexible returns policies. Shoppers favor options to return product to the store for free or shipping it back with
a convenient pre-paid label supplied by the retailer. When it comes to having to pay for return shipping, less than half (45%) are likely to
complete the transaction. Further, consumers find not being able to return in store as inhibitive. One in three will not complete a sale if
they cannot return it in store even with a free prepaid label to ship it back to the retailer and 50% will not convert if they cannot return to
store and must pay for the return shopping. For multi-channel retailers, acceptance of returns in the store not only is customer-centric but
often results in incremental sales.
Figure 25: A Return Policy’s Impact on Purchase Intent, Among Consumers Who Review Retailers’ Return Policy
Before Purchasing (n=709)
RET3. You indicated that you look at an online retailer’s return policy before purchasing an item. Thinking of what you look for in a retailer’s return policy, would you complete the sale online if the
retailer’s “return policy” stated the following?
Shoppers Are Divided Between Waiting and Turning to Competitors When Items Are Out of Stock
Stock-outs are a challenge for retailers across many product categories. The real danger with stock-outs is that 45% of consumers go to a
competitor’s website or app and 25% go to a competitor’s physical store to find the same or similar product. This equates not only to lost
sales today, but could also result in missed sales opportunities in the future if a competitor is able to win them over. Surprisingly, many
consumers are patient when faced with a stock-out. Some 39% of consumers will sign up for an alert and 37% will check the website at a
later time to see if the stock status has changed, and 25% are even willing to make a trip to the retailer’s physical store.
©2015 United Parcel Service of America, Inc. 29UPS Pulse of the Online Shopper™ | A UPS White Paper | March 2015 | U.S. Study
Figure 26: Action Taken When Item is Out of Stock (n=1,070)
RB4. When shopping online and you encounter products that are out of stock or backordered, what is your typical course of action? Please select up to 3 options.
©2015 United Parcel Service of America, Inc. 30UPS Pulse of the Online Shopper™ | A UPS White Paper | March 2015 | U.S. Study
RETAIL WATCH: CHECKOUT AND GENERAL
SHIPPING PREFERENCES
The final step in the process is integral to securing the sale, so careful consideration in customer service and policies at this juncture are
advisable.
CUSTOMER SERVICE
Review return policies for clarity and access throughout the site and via post-order communication
Integrate “Shop with Confidence” messaging within the all-important shopping cart that includes phone number,
return policies and contact touch points
Highlight contact phone numbers and links to touch points like live chat onsite
SHIPPING
Show total shipping costs early in the process based on the customer’s location
Offer choices in terms of shipping options to accommodate shopper needs
Show shoppers the number of days for delivery to arrive in the shopping cart (i.e. five business days)
Invest in logistics to provide faster, more efficient options
FREE SHIPPING
Understand the patterns that matter and how long shoppers are willing to wait for free shipping
Monitor your free shipping model and understand time frames to receive products while staying keenly aware of the
competitive landscape
Assess whether you can absorb these costs as a marketing expense and what strategies will be put in place to
preserve desired margin yet still remain competitive
RETURNS
Reread your current returns policy to ensure it is clear, concise and customer-centric
Position the policy in your customer service page as well as in the shopping cart to avert abandonment
Assess whether supporting free returns is viable where retailers cover the cost of shipping the product back
Consider including a return label in the box, or at a minimum make it convenient for shoppers to print a return label
right from your website
STOCK-OUTS
Make shoppers aware of the status of products at both the product page and shopping cart junctures
Put in place tools such as email when stock comes available to capture the sale
Invest in smart inventory and fulfillment strategies to minimize stock-outs
©2015 United Parcel Service of America, Inc. 31UPS Pulse of the Online Shopper™ | A UPS White Paper | March 2015 | U.S. Study
D. Delivery and the Post-Purchase Experience
Alternate Delivery Locations are the Preferred Place of Delivery for 45% of Packages
Consumers in Brazil prefer to have over four in ten of their online orders delivered to non-residential locations (e.g. The UPS Store, USPS
office, grocery store, delivery locker, their workplace and to the retailer’s store). Given that some of these options aren’t currently
available in Brazil, consumers are demonstrating a demand for more convenient delivery options.
Figure 27: Preference in Delivery Location Avg. Chip Allocation Out of 100 (n=1,070)
Only Half of Shoppers Are Satisfied with the Ease of Product Returns
DEL1. Which of the following locations do you prefer your online orders be delivered to?
Once the “submit order” button is selected, there are many post-purchase aspects that come into play. While satisfaction is high for emails
confirming delivery and the ability to track purchases, other aspects remain challenging in the consumer’s mind. The lack of delivery
options also can negatively impact the post-purchase experience as well, where lower satisfaction stems from lack of flexibility to re-route
Figure 28: Satisfaction With Aspects of the Post-Purchase (n=1,070)
packages or the ability to alter delivery dates once a
delivery is en route.
TRACK1. How satisfied are you with each of the following aspects of the post-purchase experience when shopping online?
©2015 United Parcel Service of America, Inc. 32UPS Pulse of the Online Shopper™ | A UPS White Paper | March 2015 | U.S. Study
Four in Ten Shoppers Report That Customer Satisfaction Post-Delivery Hinges on Timely Delivery
Receiving a high quality product and getting a good value are intrinsic expectations that come with shopping, so it’s important to look
beyond the basics. The most selected factor was whether or not the item was delivered on time. One in three consumers feels more
satisfied when a warranty is in place to protect them. Other forms of protection also include the wrapping and care the retailer takes to
ensure the package arrives in good condition (28%). On a side note, it never hurts to surprise the shopper as 22% enjoyed receiving a
free gift or sample with their purchase. Retailers will be rewarded as 65% of all consumers surveyed have purchased additional items
from a seller based on coupons or samples included in their package.
Figure 29: Factors that Influence Customer Satisfaction – Post Delivery
Among Consumers Who Have Returned Products Bought Online (n=528)
Shoppers Desire Flexibility in Delivery Service Options
Setting delivery expectations and giving consumers control is important. Receiving email or text delivery alerts with approximate time
of delivery tops the list for 37% of shoppers. One in five would prefer being able to pre-authorize a delivery when not at home. With
consumers
RET9. Which of the following factors most influence how satisfied you are after you receive your purchase? Please select all that apply. continually on the go
and for those living in apartments, condos and some urban locations, these types of conveniences go a long way towards influencing
satisfaction.
©2015 United Parcel Service of America, Inc. 33UPS Pulse of the Online Shopper™ | A UPS White Paper | March 2015 | U.S. Study
Figure 30: Preferred Delivery Service Convenience Options (n=1,070)
FLEX1. When waiting for your purchase, which service would you find most convenient?
Free Returns and Quick Turnaround on Product Exchanges Influence Positive Returns Experience
Almost half of shoppers say that free shipping on returns created a positive returns experience. They also are aware of the length of
time it takes to exchange items, get products to a delivery company and refund their goods, so “quick and easy” sums up post-purchase
expectations.
Figure 31: Elements of the best returns experience Among Consumers Who Have Returned Products Bought Online (n=528)
RET6. Thinking of the best return experience that you have had, what elements were included as part of this experience? Please select all that apply.
©2015 United Parcel Service of America, Inc. 34You can also read