2019 Community Health Needs Assessment and 2020 - 2022 Community Health Implementation Plan - Rush ...
←
→
Page content transcription
If your browser does not render page correctly, please read the page content below

2019 Community Health Needs Assessment and
2020 – 2022 Community Health Implementation Plan
Where we’ve been...
  Where we are today...
            And what’s next
Table of Contents
Letter from Rush leaders                                        2

Where we’ve been: A progress report                             4

Where we are today: The 2019 Rush University Medical Center    10
and Rush Oak Park Hospital Community Health Needs Assessment

Neighborhood profiles
  Austin                                                       16
  East Garfield Park                                           18
  Forest Park                                                  20
  Humboldt Park                                                22
  Lower West Side                                              24
  Near West Side                                               26
  North Lawndale                                               28
  Oak Park                                                     30
  River Forest                                                 32
  South Lawndale                                               34
  West Garfield Park                                           36
  West Town                                                    38

What’s next: The 2020–2022 Community Health                    40
Implementation Plan (CHIP)

Appendix 1: IRS Form 990, Schedule H Compliance                44

Appendix 2: Existing health care facilities and resources      45
within the community

Appendix 3: 2020–2022 CHIP at a glance                         47

Appendix 4: CHNA and CHIP collaborators                        49
Where you live makes a lot of
    difference to your health.
    A baby born today near Rush Oak Park Hospital is likely to live
    to be 82 years old. In Aurora near Rush Copley Medical Center,
    life expectancy is 81 years. But in West Garfield Park, near Rush
    University Medical Center, life expectancy is just 70 years.
    These disparities reinforce the fact that where you live, work
                                                                             Race, racism and
    and play can influence how long you live.                                health equity
                                           West
      Aurora                   Oak Park Garfield Park               Loop

       81                        82           70                    82       Research has shown that the impact of
                                                                             race on health stems largely from differences
                                                                             in access to resources and opportunities
                                                                             that can hurt or enhance health. Additionally,
                                                                             researchers have found that racial and
                                                                             ethnic discrimination can negatively affect
                                                                             health across lifetimes and generations.
                                                                             — The Robert Wood Johnson Foundation

                                                                             The goals and strategies you’ll read
                                                                             about in the following pages show how
                                                                             Rush University Medical Center and
    While violence is often blamed for the disparities in life expectancy,
                                                                             Rush Oak Park Hospital are working
    more than half of the early deaths in under-resourced communities        toward health equity.
    are actually caused by common conditions like heart disease,
    cancer, stroke and diabetes. Morbidity and mortality from these          In many of the West Side neighborhoods
    and other health conditions are more prevalent in people living          near Rush University Medical Center,
    in neighborhoods afflicted by poverty, racism, and lack of access        structural racism is one of the biggest
                                                                             barriers to health equity.
    to health care, educational opportunities and good jobs.
                                                                             Structural racism means the laws, policies
    All of these factors create major obstacles to health equity.
                                                                             and unofficial practices that give advantages
    According to the World Health Organization, health equity is
                                                                             to white people and disadvantage people
    achieved when everyone has a fair opportunity to attain their
                                                                             of color in our society.
    full health potential and no one is prevented from achieving that
    potential. Where there is more equitable access to education,            Structural racism takes many forms.
    jobs, resources and health care, life expectancy gaps are smaller.       Banks’ refusal to approve mortgage loans
                                                                             for homes in black neighborhoods — a
    A hospital’s mission is to help heal people — and that’s why Rush        policy known as “redlining” — prevented
    University System for Health is working to address the social            people who live there from having the
    inequities that contribute to poor health. Health equity is a            same chance at home ownership as

2   Rush CHNA/CHIP 2019–2022
systemwide strategy for achieving Rush’s mission: to improve the
                                                 health of the individuals and diverse communities we serve
                                                 through the integration of outstanding patient care, education,
                                                 research and community partnerships.

                                                 Because inequities are so deeply rooted in our social systems
                                                 and structures, a team approach is required. We are coordinating
                                                 our efforts and resources with other health systems, community
                                                 residents, nonprofit organizations, government agencies and
                                                 faith communities. Rush hospitals are partnering with these
                                                 organizations to have a greater collective impact in our
                                                 communities. In the pages that follow, you’ll read about the
                                                 inequities that exist in our communities and how we are
                                                 addressing them. Instead of simply treating the illnesses that
people in white neighborhoods. Students
                                                 are a result of these inequities, Rush is working to create
of color have less access to top-rated
                                                 healthier communities.
Chicago public schools: A 2018 analysis by
the nonprofit Kids First Chicago showed
that highly ranked schools enroll 45% of         K. Ranga Rama Krishnan, MD
                                                 CEO, Rush University System for Health
the district’s black students, 72% of Latinx
students and 91% of white students (despite      Michael J. Dandorph
the fact that the district is 90% nonwhite).     President, Rush University System for Health

And these are just two examples. People          Sherine Gabriel, MD
                                                 President, Rush University
of color feel the effects of structural
racism everywhere, from employment               Omar B. Lateef, DO
to wealth accumulation, from criminal            CEO, Rush University Medical Center
justice to health care. Ultimately, this
                                                 David Ansell, MD, MPH
affects their health and overall well-being.     Senior Vice President for Community Health Equity,
It also affects where people choose to live:     Rush University Medical Center
Chicago’s black population has declined          Associate Provost for Community Affairs, Rush University
for seven straight years, according to the       Bruce M. Elegant
U.S. Census Bureau.                              President and CEO, Rush Oak Park Hospital

Undoing those effects means working to           Barry C. Finn
reform systems that are hundreds of years        President and CEO, Rush Copley Medical Center
old. It means providing resources and            Susan Crown
opportunities that will help close the gaps      Board chair, Rush University System for Health and
in education, housing, employment, income,       Rush University Medical Center
health care and other areas. And it means
                                                 Gary McCullough
working to heal our communities in ways          Board chair, Rush Oak Park Hospital
that go far beyond just providing health care.
                                                 Bruce Dienst
When everyone has more opportunities             Board chair, Rush Copley Medical Center
to be healthier, everyone in our
community benefits.

                                                                                           Letter From Rush Leaders   3
Where we’ve been: A progress report
    Collaborating more with other health systems was one     • We adopted an Anchor Mission Strategy
    of the biggest changes spurred by Rush’s partnership       that guides how we use our economic power to
    with the Alliance for Health Equity (AHE) in creating      improve health in the communities served by
    our last Community Health Needs Assessment (CHNA):         Rush University Medical Center and Rush Oak
    Health inequities are so deeply rooted in longstanding     Park Hospital. With thousands of employees and
    conditions that one organization alone cannot address      millions of dollars spent on goods and services
    them, so we’re working in partnership with others.         every year, every dollar we spend — on payroll,
    Based on the data we analyzed and the community            medical supplies, construction, catering, donations
    feedback we received, we’ve also made a number of          and more — is an opportunity to support the
    other changes in how we do things at Rush University       community. Our Anchor Mission Strategy work
    Medical Center and Rush Oak Park Hospital.                 means that we do the following:

    • We formed West Side United (WSU) with five               – Hire locally and develop talent
      other health systems and the Illinois Medical            – Use local labor for capital projects
      District, plus community residents, education
                                                               – Buy and source locally
      providers, the faith community, business, government
      and other organizations. By addressing inequality        – Invest locally and create financial stability
      in health care, education, economic vitality and the       for employees
      physical environment, our goal is to reduce the life     – Volunteer and support community-building
      expectancy gap between the Chicago Loop and
      the West Side by 50% by 2030.

4   Rush CHNA/CHIP 2019–2022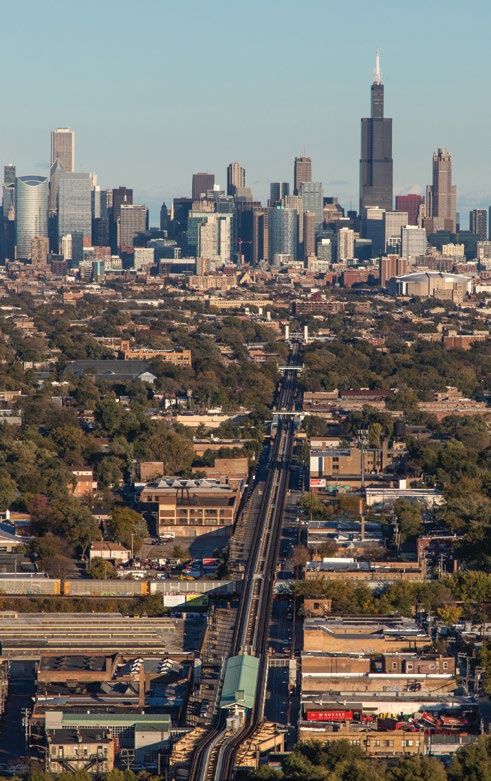
• We helped form the West Side Anchor Committee         • We also heard that many people, particularly
  under the umbrella of WSU, with representatives         immigrants, sometimes fear seeking health care,
  from six West Side health care institutions and         so we created a policy to protect people who
  the Illinois Medical District, that together employ     need care but lack legal permission to be in the
  more than 43,000 people and spend $2.8 billion on       United States. We’ve also submitted comments
  supplies and services each year. Each is adopting       on proposed changes to the federal Public Charge
  its own anchor mission strategy.                        Rule that would affect our community members’
                                                          ability to get access to health care and healthy food.
• Rush University Medical Center is a partner
  in the Chicago HEAL Initiative (HEAL) begun           • We committed to training all Rush leaders in
  by U.S. Sen. Dick Durbin, bringing together 10          cultural competence (the ability to provide care to
  Chicago hospitals to reduce gun violence, heal the      patients with diverse values, beliefs and behaviors)
  physical and mental trauma of violence and create       and implicit bias (unconscious associations that
  economic opportunities in our neighborhoods.            can lead us to evaluate someone negatively on the
                                                          basis of characteristics such as race, gender, ability
• We heard from community residents that we need to
                                                          or sexual orientation).
  be out in the community more, so we’ve added more
  staff to our Office of Community Engagement           • We know that Rush has to think about how
  and Department of Social Work and Community             government policy shapes health care, so we
  Health, enabling us to serve more people.               supported the Tobacco 21 legislation that
                                                          increases the legal age for buying tobacco
                                                          products in Illinois from 18 to 21. Gov. J.B.
                                                          Pritzker signed this bill into law in April 2019.

                                                        In addition to these changes, our 2016 CHNA gave
                                                        rise to the following goals and strategies that made
                                                        up our 2017–2019 Community Health Implementation
                                                        Plan (CHIP). Some of these strategies required
                                                        intensive planning, so they didn’t begin producing
                                                        results immediately, but all of them eventually went
                                                        into effect between fiscal years 2017 and 2019. Here’s a
                                                        look at the impact of that work.

                                                                         Where We’ve Been: A Progress Report       5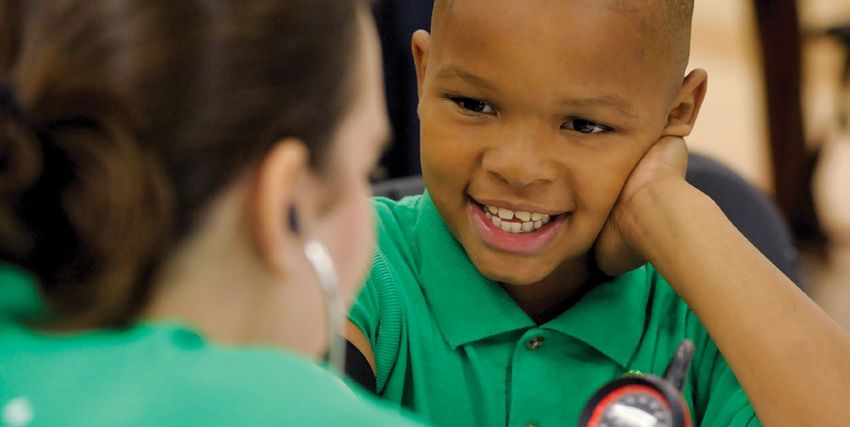
Rush University Medical Center and Rush Oak Park Hospital
    Community Health Implementation Plan, 2017–2019

      GOAL 1 Reduce inequities caused by the social, economic and structural determinants of health

    STRATEGY Improve educational attainment

    MEASURES Evaluate and retool existing programs; identify
    neighborhoods and schools with the highest need; implement
    updated strategy and begin tracking improvements
    RESULTS We selected West Side partner schools that
    include Helen M. Hefferan STEM Elementary School,
    Robert Nathaniel Dett Elementary School, Washington
    Irving Elementary School, Genevieve Melody STEM
    Elementary School, Josiah Pickard Elementary School,
    Michele Clark Magnet High School, Instituto Health
    Sciences Academy, Benito Juarez Community Academy
    and Richard T. Crane Medical Prep High School. Students
    whose participation is noted below came from these
    schools and others on the West Side.                          STRATEGY Identify, measure and mitigate the
                                                                  social determinants of health among those at risk —
                                                                  particularly children, young adults and people with
                                                                  chronic illnesses

                                                                  MEASURE Develop and implement social determinants
                                                                  of health screening tool with a goal of screening and
                                                                  referring 25% of eligible patients
                                                                  RESULTS Developed and implemented tool and established
                                                                  eligibility criteria; screened and referred 7,000 people
    Tracking improvements is a long-term goal, but we have
    tracked program reach to date: 1,900 students participated
                                                                  STRATEGY Participate in regional community health
    in enrichment, instruction and work-based learning.
                                                                  improvement collaboratives
    334 teachers/school leaders participated in professional
    development sessions. 250+ high school students
    participated in apprenticeship/internship program. 1,700+     MEASURES Collect and share health data; annually
    students and parents attended events on STEM/health           create a regional approach to improving one or more
    care topics. 50+ high school students participated in         social, economic and structural determinants of health
    externship program. 25 students trained as peer educators.
                                                                  RESULTS Collected and shared health data with
    1,400 students participated in curriculum about chronic
                                                                  AHE and others; in partnership with AHE, developed 2
    conditions/risk factors screening. 93 students participated
                                                                  regional approaches to improve outcomes related to food
    in IT certification and apprenticeship program. 450
                                                                  insecurity and housing
    students participated in workshops on health equity,
    health careers, college readiness and professionalism.

6   Rush CHNA/CHIP 2019–2022
GOAL 2 Improve access to mental and behavioral health services

STRATEGY Address psychological trauma through              STRATEGY Expand access to other screenings
screening tools and referral programs in school-based      and services
health centers and faith-based organizations

                                                           MEASURE Train 200 community members in Mental
MEASURES Develop and pilot school-based and                Health First Aid
church-based screening, wellness and referral networks;
                                                           RESULTS 240 people trained
roll out church-based screening to at least 5 partner
churches annually; begin screening 500 students annually
at Rush’s school-based health centers                      MEASURE Link 100 people to needed mental health
                                                           services
RESULTS Spiritual Care Training developed and
conducted with 5 churches; trained 240 community           RESULTS More than 700 people referred to services
members in Mental Health First Aid; referred more than
700 people to mental health services; screened more
than 2,000 students at school-based health centers

                                                                           Where We’ve Been: A Progress Report   7
GOAL 3 Prevent and reduce chronic conditions and risk factors

                                                                STRATEGY Expand free and subsidized screenings

                                                                MEASURE Provide breast cancer screening and follow-
                                                                up to at least 300 uninsured women
                                                                RESULTS 750 women screened in partnership with the
                                                                Metropolitan Chicago Breast Cancer Task Force

                                                                STRATEGY Develop and deliver community services
                                                                to help people stop smoking

                                                                MEASURE Integrate counseling into existing community
                                                                service projects with goal of achieving 10% decrease in
                                                                tobacco use among participants
                                                                RESULTS Began building infrastructure. To date: 11 people
                                                                trained to provide in-person Courage to Quit classes; more
    STRATEGY Reduce risk factors through assessments,           than 100 providers trained to talk to patients about tobacco;
    chronic condition management programs and better            developed partnership between Rush, Pro-Change
    access to healthy food                                      Behavior Systems and Illinois Tobacco Quitline; invested
                                                                $10,000 in training and personnel to help partner housing
                                                                for low-income people become a smoke-free community
    MEASURE Donate food daily for distribution to people
    in need
    RESULTS Rush Food Surplus program provided more
    than 60,000 meals from Rush University Medical Center
    and Rush Oak Park Hospital to partner institutions
    Franciscan Outreach and Oak Park River Forest Food
    Pantry. Also implemented Top Box program that enabled
    Rush employees and community members to purchase
    more than 3,500 boxes of fresh produce

    MEASURE Create faith-based programs in at least one
    community of need to help people reduce cardiovascular
    and diabetes risk factors; expand education and screening
    programs into at least one community of need and hold
    events for at least 300 people
    RESULTS Added 7 new church partners across multiple
    communities; screened and provided educational materials
    to more than 1,500 people; engaged more than 300 people
    in Walk to Wellness program

8   Rush CHNA/CHIP 2019–2022
GOAL 4 Increase access to care and community services
STRATEGY Expand access to primary care medical STRATEGY Implement adverse childhood event
homes for people without insurance and for others screenings and referrals at school-based health centers
without medical homes
MEASURE Screen 500 students each year
MEASURE Refer at least 150 uninsured people to
RESULTS 999 students screened
medical homes each year
RESULTS Connected more than 850 people with
CommunityHealth, which helps enroll people in insurance, STRATEGY Expand access to insurance
and integrated referral process with Franciscan
Outreach shelter
MEASURE Develop process for referring and enrolling
the uninsured; set baseline numbers for both
RESULTS Connected more than 850 people with
CommunityHealth, and integrated referral process with
Franciscan Outreach shelter
Where We’ve Been: A Progress Report 9Where we are today: The 2019 Rush University
Medical Center and Rush Oak Park Hospital CHNA
When we created our 2016 CHNA, we knew it was For example, citywide public health data — as well as
just the first document of an ongoing journey. Health data from our emergency rooms — shows that more
inequities are the result of decades of injustice, so it black women have pregnancy-related complications
will take a long time to fix them. than white women, so we’ve added a new CHIP goal
to improve the health of these mothers and babies.
We’re glad to see that some of the health factors
we’ve been tracking show improvement. For example, We’ve also worked to coordinate our efforts across
data available in 2016 showed unemployment in West AHE, WSU, the West Side Anchor Committee and
Garfield Park at 27%. It’s down to 19%, although that’s HEAL to deepen our impact.
still significantly higher than the citywide rate of 11%.
This CHNA adds Humboldt Park to our list of
Similarly, according to 2016 data, 35% of people in
communities served. It was a gap in our previous
South Lawndale lacked health insurance, and that’s
West Side map, but we know that people who live
down to 29% — but still significantly higher than the
there come to Rush University Medical Center and
citywide rate of 15%.
Rush Oak Park Hospital. We also see some needs in
In other words, health equity gaps remain. So the the communities of Bridgeport, McKinley Park and
needs, goals and strategies you’ll read about in the Berwyn. While we don’t have many programs in these
following pages are nearly the same as the ones we communities, we’re considering whether we should
outlined in our 2016 CHNA and 2017–2019 CHIP, with expand our reach to include them.
several important adjustments.
10 Rush CHNA/CHIP 2019–2022How we created this report
This CHNA followed a process similar to the creation
of our 2016 CHNA to identify the health needs in the
communities we serve on the West Side of Chicago
and the western suburbs.
Rush University Medical Center and Rush Oak
Park Hospital worked with the AHE, which brings
together more than 30 nonprofit and public hospitals,
seven local health departments and more than 100
community organizations to improve health across
Chicago and Cook County. Each hospital has to
conduct its own CHNA, so it made sense to come
together to align our goals, analyze data and talk with
community members: Collaborating with the AHE
helps all member hospitals make sure we’re targeting
the right areas of need and working toward the same
goals, so we can make a real difference.
Rush Copley Medical Center worked with Kane
Health Counts and other community partners on its
own CHNA, using data and community input from
people who live in Kane, Kendall and other counties
in the Rush Copley service area. Its CHNA and CHIP
differ slightly from what you’ll read here, but the focus
When you examine the life expectancy map of Chicago, residents who live closest to excellent
health care at Rush University Medical Center had among the worst health outcomes in the
city. The answer is not just about providing more health care. If we don’t address the social
and structural conditions with the greatest bearing on health outcomes — like poverty,
structural racism, poor educational achievement, food insecurity, housing and safety on
Chicago’s West Side — we will not achieve our mission of improving health.
David Ansell, MD, MPH
Senior Vice President for Community Health Equity, Rush University Medical Center
Associate Provost for Community Affairs, Rush University
Where We Are Today: 2019 CHNA 11on health equity — and the strategies for achieving Chicago Survey; and the Centers for Disease Control
it — is consistent across the entire Rush system. and Prevention. This data helped us and other AHE
You can read the Rush Copley CHNA and CHIP at partners identify needs for our CHNAs and create
www.rushcopley.com/about/community-health-needs- strategies for our CHIPs.
assessment-reports/.
Data doesn’t give us the whole picture. It’s just as
Health care is an evidence-based profession, so of important for us to have input from the people who
course this CHNA contains a lot of data about the live in the neighborhoods we serve.
factors that have an impact on health in 12 of the
Together with the AHE and WSU, we held more than 25
neighborhoods where many Rush University Medical
conversations where we invited people to talk with us
Center and Rush Oak Park Hospital patients live.
about health in their neighborhoods. The Alliance for
We acknowledge some limitations with our data,
Health Equity conducted another 23 discussions around
including gaps in data for our suburban communities
the city and Cook County. We met with neighbors at
and quantitative information about mental health
churches, parks, community centers and other
at a community level. Qualitative information is
gathering places, and also conducted a written and
also limited by the number of people who chose to
electronic survey; in total, we heard from more than
participate in our surveys and focus groups.
2,000 community residents in five different languages.
We worked with the AHE to collect and analyze
That feedback told us what’s most important in each
data from sources that include the federal American
neighborhood according to the people who live there.
Communities Survey; the Chicago, Cook County and
Illinois departments of public health; the Healthy
12 Rush CHNA/CHIP 2019–2022Neighborhood data snapshots
For each neighborhood, we list some of the things
that can help make the quality of life better, like
grocery stores and public parks. We compiled our lists
— which we realize are not exhaustive — with the
help of NowPow, the software Rush uses to connect
patients to resources, along with input from people
who live in each neighborhood.
It’s important to keep in mind that these lists don’t
tell the whole story. For example, a neighborhood
might have several public parks, but if people don’t
feel safe spending time there, how much do the parks
contribute to quality of life? A neighborhood might
have one large grocery store, but if it’s not easy or
safe for most people to walk there, how big an asset
is it? For that matter, how do we define a grocery
store? Is it a big supermarket, or a bodega that
includes fresh produce? We tried to be inclusive,
and also to understand the context around the Neighborhood data includes the following:
information provided.
Life expectancy: Chicago’s differences in life
And we want to be sure we acknowledge one major expectancies between neighborhoods are some of the
category of assets: the hundreds of community- highest in the nation.
based organizations where people come together to Data sources: Chicago Department of Public Health (CDPH), Cook
strengthen neighborhoods and support the people County Department of Public Health (CCDPH), Illinois Department of
Public Health (IDPH) Vital Stats, 2013–2017
who live there. Many of the people who work in these
organizations provided us with quotes about what Total population, race and ethnicity, percentage
health equity means to them, and also participated in of immigrants: This data gives a quick overview of
our focus groups. who lives in each neighborhood.
Data source: U.S. Census Bureau American Community Survey
2013–2017 (ACS)
Unemployment rate: A community’s rate of
unemployment is a strong indication of its health.
In many neighborhoods, the unemployment rate
is down since our last CHNA but still above the
citywide average.
Data source: ACS
Feeling of safety: This data reflects how many
people say they feel safe in their neighborhood most
of the time or all of the time.
Data source: Chicago Police Department
Where We Are Today: 2019 CHNA 13Individual poverty and child poverty: Poor people
are less likely to be healthy. This data shows the
percentages of adults and children 17 and under who
live in households with income below the federal
poverty level.
Data source: ACS
Servings of fruit and vegetables: People who eat
the recommended amounts of healthy food are
healthier overall.
Data sources: Healthy Chicago Survey; Centers for Disease Control and
Prevention Behavioral Risk Factor Surveillance System (BRFSS)
Older adults living alone: Older people who are
lonely die at a much higher rate than those who are
less socially isolated.
Data source: ACS
Housing cost burden: If you have to pay 30% or
more of your income for housing, you might not be
able to afford basics like food, clothing, transportation
and health care.
Data source: ACS
No high school diploma: People who don’t graduate
from high school are more likely to have lower incomes
and to develop chronic illnesses; on average, those
without a high school diploma live 12 years less than
those with one.
Data source: ACS
Good prenatal care: Consistent prenatal care means
Good prenatal care is important
that a mom is more likely to have a healthy pregnancy
because early, consistent care gives us
and a healthy baby.
Data source: IDPH Vital Stats, 2013–2017 better opportunities to make sure
mothers stay healthy and have the right
Health care coverage: People who don’t have health
nutrition, education and mental health
insurance have worse access to health care than
support — and we also have the
people who are insured, and often go without care
because of cost. opportunity to intervene early if
Data source: ACS something is not right.
Janice Phillips, PhD, RN
Chronic conditions and risk factors: Diabetes, Director of Nursing Research and Health Equity
obesity, hypertension (high blood pressure) and Rush University Medical Center
smoking are indicators of overall health. Associate Professor, Rush University College of Nursing
Data source: Healthy Chicago Survey
14 Rush CHNA/CHIP 2019–2022Humboldt Park West Town
River
Forest
Oak Park Austin
West East Near West Side
Garfield Garfield
Park Park
Forest
Park North Lawndale
Lower West Side
South Lawndale
To create this map of where people in the Rush We want to talk about solutions alongside
University Medical Center and Rush Oak Park challenges. The CHIP goals at the end of this report,
Hospital service area experience the most hardship, updated for 2019, address the concerns that we see in
we used the following six factors from the American the public health data and that we heard from people
Community Survey: who came to discussions and filled out surveys.
• Dependency (the number of people under age 18
and over age 64)
• Crowded housing (the percentage of housing with
more than one person per room)
• Poverty
• Per-capita income
• Unemployment
• No high school diploma
Each neighborhood snapshot also includes
comments from people who came to the discussions,
completed surveys and live in our communities. On
the following pages, you’ll see what some of the
challenges look like — and what some of the bright
spots in each neighborhood look like as well.
Where We Are Today: 2019 CHNA 15Rush Rush University
Oak Park Medical Center
Hospital
Austin
Life expectancy Race/Ethnicity*
82% Black
71
Austin
77
Chicago
82
Loop
13% Hispanic/Latino
Total
97,611 5% White
.5% Asian
1% Other
Bright spots
Life is better and healthier with resources like...
Austin Coming Together
A coalition of community-based organizations that are
collaborating to improve education and economic
development outcomes for Austin
New Moms
Helps young mothers with safe, stable housing, job training
and parenting skills, as well as doula services and a prenatal
support group
6 grocery stores and food markets
5 pharmacies Challenges
16 public parks Austin community members said that even though
2 community-based health centers there are a lot of corner stores, it can be hard to find
healthy food. A lot of people said they don’t feel safe
36 public and private schools in the neighborhood, and several mentioned that Austin
5 churches that partner with Rush needs more mental health services to help people deal
with depression and PTSD after witnessing violence.
*Percentages rounded
16 Rush CHNA/CHIP 2019–2022More people are working: The
unemployment rate is down
almost 5% from 2016 (although
unemployment is still about 7%
higher than in the rest of Chicago).
“I’m most proud of our schools on the
West Side!”
“We have to go miles to grocery stores
Just 1 in 5 people say because they aren’t in walking distance
they get 5 servings daily 20% 31%
of healthy food like AUS CHI
— what is often around is corner stores
fruits and vegetables. or fast-food restaurants.”
“Health equity is equal access to
Fewer people in Austin than in
55% 78% resources: quality education, decent
Chicago overall say they feel safe
in their neighborhood.
AUS CHI jobs, physical safety and diverse
populations living side by side.”
Poverty rates are higher than the city average. A lower percentage of moms get good
Individuals in poverty Children in poverty prenatal care than in the city overall.
30% 22% 42% 31% 55% 64%
AUS CHI AUS CHI AUS CHI
The rates of some chronic conditions
and risk factors are higher than the
citywide rates.
Diabetes Obesity
About half of people
spend a third or 14% 9% 39% 31%
AUS CHI AUS CHI
more of their
income on housing.
Hypertension Smoking
49% 36% 36% 28% 38% 19%
AUS CHI AUS CHI
AUS CHI
Austin 17East
Garfield
Rush Rush University
Oak Park Medical Center
Hospital
Park
Life expectancy Race/Ethnicity*
90% Black
69
East Garfield
77
Chicago
82
Loop
4% Hispanic/Latino
Total
Park
20,234 5% White
.4% Asian
1% Other
Bright spots
Life is better and healthier with resources like...
Breakthrough
Helps people get out of poverty with programs around
education, job training, health, violence prevention and
spiritual development
Garfield Park Community Council
Brings community members and allies together to build a
stronger community by supporting new businesses, housing,
safety programs and wellness
0 grocery stores or food markets
18 public parks Challenges
3 community-based health centers
A need for more mental health services in East Garfield
3 mental health centers Park came up often in focus groups. People also talked
about the effects of disinvestment on the West Side
25 public and private schools going back decades, and about the lack of quality jobs
3 churches that partner with Rush and education, which contributes to violence.
*Percentages rounded
18 Rush CHNA/CHIP 2019–2022Unemployment is
down, but still higher 18% 11%
EGP CHI
than the city average.
“I like the sense of community on the
West Side.”
“Hospitals train staff on mental health;
why not train residents, too? We can use
it and share it in our community.”
Fewer people in East Garfield Park “Health equity is that everyone
than in Chicago overall say they 67% 78% has the right to receive medical
EGP CHI
feel safe in their neighborhood. treatment and care.”
Poverty rates are higher than the city average. A lower percentage of moms get good
Individuals in poverty Children in poverty prenatal care than in the city overall.
43% 22% 55% 31% 52% 64%
EGP CHI EGP CHI EGP CHI
Most chronic condition and risk factor
rates match city averages, but East
Garfield Park has more people who smoke.
Diabetes Obesity
More than half of
people spend a third 8% 9% 33% 31%
EGP CHI EGP CHI
or more of their
income on housing.
Hypertension Smoking
52% 36% 28% 28% 37% 19%
EGP CHI EGP CHI
EGP CHI
East Garfield Park 19Forest
Rush Rush University
Oak Park Medical Center
Hospital
Park
Life expectancy Race/Ethnicity*
31% Black
77
Forest Park
77
Chicago
82
Loop
9% Hispanic/Latino
Total
14,137 48% White
11% Asian
2% Other
Bright spots
Life is better and healthier with resources like...
Howard Mohr Community Center
With programs for everyone including a day care program, a
food pantry, Meals on Wheels and transportation for seniors
Housing Forward
Offers housing and a shelter for people experiencing
homelessness, plus services to help people move from
housing crisis to housing stability
2 grocery stores and food markets
7 child care centers Challenges
3 public parks People talked about wanting more diversity and racial
equity in their community. They also mentioned a
3 mental health facilities need for more mental health services, as well as social
2 nursing care facilities services for LGBTQ people; others talked about a lack
of job opportunities and affordable housing.
6 public and private schools
*Percentages rounded
20 Rush CHNA/CHIP 2019–2022The unemployment rate
10% 11% Almost 1,000 people in Forest Park are
is a little lower than the
rate in Chicago.
FP CHI older adults who live alone.
Poverty rates are lower than in Chicago.
Individuals in poverty Children in poverty
11% 22% 15% 31%
FP CHI FP CHI
“There’s a small-
town feel here,
with a lot of local “We could use more community services
businesses, but sponsored by the hospital, such as the
also easy access to smoking cessation class, which is very
the city.” helpful.”
Forest Park focus group participants
“Everyone deserves a fair chance to lead identified their top 5 health concerns
a healthy life and should have full access
to the opportunities that enable them to 1 Mental health (e.g., depression, anxiety,
do so without discrimination.” post-traumatic stress disorder, suicide)
2 Age-related illness (e.g., arthritis,
hearing/vision loss, dementia/Alzheimer’s)
3 Obesity
4 Diabetes
5 Cancer and dental problems (tie)
And they identified the top 5 things
Many people spend necessary for a healthy community
a third or more of Most people have at
their income on least a high school
1 Access to health care and mental health
services
housing. education.
2 Access to community services
3 Access to healthy food
40% 36% 94% 83% 4 Affordable housing
FP CHI
FP CHI
5 Access to transportation
Forest Park 21Humboldt
Rush Rush University
Oak Park Medical Center
Hospital
Park
Life expectancy Race/Ethnicity*
37% Black
75
Humboldt
77
Chicago
82
Loop
55% Hispanic/Latino
Total
Park
56,248 6% White
.6% Asian
2% Other
Bright spots
Life is better and healthier with resources like...
Bickerdike Redevelopment Corp.
Founded by neighbors and community groups to provide
affordable housing in Humboldt Park and nearby neighborhoods,
and working to improve quality of life in the community
Kelly Hall YMCA
A place where people of all ages, interests and abilities come
together to participate in programs designed to keep youth
and families safe and motivated to succeed
4 grocery stores and food markets
5 pharmacies Challenges
9 child care centers Gentrification is a concern for people who worry that
15 public parks there will be less affordable housing in the neighborhood.
Community members also talked about the need for
3 community-based health centers better education and jobs for youth, and the problems
8 public and private schools that arise when young people wind up with criminal
records after being arrested for minor offenses.
*Percentages rounded
22 Rush CHNA/CHIP 2019–2022More people are working: The
unemployment rate is down
almost 3% from 2016 (although
unemployment is still about 4%
higher than in the rest of Chicago).
“I’m from Atlanta,
but I like the sense
of community on “Our restaurant’s rent was $4,000 a
the West Side. I like month and our business was doing well.
However, once they created the 606
to go to the Turkey
trail, the rent went to $7,000 and we had
Chop [restaurant] to close down.”
and help out.”
“Health equity is a holistic effort to
Fewer people in Humboldt Park ensure complete and equal access
than in Chicago overall say they 53% 78%
HP CHI to resources that provide the best
feel safe in their neighborhood.
opportunity to lead a healthy life.”
Poverty rates are higher than in the city overall. More people lack health insurance
Individuals in poverty Children in poverty than the Chicago average.
31% 22% 41% 31% 22% 15%
HP CHI HP CHI HP CHI
The rates of some conditions are slightly
higher than in the rest of the city, but
fewer people have high blood pressure.
Diabetes Obesity
Many people spend
a third or more of Almost a third of 13% 9% 35% 31%
HP CHI HP CHI
their income on people didn’t graduate
housing. from high school.
Hypertension Smoking
46% 36% 30% 17% 22% 28% 28% 19%
HP CHI HP CHI HP CHI
HP CHI
Humboldt Park 23Lower
Rush Rush University
Oak Park Medical Center
Hospital
West Side
Life expectancy Race/Ethnicity*
4% Black
81
Lower
77 82 78% Hispanic/Latino
Chicago Loop
West Side Total
32,998 15% White
2% Asian
1% Other
Bright spots
Life is better and healthier with resources like...
El Valor
A cornerstone of the Lower West Side, with early childhood
education programs, services for people with disabilities and
programs for parents aim to build a stronger community
Instituto del Progreso Latino
Provides education, training and employment programs for
immigrants that help people take part in the changing U.S.
society while maintaining their cultural identity
2 grocery stores and food markets
11 child care centers
Challenges
22 public parks
Gentrification is a major concern for many people as
5 community-based health centers housing costs rise in the neighborhood. Other issues
that came up in focus groups include gang violence,
11 public and private schools
a lack of mental health services and a need for the
1 church that partners with Rush community to come together to fight inequities in
education and other areas.
*Percentages rounded
24 Rush CHNA/CHIP 2019–2022More people are working: The One in four people doesn’t have health
unemployment rate is down insurance.
almost 7% from 2016, and
unemployment is about 2% lower 25% 15%
LWS CHI
than in the rest of Chicago.
About a third of people
say they get 5 servings 36% 31%
LWS CHI
daily of healthy food.
More people on the Lower West
Side are immigrants than in 35% 21%
LWS CHI
Chicago overall.
“The biggest challenge is displacement
“The West Side is of those with lower resources — we’re
being forced out. The landlord will
growing in every
remodel an apartment and then start
way!”
charging $2,000 in rent.”
Fewer people on the Lower West “Health equity is the opportunity for all
Side than in Chicago overall say 69% 78% individuals to access the support they
LWS CHI
they feel safe in their neighborhood. need for physical and mental wellness.”
The rates of diabetes and hypertension
are a little higher than in the rest of the
city, but the obesity rate is lower.
Diabetes Obesity
About a third of 13% 9% 24% 31%
LWS CHI LWS CHI
people didn’t graduate
from high school.
Hypertension Smoking
33% 17% 31% 28% N/A† 19%
LWS CHI LWS CHI LWS CHI
†We didn’t have enough data to calculate how many Lower West Side community members are smokers.
Lower West Side 25Near
Rush Rush University
Oak Park Medical Center
Hospital
West Side
Life expectancy Race/Ethnicity*
30% Black
78
Near
77 82 10% Hispanic/Latino
Chicago Loop
West Side Total
62,560 42% White
16% Asian
3% Other
Bright spots
Life is better and healthier with resources like...
Near West Side Community Development Corp.
Provides services like job and financial skills training, housing,
youth programs and community development to improve the
neighborhood’s jobs, education and amenities
Chicago Center for Arts and Technology
A place with arts and technology programs for youth, job
training programs for adults and art studios, plus a beautiful
space for everyone
5 grocery stores and food markets
11 child care centers Challenges
18 public parks People have concerns about gentrification changing
4 mental health centers the neighborhood, which can lead to higher housing
prices and different kinds of stores. They also say
4 hospitals there’s a need for more health insurance and mental
19 public and private schools health services, places to buy healthy food and
affordable child care.
*Percentages rounded
26 Rush CHNA/CHIP 2019–2022The unemployment
rate is slightly lower 9% 11%
NWS CHI
than in the city overall.
The poverty rates are comparable to the city overall.
Individuals in poverty Children in poverty
25% 22% 27% 31%
NWS CHI NWS CHI
“The West Side is
growing — it’s
up and coming; “Most of us don’t have health insurance.
there’s growing You can’t get a mammogram or go to the
beauty.” doctor for checkups. If we had health
insurance we would go more often, not
just when we’re sick.”
Most people on the Near “Health equity to me is that there are
West Side feel safe in their 82% 78% no barriers or prejudice that people
NWS CHI
neighborhood. face when receiving care.”
The rates of many chronic conditions and
risk factors are lower than in the city
overall.
Just over one- Diabetes Obesity
fourth of people
spend a third or 6% 9% 20% 31%
NWS CHI NWS CHI
more of their
income on housing.
Hypertension Smoking
28% 36% 24% 28% 10% 19%
NWS CHI NWS CHI
NWS CHI
Near West Side 27North
Rush Rush University
Oak Park Medical Center
Hospital
Lawndale
Life expectancy Race/Ethnicity*
88% Black
70
North
77 82 8% Hispanic/Latino
Chicago Loop
Lawndale Total
35,423 2% White
.2% Asian
2% Other
Bright spots
Life is better and healthier with resources like...
UCAN
A youth services nonprofit focused on preventing violence,
healing trauma, building strong families and educating and
empowering youth
Family Focus Lawndale
Supports families with after-school programs, parenting
classes, early childhood home visits, doula services and more
1 grocery store or food market
3 child care centers Challenges
13 public parks Young people say that the neighborhood needs
programs for youth, plus more mental health
4 community-based health centers resources and education. Other community members
28 public and private schools say that violence, gentrification and job opportunities
— especially for the formerly incarcerated — are
3 churches that partner with Rush challenges for their community.
*Percentages rounded
28 Rush CHNA/CHIP 2019–2022The unemployment rate A lower percentage of moms get good
is twice as high as the 22% 11% prenatal care than in the city overall.
NL CHI
overall rate in the city.
53% 64%
NL CHI
Poverty rates are high.
Individuals in poverty Children in poverty
45% 22% 57% 31%
NL CHI NL CHI
“On the block
I live, we watch
out for each other
and take care of “We need mentorships and programs run
each other.” by young black males for young fellows
who have been convicted — to help them
go back to school and earn a legal income.”
“I think health equity in Lawndale is
Fewer people in North Lawndale related to employment, affordable and
than in Chicago overall say they 48% 78%
feel safe in their neighborhood.
NL CHI culturally relevant health care, and
healthy food options.”
The rates of some chronic conditions and
risk factors are high.
Diabetes Obesity
Many people spend
a third or more of A high percentage of 13% 9% 47% 31%
NL CHI NL CHI
their income on people didn’t graduate
housing. from high school.
Hypertension Smoking
53% 36% 27% 17% 35% 28% 35% 19%
NL CHI NL CHI NL CHI
NL CHI
North Lawndale 29Rush Rush University
Oak Park Medical Center
Hospital
Oak Park
Life expectancy Race/Ethnicity*
21% Black
82
Oak Park
77
Chicago
82
Loop
8% Hispanic/Latino
Total
51,989 62% White
5% Asian
5% Other
Bright spots
Life is better and healthier with resources like...
Oak Park River Forest Infant Welfare Society
Where children receive medical, dental and behavioral health
care as well as a primary care medical home — essential for
consistent care
NAMI Metro Suburban Drop-In Center
A safe place for people with mental health issues to socialize
and find new skills and tools for work, life and friendship
6 grocery stores and food markets
10 child care centers Challenges
22 public parks Some people said that the costs of living and of
operating a small business in Oak Park can be a
6 community-based health centers challenge. Others want to see more racial diversity
2 hospitals and inclusiveness, more affordable housing and better
resources for child care.
13 public and private schools
*Percentages rounded
30 Rush CHNA/CHIP 2019–2022The unemployment rate
7% 11% About 2,350 people in Oak Park are
is a little lower than the OP CHI
rate in Chicago. older adults who live alone.
“Health equity means many things —
Poverty rates are lower than in Chicago.
including that your likelihood of dying
Individuals in poverty Children in poverty
isn’t dependent on race, sex, sexual
9% 22% 6% 31% orientation or income.”
OP CHI OP CHI
“It’s safe, beautiful and clean here.”
“We need better access to health care for
those without insurance, and better help
for those seeking to enroll in Medicaid.”
Oak Park focus group participants
identified their top 5 health concerns
1 Age-related illness (e.g., arthritis,
hearing/vision loss, dementia/Alzheimer’s)
2 Diabetes
3 Mental health (e.g., depression, anxiety,
post-traumatic stress disorder, suicide)
4 Heart disease and stroke
5 Cancer
About one in three And they identified the top 5 things
people spends a necessary for a healthy community
third or more of Most people have at
their income on least a high school
1 Access to health care and mental health
services
housing. education.
2 Access to community services
3 Access to healthy food
34% 36% 97% 83% 4 Safety and low crime
OP CHI
OP CHI
5 Affordable housing
Oak Park 31River
Rush Rush University
Oak Park Medical Center
Hospital
Forest
Life expectancy Race/Ethnicity*
6% Black
86
River Forest
77
Chicago
82
Loop
6% Hispanic/Latino
Total
11,217 78% White
6% Asian
3% Other
Bright spots
Life is better and healthier with resources like...
Oak Park River Forest Food Pantry
Where people volunteer more than 2,100 hours every month
to help feed their neighbors in 13 ZIP codes (including the
Austin neighborhood)
Oak Park River Forest Community Foundation
A place where donors connect to community-based
nonprofits and vice versa, coming together to build a vibrant,
sustainable and caring community
3 grocery stores
7 child care centers Challenges
8 public parks
People talked about a need for better mental health
2 mental health facilities services, affordable healthy food and better public
transportation. Resources for seniors also came up
1 immediate care center
as a gap; several people mentioned a wish for more
8 public and private schools programs for young people, along with ways for youth
to tell the community what they need.
*Percentages rounded
32 Rush CHNA/CHIP 2019–2022The unemployment
3% 11% About 420 people in River Forest are
rate is lower than
the rate in Chicago.
RF CHI
older adults who live alone.
Poverty rates are also lower than in Chicago.
Individuals in poverty Children in poverty
5% 22% 3% 31%
RF CHI RF CHI
“We have great schools here, and it’s clean
and quiet.”
“First, you have to eliminate the stigma
around common mental health problems,
and you need more outreach programs.”
“Health equity happens when we
work together to build resilient
communities and empower
individuals for a healthy future.”
Housing cost Most people have at
burden is similar to least a high school
Chicago’s. education.
34% 36% 97% 83%
RF CHI
RF CHI
River Forest 33South
Rush Rush University
Oak Park Medical Center
Hospital
Lawndale
Life expectancy Race/Ethnicity*
12% Black
81
South
77 82 84% Hispanic/Latino
Chicago Loop
Lawndale Total
73,983 3% White
.3% Asian
.4% Other
Bright spots
Life is better and healthier with resources like...
Enlace Chicago
Dedicated to helping people confront inequities and break
down barriers through education, health care, immigration
services and violence prevention initiatives
Erie Neighborhood House
Founded in 1870 and today helping children and youth grow
and develop, and empowering adults to build a stronger
neighborhood
2 grocery stores and food markets
4 child care centers
Challenges
3 mental health centers
People who attended focus groups identified gangs
9 public parks and drugs as major concerns. They also talked about
6 community-based health centers high housing prices, the quality of schools, a need for
more mental health services and the difficulties of
31 public and private schools getting involved in the community for people who
are undocumented.
*Percentages rounded
34 Rush CHNA/CHIP 2019–2022More people are working: The More people are without health
unemployment rate is down 7% insurance than the Chicago average.
from 2016, and unemployment
is slightly lower than in the rest 29% 15%
SL CHI
of Chicago.
More people in South Lawndale
are immigrants than in Chicago 39% 21%
SL CHI
overall.
“Our parks are great — the new one near the
Little Village arch has space for skating,
bikes, soccer and a water playground.”
Poverty rates are higher than in the city overall.
Individuals in poverty Children in poverty “There are barriers to getting involved in
the neighborhood if you don’t have papers;
35% 22% 48% 31% for example, an organization that’s looking
SL CHI SL CHI
for volunteers will ask for fingerprints.”
Fewer people in South Lawndale “Equity in health requires institutions
than in Chicago overall say they 54% 78% to love, listen to and partner with
SL CHI
feel safe in their neighborhood. communities.”
The rates of diabetes and obesity are
high compared to the rest of the city, but
hypertension and smoking are lower.
Diabetes Obesity
Many people spend
a third or more of Half of the adults in
16% 9% 43% 31%
their income on the community didn’t SL CHI SL CHI
housing. graduate from high
school. Hypertension Smoking
46% 36% 50% 17% 19% 28% 12% 19%
SL CHI SL CHI SL CHI
SL CHI
South Lawndale 35West
Garfield
Rush Rush University
Oak Park Medical Center
Hospital
Park
Life expectancy Race/Ethnicity*
96% Black
70
West Garfield
77
Chicago
82
Loop
2% Hispanic/Latino
Total
Park
17,490 2% White
.2% Asian
.6% Other
Bright spots
Life is better and healthier with resources like...
Bethel New Life
Working for decades to create opportunities to bring people
out of poverty — and to change systems and policies to help
lift the entire community out of poverty
Garfield Park Community Council
Brings community members and allies together to build a
stronger community by supporting new businesses, housing,
safety programs and wellness
4 grocery stores and food markets
3 child care centers
Challenges
8 public parks
In our focus groups, West Garfield Park community
1 community-based health center members talked often about having to leave the
neighborhood to find affordable, healthy food and
9 public and private schools
activities for their families. They also said that
5 churches that partner with Rush community leaders need to communicate better with
people who live in the neighborhood.
*Percentages rounded
36 Rush CHNA/CHIP 2019–2022More people are working: The A lower percentage of moms get good
unemployment rate is down prenatal care than in the city overall.
almost 9% from 2016 (although
unemployment is still about 8% 51% 64%
WGP CHI
higher than in the rest of Chicago).
Poverty rates are higher than in the city overall.
Individuals in poverty Children in poverty
47% 22% 60% 31%
WGP CHI WGP CHI
“We are very
family-oriented,
and we like “I think we need more supermarkets,
that kind of because not everyone has a car. Then
atmosphere.” maybe kids will learn about fruits and
vegetables and learn how to eat.”
“The ability to increase the social
Fewer people in West Garfield Park
capital and self-determination of
than in Chicago overall say they 49% 78%
feel safe in their neighborhood.
WGP CHI those directly impacted by health
inequities is health equity.”
Rates of chronic conditions and risk
factors are higher than the city average.
More than half of Diabetes Obesity
people spend a
third or more of More than one-fourth of 13% 9% 45% 31%
WGP CHI WGP CHI
their income on people didn’t graduate
housing. from high school.
Hypertension Smoking
55% 36% 28% 17% 34% 28% 40% 19%
WGP CHI WGP CHI WGP CHI
WGP CHI
West Garfield Park 37Rush Rush University
Oak Park Medical Center
Hospital
West Town
Life expectancy Race/Ethnicity*
8% Black
81
West Town
77
Chicago
82
Loop
27% Hispanic/Latino
Total
84,458 59% White
4% Asian
3% Other
Bright spots
Life is better and healthier with resources like...
CommunityHealth
Connects people who are low income and don’t have health
insurance with primary care doctors, medical and dental care,
screenings and other services for staying healthy
Greater West Town Community Development
Project
Focuses on jobs and education for West Town community
members — and on breaking down barriers that stand in the way
5 grocery stores and food markets
9 child care centers
Challenges
13 public parks
Gentrification and its impact on the cost of housing
9 community-based health centers came up as a big concern in focus groups. The
quality of schools and the impact on young people’s
25 public and private schools
lack of preparation for good jobs was also an issue,
1 church that partners with Rush and people mentioned a need for services related to
mental health and substance abuse.
*Percentages rounded
38 Rush CHNA/CHIP 2019–2022Poverty rates are lower than in the city overall. Almost three-quarters of moms get
Individuals in poverty Children in poverty good prenatal care.
15% 22% 21% 31% 71% 64%
WT CHI WT CHI WT CHI
The unemployment
rate is lower than in 5% 11%
WT CHI
the city overall.
More than 1,660 older adults in West Town live alone.
“One of the best
things about our
community is
the culture — we “When I bought my house, my taxes were
$400 a year, and now they’re $11,500 a
don’t lose our
year. For the people who stay here,
culture.” working modestly, it’s almost impossible.”
“Our health system should be equitable
More people in West Town than so every family can bear the weight of
in Chicago overall say they feel 85% 78%
WT CHI serious illness without the additional
safe in their neighborhood.
fear of poverty or collapse.”
The rates of some chronic conditions and
risk factors are lower than in the rest of
the city.
About one-fourth Diabetes Obesity
of people spend
a third or more of Most people have high 4% 9% 19% 31%
WT CHI WT CHI
their income on school diplomas.
housing. Hypertension Smoking
27% 36% 90% 83% 23% 28% 15% 19%
WT CHI WT CHI WT CHI
WT CHI
West Town 39What’s next
Rush University Medical Center and Rush Oak Park Hospital Community Health
Implementation Plan (CHIP), 2020–2022
Instead of creating a separate CHNA and CHIP as According to data released in 2018 by the Illinois
we did in 2016, this year we’ve combined them so Department of Public Health, non-Hispanic black
we can talk about health equity solutions in the women in our state were six times as likely to die
same document where we outline the challenges of a pregnancy-related condition as non-Hispanic
our neighborhoods face. white women. In Chicago, an average of seven babies
per 1,000 under age 1 die each year — but in East
On the next phase of our journey toward health
Garfield Park and North Lawndale, where almost 90%
equity, we’ll keep concentrating on the goals we
of residents are black, that number is twice as high.
and our partners identified in 2016:
Eliminating disparities and driving better outcomes
• Reduce inequities caused by social, economic for moms and babies is the focus of this new goal.
and structural determinants of health
While many of our CHIP strategies remain the same,
• Increase access to mental and behavioral we’ve added some new ones and adjusted others
health services slightly according to what we’ve learned. Because
making lasting, widespread change requires a massive
• Prevent and/or manage chronic conditions team effort, the following goals align with the goals
and risk factors adopted by the AHE, WSU, HEAL and the Healthy
• Increase access to quality health care Chicago 2.0 plan from the Chicago Department of
Public Health; nearly every hospital in Cook County
And we’re adding one new goal: is also working toward similar goals. In the following
pages, icons indicate where our work dovetails with
• Improve maternal and child health outcomes
that of the AHE ( A ), HEAL ( H ) and WSU ( W ).
40 Rush CHNA/CHIP 2019–2022You can also read