When to Use Markets, Lines, and Lotteries: How Beliefs About Preferences Shape Beliefs About Allocation
←
→
Page content transcription
If your browser does not render page correctly, please read the page content below
Article

                                                                                                                                   Journal of Marketing
                                                                                                                                                   1-17
When to Use Markets, Lines, and Lotteries:                                                                      © American Marketing Association 2021
                                                                                                                               Article reuse guidelines:

How Beliefs About Preferences Shape                                                                                  sagepub.com/journals-permissions
                                                                                                                    DOI: 10.1177/00222429211012107
                                                                                                                       journals.sagepub.com/home/jmx
Beliefs About Allocation

Franklin Shaddy              and Anuj K. Shah

Abstract
When allocating scarce goods and services, firms often either prioritize those willing to spend the most resources (e.g., money, in
the case of markets; time, in the case of lines) or simply ignore such differences and allocate randomly (e.g., through lotteries).
When do these resource-based allocation rules seem most appropriate, and why? Here, the authors propose that people are
more likely to endorse markets and lines when these systems increase the likelihood that scarce goods and services go to
those who have the strongest preferences—that is, when they help sort preferences. This is most feasible when preferences
are dissimilar (i.e., some consumers want something much more than others). Consequently, people are naturally attuned to
preference variance: when preferences for something are similar, markets and lines seem less appropriate, because it is unlikely
that the highest bidders or those who have waited the longest actually have the strongest preferences. However, when prefer-
ences are dissimilar, markets and lines seem more appropriate, because they can more easily sort preferences. Consumers thus
react negatively when firms use resource-based allocation rules in situations where preferences cannot be easily sorted
(e.g., when preferences are similar).

Keywords
allocation, customer segmentation, fairness, lines, lotteries, markets, queues, scarcity
Online supplement: https://doi.org/10.1177/00222429211012107

When allocating scarce goods and services, there are many             Sotomayor 1992]) offers a rich toolkit for determining which
ways to determine who gets what (Roth 2015). Often,                   allocation rules are optimized for different goals, but it does
however, firms either prioritize those willing to spend the            not provide guidance for which the public will most readily
most resources (e.g., money, in the case of markets; time, in         endorse or regard as most fair. Yet, this is a critical issue for
the case of lines) or simply ignore such differences and allocate     marketing theory and practice: beliefs about fairness not only
randomly (e.g., through lotteries). For example, Live Nation, a       pose a fundamental psychological question for researchers but
concert promoter, auctions tickets to the highest bidders (i.e., to   also place significant constraints on firms (Kahneman,
those willing to spend the most money; “Ticketmaster                  Knetsch, and Thaler 1986b; Roth 2007).
Auctions”). In contrast, its chief rival, AEG, administers lotter-       In this research, we suggest that people more strongly
ies, selling face-value tickets to randomly selected fans (“Fair      endorse markets and lines when they believe these resource-
AXS”). Or consider the television network NBC, which allo-            based allocation rules increase the likelihood that scarce
cates advance tickets to tapings of Saturday Night Live via           goods and services will go to the consumers who have the stron-
lottery before the start of each season. After the start of the       gest preferences—that is, when markets and lines can help sort
new season, however, it allocates standby tickets via lines           preferences. Critically, people believe this is most feasible when
(i.e., to those willing to spend the most time).
    Given the considerable differences between these systems,
when do markets, lines, and lotteries seem most appropriate,          Franklin Shaddy is Assistant Professor of Marketing, Anderson School of
                                                                      Management, University of California, Los Angeles, USA (email: franklin.shaddy@
and why?
                                                                      anderson.ucla.edu). Anuj K. Shah is Associate Professor of Behavioral Science,
    The economics of market design (e.g., auction theory              Booth School of Business, University of Chicago, USA (email: anuj.shah@
[Milgrom and Weber 1982], matching theory [Roth and                   chicagobooth.edu).
2 Journal of Marketing XX(X)
preferences are dissimilar (i.e., some consumers want some- Beliefs About Preferences
thing much more than others). So, for example, it might seem
We assert that beliefs about when to use markets and lines
more appropriate for concert promoters and television networks
depend on the extent to which these allocation rules can help
to use a market or line when tickets are broadly available to the
sort preferences. This assertion is based on prior research,
general public (where preferences are dissimilar) but less
appropriate when tickets are available only to a fan club which shows that people care a great deal about distributive effi-
(where preferences are similar). ciency, or the allocation of goods and services to those with the
strongest preferences (Lerner 1944; Leventhal 1980; Leventhal,
Karuza, and Fry 1980; Yaari and Bar-Hillel 1984). Moreover,
Beliefs About Markets and Lines recent work demonstrates that people view allocation rules as
There are many reasons why markets might seem appropriate fairer when they make it possible for consumers to signal
for determining who gets what. Markets facilitate price their preferences clearly (Shaddy and Shah 2018). So, although
discovery. They can help supply meet demand. They might there are many goals that markets and lines can potentially help
also encourage innovation and entrepreneurship and are achieve, people seem particularly focused on whether these
generally viewed as legitimate and just (Jost et al. 2003). In allocation rules ensure that scarce goods and services go to
addition, the norms of exchange underlying markets in con- those who want them the most. But when and how is this
sumer contexts are a basic feature of social relationships possible?
more broadly (Fiske 1992). As a result, markets have We suggest that the answer depends on beliefs about prefer-
sprung up in many unconventional settings. For example, ence variance, which, in turn, shape attitudes about whether
some food banks bid on donations (Prendergast 2017), some preference sorting is feasible. In particular, we propose that
college students bid on classes (Budish and Cantillon 2012), when people believe everyone has dissimilar preferences for
and even some prisoners of war invented currency to bid on something (e.g., some consumers want it much more than
rations (Radford 1945). others), they anticipate that it will be easier for a market or
Likewise, there are many reasons why lines, queues, or first- line to sort those with stronger preferences from those with
come, first-served policies might seem appropriate. Firms weaker preferences; conversely, when consumers believe
benefit when lines signal positive product or firm characteris- everyone has similar preferences (e.g., all consumers want
tics, particularly when demand exceeds supply (Banerjee something to roughly the same degree), they anticipate that
1992; Becker 1991), and consumers benefit from their inherent sorting them will be more difficult.
egalitarianism. They require people to spend time, a resource This reasoning suggests that consumers will view markets
believed to be more equally distributed than money (Shaddy and lines as less appropriate (and less fair) when preferences
and Shah 2018). are similar and more appropriate (and fairer) when they are
Yet there are also many compelling reasons why these allo- not. This is because when preferences are similar, people will
cation rules might seem inappropriate, particularly with respect doubt that the highest bidders or those who wait the longest
to markets. For example, people believe it is taboo to exchange actually have the strongest preferences. In other words, prefer-
resources such as money for something sacred, such as human ence sorting seems less feasible. So, it might seem fairer to
organs (Fiske and Tetlock 1997; McGraw and Tetlock 2005; simply ignore these trivial differences, which would be difficult
Tetlock et al. 2000). Moreover, consumers are wary of the pos- to accurately detect anyway. Instead, it could seem more appro-
sibility that markets will generate unfair profits (Kahneman, priate to allocate randomly (i.e., use a lottery). However, when
Knetsch, and Thaler 1986b; Okun 1981) or incentivize preferences are dissimilar, it will seem more plausible that the
actions inconsistent with social good (Bhattacharjee, Dana, highest bidders or those who wait the longest actually have
and Baron 2017). Meanwhile, because waiting can be aversive, the strongest preferences. Now, preference sorting seems
lines sometimes trigger negative reactions from customers, more feasible, and ignoring those nontrivial differences in pref-
including frustration, anxiety, and boredom (Davis and erences (e.g., by using a lottery) would seem unfair, because
Vollmann 1990; Efrat-Treister, Daniels, and Robinson 2020; someone with very weak preferences would have the same
Larson 1987; Taylor 1994; Zhou and Soman 2003). chance at acquiring something as someone with very strong
Prior research has therefore identified many specific preferences.
instances in which people endorse or resist markets and It is worth noting that it is mechanically the case that a
lines, but there is not yet a systematic framework for under- market or line can more easily sort preferences when they are
standing these beliefs more broadly. Indeed, even studies dissimilar. Yet it is unclear whether consumers acknowledge
that directly compare these allocation rules with each other or appreciate this basic economic insight, much like they fail
(e.g., Frey and Pommerehne 1993; Kahneman, Knetsch, and to acknowledge or appreciate others. For example, people
Thaler 1986a; Savage and Torgler 2010) primarily describe often do not recognize the positive gains from trade (instead
consumer attitudes without explaining why they hold them. assuming exchanges are zero sum; Baron and Kemp 2004;
Furthermore, prior work does not predict when one approach Hiscox 2006; Johnson 2018) or the incentive value of profit
might seem more appropriate than another. Our theory aims to (instead viewing it harmful to society; Bhattacharjee, Dana,
address this gap. and Baron 2017).Shaddy and Shah 3
Beliefs about the appropriateness of markets and lines could Second, there may be certain goods or services that people
be more strongly tied to any number of other factors aside from simply think should never be allocated on the basis of willing-
their ability to sort preferences. For example, they could depend ness to spend resources. For example, people treat wants
on which allocation rule reflects the status quo (Kimes 1994), (learned desires) differently than needs (basic requirements;
whether prices reflect quality (Chernev and Carpenter 2001; Berry 1994; Dhar and Wertenbroch 2000; Kivetz and
Lichtenstein and Burton 1989; Tellis and Wernerfelt 1987), Simsonson 2002; Maslow 1970), which are protected by
reference transactions (Anderson and Simester 2008; sacred values (Baron and Ritov 2009; Tetlock 2003) and gov-
Gershoff, Kivetz, and Keinan 2012; Kahneman, Knetsch, and erned by moral reasoning (Bartels 2008; Iliev et al. 2009;
Thaler 1986b), or religious and moral views (Fiske and Tanner, Douglas, and Iliev 2008). As a result, people are
Tetlock 1997; McGraw and Tetlock 2005; Tetlock et al. often uncomfortable with using markets to allocate needs
2000). But if our assertion holds, then people’s intuitions (Baron and Spranca 1997; McGraw, Schwartz, and Tetlock
about preference sorting may represent a key way in which 2012; Shaddy, Fishbach, and Simonson 2021), especially
lay economic beliefs align with textbook economic principles. when the neediest have the fewest resources. This suggests
that even if preferences for something construed as a need
were dissimilar—and furthermore even if those preferences
Hypotheses and Studies could be sorted by a market or line—people would nevertheless
First, we propose that the distribution of preferences will influ- prefer a different basis for allocation (likely one sensitive to dif-
ence endorsement of markets, lines, and lotteries—as well as ferences in need, rather than want). So, for needs, preference
perceptions of fairness (because we assume that people sorting should no longer matter.
endorse allocation rules they regard as fair).
H4: The type of good or service, when perceived as a need,
H1: Consumers are more likely to endorse and regard as fair moderates the effect, attenuating endorsement of resource-
resource-based allocation rules (e.g., markets and lines) based allocation rules.
when they believe preferences are dissimilar.
Finally, when firms misapply these allocation rules (i.e.,
Second, intuitions about preference sorting will play an explan- choose the option regarded as less appropriate), the resulting per-
atory role. ceptions of unfairness will yield negative downstream conse-
quences. This is consistent with work showing that consumers
H2: The belief that resource-based allocation rules (e.g., are less likely to patronize businesses believed to have engaged
markets and lines) help sort preferences mediates the effect in unfair practices (Campbell 1999a; Guo and Jiang 2016).
of preference variance on endorsement of resource-based Perceptions of unfairness reduce willingness to pay (WTP;
allocation rules. Bolton, Warlop, and Alba 2003), trigger complaints (Huppertz,
Arenson, and Evans 1978), decrease satisfaction (Haws and
Several theoretical and managerial implications follow from Bearden 2006; Oliver and Swan 1989), and can even arouse a
these predictions (Figure 1). First, implicit in H1 and H2 is the desire for vengeance (Bechwati and Morrin 2003).
assumption that willingness to spend resources and preferences
are correlated (if sometimes imperfectly; e.g., Soman 1999; H5: Misapplication of these allocation rules (e.g., use of a
Sunstein 2007; Warren, McGraw, and Van Boven 2011; Zhou resource-based allocation system when preferences are
and Soman 2003). Therefore, factors that undermine this corre- similar) reduces purchase intentions.
lation should attenuate the effect. One such variable is inequal-
ity salience. For example, people find that it is easier to infer
We conducted a total of 13 studies (N = 5,159; Table 1) to
preferences from the amount of time someone is willing to
explore this account, and we report all variables tested. For
spend to acquire something than from the amount of money
studies that included instructional manipulation checks
they are willing to spend. This is, in part, because time is
(Oppenheimer, Meyvis, and Davidenko 2009), we excluded
believed to be more equally distributed than money (Shaddy
failures prior to analysis. Data, stimuli, and code are publicly
and Shah 2018). So, if inequality in the distribution of a
available.1
resource were salient, it might reduce the perceived ratio of
Specifically, in Pilots A and B, we examine the relationship
signal (e.g., preferences) to noise (e.g., spending uncorrelated
between beliefs about preference variance and endorsement of
with preferences). This, in turn, would render preference
markets, lines, and lotteries for 25 real-world products and serv-
sorting less feasible—even if preferences were dissimilar. As
ices. We then manipulate preference variance directly (Studies
such, moderation by inequality salience would corroborate
1a and 1b) and indirectly (i.e., leaving participants to infer it;
our proposed preference sorting mechanism.
Studies 2a and 2b). Next, to probe our proposed mechanism,
we explore whether intuitions about preference sorting
H3: Inequality in the distribution of a resource, when salient,
moderates the effect, attenuating endorsement of resource-
1
based allocation rules. See https://osf.io/9eg8u/.4 Journal of Marketing XX(X)
Figure 1. Conceptual framework.
mediate the effect (Studies 3 and 4) and test two theoretically generally the case?” (1 = “Some people want/need to purchase
derived moderators: inequality salience (Study 5) and product [item], while some people do not want/need to purchase
type (Study 6). Finally, to highlight managerial implications, [item],” and 7 = “Everyone wants/needs to purchase [item].”).
we examine whether misapplication of these allocation rules We measured endorsement of markets, lines, and lotteries
reduces purchase intentions (Study 7).2 by asking participants “how 25 different products and services
should be allocated.” Specifically, for each item (presented in
random order), we asked, “Imagine that at the current price
Pilots A and B: Beliefs About Real-World there are not enough available [item] for everyone who
Policies wants or needs them. How should the [item] be allocated?”
One option was a lottery: “Use a lottery (i.e., select people
We first tested whether beliefs about preference variance predict randomly) to decide who gets to purchase the [item]. The
endorsement of markets (Pilot A) and lines (Pilot B) for allocat- people selected can get [item] at the current price. The
ing 25 real-world goods and services. people not selected will not be able to get [item].” In Pilot
A, the alternative was a market: “Sell the [item] to the
people who will pay the most. The people willing to pay the
Method most will get [item] at the price they offer. The people
willing to pay the least will not be able to get [item].” In
For Pilot A, we recruited 200 Amazon Mechanical Turk (MTurk)
Pilot B, the alternative was a line: “Use a first-come, first-
participants (Mage = 32.81 years; 84 women, 116 men); for
served policy to decide who gets to purchase the [item]. The
Pilot B, we recruited 199 MTurk participants (Mage = 34.96
people who are the first to request (or have spent the most
years; 82 women, 117 men). Both pilots employed a within-
time waiting) will be able to get [item]. The people who are
subject design, in which participants evaluated 25 items
the last to request (or have spent the least time waiting) will
along two dimensions, in two counterbalanced blocks: preference
not be able to get [item].”
variance and endorsement of markets (vs. lotteries; Pilot A) or
endorsement of lines (vs. lotteries; Pilot B).
We measured preference variance by asking participants
“whether people differ in how much they want or need 25 differ- Results and Discussion
ent products and services.” Specifically, for each item (presented We reverse-coded preference variance ratings for ease of expli-
in random order), we asked, “For [item], what do you think is cation (so higher numbers correspond to greater preference var-
iance). We then calculated the correlation between preference
2 variance and endorsement of a market (market = 1, lottery = 0)
We note that in all studies, we compare endorsement of markets with lotteries
and lines with lotteries, but we do not compare markets with lines. Much prior or a line (line = 1, lottery = 0) across all items (i.e., using 25
work (e.g., Frey and Pommerehne 1993; Kahneman, Knetsch, and Thaler 1986a; pairs of observations). We observed a positive relationship
Savage and Torgler 2010) has already shown that that lines are generally in both pretests (Pilot A: r = .86, p < .001; Pilot B: r = .77,
believed to be fairer than markets (while not the focus of our hypotheses, our p < .001; Figure 2).
studies empirically confirm this). We designed our experiments in this way We further analyzed this relationship at the participant level.
because we are primarily interested in understanding when people endorse
resource-based allocation rules, which sort preferences. Consequently, this We fit a random-effects logistic regression (to account for
framework should potentially apply to any resource-based allocation rule (in repeated measurement) with preference variance as the indepen-
addition to markets and lines; see the “General Discussion” section). dent variable and allocation decision as the dependent variable.Shaddy and Shah 5
Table 1. Overview of Studies.
Endorsement of
Markets and Lines
High Pref. Low Pref.
Study N Hyp. Contribution Main Finding Variance Variance Sig.
Pilot A 200 H1 Establishes correlation Beliefs about the distribution of preferences — — ***
for 25 real-world items were correlated
with endorsement of a market for
allocating them.
Pilot B 199 H1 Establishes correlation Beliefs about the distribution of preferences — — ***
for 25 real-world items were correlated
with endorsement of a line for allocating
them.
1a 525 H1 Establishes causal effect When preferences were dissimilar, 47% 31% ***
participants endorsed a market.
1b 602 H1 Establishes causal effect When preferences were dissimilar, 59% 35% ***
participants endorsed a line.
2a 405 H1 Reveals that consumers try to infer Participants more strongly endorsed a 3.66 2.43 ***
preference variance (without market for allocating concert tickets to the
prompting) general public (dissimilar preferences) than
a fan club (similar preferences).
2b 222 H1 Reveals that consumers try to infer Participants more strongly endorsed a line 4.80 3.89 ***
preference variance for allocating concert tickets to the general
(without prompting) public (dissimilar preferences) than a fan
club (similar preferences).
3 366 H2 Tests mediation by preference Participants more strongly endorsed a 3.51 2.07 ***
sorting; examines fairness market or line for allocating beer when
preferences were dissimilar, due to
preference sorting.
4 202 H2 Tests mediation by preference Participants cast consequential votes for 53% 37% *
sorting; presents a consequential allocating a prize to the highest bidder (e.g.,
choice use a market) when preferences for it were
dissimilar.
5 566 H3 Shows that inequality salience When preferences for an electric truck were 3.43 2.49 ***
breaks the link between dissimilar, participants endorsed a market
preference variance and for allocating it, but not when inequality
preference sorting was salient.
6 376 H4 Shows that product type breaks the When families differed according to how 4.01 3.05 **
link between preference sorting much they wanted rental cabins,
and endorsement of participants endorsed market for allocating
resource-based allocation rules them, but not when families differed
according to how much they needed rental
cabins.
7 508 H5 Documents implications for Misapplication of these allocation rules 3.64 3.05 *
purchase intentions (e.g., using a market when preferences are
similar) reduced purchase intentions.
Supp. 1a 493 H1 Extends causal effect When WTP for basketball tickets varied, 37% 22% ***
participants endorsed a market.
Supp. 1b 495 H1 Extends causal effect When willingness to wait for basketball 88% 78% **
tickets varied, participants endorsed a line.
*p < .05.
**p < .01.
***p < .001.
We observed a positive relationship between preference var- endorsement of resource-based allocation rules. However,
iance and both endorsement of a market (z = 21.61, p < .001) this could simply be a feature of the particular set of products
and endorsement of a line (z = 11.06, p < .001). and services that we tested. And, of course, these pilots are
These initial findings characterize a strong, positive relation- correlational. Do beliefs about preference variance actually
ship between beliefs about preference variance and have a causal effect?6 Journal of Marketing XX(X) Figure 2. Pilots A and B: Perceived preference variance for a product or service correlates with endorsement of markets and lines for allocating that product or service.
Shaddy and Shah                                                                                                                     7

Studies 1a and 1b: Preference Variance
Increases Endorsement of Markets and Lines
Study 1 tests whether beliefs about preference variance increases
endorsement of both markets (Study 1a) and lines (Study 1b)
(H1).

Method
For Study 1a, we recruited 525 MTurk participants (Mage = 35.77
years; 313 women, 212 men); for Study 1b, we recruited 602
MTurk participants (Mage = 37.16 years; 286 women, 316
men). Both studies employed a single-factor (condition:
variance vs. no variance—high vs. no variance—low), between-
subjects design. Participants were randomly assigned to a
condition and one of two scenarios (product vs. ticket). In the
product scenario, participants read that “a retailer has a limited
supply of a very popular product, and there is just one item
left.” In the ticket scenario, participants read that “a venue has     Figure 3. Studies 1a and 1b: Preference variance increases
a limited supply of tickets for a very popular upcoming event,         endorsement of markets and lines.
and there is just one ticket left.”                                    Notes: Bars represent 95% confidence intervals.
    In the variance condition, we told participants that “three
people all want the [product/ticket] to varying degrees” and
that Persons A, B, and C, respectively, were “extremely,” “mod-        (59%, 95% CI: [52%, 65%]) than in both the no variance—
erately,” or “only a little [interested in the product/excited about   low condition (36%, 95% CI: [30%, 43%]; z = 4.41, p <
the event].” In the no variance—high condition, we told partic-        .001, Φc = .22) and the no variance—high condition (33%,
ipants “three people all want the [product/ticket] to the same         95% CI: [27%, 40%]; z = 5.00, p < .001, Φc = .25).
extent” and that Persons A, B, and C were all “extremely [inter-           These results illustrate that when some consumers have
ested in the product/excited about the event].” The no variance        much stronger preferences than others, markets and lines
—low condition was identical to the no variance—high condi-            seem more appropriate. We also find a similar effect when par-
tion, but Persons A, B, and C were all “only a little [interested in   ticipants view only proxies for preferences (e.g., WTP, wait
the product/excited about the event].” We included the no var-         times) that vary a lot or a little (see Supplemental Studies 1a
iance—low condition to account for the possibility that consum-        and 1b in the Web Appendix). However, in these initial
ers are simply uncomfortable using markets for allocation when         studies, we explicitly gave participants this information. Do
demand is uniformly high (Bhattacharjee, Dana, and Baron               people naturally attend to preference variance in the absence
2017; Kahneman, Knetsch, and Thaler 1986b).                            of such prompting?
    We then asked participants to choose between a resource-
based allocation rule versus random allocation (counterbalanced).      Studies 2a and 2b: Inferences About
In Study 1a, participants selected either “choose someone
randomly” (lottery) or “choose the person who is willing to
                                                                       Preferences
pay the most money” (market). In Study 1b, participants selected       Because different consumers maintain different preferences
either “choose someone randomly” (lottery) or “choose the              (Goodman et al. 2013; Spiller and Belogolova 2017), what
person who is willing to wait the longest in line” (line).             “works” for one group might not for another. We predicted
                                                                       that endorsement of resource-based allocation rules would
                                                                       depend on whether participants thought about a group that
Results and Discussion                                                 they inferred had similar or dissimilar preferences (H1).
For these analyses, we collapsed across the product and ticket
scenarios (and note that the effects did not vary by scenario).
In Study 1a, participants were more likely to endorse a
                                                                       Method
market, relative to a lottery, in the variance condition (47%,         For Study 2a, we recruited 405 MTurk participants (Mage =
95% confidence interval [CI]: [40%, 55%]; Figure 3) than in             37.46 years; 204 women, 201 men); for Study 2b, we recruited
both the no variance—low condition (32%, 95% CI: [26%,                 222 participants from the behavioral laboratory at a West Coast
39%]; z = 2.93, p = .003, Φc = .16) and the no variance—high           business school (Mage = 22.05 years; 169 women, 53 men).
condition (30%, 95% CI: [23%, 37%]; z = 3.38, p = .001,                Both studies employed a single-factor (condition: general
Φc = .18). In Study 1b, participants were more likely to               public vs. fan club), between-subjects design. We described a
endorse a line, relative to a lottery, in the variance condition       scenario in which the band Radiohead was playing “a
8 Journal of Marketing XX(X)
one-night-only show in Los Angeles” and made tickets avail- Study 3: Intuitions About Preference Sorting
able either to “the general public” or to “members of its Los Mediate the Effect
Angeles fan club.” We expected that participants would infer
lower preference variance within the fan club than among the Study 3 offers initial process evidence for our account by testing
general public. whether intuitions about preference sorting explain why prefer-
In Study 2a, we asked whether the band should allocate ence variance increases both endorsement and the perceived
tickets, at face value, via “a lottery” or “sell the tickets,” fairness of markets and lines (H1). We predicted that these intu-
at their stated price, to those “willing to pay the most” itions would play a mediating role (H2).
(1 = “Definitely use a lottery,” and 7 = “Definitely sell the
tickets to the people willing to pay the most”). In Study 2b,
Method
we asked whether the band should allocate the tickets, at
face value, via “a lottery” or “sell the tickets,” at face value, We recruited 366 MTurk participants (Mage = 43.80 years; 186
to those “willing to wait the longest in line” (1 = “Definitely women, 180 men). Study 3 employed a 2 (condition: variance
use a lottery,” and 7 = “Definitely sell the tickets to the vs. no variance) × 2 (resource: money vs. time), between-
people willing to wait the longest”). subjects design. All participants read, “A local craft brewery
Finally, as a manipulation check, we measured inferences has just released a new, limited-edition beer. This new beer is
about preference variance: “Among members of the [general an India pale ale (IPA), and there are only 10 available cases.
public (i.e., everyone in the city of Los Angeles)/members The brewery announced the release in a Facebook post to its
of the Los Angeles fan club (i.e., die-hard fans)], what do 100 followers.”
you think is generally the case?” (1 = “Everyone is inter- In the variance condition, participants read, “All 100 follow-
ested in the tickets to a similar degree,” and 7 = “Some are ers would be willing to purchase a case, but some of these fol-
not interested in the tickets at all, some are moderately inter- lowers are more excited than others (i.e., some love IPAs, while
ested in the tickets, and some are extremely interested in the others only somewhat like IPAs).” In the no-variance condition,
tickets”). participants read, “Because the company is known for its IPAs,
all 100 followers are extremely excited and would be willing to
purchase a case (i.e., they all love IPAs).”
Results and Discussion We then explained, “One option is to enter all 100 followers
Confirming the effect of the manipulation, in Study 2a, partici- into a lottery. The 10 cases would be sold to 10 randomly
pants inferred greater preference variance in the general public selected people (at the standard price).” In the money condition,
condition (M = 5.97, 95% CI: [5.76, 6.18]) than in the fan we said, “Another option is to offer the available cases to those
club condition (M = 3.58, 95% CI: [3.28, 3.87]; t(403) = who are willing to pay the most. The 10 cases would be sold to
13.00, p < .001, d = 1.29). In Study 2b, participants inferred the 10 people willing to pay the most (at their stated price).” In
greater preference variance in the general public condition the time condition, we said, “Another option is to offer the avail-
(M = 6.06, 95% CI: [5.84, 6.29]) than in the fan club condi- able cases on a first-come, first-served basis. The 10 cases
tion (M = 4.50, 95% CI: [4.13, 4.86]; t(220) = 7.24, p < .001, would be sold to the 10 people willing to wait in line the
d = .97). longest.”
Moreover, in Study 2a, participants were more likely to endorse We asked (counterbalanced), “What should the brewery
a market, relative to a lottery, in the general public condition (M = do?” and “What would be the fairest thing for the brewery to
3.66, 95% CI: [3.34, 3.97]) than in the fan club condition (M = do?” (money condition: 1 = “Definitely use a lottery,” and 7 =
2.43, 95% CI: [2.16, 2.70]; t(403) = 5.88, p < .001, d = .58). In “Definitely sell the cases to those who are willing to pay the
Study 2b, participants were more likely to endorse a line, rel- most”; time condition: 1 = “Definitely use a lottery,” and 7 =
ative to a lottery, in the general public condition (M = 4.80, “Definitely sell the cases to those who are willing to wait in
95% CI: [4.46, 5.14]) than in the fan club condition (M = line the longest”).
3.89, 95% CI: [3.51, 4.27]; t(220) = 3.55, p < .001, d = .48). Finally, we measured intuitions about preference sorting: “If
These additional analyses corroborate our claim that the the brewery sold the available cases to [those who are willing to
appropriateness of markets, lines, and lotteries depends not pay the most/wait in line the longest], how likely is it that the
only on what is being allocated, but to whom. What explains available cases would end up going to the people who want
this pattern, though? We propose that consumers endorse them the most?” (1 = “Not at all likely,” and 7 = “Extremely
markets and lines when they believe these resource-based allo- likely”).
cation rules increase the likelihood that those who want or need
something the most will get it—that is, when they help sort pref-
erences. In addition, thus far we have asked participants what
Results and Discussion
should be done, rather than what would be the fairest thing to Beliefs about what the brewery “should” do and what would be
do. While our account implies beliefs about the latter shape the “fairest thing for the brewery to do” did not meaningfully
beliefs for the former, we have yet to test this assumption differ (α = .89), so we formed a composite by taking the
empirically. average. An analysis of variance (ANOVA) of this compositeShaddy and Shah 9
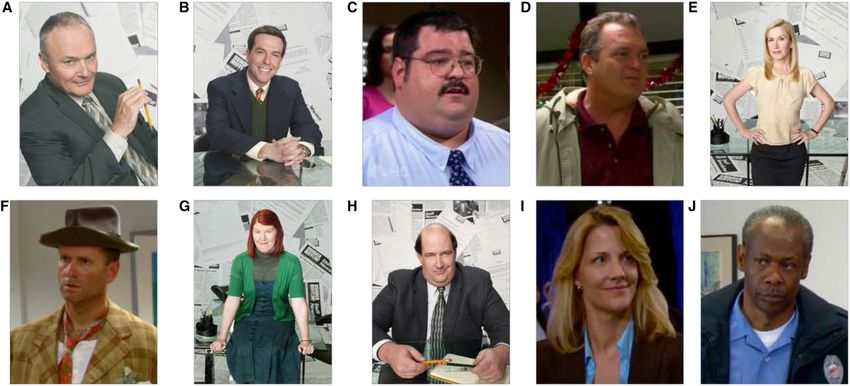
Figure 4. Study 4: Trivia Game Stimuli.
on condition, resource, and their interaction revealed only a findings hold when participants face real consequences for
main effect of preference variance (F(1, 362) = 49.43, p < .001, their allocation decisions. We note that although our framework
d = .68), such that participants were more likely to endorse a applies to both markets and lines, in the remaining studies we
market or line, relative to a lottery, in the variance condition focus specifically on attitudes toward markets and market
(M = 3.51, 95% CI: [3.18, 3.84]) than in the no-variance condi- pricing (predicting conceptually similar results for first-come,
tion (M = 2.07, 95% CI: [1.82, 2.32]). The simple effect of first-served policies).
condition was significant for each resource (money condition:
F(1, 362) = 15.83, p < .001; time condition: F(1, 362) = 35.70,
p < .001). Study 4: Consequential Allocation Decisions
We next examined beliefs about preference sorting. An Study 4 tests whether preference variance affects real decisions
ANOVA of these beliefs on condition, resource, and their inter- for how something should be allocated. We predicted that when
action revealed a main effect of preference variance (F(1, 362) = participants believed that preferences for a prize varied, they
30.94, p < .001, d = .52), such that participants believed that a would be more likely to cast votes for a market (vs. a lottery).
market or line would do a better job sorting preferences in the We again predicted intuitions about preference sorting would
variance condition (M = 5.66, 95% CI: [5.45, 5.87]) than in play a mediating role (H2).
the no-variance condition (M = 4.82, 95% CI: [4.57, 5.06]).
The simple effect of condition was significant for each resource
(money condition: F(1, 362) = 16.80, p < .001; time condition: Method
F(1, 362) = 14.17, p < .001). We also observed a main effect We recruited 202 MTurk participants (Mage = 35.82 years; 72
of resource (F(1, 362) = 9.65, p = .002, d = .25), such that par- women, 130 men). Study 4 employed a single-factor (condition:
ticipants believed that preference sorting was more likely in high variance vs. low variance), between-subjects design. We
the time condition (M = 5.44, 95% CI: [5.22, 5.65]) than in first told all participants that they would be participating in a
the money condition (M = 5.04, 95% CI: [4.79, 5.29]). trivia game and that their goal would be to identify characters
Finally, we tested for mediation. Indeed, beliefs about pref- from a popular television show (The Office). We also told par-
erence sorting mediated the effect of condition on endorsement ticipants they would have the chance to win a prize, depending
of a market or line, relative to a lottery (based on 10,000 boot- on their performance.
strapped resamples: indirect effect = .32, SE = .07, 95% CI: After reviewing these instructions and launching the trivia game,
[.193, .486]). participants had 45 seconds to evaluate ten photos (Figure 4). They
This result supports the notion that consumers believe pref- were asked to indicate which photo depicted each of ten characters
erence sorting is a basic function of markets and lines, and that were listed below the table in random order.
this is why they seem both more appropriate and fairer when After completing the trivia game participants read, “We have
preferences are dissimilar. All of the studies thus far have one (1) The Office-theme card game (see below) to offer as a gift
been hypothetical, however. Next, we test whether these to participants in this study.” We displayed the prize and asked,10 Journal of Marketing XX(X)
“How much of your base pay ($1.00) would you be willing to negatively correlated (r = −.13, p = .06). In other words, those
exchange for this gift?” Participants responded on a sliding with low scores—those less likely to be fans of the show and
scale, ranging from 0 to 100 cents. consequently those with lower WTP—nevertheless tended to
In the high-variance condition, we told participants, “All par- believe the prize should be “sold” to the highest bidder, possibly
ticipants, regardless of their score, will be eligible to receive this recognizing the potential to improve distributive efficiency
gift. And we are asking all participants, regardless of their score, (even though allocation through market pricing would mean
to vote on how this gift will be awarded.” In the low-variance they, themselves, were unlikely to win).
condition, we told participants, “Only those participants who Studies 3 and 4 reveal that people more strongly endorse
earned a perfect score will be eligible to receive this gift. But resource-based allocation rules when preferences are dissimilar,
we are asking all participants, regardless of their score, to because markets and lines are likelier to allocate scarce goods
vote on how this gift will be awarded.” We then asked, and services to those with the strongest preferences (i.e., sort
“Should we choose [someone/one of these die-hard fans] ran- preferences). Next, we turn to two theoretically derived moder-
domly, or should we ‘sell’ it to the highest bidder (i.e., the par- ators of our basic model.
ticipant who is willing to give up the most of his/her $1.00 base
pay)? Note that we will actually tally these votes and use the
outcome to decide how to award this gift” (“Choose randomly”
Study 5: Moderation by Inequality Salience
or “‘Sell’ it to the highest bidder”). Previous research has found that inequality in the distribution of
Finally, after casting a vote, participants responded to four a resource makes it difficult to clearly signal preferences
follow-up questions. First, to test our proposed mechanism, (Shaddy and Shah 2018). So, when inequality is salient, prefer-
we captured intuitions about preference sorting: “If we ‘sold’ ence variance should no longer matter because there is no reli-
it to the highest bidder (among [everyone who scored able way to sort those differences (H3).
between 0%–100%/only those who scored 100%]), would that
make it more likely or less likely that the person who wants
this card game the most will be able to get it?” (1 = “Less Method
likely,” 4 = “Neither,” and 7 = “More likely”). We also asked We recruited 566 Prolific participants (Mage = 37.71 years; 279
participants to guess how many characters they correctly iden- women, 287 men). Study 5 employed a 2 (condition: variance
tified (0–10) and to indicate whether they were familiar with vs. no variance) × 2 (inequality: salient vs. baseline), between-
(1 = “Not at all familiar,” and 7 = “Very familiar”) and a fan subjects design. All participants first reviewed a vignette
of (1 = “Definitely not,” and 7 = “Definitely”) the television describing the introduction of “a new, highly anticipated, all-
show. electric pickup truck.” We explained that because “the
company can only produce a limited supply,” potential buyers
would need to submit a waitlist application that included
contact information, a description of their interest, and a refund-
Results and Discussion able deposit.
Participants were likelier to vote for a market (i.e., sell the prize In the variance condition, participants read, “The people on
to the highest bidder), relative to a lottery, in the high-variance the waitlist each have dramatically different levels of desire
condition (53%, 95% CI: [43%, 62%]) than in the low-variance for the truck.” In the no-variance condition, participants read,
condition (37%, 95% CI: [28%, 47%]; χ2(1) = 5.18, p = .023, “The people on the waitlist all have exactly the same level of
Φc = .16).3 Participants also indicated that they believed a desire for the truck.” Participants in the inequality-salient condi-
market would make it more likely that the person who wanted tion were told, “The people on the waitlist each earn dramatically
the card game the most would be able to get it (i.e., sort prefer- different incomes.” In the baseline condition, participants read
ences) in the high-variance condition (M = 5.80, 95% CI: [5.52, nothing else. Finally, we asked, “How should the company allo-
6.08]) than in the low-variance condition (M = 5.42, 95% CI: cate the available trucks?” (1 = “Choose people randomly [and
[5.12, 5.72]; t(200) = 1.86, p = .064, d = .26). Furthermore, sell at list price],” and 7 = “Choose the people willing to pay
these beliefs mediated the effect of condition on voting for a the most money [and sell at the offered price]”).
market (based on 10,000 bootstrapped resamples: indirect
effect = .02, SE = .02, bias-corrected 95% CI: [.001, .066]).
It is also worth pointing out that unlike in the previous Results and Discussion
studies, participants here voted for an allocation rule to which An ANOVA of allocation rule on condition, inequality, and
they, themselves, would be subjected. Interestingly, objective their interaction revealed a main effect of condition (F(1, 562)
performance and endorsement of a market were weakly but = 7.10, p = .008), which was qualified by an interaction (F(1,
562) = 7.93, p = .005). Decomposition revealed a simple effect
3 of condition at baseline (F(2, 562) = 15.46, p < .001, d = .45;
Because there were more votes overall for the lottery (111) than the market
(91), we randomly chose a participant as the winner. We offered to either (a) pur- Figure 5), replicating the basic effect: participants were more
chase and send the prize to the winner or (b) issue an MTurk bonus in the likely to endorse a market, relative to a lottery, in the variance
amount of the retail price of the prize. The winner chose option (b). condition (M = 3.43, 95% CI: [3.10, 3.75]) than in theShaddy and Shah 11
Figure 5. Study 5: Inequality salience attenuates the effect of Figure 6. Study 6: Preference variance increases endorsement of
preference variance on endorsement of markets. resource-based allocation rules for wants, but not for needs.
Notes: Bars represent 95% confidence intervals. Notes: Bars represent 95% confidence intervals.
no-variance condition (M = 2.49, 95% CI: [2.16, 2.83]). people who are interested in vacationing at these sites.” In the
However, there was no such simple effect of condition when need condition, we explained that because “forest fires near
inequality was salient (F(2, 562) = .01, p = .916, d = .01; one residential neighborhood have significantly diminished air
Mvariance = 2.81, 95% CI: [2.47, 3.15]; Mno variance = 2.83, quality and now pose a serious safety hazard, … the Forest
95% CI: [2.49, 3.18]). Service is making some cabins available for short-term
Study 5 confirms that when inequality is salient, preference rental.” Participants then read, “There is now only one cabin
sorting seems less feasible—even when preferences are dissim- left and several families still [want/need] it.” In the variance
ilar—so resource-based allocation rules seem less appropriate. condition, we told participants, “These families, however,
The next study tests whether there are certain goods or services each have dramatically different levels of [need/desire] for the
that people simply think should never be allocated on the basis cabin.” In the no-variance condition, we told participants,
of willingness to spend resources. “These families, however, all have exactly the same level of
[need/desire] for the cabin.”
Finally, we asked (counterbalanced), “What should the
Study 6: Moderation by Product Type Forest Service do?” and “What would be the fairest thing for the
(Wants vs. Needs) Forest Service to do?” (1 = “Choose a family randomly,” and 7 =
People often disapprove of resource-based allocation rules for “Choose the family willing to pay the most money for it”).
allocating needs, which can impose taboo trade-offs (Baron
and Spranca 1997; McGraw, Schwartz, and Tetlock 2012).
We therefore expected that for something people need (as Results and Discussion
opposed to merely want), resource-based allocation rules Beliefs about what the Forest Service “should” do and what
seem less appropriate (H4). would be the “fairest thing for the Forest Service to do” did
not meaningfully differ (α = .88), so we formed a composite
by taking the average. An ANOVA of this composite on
Method condition, type, and their interaction revealed main effects of
We recruited 376 MTurk participants (Mage = 34.59 years; 167 condition (F(1, 372) = 4.09, p = .044) and type (F(1, 372) =
women, 209 men). Study 6 employed a 2 (condition: variance 4.53, p = .034), which were qualified by an interaction (F(1,
vs. no variance) × 2 (type: want vs. need), between-subjects 372) = 5.40, p = .021). Decomposition revealed a simple effect
design. All participants first read: “Throughout the country, of condition for wants (F(1, 372) = 9.38, p = .002; d = .43), rep-
the U.S. Forest Service maintains a number of restricted-use licating the basic effect: participants were more likely to endorse
cabins on protected land. These cabins are not typically open a market, relative to a lottery, in the variance condition (M =
to the public, but are rather used for operational purposes.” 4.01, 95% CI: [3.56, 4.46]) than in the no-variance condition
In the want condition, we explained that “the agency has (M = 3.05, 95% CI: [2.64, 3.46]) (Figure 6). However, there
decided to make these cabins available for short-term rental to was no such simple effect of condition for needs (F(1, 372) = .05,12 Journal of Marketing XX(X)
p = .831; d = .03; Mvariance = 3.03, 95% CI: [2.61, 3.45]; Springfield and Greenville (counterbalanced). Those assigned to
Mno variance = 3.10, 95% CI: [2.62, 3.57]). the lottery system indicated how fair it would be “if 3M used a
Study 6 reveals that even when preferences for something lottery to allocate its available N95s randomly (at list price)” in
construed as a need are dissimilar—and furthermore even each of Springfield and Greenville (counterbalanced; for both
when those preferences could be sorted by a market— questions, 1 = “Extremely unfair,” and 7 = “Extremely fair”).
people still resist resource-based allocation rules. This could On the next page, we measured purchase intentions (counter-
be due to hesitance regarding taboo trade-offs, which possibly balanced): “If 3M used [an auction/a lottery] to allocate N95s in
shift people from consequentialist moral reasoning (see the Springfield, would that affect your willingness to purchase 3M
“General Discussion” section). Or it may be that in these sit- products?” And: “If 3M used [an auction/a lottery] to allocate
uations people prefer a different basis for allocation (likely N95s in Greenville, would that affect your willingness to pur-
one sensitive to differences in need, rather than want). In chase 3M products?” (for both questions, 1 = “It would make
our final study, we examine how consumers respond when me less likely to purchase other 3M products,” and 7 = “It
they cannot choose the allocation rule themselves (as is typi- would make me more likely to purchase other 3M products”).
cally the case), underscoring the managerial implications of
our theory.
Results and Discussion
A mixed ANOVA of fairness on system (between-subjects),
Study 7: Implications for Purchase Intentions variance (within-subjects), and their interaction revealed a
An expansive body of literature has documented the numerous main effect of system (F(1, 467) = 100.30, p < .001) and a
negative consequences that result from perceptions of unfair- main effect of variance (F(1, 467) = 37.68, p < .001), which
ness in the marketplace (e.g., Bechwati and Morrin 2003; were qualified by an interaction (F(1, 467) = 141.02, p < .001).
Bolton, Warlop, and Alba 2003; Campbell 1999a; Guo and Decomposition revealed that participants believed it was fairer
Jiang 2016; Haws and Bearden 2006; Huppertz, Arenson, and to use a market to allocate the available N95s in the city
Evans 1978; Oliver and Swan 1989). This suggests that firms where preferences varied (i.e., Springfield; M = 3.62, 95% CI:
may be penalized for choosing allocation rules that our frame- [3.38, 3.86]) than in the city where preferences did not vary
work characterizes as inappropriate (H5). (i.e., Greenville; M = 3.04, 95% CI: [2.81, 3.28]; F(1, 467) =
16.21, p < .001, d = .30) (Figure 7). By contrast, participants
believed it was fairer to use a lottery to allocate the available
Method N95s in the city where preferences did not vary (i.e.,
We recruited 508 MTurk participants (Mage = 40.17 years; 272 Greenville; M = 5.64, 95% CI: [5.43, 5.84]) than in the city
women, 236 men). Study 7 employed a 2 (condition: variance where preferences varied (M = 3.82, 95% CI: [3.57, 4.06];
vs. no variance; within-subjects) × 2 (system: market vs. F(1, 467) = 164.70, p < .001, d = .89).
lottery; between-subjects) mixed design. All participants first A mixed ANOVA of purchase intentions on system
read, “The U.S. Centers for Disease Control and Prevention (between-subjects), variance (within-subject), and their
(CDC) recommends wearing face masks to help slow the interaction revealed a main effect of system (F(1, 467) = 86.12,
spread of the coronavirus.” While “surgical masks and cloth p < .001) and a main effect of variance (F(1, 467) = 3.78,
masks are widely available,” N95 respirators “are still in short p = .052), which were qualified by an interaction (F(1, 467) =
supply.”4 We then explained that the “largest domestic manu- 45.82, p < .001). Decomposition revealed that participants were
facturer of N95 respirators is 3M, which also makes a wide less likely to purchase other 3M products if the company used a
array of other products, including sticky notes, tape, bandages, market to allocate the available N95s in the city where preferences
air filters, water filters, sponges, and much more.” did not vary (i.e., Greenville; M = 2.87, 95% CI: [2.68, 3.05]) than
We then described two cities, one with greater preference in the city where preferences varied (i.e., Springfield; M = 3.16,
variance than the other: “In the city of Springfield, each resident 95% CI: [2.99, 3.34]; F(1, 467) = 11.46, p < .001, d = .20)
has dramatically different desire for an N95 respirator”; alterna- (Figure 7). By contrast, participants were less likely to purchase
tively, “In the city of Greenville, all residents have identical 3M products if the company used a lottery to allocate the avail-
desire for an N95 respirator.” Preferences for N95s, therefore, able N95s in the city where preferences varied (i.e., Springfield;
varied in Springfield, but not in Greenville. M = 3.72, 95% CI: [3.57, 3.87]) than in the city where prefer-
Those assigned to the market system indicated how fair it ences did not vary (i.e., Greenville; M = 4.23, 95% CI: [4.08,
would be “if 3M used an auction to allocate its available N95s 4.39]); F(1, 467) = 38.54, p < .001, d = .47).
to the highest bidders (at their stated price)” in each of This final study demonstrates that when a company fails to
apply the more appropriate allocation rule (as characterized by
4
our framework), purchase intentions suffer. However, we
Note that we chose to test N95 respirators specifically because they are acknowledge the possibility that participants could have made
extremely effective at preventing transmission (and therefore should be carefully
allocated when supply is limited); however, they are not strictly a necessity (e.g., different inferences about the two cities (given our within-
as in Study 6), due to the availability of other types of masks and preventative subject design), though it is not clear in what direction this
measures. would have systematically affected judgments. For example,Shaddy and Shah 13
believe that understanding these lay economic beliefs is of
broad theoretical interest. Yet these intuitions also have practi-
cal consequences, as they shape perceptions of fairness in the
marketplace. To that end, our account builds on prior work
showing that consumers care deeply about distributive effi-
ciency (Lerner 1944; Leventhal 1980; Leventhal, Karuza, and
Fry 1980). Perhaps as a result of this, we find that people are
naturally attuned to how preferences are distributed. And thus
their views about when to use markets, lines, and lotteries
depend on the extent to which they believe preferences vary.
Theoretical and Practical Implications
Of course, preference variance is not the only factor that shapes
views about how to allocate things. For example, Study 5 dem-
onstrates that inequality reduces support for resource-based
allocation rules. People are uncomfortable with inequality in
general (Fehr and Schmidt 1999), but our results reveal that at
least some of this discomfort stems from skepticism about
whether resource-based allocation rules can improve distribu-
tive efficiency when spending is uncorrelated with preferences.
In addition, inequality may furthermore affect perceptions of
unfairness simply because people regard any form of inequality
as unfair (e.g., Farmer, Kidwell, and Hardesty 2020; Kuziemko
et al. 2015; Norton and Ariely 2011; Stiglitz 2012; Walasek,
Bhatia, and Brown 2018).
It is further plausible that the source of inequality could
matter as well. For example, inequality arising from differences
in work ethic probably attenuate the effect less than inequality
arising from differences in inheritance (Chow and Galak
2012). And resources themselves can often be exchanged for
each other (e.g., paying money to jump a queue and save
time), suggesting another potential moderator future research
might explore.
More broadly, our findings enrich the literature exploring
when people most readily adopt preference-based versus other
allocation norms. For example, prior work has argued that
people especially desire improvements in distributive efficiency
when there is an insufficient supply of something and prefer-
Figure 7. Study 7: Misapplication of these allocation rules (e.g., use ences vary (Deutsch 1975; Skitka and Tetlock 1992; Yaari
of a market when preferences are similar) reduces perceptions of
fairness and purchase intentions.
and Bar-Hillel 1984). Our conceptual framework reveals that
Notes: Bars represent 95% confidence intervals. these are necessary, but not sufficient, conditions: people also
need to believe that stated preferences (signaled by the resour-
residents of a city might express uniformly high desire for N95 ces consumers are willing to spend) are appropriate for deter-
respirators because their public health infrastructure is poorly mining who should get what and that resources spent reliably
equipped (and thus lacks supplies) or well equipped (reflecting signal those preferences.
a citizenry that enthusiastically adopts new mitigation tactics). We believe that our work yields several additional theoretical
Nevertheless, the findings here highlight the importance of insights. We identify a novel source of market aversion. For
anticipating how the appropriateness of allocation rules for example, previous work has found that market aversion can
some products can potentially affect downstream purchase occur when people attach moral value to things (Tetlock et al.
intensions for other products. 2000) or react negatively to profit-taking (Bhattacharjee,
Dana, and Baron 2017; Kahneman, Knetsch, and Thaler
1986b; Okun 1981). Here, we propose that market aversion
General Discussion can also be traced to views about the very purpose of markets
In this research, we offer a general account of when and why to begin with. That is, consumers seem to believe that a
people favor the use of markets, lines, and lotteries. We primary function is to help sort preferences—identifying thoseYou can also read