Human Acceleration of the Nitrogen Cycle - Managing Risks and Uncertainty POLICY HIGHLIGHTS - OECD.org
←
→
Page content transcription
If your browser does not render page correctly, please read the page content below

Human Acceleration
of the Nitrogen Cycle
    Managing Risks and Uncertainty
                       POLICY HIGHLIGHTS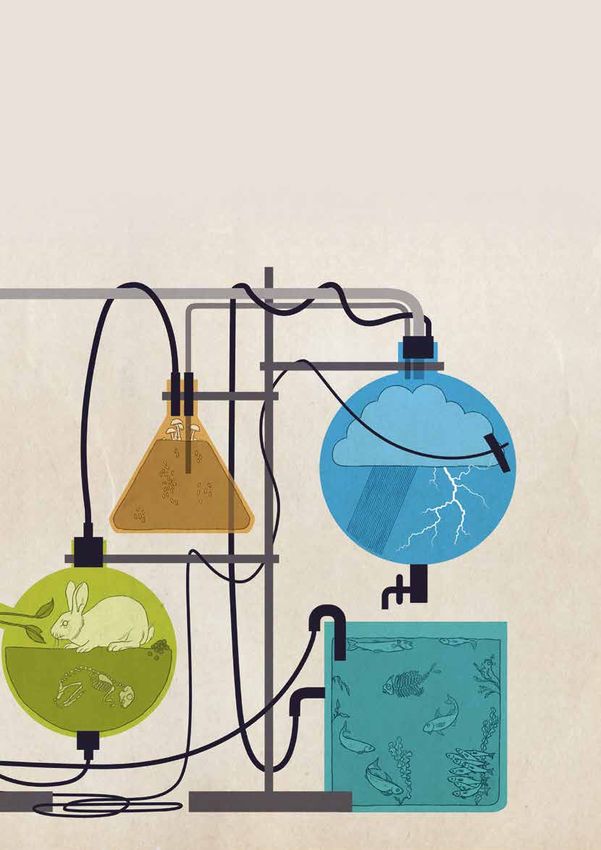

POLICY HIGHLIGHTS
Three ways to tackle
nitrogen pollution
Despite immense benefits in terms of food and energy
security, the use of fertilisers and the burning of fossil fuels            Did you know?
release excess reactive nitrogen that poses serious threats
                                                                        Until one century ago,
to health and the environment.
                                                                        Chilean saltpetre (and
The use of chemically-reactive nitrogen in fertilisers has                before it Peruvian
brought immense benefits in terms of agriculture productivity           guano) was the main
and food security. Nitrogen also has many industrial uses and           source of nitrogen for
the combustion of fossil fuels releases reactive nitrogen to the        world agriculture and
atmosphere as a by-product. Since the start of the 20th century,               industry.
humans have doubled the inputs of reactive nitrogen to the
environment (Fowler et al., 2013) and this now poses serious
threats to health and the environment.

Excess nitrogen pollutes air, soil and water; increases greenhouse gas emissions; and impacts
biodiversity and ecosystem functioning. Reactive nitrogen stimulates the formation of ground-
level ozone and particles in the atmosphere; increases soil acidification; and, the transfer of
nitrogen from terrestrial to coastal systems is leading to algal blooms and a decline in the quality
of aquatic ecosystems. Not only is nitrogen a greenhouse gas (GHG) itself (in the form of nitrous
oxide), but it also contributes to depletion of the stratospheric ozone.

Countering nitrogen pollution in a cost-effective way requires a threefold approach:

l   Implement impact-pathway analysis (IPA) to better managing the risks of air, soil, water
    and ecosystem pollution.

l   Manage nitrous oxide as part of GHG mitigation policies.

l   Monitor and manage any residual nitrogen excess by measuring the effect of the above
    measures on the national nitrogen budget.

Measures to counter nitrogen pollution should be based on their impact and applied as close as
possible to the point of emission to maximise effectiveness and cost-efficiency. Often, the best
environmental outcome and greater political acceptability will require a combination of measures:
“polluter pays” and “beneficiary pays” policies, alongside direct environmental regulation.

                                                               THREE WAYS TO TACKLE NITROGEN POLUTION . 1
1
How excess nitrogen threatens
health and the environment
AIR

Human activity – especially the burning of fossil fuels         Air motions play a key role in the distribution of
– is a major source of nitrogen oxides (NOx) in the             reactive nitrogen in the atmosphere and in its
troposphere, the lowest region of Earth’s atmosphere.           transport distance before “deposition” on the ground.
In such combustion processes, under high temperature            In the United States, the National Atmospheric
and pressure conditions, atmospheric nitrogen (N2)              Deposition Program (NADP) has mapped the risk
combines with oxygen atoms to create NOx. Human                 of nitrogen aerosol deposition. As evidenced by the
activity – especially agricultural practices – is also a        risk assessment, it can be expected that ammonium
major source of ammonia (NH3).                                  (NH4+) wet deposition occurs near or downwind of
                                                                major agricultural centres, and that nitrate (NO3–)
In the atmosphere, nitrogen dioxide (NO2) and, to a             levels in wet deposition are consistent with NOx
lesser extent, NH3, are directly harmful to human               emissions (USEPA-SAB, 2011).
health, increasing likelihood of respiratory problems.
NH3 and NOx can react with each other or with                   The health impact of air pollution by nitrogen incurs
atmospheric components, contributing to the most                social costs that are already in the hundreds of
serious air pollution problems for human health                 billions of USD. This is because nitrogen compounds
– airborne particulate matter (PM). The effects of              represent a significant part of urban pollution with
PM can range from eye and respiratory irritation to             fine particles (PM2.5) whose health cost in terms of
cardiovascular disease, lung cancer and consequent              premature deaths is estimated at USD 1.8 trillion in
premature death. Exposure to high levels of ground-level        OECD countries and USD 3.0 trillion in the BRIICS
ozone, caused by NOx and volatile organic compounds             countries (Brazil, Russia, India, Indonesia, China
that react under the influence of heat and the sun,             and South Africa) (Roy and Braathen, 2017). For
increases the risk of premature death from lung disease         example, nitrogen-containing aerosols accounted
and also affects vegetation by damaging leaves and              for an estimated 30% of PM2.5 emissions measured
reducing growth. NH3 can also be harmful to vegetation,         in Beijing from June 2014 to April 2015 (Huang et al.,
especially lower plants, through direct damage to leaves.       2017).

        Did you know?
         The atmosphere
        we breathe is 78%
          dinitrogen (N2).
       However, if we had
      to rely on dinitrogen
      only, it would be like
       floating on the sea,
          dying of thirst.

2 . OECD POLICY HIGHLIGHTS | Human Acceleration of the Nitrogen Cycle: Managing Risks and Uncertainty
POLICY HIGHLIGHTS
When adding ground-level ozone pollution, of which         N2O contributes not only to climate change but also
nitrogen is also a precursor, health costs amount to       to the depletion of the stratospheric ozone layer,
USD 1.9 trillion in OECD countries and USD 3.2 trillion    which protects life on Earth by absorbing some of
in BRIICS countries (Roy and Braathen, 2017).              the ultraviolet rays from the sun. With the phasing-
                                                           out of chlorofluorocarbons (CFCs), N2O has become a
Despite a steady decline in NOx emissions since            major depleting threat for ozone in the stratosphere
2000, most EU countries have at least one city where       (Ravishankara et al., 2009) and is currently unregulated
the annual average concentration of NO2 exceeds            by the Montreal Protocol on Substances that Deplete
(sometimes considerably) the EU’s legal limit values,      the Ozone Layer.
which are set equal to the World Health Organisation
(WHO) Air Quality Guideline (OECD, 2017).                  SOIL

GREENHOUSE BALANCE AND THE STRATOSPHERIC                   Many of the natural transformations involved in
OZONE LAYER                                                the biogeochemical nitrogen cycle are carried out
                                                           by microorganisms in soil. Conversion of N2 to
Microbial “denitrification” is a key pathway in the        biologically available (“reactive”) nitrogen, a process
nitrogen cycle of soils and oceans, but a pathway          called “fixation”, involves several processes, as part of
that is still poorly understood. Denitrification returns   the nitrogen cycle.
nitrogen from the biosphere to the atmosphere
as N2, thereby closing the nitrogen cycle; this may        Nitrogen-fixing bacteria convert N2 to NH3, which
involve the production of nitrous oxide (N2O) as an        tends to converts into NH4+ in non-alkaline soils.
intermediate product. Human activity – especially          Under aerobic conditions (in the presence of oxygen),
agriculture – is a major source of N2O production.         nitrifying bacteria can oxidise NH4+ to NO3- as an
N2O emissions of crops depend on the type of               energy-yielding process. Because it releases hydrogen,
fertiliser (with emissions typically being higher for      nitrification contributes to the acidification of soils.
urea than for ammonium nitrate) and soil type, with
emissions generally high for clay soils with poor          Under anaerobic conditions (in the absence of
drainage.                                                  oxygen), denitrifying bacteria can use NO3- in
                                                           place of oxygen, reducing it to N2. In the process,
N2O is the third most common long-lived GHG                denitrification may generate N2O.
after carbon dioxide (CO2) and methane. The N2O
greenhouse effect is partially offset by increased CO2     Microbial activity in soils is also driven by
by ecosystems uptake due to nitrogen deposition.           “rhizodeposition” – the release of organic carbon and

      Did you know?
         Microbial
    denitrification is a
   key pathway in the
  nitrogen cycle of soils
       and oceans,
   but a pathway that
       is still poorly
       understood.

                                                   HOW EXCESS NITROGEN THREATENS HEALTH AND THE ENVIRONMENT . 3
THE MODELLING PHILOSOPHY . 4
organic nitrogen (e.g. amino acids) by plant roots Nitrogen finds its way into fresh water via pathways
into their surrounding environment – and microbial that are mainly fed by agriculture, such as
mineralisation of soil organic matter. While the groundwater, drainage water and runoff, as well
available organic carbon and oxygen have a major as direct discharges of wastewater from firms and
impact on total denitrification, the soil pH mainly sewage treatment plants, and atmospheric deposition.
influences the N2O/N2 ratio (the ratio tends to increase Nitrogen pathways in marine water include nitrogen
with decreasing pH). imports by river discharge and precipitation; microbial
fixation of N2; and bacterial remineralisation of dead
The major nitrogen threats to soil quality, for both particulate biomass in sediments.
agricultural soils and natural soils, are related
to acidification and loss of soil biodiversity. Soil Oceanic currents may shift the impact of excess
acidification may lead to a decrease in crop and nitrogen over long distances. For example, nitrogen
forest growth and leaching of components negatively from the Amazonian Basin, where soils are washed
affecting water quality, including heavy metals. away by the rains as a result of deforestation and
Nitrogen may also be lost from soils as NO3-, via intensive agriculture, has largely contributed to the
leaching, or in gaseous forms such as NH3, by proliferation of algae in coastal areas of the Caribbean.
volatilisation, or else N2O and N2, via denitrification.
Climate change could aggravate fresh water pollution
The effect of nitrogen on diversity of soil micro by nitrogen. For example, climate change-induced
organisms and the effects of changes of soil biodiversity precipitation changes alone are projected by one
on soil fertility, crop production and nitrogen emissions recent study to increase runoff nitrogen in U.S.
towards the environment are not fully understood. waterways by 19% on average over the remainder
Very few studies have examined the links between the of the century under a business-as-usual climate
nitrogen cycle, plant activity, and associated changes scenario (Sinha et al., 2017). Ocean dead zones are
in microbial diversity. Despite the significance of soil particularly vulnerable to climate change, which
organic matter in agricultural ecosystems, current exacerbates hypoxic conditions by increasing
knowledge of the soil organic matter dynamics is still sea temperature, ocean acidification, sea level,
limited. New nitrogen source discovered in Earth’s precipitation, and, in some regions, wind and storms
bedrock challenges estimates of carbon sequestration (Altieri and Gedan, 2015).
by natural ecosystems (Houlton et al., 2018).
WATER
Water pollution by nitrogen has high costs for
human health as well as for ecosystems. High
concentrations of NO3- in drinking water can cause
blood disorder in infants and may also increase
risk of colorectal cancer (Schullehner et al., 2018).
NO3- contributes to eutrophication of coastal waters,
which is responsible for algal blooms (including
toxic algal blooms) on the surface and can lead to
the reduction or even the disappearance of oxygen
(“hypoxia”) and thus of fish in the deep waters that
become “dead zones”. There is compelling evidence of
a rapid increase in the number of ocean dead zones
for about 50 years, since the term was first applied
to the hypoxic area of the northern Gulf of Mexico,
which receives large amounts of nutrients from the
Mississippi and Atchafalaya river basins. Robert Diaz,
of the Virginia Institute of Marine Sciences, has so far
identified
Source: W
no less than 884 ocean dead zones in the
world.
4 . OECD POLICY HIGHLIGHTS | Human Acceleration of the Nitrogen Cycle: Managing Risks and Uncertainty
POLICY HIGHLIGHTS
                                                   Did you know?
                                                70% of protected
                                                ecosystems across
                                                  Europe exceed
                                                  critical loads for
                                              eutrophication due to
                                               nitrogen deposition.
                                                       (Posch et al., 2018)

ECOSYSTEMS AND BIODIVERSITY                                             Act were affected by the direct toxicity of
                                                                    nitrogen, by eutrophication of their habitat or by the
Nitrogen reduces the diversity of vegetation primarily              spread of non-native plant species due to nitrogen
through eutrophication and acidification. The                       pollution.
accumulation of extra nutrients (eutrophication) is
harming habitats whose biodiversity developed in                    Little recognition has been given to the
direct response to low nutrient levels. Acidification               environmental consequences of nutrients that fall
is a cumulative problem for non-alkaline soils; as                  from the air as wet and dry deposition onto aquatic
the acid-neutralising capacity of soils gets depleted,              ecosystems. Even if nitrogen deposition rates were
the ecosystems become increasingly sensitive to                     to be significantly reduced in the future, habitat
additional acid inputs. More generally, ecosystem                   recovery can be very slow (Stevens, 2016).
responses to the form of nitrogen (e.g. NO3–, NH3, NH4+,
nitrogen-containing aerosols, ground-level ozone)                   Excess nitrogen (and phosphorus) in water can cause
are complex and habitat dependent, with conversion                  overstimulation of growth of aquatic plants and
between nitrogen forms resulting from the activities                algae. Excessive growth of these organisms, in turn,
of soil microbes.                                                   can use up dissolved oxygen as they decompose,
                                                                    and block the passage of light to deeper waters.
Habitat changes caused by nitrogen excess may affect                Eutrophication of lakes and coastal areas can occur,
all taxonomic groups. Hernández et al., 2016 showed                 which produces unsightly scums of algae on the
that 78 of the 1 400 species of invertebrates, vertebrates          water surface, can occasionally result in fish kills,
and plants listed under the US Endangered Species                   and can even “kill” a lake by depriving it of oxygen.

Table 1. KEY THREATS OF EXCESSIVE RELEASE OF NITROGEN INTO THE ENVIRONMENT

 Environmental issue    Adverse impact on health             Main form of nitrogen       Main activity
                        and the environment                  involved

 Water                  Freshwater and marine water          Nitrate (NO3–)              Agriculture, atmospheric deposition,
                        pollution                                                        sewage discharge
 Air                    Effects on human health              Nitrogen oxides (NOx)       Burning fossil fuels to a large extent
                        and vegetation                       Ammonia (NH3)               Manure storage and spreading
                                                             Particulate matter          Formed from NOx and NH3 precursors
                                                             Ground-level ozone          Formed from NOx precursor
 Greenhouse balance     Climate change and ozone             Nitrous oxide (N2O)         Agriculture to a large extent
 and ozone layer        layer depletion

 Ecosystems and         Eutrophication and acidification     Nitrate, ammonium (NH4+)    Agriculture, atmospheric deposition,
 biodiversity           of terrestrial ecosystems            and organic nitrogen        sewage discharge
                        and freshwater and marine
                        ecosystems
 Soil                   Soil acidification                   Chemical fertilisers and    Agriculture
                                                             organic nitrogen

                                                           HOW EXCESS NITROGEN THREATENS HEALTH AND THE ENVIRONMENT . 5
2
Understanding the “Nitrogen Cascade”
In contrast with many other pollutants, nitrogen can change form and go a long way once released
into the environment. As it moves through the biogeochemical pathways, the same nitrogen atom
can cause a sequence of negative effects – in the atmosphere, in terrestrial ecosystems, in freshwater
and marine systems, and on the climate.
For example, the biogeochemical path of a nitrogen              Many transformations of nitrogen in various forms
atom from its point of formation could be the                   contribute to its movement within and between
following. NOx emissions from cars and power plants             terrestrial, atmospheric, and aquatic ecosystems. As
can form NO2, a vector of asthma, then create ground-           a result, the intended beneficial effects of a policy for
level ozone (O3), a component of smog, and then be              one ecosystem may become unintended detrimental
converted to nitric acid (HNO3), a major component              effects for adjacent ecosystems, or even within the
of acid deposition; or, NOx can combine with NH3 to             ecosystem in which nitrogen is released.
form fine particles of ammonium nitrate (NH4NO3),
the inhalation of which can cause serious health                Agricultural practices, in particular, can have
problems. Once removed from the atmosphere, nitric              unintended consequences if the nitrogen cascade is
acid and ammonium nitrate particles can cause both              not taken into account. Increased use of commercial
fertilisation and acidification of soils, which in turn         nitrogen fertiliser in the United States, by 72%
(via NO3- runoff and leaching) can lead to acidification        between 1970 and 2010, for example, has fuelled
and eutrophication of freshwater. NO3- can then be              an increase in yields but has also posed increased
transported to coastal areas, where it contributes to           risks to environmental quality. The Natural Resource
the formation of dead zones: when fishermen trawl               Conservation Service (NRCS) of the U.S. Department
in these areas, little to nothing is caught. Finally,           of Agriculture evaluated the use of conservation
bacteria can convert reactive nitrogen in soil and              practices on U.S. cropland in major river basins using
water into N2O, contributing to the greenhouse                  survey data collected over 2003-06. The NRCS found
effect in the troposphere and the destruction of the            that, on the whole, a great deal of improvement
ozone layer in the stratosphere. This complex web               was needed. For example, injecting or incorporating
of transformations has been called the “nitrogen                inorganic and organic nitrogen fertiliser into the soil
cascade” (Figure 1).                                            reduces atmospheric losses, but can increase nitrate
                                                                leaching. Fertilising only during the growing season
                                                                can reduce nitrate loss to water but may increase
       Did you know?                                            nitrous oxide emissions to the atmosphere.

      Nitrogen dioxide                                          The “cascading nature” of nitrogen flows in
                                                                the environment suggests there are benefits to
    (NO2) and ammonia                                           coordination of practices, and of policies to incentivise
     (NH3) are not only                                         them, rather than piecemeal control. Focusing on
                                                                one particular environmental medium, such as air,
      air pollutants, but                                       can create incentives for management that result in
     they can also form                                         degradation in a different medium, such as water.

     ammonium nitrate                                           In general, not creating pollution in the first place

     (NH4NO3) particles                                         avoids the problems posed by trying to control
                                                                different nitrogen pathways. In the case of cropland,
    that are particularly                                       application of the 4R concept (the right type of
                                                                fertiliser at the right rate applied at the right time
     harmful to health.                                         in the right place) to achieve better nitrogen use
                                                                efficiency reduces nitrogen loss along all pathways,
                                                                avoiding the trade-offs characteristic of most other
                                                                conservation practices.

6 . OECD POLICY HIGHLIGHTS | Human Acceleration of the Nitrogen Cycle: Managing Risks and Uncertainty
POLICY HIGHLIGHTS
Figure 1. THE NITROGEN CASCADE AND ITS IMPACTS

The Nitrogen Cascade                                      Atmospheric
                                                                                              stratosphere      ozone depletion

                                                          ozone       particulate matter      troposphere      greenhouse gases
  “NEW”NITROGEN

  Energy production              NOx
  and combustion of fossil fuels
                                                                                                                                    NOx
                                                                                                  NOy NOx Norg                      NH3
  Food production                  NHx                                                                                              Norg
  and creation of synthetic fertilisers
                                                          Terrestrial                                        Vegetated                     N2O

                                                               ecosystems acidification
                                                                                                   Forests             Grasslands

                                                               ecosystem productivity

                                                                                                               Soils

                                                NOy
                                                NHx                   Agriculture                            Populated
                                                Norg

                                                              Crops              Animals            People             Landscape

                                                                         Soils                                 Soils

                                                                                                  NOy NHx Norg

                                                          Aquatic
                                                                                                               acidification
                                                                                  Surface water                                                  N2O

                                                                                  and wetlands                eutrophication

                                                                                                                        Oceans

                                                                                                   Coastal bays
                                                                Groundwater
                                                                                                  and estuaries

      denitrification potential

Source: US EPA Science Advisory Board (undated), nrcs.usda.gov/Internet/FSE_DOCUMENTS/nrcs143_008785.pdf.

                                                                                           UNDERSTANDING THE “NITROGEN CASCADE” . 7
3
Nitrogen pathways analysis and risk
management

Three approaches exist to counter nitrogen pollution:           that contribute to this impact. Better knowledge
                                                                of these pathways can improve risk management
l   The spatially targeted risk approach seeks to better        by identifying the points of cost-effective policy
    manage well-documented risks of air, soil and water         intervention. For example, for a given risk of water
    pollution and associated ecosystems through a               pollution, reducing the NOx emissions that contribute
    detailed analysis of the biogeochemical pathways            to the risk (by atmospheric deposition) may prove
    between nitrogen sources and impacts (“impact-              more beneficial than reducing nitrogen from land-
    pathway analysis”).                                         based sources when NOx also causes health problems
                                                                prior to deposition.
l   The global risk approach addresses the steady
    increase in nitrous oxide concentrations in the             Impact-pathway analysis (IPA) evaluates the
    atmosphere. Nitrous oxide, which affects climate            pathways that generate an impact (including through
    change and the stratospheric ozone layer, is the            modelling) to estimate the expected benefits of
    only form of nitrogen that has a global impact. It is       possible emissions changes. IPA recognises that
    a long-lived and well-mixed gas in the atmosphere,          nitrogen can move between environmental media
    so the challenges it poses can only be tackled              (air, water, soil and biota) as it travels along pathways
    globally.                                                   from one or more sources to a receptor.

l   The precautionary approach takes into account               IPA can be carried out in four steps:
    the uncertainty of cascading effects and anticipates
    potentially significant long-term impacts, such as          l   First, identify and delineate the different “nitrogen
    the risk of undermining the resilience (of exceeding            emission zones” of relevance to the impact (i.e. the
    the coping capacity) of ecosystems to nitrogen                  “risk area”).
    overload. It aims to monitor and manage trends in
    the excess of nitrogen entering the environment             l   Second, estimate the potential for new or additional
    by measuring the overall effect of the two previous             emission reductions in each emission zone.
    approaches on the national nitrogen balance.
                                                                l   Third, compare the cost-effectiveness of emission
THE SPATIALLY TARGETED RISK APPROACH: USING                         reductions in the different emission zones.
IMPACT-PATHWAY ANALYSIS
                                                                l   Fourth, estimate the co-benefits of reducing
Policies aimed at managing the risks posed by                       nitrogen emissions in the different emission zones
nitrogen often focus on a specific impact without                   – that is, the damage avoided in all of the regions
fully considering the biogeochemical pathways                       through which that nitrogen would cascade.

8 . OECD POLICY HIGHLIGHTS | Human Acceleration of the Nitrogen Cycle: Managing Risks and Uncertainty
POLICY HIGHLIGHTS
The feasibility of IPA raises the issue of cost. As a takes – the “nitrogen cascade” and consequently the
general principle, the level of IPA sophistication extent of damages to human health and ecosystems.
should match the expected level of nitrogen pollution But the “precautionary principle” suggests that this
risk. When major impacts are at stake, a precise and uncertainty should not stop us from acting to limit
detailed IPA is required (Boxes 1 and 2). On the other the amount of nitrogen entering the environment.
hand, when risk levels are low, a basic IPA can be used. According to the precautionary principle, when an
activity raises threats of harm to human health or the
To implement the spatially targeted risk approach, environment, precautionary measures should be taken,
policies need to be not only economically efficient, but even if some cause and effect relationships are not fully
also practically feasible. Public acceptability is vital, established scientifically.
including the agreement of stakeholders to delineate
risk areas and emission zones. Administrative Managing uncertainty does not necessarily require
feasibility issues may also arise: nitrogen pathways a reduction in all emission sources. Rather, the
seldom follow administrative boundaries. precautionary approach should be closely associated
with the risk approach as part of a dual method of
THE GLOBAL RISK APPROACH: MANAGING NITROUS managing human impacts on the nitrogen cycle. A
OXIDE precautionary approach would aim to limit the total
reactive nitrogen load entering the system and, where
IPA does not apply to N2O, because risk exposure – be appropriate, propose measures in addition to and in
it the risk of climate change or the risk of depleting line with risk management measures.
the ozone layer – is global. Delineating emission zones,
even if possible, would be of no use. Indeed, the more The precautionary approach raises the thorny
sources to compare, the more likely it is to find the one question of the limit to be set in terms of the
for which emission reduction is the most cost-effective. nitrogen balance of a country, or even of the planet.
In other words, as many sources of N2O as possible It is too early to discuss any such limit but in the
should be identified, wherever they are in a given meantime, countries could establish an economy-
country, so as to compare the costs – and if possible wide nitrogen balance and begin to monitor and,
the ancillary benefits – of reducing their emissions. as appropriate, manage trends. This would involve
assessing the total amount of nitrogen introduced
Applying a global approach does not necessarily mean into the environment from all sources and monitoring
that each government must aim for a reduction in these sources in order to report – both by source and
N2O emissions. The climate change mitigation goal set overall – the amount of nitrogen released each year,
out in the Paris Agreement does not set an individual also taking into account denitrification. This should
reduction target for each GHG, but rather a global be undertaken in parallel with risk-based efforts to
temperature target. N2O is part of a basket of GHGs manage specific nitrogen impacts.
under the United Nations Framework Convention
on Climate Change (UNFCCC) and countries will
decide how to prioritise GHG emission reductions
across different sectors and gases in their nationally
determined contributions, informed by the five-yearly
global stocktakes envisaged under the Paris Agreement.
THE PRECAUTIONARY APPROACH: ANTICIPATING
LONG-TERM IMPACTS
The increased amount of reactive nitrogen produced
by humans, intentionally (for food production) and
unintentionally (result of fossil fuel combustion and
industrial processes) has enhanced the speed of
nitrogen cycling – the rates at which nitrogen is being
added to and lost from the environment. There remains
uncertainty about exactly what this acceleration of the
nitrogen cycle means for the pathways that nitrogen
NITROGEN PATHWAYS ANALYSIS AND RISK MANAGEMENT . 94
Targeted policies to halt nitrogen pollution
Nitrogen emissions have been reduced in the OECD area over the past three decades, but there are
hotspots of nitrogen pollution in air, soil and water.
OECD countries have adopted measures to reduce long- cumulative concentration of N2O in the atmosphere
range transported air emissions as well as targeted continues to increase (by 6% between 1990 and 2016
measures to reduce local emissions (e.g. in cities and to according to the National Oceanic and Atmospheric
protect sensitive ecosystems). Similarly, measures have Administration of the US Department of Commerce).
been taken to reduce nitrogen discharges into water. Many groundwater bodies are still highly affected
by NO3- contamination. Overall, there is little
Emissions of NOx – from stationary combustion indication of any fundamental improvement in the
installations in the energy sector and from the eutrophication situation in coastal waters as Florida’s
transport sector – felt by 46% between 1990 and 2016; red tide blooms reminded us in the summer of 2018.
during this period, N2O emissions decreased by 12% Florida had to declare the state of emergency, the
(OECD.stat, accessed 3 October 2018). Agricultural spread of toxic algae killing many fish, threatening to
nitrogen surplus, as measured by the OECD nitrogen upturn Florida’s vital summer tourist season.
balance indicator, was reduced on average from 85 kg/
ha in 1992 to 67 kg/ha in 2014 (OECD, 2018a). Two case studies show how impact-pathway
analysis (IPA) can help manage impacts more cost-
However, air quality standards with regard to NO2, effectively by fostering evidence-informed policy
ground-level ozone and PM are still being exceeded making: deposition analysis in urban smog control
regularly, particularly in large urban centres. in Paris, and combined management of atmospheric,
Terrestrial ecosystems are still being affected by ocean and land-based nitrogen inputs to avoid
eutrophication and, to a lower extent, by acidification. eutrophication of the Chesapeake Bay coastal zone in
Although N2O emissions have decreased, the the United States (see Boxes 1 and 2).
Box 1. MONITORING URBAN SMOG IN PARIS
In March 2014, Paris suffered a major peak of particle studies have since revealed that agricultural emissions
pollution that lasted for ten days (Figure 2). IPA revealed that have a significant impact on air quality in many cities. For
half of the coarse particles (PM10) were NH4NO3, secondary example, agriculture contributes to 23% of the background
particles formed by a combination of NOx emitted mainly concentration levels of PM2.5 in the 150 urban areas surveyed
by urban transport and NH3 originating from farming in the EU-28, Norway and Switzerland (Thunis et al., 2017).
activity in distant geographical areas. The other half of the
PM10 originated mainly from primary particles formed by Figure 2. PARTICLE ALERT THRESHOLD EXCEEDED
combustion of biomass (wood heating) and fuel combustion IN PARIS IN MARCH 2014
(including transport).
This IPA finding had a direct implication for policy. It led
the French authorities to argue that it was just as justified
to restrict fertiliser application as it was to restrict traffic
in order to curb urban air pollution. Measures taken
included setting speed limits on roads, making residential
parking free of charge, calling on farmers to temporarily
limit fertiliser use and firms to limit industrial activity, and
promoting the use of public transport.
This example shows how IPA led policymakers to address
pollution emanating not only from the household heating Note: On the left, the Eiffel Tower before the particle pollution episode.
and transport sectors, but also – and this is more unusual – On the right, a photo taken at the same place on 14 March 2014.
from agriculture, which had historically not been considered Source: http://www.natura-sciences.com/environnement/particules-fines-pics-
when thinking about reducing urban air pollution. Other pollution810.html.
10 . OECD POLICY HIGHLIGHTS | Human Acceleration of the Nitrogen Cycle: Managing Risks and UncertaintyPOLICY HIGHLIGHTS
Box 2. CONTROLLING FOR EUTROPHICATION IN CHESAPEAKE BAY
The Chesapeake Bay Watershed covers 90 000 square miles IPA analysis involves a step-by-step approach. First, data
(23 million hectares) across six U.S. states (Delaware, Maryland, from a watershed-scale land use change model and an
Pennsylvania, New York, Virginia, West Virginia) and Washington airshed model as well as other metrics (meteorology,
D.C. Land use is forest (64%), agriculture (24%), urban (8%) and topography, soils, point sources of nitrogen) are transmitted
other (4%). Nitrogen, phosphorus and sediment wash from the to a watershed model. The watershed model then predicts
watershed into the tidal waters of the Bay, resulting in little or the loads of nitrogen, phosphorus, and sediment that
no dissolved oxygen in the bay and tidal rivers every summer. result from the given inputs. The estuarine Water Quality
The low dissolved oxygen content results mainly from the and Sediment Transport Model (WQSTM) (also known as
excessive growth of algae caused by nutrients such as nitrogen the Chesapeake Bay Model) predicts changes in bay water
and phosphorus. The decomposition of dead algae consumes quality due to the changes in input loads provided by
oxygen, depriving fish and other forms of aquatic life. the watershed model. As a final step, dissolved oxygen,
chlorophyll and water clarity are measured to assess
In December 2010, a total maximum daily load (TMDL) of whether Bay water quality standards were attained.
nitrogen and phosphorus allowed to enter the tidal Bay
was set. TMDL applies to land-based nutrient sources in the The combined management of atmospheric, land-based
watershed (agriculture, urban runoff, sewage) and, a first and ocean-based nitrogen inputs in Chesapeake Bay
in the United States, to atmospheric nitrogen deposition reflects the reality of the nitrogen cycle (Figure 3). Such
in the watershed. The relevant “airshed” — the area where an IPA makes the risk management of oxygen loss in the
emission sources contribute most to deposition in the Bay’s bay’s waters more cost-effective. The Chesapeake Bay
watershed — was delineated for NOx and NH3 to model Programme has been effective as a whole since the TMDLs
nitrogen deposition. Another TMDL has been established were introduced, although progress remains to be made to
for direct atmospheric deposition of nitrogen in tidal meet the nitrogen load target of 2025. Estimated nitrogen
waters. Bay pollution management also considers nitrogen loads in the bay watershed decreased by 9% between 2009
exchanges between the Bay and the ocean. and 2016.
Figure 3. REGULATED NITROGEN SOURCES IN THE CHESAPEAKE BAY
Did you know?
Air-based sources
The first reported
(e.g. NOx airshed) ocean dead zone was
the Gulf of Mexico in
the 1960s; today the
gulf is still affected by
Land-based eutrophication and
sources Chesapeake
(watershed) Bay 883 other coastal areas
have been added
to the list of dead
zones, not counting
undeclared areas
(e.g. in the tropics).
Net ocean
exchange
TARGETED POLICIES TO HALT NITROGEN POLLUTION . 11Figure 4. CRITERIA TO GUIDE NITROGEN POLICY MAKING
Policy coherence Policy effectiveness Cost-efficiency
l Food supply l Policy outcomes l Static cost-efficiency
l Energy supply l Policy impacts l Dynamic cost-efficiency
l Environment
POLICY
ASSESSMENT
CRITERIA
Policy feasibility Unintended effects related to the nitrogen cascade
l Administrative and legal feasibility l Positive side effects (synergies)
l Side effects l Negative side effects (pollution swapping)
l Political and public acceptability
l Flexibility to deal with risks and uncertainties
A FRAMEWORK FOR ANALYSING THE MERITS OF support can distort energy production and use, such
NITROGEN MANAGEMENT POLICY INSTRUMENTS as fossil fuel subsidies. Before designing targeted
policies on nitrogen pollution, it is therefore essential
Evaluation criteria are needed to select the right to monitor and evaluate policies with other aims and
risk management or uncertainty management tools their unwanted effects on nitrogen emissions.
(Figure 4). First, it is necessary to evaluate and address
the coherence of sectoral policies (e.g. agricultural For example, China has taken steps to phase out
policy, energy policy) and environmental policies fertiliser subsidies and aims to cap fertiliser use by
(climate policy and others) with the management of 2020. The 2020 Zero-Growth Action Plan for Chemical
nitrogen pollution. Fertilisers and Pesticides aims to reduce the annual
growth of chemical fertiliser use to below 1% for
This first step is crucial to avoid having to introduce the 2015-19 period and achieve zero-growth by 2020
additional policy measures to counter the undesired for major agricultural crops. However, these policy
effects of other existing policies (e.g. the imposition developments need to be weighed against a backdrop of
of a fertiliser tax to counter support to farm inputs), growing support for Chinese farmers, including forms
which would obviously not be economically and of support that distort agricultural production and can
perhaps not even environmentally effective. Second, encourage increased fertiliser use (OECD (2018b).
nitrogen policy instruments that are cost-effective and
whose feasibility of implementation is not problematic Policy coherence must also be sought with
may then be selected. Third, due to the nitrogen environmental policies that are not primarily aimed
cascade, the effects of an instrument targeting one at reducing nitrogen pollution. For example, in New
impact or one form of nitrogen on other impacts or Zealand, a policy to reduce CO2 emissions has helped
forms of nitrogen should be estimated, in order to reduce the leaching of NO3- into water. An Emissions
promote synergies and avoid “pollution swapping”. Trading Scheme (ETS) allows GHG emitters who do
not want to reduce their emissions to enter into
POLICY COHERENCE agreements with farmers who agree to sequester
carbon. With financial compensation, farmers
Just as some forms of agricultural support can distort undertake to convert pastoral lands into forests,
input use and agricultural production and thus have thereby helping to reduce the leaching of NO3- into
negative environmental impacts (such as increased water. GHG emitters receive ETS credits in exchange
nitrogen pollutant emissions), some forms of energy for pastoral land converted to forestry.
12 . OECD POLICY HIGHLIGHTS | Human Acceleration of the Nitrogen Cycle: Managing Risks and UncertaintyPOLICY HIGHLIGHTS
EFFECTIVENESS, COST-EFFICIENCY AND FEASIBILITY and their combinations. The evaluation leads to six
conclusions.
The full report provides a typology of different
nitrogen management policy instruments (e.g. l Instruments should be based on their impact and
pricing instruments, direct environmental regulation, applied as close as possible to the point of emission
financial support instruments, information measures, to maximise effectiveness and cost-efficiency.
and voluntary schemes). Existing policy analysis
methodologies tend to assess the performance l Pricing and direct environmental regulation are
of a policy instrument against the criteria of often most effective in reducing pollution, when
environmental effectiveness and economic efficiency. subject to credible monitoring and enforcement.
But such a view neglects “real world” complications
that often act to limit policy effectiveness, the l “Beneficiary pays” instruments (e.g. public financial
“feasibility” criterion. support), along with voluntary and informational
instruments, are often more politically feasible
Effectiveness gauges whether a policy intervention than “polluter pays” instruments (e.g. pricing
has led to successful practical measures (e.g. the use mechanisms), although they are likely to be less
of catalytic converters in vehicles) or overall benefits effective.
(e.g. reduced disturbance of the nitrogen cycle). Cost-
efficiency asks whether the intervention’s objective is l Combining “polluter pays” with “beneficiary pays”
being achieved at the least cost to society. instruments may be more politically feasible to
achieve a given level of environmental effectiveness
Feasibility of instrument implementation is essential than either employed individually.
if an instrument is to be introduced and function
effectively. The concept may be broken down into l Combining pricing or public financial support
five general aspects: administrative feasibility; side instruments with direct environmental regulation
effects (e.g, on equity, competitiveness, health and may be mutually beneficial for various reasons (e.g.
the environment); political and public acceptability; it reduces vulnerability to market distortions (such
legal compatibility and institutional feasibility, and as split-incentives and environmentally harmful
the flexibility of an instrument (its ability to respond subsidies) as well as the potential to create pollution
to changes and uncertainty). hotspots).
Broader policy assessment criteria are required l Voluntary and information instruments may
to capture these nuances and allow for a more require the lowest administrative capacity (and
rounded evaluation of the relative desirability of produce the least transaction costs). The use of
policy instruments for different applications. The information instruments is likely to increase the
full report evaluates in detail the effectiveness, effectiveness, cost-efficiency or feasibility (or a
cost-efficiency and feasibility of seven categories of combination of these assessment criteria) when
policy instruments (see for example Boxes 3 and 4), combined with all other instrument categories.
TARGETED POLICIES TO HALT NITROGEN POLLUTION . 13Box 3. USING A TRADEABLE PERMIT SYSTEM IN THE GREAT MIAMI RIVER WATERSHED
Around 40% of surface waters in the Great Miami River Effectiveness. By mid-2014, 397 agricultural projects were
watershed of around 10 000 km2 in Southwest Ohio, contracted, generating over 1.14 million credits worth over
United States, were consistently failing to meet regulatory USD 1.6 million, and producing an estimated 572 metric ton
water quality standards. In response, the regional water reduction in nutrient discharges to surface waters in the
management agency, the Miami Conservancy District (MCD), watershed.
in 2004 introduced the Great Miami Watershed Trading
Programme (GMWTP) as a pilot scheme for a cost-effective Cost-efficiency. Trades completed have thus far produced
approach to improving water quality, in anticipation of a cost of USD 1.48/lb of nutrient abated. This is significantly
regulatory measures to set nutrient release limits on point- less than the estimated USD 4.72/lb abated estimated for
source wastewater treatment plants (WWTPs). measures implemented directly by WWTPs, suggesting
significantly higher cost-efficiency than a regulatory approach
Agricultural activities cover around 70% of land in the applied to point sources only.
watershed, are the primary contributor to the excess nutrient
release and are able to achieve nutrient reductions at a lower Feasibility. The cost-effective nature of the GMWTP makes it
cost than WWTPs. The GMWTP encourages farmers to adopt popular amongst WWTPs. During formulation of the GMWTP,
voluntary “best practice” measures to generate Emission over a hundred meetings took place with a wide range of
Reduction Credits (ERCs), which may be traded to WWTPs to stakeholders, leading to wide acceptance and support for the
allow for future regulatory compliance. instrument.
Box 4. DIRECT ENVIRONMENTAL REGULATION: JAPAN’S AUTOMOBILE NOX AND PM LAW
In Japan, levels of NOx pollution continued to rise the registration of high-polluting vehicles and enforcing the
throughout the 1980s as a result of increasing vehicle replacement of those already in circulation – was the key
traffic. In response, the 1992 Law Concerning Special factor behind this result.
Measures for Total Emission Reduction of Nitrogen Oxides
from Automobiles in Specified Areas (NOx Law) was Cost-efficiency. The NOx Law cost up to JPY 521 billion
enacted. (around USD 5 billion). The total social benefits of the
regulation – including reduced health impacts and spillover
The law required the prefectures of the large urban areas effects in neighbouring, non-obligated regions – are likely to
of Tokyo and Osaka to establish and implement local plans have exceeded this cost by at least double.
to reduce NOx emissions from vehicles. In 2001 PM was
added as a target substance, and Nagoya was added as an Feasibility. Public pressure, along with an increasing
additional obligated prefecture. number of successful lawsuits filed by organisations
representing victims of pollution-related health damage,
Effectiveness. NOx emissions decreased around 20% had already led to a succession of anti-pollution laws from
between 2000 and 2009 in the areas subject to the revised the 1960s onwards. The resulting awareness of pollution-
law, twice the rate experienced outside the obligated related health issues in the population is likely to have
prefectures. Regulating vehicle types – including banning provided support for the NOx and PM law.
NITROGEN AS A “CASCADING TARGET” It is therefore necessary to assess risk-risk trade-offs
of various policies or best management practices,
Whatever the policy approach – risk or precautionary whether in agriculture, fossil fuel combustion,
– nitrogen policy instruments also need to be refined industrial processes or treatment of wastewater.
by evaluating their unintended effects on other forms
of nitrogen due to the nitrogen cascade – the fact For example, using selective catalytic reduction (SCR)
that once fixed, nitrogen tends to change form. In systems to reduce NOx emissions from vehicles raises
particular, efforts to lessen the impacts caused by new concerns about emissions of the by-products NH3
nitrogen in one area of the environment should (i) not and N2O. In contrast, tertiary treatment of sewage to
result in unintended nitrogen impacts in other areas remove NO3- also reduces N2O emissions from sewage.
(“pollution swapping”), and (ii) seize opportunities to However, the incineration of sewage sludge (as is the
reduce other nitrogen impacts (“synergy” effects). norm in Switzerland, for example) releases NOx.
14 . OECD POLICY HIGHLIGHTS | Human Acceleration of the Nitrogen Cycle: Managing Risks and UncertaintyCONCLUSION
Responding to nitrogen pollution in a cost- POLICY HIGHLIGHTS
effective way requires a threefold approach:
better managing the risks of air, soil, water
and ecosystem pollution; halting the steady
increase in nitrous oxide concentrations in
the atmosphere; and, preventing excess
nitrogen from entering the environment.
CONCLUSION . 15REFERENCES
Altieri, A.H. and K.B. Gedan (2015), “Climate Change Ravishankara, A.R. et al. (2009), « Nitrous Oxide (N2O):
and Dead Zones”, Global Change Biology, 21(4), Wiley, the Dominant Ozone-depleting Substance Emitted
Hoboken. in the 21st Century”, Science, 326(5949).
Fowler, D. et al. (2013), “The Global Nitrogen Roy, R. and N. Braathen (2017), “The Rising Cost
Cycle in the Twenty-first Century”, Phil. of Ambient Air Pollution thus far in the 21st
Trans. R. Soc. B, 368(1621), The Royal Society, Century: Results from the BRIICS and the OECD
London, http://rstb.royalsocietypublishing.org/ Countries”, OECD Environment Working Papers, N° 124,
content/368/1621/20130164. OECD Publishing, Paris,
doi.org/10.1787/d1b2b844-en.
Hernández, D. L. et al. (2016), “Nitrogen Pollution
is Linked to US Listed Species Declines”, Schullehner, J. et al. (2018), « Nitrate in Drinking
BioScience, 66(3), Oxford University Press, Water and Colorectal Cancer Risk: A Nationwide
Oxford, https://academic.oup.com/bioscience/ Population‐based Cohort Study”, International Journal
article/66/3/213/2468675. of Cancer, 23 February (Epub ahead of print).
Houlton, et al. (2018), “Convergent Evidence for Sinha, E. et al. (2017), “Eutrophication will Increase
Widespread Rock Nitrogen Sources in Earth’s During the 21st Century as a Result of Precipitation
Surface Environment”, Science, 360(6384). Changes”, Science, 357(6349), American
Association for the Advancement of Science,
Huang, X. et al. (2017), “Chemical Characterization Washington, D.C., http://science.sciencemag.org/
and Synergetic Source Apportionment of PM2.5 at content/357/6349/405.
Multiple Sites in the Beijing–Tianjin–Hebei Region,
China”, Atmospheric Chemistry and Physics, 17, Stevens, C.J. (2016), “How Long do Ecosystems Take to
European Geosciences Union, Munich, Recover from Atmospheric Nitrogen Deposition?”,
www.atmos-chem-phys.net/17/12941/2017/. Biological Conservation, 200.
OECD (2018a), “Agri-environmental Indicators: Nutrient Stocker, B.D. et al. (2016), “Terrestrial Nitrogen Cycling
Balances”, paper presented to the Joint Working in Earth System Models Revisited”, New Phytologist,
Party on Agriculture and the Environment at its 210(4), doi.org/10.1111/nph.13997.
meeting on 22-23 October 2018, (COM/TAD/CA/
ENV/EPOC(2018)5/REV1). Thunis, P. et al. (2017), Urban PM2.5 Atlas - Air Quality
in European Cities, European Commission, Joint
OECD (2018b), Agricultural Policy Monitoring and Research Centre, JRC108595, EUR 28804 EN,
Evaluation 2018, OECD Publishing, Paris, Publications Office of the European Union,
doi.org/10.1787/agr_pol-2018-en. Luxembourg.
OECD (2017), Green Growth Indicators 2017, OECD Townsend, A.R. and R. W. Howarth (2010), “Fixing the
Publishing, Paris, doi.org/10.1787/9789264268586-en. Global Nitrogen Problem”, Scientific American, (302)2.
Posch, M. et al. (2018), “The 2017 Critical Loads Data: USEPA-SAB (2011), Reactive Nitrogen in the United
Differences to Earlier Estimates and Implications States: An Analysis of Inputs, Flows, Consequences and
for Current and Future Ecosystems Protections”, Management Options, U.S. Environmental Protection
CIAM Report 1/2018, Centre for Integrated Agency’s Science Advisory Board, EPA-SAB-11-013,
Assessment Modelling, International Institute USEPA, Washington D.C., yosemite.epa.gov/sab/
for Applied Systems Analysis (IIASA), Laxenburg, sabproduct.nsf/WebBOARD/INCFullReport/$File/
Austria, www.unece.org/fileadmin/DAM/env/ Final%20INC%20Report_8_19_11(without%20
documents/2018/Air/EMEP/CIAM-2018_report.pdf. signatures).pdf.
16 . OECD POLICY HIGHLIGHTS | Human Acceleration of the Nitrogen Cycle: Managing Risks and UncertaintyPOLICY HIGHLIGHTS
NITROGEN’S DARK SIDE
N2 gas, the most abundant component of the earth’s atmosphere, is harmless. But, reactive forms emanating from the burning of
fossil fuels in power plants, cars and residential heating, from overuse as inputs for agricultural production and certain industrial
productions, and from waste and sewage create risks and generate uncertainty for human health and the environment.
1 The nitrogen produced during fossil-fuel
combustion can cause severe air pollution ...
Human sewage
Residential heating Car traffic Power plant
2 ... before it deposits on soils ...
Fertilised field Waste and sewage Industry
3 ... joins with excess nitrogen from fertilised fields, waste and sewage, and factories ...
4 ... can harm terrestrial biodiversity ...
before entering rivers and groundwater
where it can contaminate drinking
water ... then reaching the oceans
where it can lead to algal
blooms and the creation
of coastal dead
zones.
Algal blooms
Dead zone
In soils and water, denitrifying bacteria reconvert the reactive forms of nitrogen to inert N2. In doing so, however, they often generate
nitrous oxide, a potent greenhouse gas that also depletes the stratospheric ozone layer.
Source: Adapted from Townsend and Howarth (2010).The OECD publication Human Acceleration of the Nitrogen Cycle:
Managing Risks and Uncertainty examines the risks associated
with the release of excessive nitrogen into the environment
(climate change, depletion of the ozone layer, air pollution,
water pollution, loss of biodiversity, deterioration of soil quality).
The report also examines the uncertainty associated with the
ability of nitrogen to move from one ecosystem to another and
cause “cascading effects”. In addition to better management of
nitrogen risks at the local level, there is a need to consider the
global risks associated with the continued increase in nitrous
oxide concentrations and to prevent excess nitrogen in all its
forms by developing cost-effective strategies for all its sources.
Other than the reduction of nitrogen pollution, this report
provides guidance on the use of nitrogen policy instruments
and how to ensure coherence with objectives such as food
security, energy security and environmental objectives.
For more information:
https://doi.org/10.1787/9789264307438-en
Gérard.Bonnis@oecd.org
Simon.Buckle@oecd.org
http://oe.cd/nitrogen-report
© OECD
Environment
@OECD_ENV Directorate,
November 2018You can also read