Monitoring and assimilation tests with TROPOMI data in the CAMS system: near-real-time total column ozone - Atmos. Chem. Phys
←
→
Page content transcription
If your browser does not render page correctly, please read the page content below
Atmos. Chem. Phys., 19, 3939–3962, 2019
https://doi.org/10.5194/acp-19-3939-2019
© Author(s) 2019. This work is distributed under
the Creative Commons Attribution 4.0 License.

Monitoring and assimilation tests with TROPOMI data in the
CAMS system: near-real-time total column ozone
Antje Inness1 , Johannes Flemming1 , Klaus-Peter Heue2 , Christophe Lerot3 , Diego Loyola2 , Roberto Ribas1 ,
Pieter Valks2 , Michel van Roozendael3 , Jian Xu2 , and Walter Zimmer2
1 ECMWF,  Shinfield Park, Reading, RG2 9AU, UK
2 German Aerospace Centre (DLR), Remote Sensing Technology Institute, Oberpfaffenhofen, 82234 Wessling, Germany
3 BIRA-IASB, Brussels, Belgium

Correspondence: Antje Inness (a.inness@ecmwf.int)

Received: 29 October 2018 – Discussion started: 6 November 2018
Revised: 12 February 2019 – Accepted: 11 March 2019 – Published: 28 March 2019

Abstract. The TROPOspheric Monitoring Instrument                   the CAMS analysis also show some dependency on scan
(TROPOMI) on board the Sentinel-5 Precursor (S5P) satel-           position.
lite launched in October 2017 yields a wealth of atmospheric          The assimilation of TROPOMI TCO3 has been tested in
composition data, including retrievals of total column ozone       the CAMS system for data between 60◦ N and 60◦ S and
(TCO3) that are provided in near-real-time (NRT) and off-          for solar elevations greater than 10◦ and is found to have
line. The NRT TCO3 retrievals (v1.0.0–v1.1.2) have been            a small positive impact on the ozone analysis compared to
included in the data assimilation system of the Copernicus         Brewer TCO3 data and an improved fit to ozone sondes in the
Atmosphere Monitoring Service (CAMS), and tests to mon-            tropical troposphere and to IAGOS aircraft profiles at West
itor the data and to carry out first assimilation experiments      African airports. The impact of the TROPOMI data is rela-
with them have been performed for the period 26 Novem-             tively small because the CAMS analysis is already well con-
ber 2017 to 30 November 2018. The TROPOMI TCO3 data                strained by several other ozone retrievals that are routinely
agree to within 2 % with the CAMS analysis over large parts        assimilated. When averaged over the periods February–April
of the globe between 60◦ N and 60◦ S and also with TCO3            and September–October 2018, differences between experi-
retrievals from the Ozone Monitoring Instrument (OMI) and          ments with and without assimilation of TROPOMI data are
the Global Ozone Monitoring Experiment-2 (GOME-2) that             less than 2 % for TCO3 and less than 3 % in the vertical for
are routinely assimilated by CAMS. However, the TCO3               seasonal mean zonal mean O3 mixing ratios, with the largest
NRT data from TROPOMI show some retrieval anomalies                relative differences found in the troposphere.
at high latitudes, at low solar elevations and over snow/ice
(e.g. Antarctica and snow-covered land areas in the Northern
Hemisphere), where the differences with the CAMS analysis
and the other data sets are larger. These differences are          1   Introduction
particularly pronounced over land in the NH during winter
and spring (when they can reach up to 40 DU) and come              The Copernicus Atmosphere Monitoring Service (CAMS,
mainly from the surface albedo climatology that is used in         https://atmosphere.copernicus.eu/, last access: 22 March
the NRT TROPOMI TCO3 retrieval. This climatology has               2019) produces daily global near-real-time (NRT) forecasts
a coarser horizontal resolution than the TROPOMI TCO3              of atmospheric composition up to 5 days ahead and a range
data, which leads to problems in areas where there are large       of other data sets on global and regional atmospheric com-
changes in reflectivity from pixel to pixel, e.g. pixels covered   position, such as near-real-time estimates of fire emissions,
by snow/ice or not. The differences between TROPOMI and            reanalyses of atmospheric composition and greenhouse gas
                                                                   forecasts and analyses. To improve the quality of the global
                                                                   CAMS forecasts, the initial conditions for some of the

Published by Copernicus Publications on behalf of the European Geosciences Union.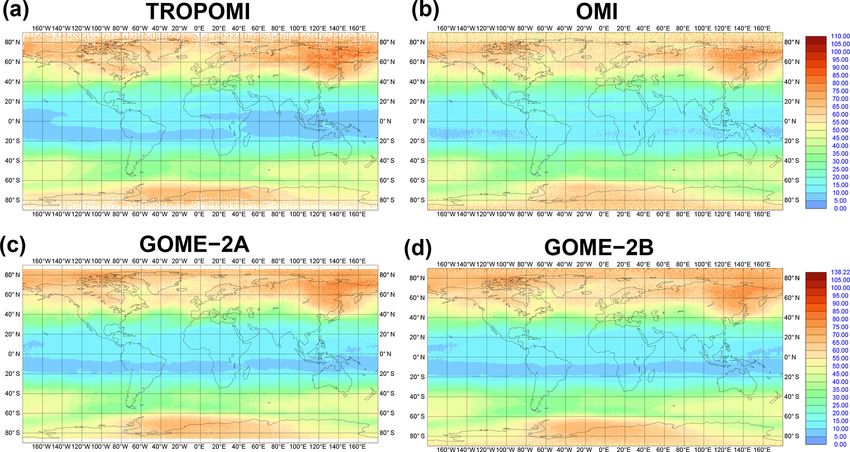
3940                                               A. Inness et al.: Monitoring and assimilation tests with TROPOMI data

chemical species, including ozone (O3 ), carbon monoxide          han and Douglass, 2018; Weber et al., 2018) and predictions
(CO), nitrogen dioxide (NO2 ), sulfur dioxide (SO2 ) and for      suggest it should return to pre-1980s levels by the 2060s
aerosols are improved by assimilating satellite retrievals of     (Newman et al., 2006). Stratospheric ozone destruction also
atmospheric composition using the 4-dimensional variations        happens on a smaller scale over the Arctic in boreal spring
(4D-Var) data assimilation system (Benedetti et al., 2009; In-    (Manney et al., 2011), while ozone downward trends in the
ness et al., 2013, 2015; Massart et al., 2014) of the European    middle–low-latitude lower stratosphere are related to atmo-
Centre for Medium-Range Weather Forecasts (ECMWF).                spheric dynamics (Chipperfield et al., 2018).
   A wealth of new atmospheric composition data has be-              Ozone interacts with radiation and is therefore an im-
come available with the launch of the Sentinel-5 Precur-          portant parameter in radiation schemes used in numerical
sor (S5P) satellite in October 2017. S5P carries the TRO-         weather prediction (NWP) models (e.g. Hogan et al., 2017),
POspheric Monitoring Instrument (TROPOMI), which pro-             where an improved representation of the ozone field can lead
vides high-resolution spectral measurements in the ultravio-      to improvements in weather forecasting or climate simula-
let (UV), visible (Vis), near infrared (NIR) and shortwave-       tions. Ozone and the assimilation of ozone retrievals was
infrared (SWIR) parts of the spectrum. This wide spectral         therefore included in the ECMWF Integrated Forecast Sys-
range allows several atmospheric trace gases to be retrieved,     tem (IFS) system in the late 1990s (Hólm et al., 1999) and a
e.g. O3 , NO2 , SO2 and HCHO from the UV–Vis, and CO              stratospheric ozone parameterization based on Cariolle and
and CH4 from the SWIR part of the spectrum. These species         Teyssèdre (2007) is still used in the operational ECMWF
are all included in the CAMS system, making TROPOMI               NWP system, where ozone retrievals and ozone sensitive ra-
the perfect instrument to provide observations for the CAMS       diances are assimilated (Dethof and Hólm, 2004; Dragani
NRT analysis at unprecedented horizontal resolution of about      and McNally, 2011; Dragani, 2013). Because this strato-
3.5 km × 7 km for the TROPOMI UV–Vis and 7 km × 7 km              spheric ozone parameterization does not provide realistic tro-
for the SWIR products. In this paper, we evaluate TROPOMI         pospheric ozone fields, a comprehensive tropospheric chem-
NRT total column ozone (TCO3) retrievals (v1.0.0–v1.1.2)          istry scheme is used in the CAMS system (Flemming et al.,
produced by the Deutsche Zentrum für Luft- und Raum-              2015, 2017).
fahrt (DLR) against the CAMS ozone analysis for the pe-              It is hoped that by adding the assimilation of TROPOMI
riod 26 November 2017 to 30 November 2018 and carry out           TCO3 NRT data to the CAMS system, CAMS ozone anal-
first assimilation tests with the TROPOMI TCO3 data in the        yses and forecasts will be improved and resilience will be
CAMS system. The satellite was still in its commissioning         added to the system to protect against the loss of any of
phase until 24 April 2018, which was mainly used for func-        the older instruments with TCO3 retrievals that are currently
tional testing, in-flight calibration and testing of processing   assimilated by CAMS (see Table 1 below). In a first step,
chains. Nevertheless, observations were available in these        the TROPOMI TCO3 data are monitored passively with the
early months and are included in our study as their quality       CAMS system. This means they are included in the CAMS
was good enough to allow us to prepare the CAMS system            data assimilation system. The model fields are interpolated
for the new data.                                                 in time and space to the location of the observations and
   Ozone plays an important role in tropospheric chemistry.       the model equivalents of the observations are calculated, al-
Tropospheric ozone is a regional-scale pollutant and, at high     lowing temporal and spatial statistics of the differences be-
concentrations near the surface, harmful to humans and veg-       tween the observations and collocated model fields to be de-
etation. Photolysis of ozone, followed by reaction with water     termined. However, the data are not actively used in the as-
vapour, provides the primary source of the hydroxyl radical.      similation at this stage and do not influence the analysis and
Ozone is also a significant greenhouse gas, particularly in the   subsequent forecast yet. In a second step, the active assimila-
upper troposphere (Hansen et al., 1997). Tropospheric ozone       tion of the TROPOMI TCO3 data is tested and their impact
is formed when nitrogen oxides (NOx ), CO and volatile or-        on the CAMS ozone analysis is assessed by looking at inde-
ganic compounds (VOCs) react in the presence of sunlight.         pendent validation data.
In urban areas in the Northern Hemisphere (NH), high ozone           The differences between the observations and the model
levels usually occur during spring and summer. About 90 %         fields are called departures. We distinguish between first-
of the total ozone amount resides in the stratosphere, a result   guess departures (observations minus model first-guess field)
of oxygen photolysis as first explained by Chapman (Chap-         and analysis departures (observations minus analysed field).
man, 1930). This ozone layer absorbs a large part of the          The first-guess field is a forecast initialized from the previous
sun’s harmful UV radiation. Anthropogenic chlorofluorocar-        analysis cycle that is not changed by the analysis increments
bons led to a global decrease in the ozone total column, with     of the current analysis cycle. If the model fields are stable
potentially catastrophic consequences avoided thanks to the       the departures normally show a relatively smooth behaviour
Montreal Protocol (Newman et al., 2009). Over Antarctica,         from day to day. Long-term monitoring of the departures can
ozone destruction during austral spring still leads to strong     disclose errors and biases in the satellite data products, as
and rapid depletion of the ozone layer (“ozone hole”). There      well as errors or biases in the model. Because the departures
is evidence that the ozone hole is slowly recovering (Stra-       are smaller than the absolute observation values, they show

Atmos. Chem. Phys., 19, 3939–3962, 2019                                            www.atmos-chem-phys.net/19/3939/2019/

A. Inness et al.: Monitoring and assimilation tests with TROPOMI data                                                                    3941

Table 1. O3 satellite retrievals used in this paper. QF is quality flag given by data providers, SOE is solar elevation, LAT is latitude, VarBC
is variational bias correction. The blacklist criteria describe when data were not used.

    Instrument/        Data product            Data provider/       Blacklist criteria/     VarBC predictors       Reference
    satellite                                  version              thinning
    GOME-2/            TCO3                    AC-SAF/              QF > 0                  Solar elevation        Hao et al. (2014),
    Metop-A                                    DLR GDP4.8           SOE < 6◦                Global constant        Valks et al. (2017)
                                                                    Thinned to
                                                                    0.5 × 0.5◦
    GOME-2/            TCO3                    AC-SAF/              QF > 0                  Solar elevation        Hao et al. (2014),
    Metop-B                                    DLR GDP4.8           SOE < 6◦                Global constant        Valks et al. (2017)
                                                                    Thinned to
                                                                    0.5 × 0.5◦
    MLS/               O3 profiles             NASA V3.4            QF > 0                  Not applied            Schwartz et al. (2015)
    Aura                                                            No thinning
    OMI/               TCO3                    NASA V883            QF > 0                  Solar elevation        Liu et al. (2010)
    Aura                                                            SOE < 10◦               Global constant
                                                                    Thinned to
                                                                    0.5 × 0.5◦
    OMPS (nadir)/      O3 partial columns      NOAA/                QF > 0                  Solar elevation        Flynn et al. (2014)
    Suomi NNP                                  Eumetsat v1r0        SOE < 10◦               Global constant
                                                                    No thinning
    SBUV/2/            O3 partial columns      NOAA V8              QF > 0                  Not applied            Bhartia et al. (1996),
    NOAA-19                                                         SOE < 6◦                                       McPeters et al. (2013)
                                                                    No thinning
    TROPOMI/           TCO3                    ESA/ DLR             QF > 0                  Solar elevation        Loyola et al. (2019a)
    Sentinel-5P                                v1.0.0-v1.1.2        SOE < 10◦               Global constant
                                               (see Table 2)        Abs (LAT) < 60◦
                                                                    Super-obbed to
                                                                    T511

day-to-day changes better than when looking at the absolute               well as the TROPOMI TCO3 NRT retrievals and how they
model fields or observation values. A sudden jump in the de-              are used in the CAMS system. Section 3 shows the results
partures on a global scale, which is larger than the instrument           of monitoring experiments with the TROPOMI TCO3 data,
noise, can be an indication of problems in the observations or            results from first assimilation tests with the data and the val-
the model.                                                                idation of the resulting ozone analyses with independent ob-
   Including TROPOMI TCO3 data passively in the CAMS                      servations. Section 4 gives the conclusions.
system enables us (1) to carry out a continuous quality as-
sessment of the data, (2) to detect biases between different
satellite retrievals (e.g. between TCO3 from TROPOMI and                  2     Model and observations
the Ozone Monitoring Instrument, OMI, or the Global Ozone
Monitoring Experiment-2, GOME-2) and (3) allows us to                     2.1    CAMS model and data assimilation system
monitor instrument and algorithm stability. The advantage
of using an assimilation system to monitor satellite data is              The chemical mechanism of the IFS is an extended ver-
that it provides continuous global coverage and allows us to              sion of the Carbon Bond Mechanism 5 (CB05, Huijnen et
build up global and regional statistics quickly. If the monitor-          al., 2010), originally implemented in the chemical trans-
ing shows the data to be of good quality (e.g. departures are             port model (CTM) Transport Model 5 (TM5), and is doc-
stable, there are no sudden jumps, the biases with respect to             umented in Flemming et al. (2015, 2017). This is a tropo-
the model are small), assimilation tests with the data usually            spheric chemistry scheme, and for stratospheric ozone the
follow.                                                                   chemical tendencies above the tropopause are computed by
   This paper is structured in the following way. Section 2               a parameterization based on Cariolle and Teyssèdre (2007).
describes the CAMS model and data assimilation system as                  The spatial resolution of the model is approximately 40 km
                                                                          (T511 spectral and 0.35◦ × 0.35◦ grid), i.e. coarser than

www.atmos-chem-phys.net/19/3939/2019/                                                       Atmos. Chem. Phys., 19, 3939–3962, 2019
3942                                                A. Inness et al.: Monitoring and assimilation tests with TROPOMI data

Table 2. Version numbers of TROPOMI data used in this study.

       Period                      Version number    Algorithm                         Description of changes
       26 Nov 2017–3 May 2018      v1.0.0            Reprocessed with NRT algorithm    Original algorithm
       11 Jun–18 Jul 2018          v1.0.0            NRT                               Original algorithm
       18 Jul–8 Aug 2018           v1.1.1            NRT                               Minor bug fixes, no algorithm changes.
                                                                                       QA_values introduced
       8 Aug–30 Nov 2018           v1.1.2            NRT                               Bug fix to time variable

the 3.5 km × 7 km resolution of the TROPOMI TCO3 data.             and a global constant as predictors, while the partial column
The CAMS system uses MACCity anthropogenic emissions               SBUV/2 and the profile MLS data are used to anchor the
(Granier et al., 2011), biomass burning emissions from the         bias correction, i.e. are assimilated without correction. Expe-
Global Fire Assimilation System (GFAS, Kaiser et al., 2012)        rience from past experiments has shown that it is important
and biogenic emissions from the MEGAN model (Guenther              to have an anchor for the O3 bias correction, to avoid drifts
et al., 2006).                                                     in the O3 fields (Inness et al., 2013).
   ECMWF IFS uses an incremental 4D-Var data assimila-                Variational quality control (Andersson and Järvinen, 1999)
tion system going back to Courtier et al. (1994). The data as-     and first-guess quality checks are applied to all O3 data in the
similation system for the atmospheric composition fields re-       CAMS system. The variational quality control reduces the
mains unchanged to the one described in Inness et al. (2015).      weight given to observations in the analysis if they have large
The atmospheric composition fields are included in the con-        background departures. In the first-guess quality check, ob-
trol vector and minimized together with the meteorologi-           servations are rejected if the square of the normalized back-
cal control variables. The CAMS NRT system uses 12 h as-           ground departure exceeds its expected variance by more than
similation windows from 03:00 to 15:00 UTC and 15:00 to            a predefined multiple (5 for most variables).
03:00 UTC and two minimizations at spectral truncations
T95 (∼ 210 km) and T159 (∼ 110 km).                                2.2   TROPOMI TCO3 NRT retrievals
   Several ozone retrievals are assimilated in the CAMS NRT
system (see Table 1). These include TCO3 retrievals from           TROPOMI has a local overpass time of 13:30 UTC, a ground
OMI on the Aura satellite and GOME-2 on the Meteoro-               pixel size of 3.5 km × 7 km for TCO3 and other gases re-
logical Operational satellite programme (Metop)-A and -B           trieved from the UV–Vis and a swath of 2600 km, and it
satellites (referred to as GOME-2AB), O3 profile data from         provides daily global coverage with ∼ 14 orbits per day.
the Microwave Limb Sounder (MLS) and O3 partial columns            For the work in this paper we use NRT TROPOMI TCO3
from Solar Backscatter Ultra-Violet (SBUV/2) and from the          data (Loyola et al., 2019b). These include TROPOMI data
Ozone Mapping and Profiler Suite (OMPS). The GOME-2                (v1.0.0) for the period 26 November 2017 to 3 May 2018
and OMI TCO3 retrievals are thinned to a horizontal resolu-        v1.0.0 that were reprocessed with the NRT algorithm and
tion of 0.5◦ × 0.5◦ by randomly selecting an observation in        NRT TROPOMI data v1.0.0–v1.1.2 for the period 11 June to
a grid box. The MLS profiles and partial column SBUV/2             30 November 2018 (see Table 2). No data were acquired at
and OMPS data are used unthinned at present. The O3 re-            ECMWF from 4 May to 10 June 2018 for technical reasons.
trievals assimilated in the CAMS system are total or partial       The TROPOMI TCO3 retrieval is based on the GDP 4.x algo-
column data, i.e. integrated layers bounded by a top and a         rithm original developed for GOME (van Roozendael et al.,
bottom pressure. The model’s background column value is            2006), adapted to SCIAMACHY (Lerot et al., 2009) and fur-
calculated as a simple vertical integral between the top and       ther improved for GOME-2 (Loyola et al., 2011; Hao et al.,
the bottom pressure of the partial or total columns, at the time   2014). The major TCO3 algorithm updates for TROPOMI
and location of the observations. Averaging kernels are cur-       compared to the heritage algorithms used for GOME-2 are
rently not used for the assimilation of ozone retrievals in the    the more precise treatment of clouds as scattering layers
CAMS system. It is planned to test their use in the future.        (Loyola et al., 2018), an optimized wavelength for the cal-
   A variational bias correction (VarBC) scheme (Dee and           culation of air mass factors (328.2 nm instead of 325.5 nm),
Uppala, 2009), where biases are estimated during the anal-         better a priori ozone profile information (including the tro-
ysis by including bias parameters in the control vector, was       pospheric climatology by Ziemke et al., 2011) and a de-
used for several of the O3 retrievals. In this scheme, the bias    striping correction. This destriping correction was introduced
corrections are continuously adjusted to optimize the con-         because total vertical ozone columns showed small striping
sistency with all information used in the analysis. VarBC          structures. The correction factor is based on the ratio between
is applied to the TCO3 retrievals from OMI and GOME-2              the mean for individual rows and the mean for all rows over
and to the partial column OMPS data, with solar elevation          a certain region and period. We averaged the total columns
                                                                   within the tropics for January to April 2018 for all 450 rows

Atmos. Chem. Phys., 19, 3939–3962, 2019                                               www.atmos-chem-phys.net/19/3939/2019/
A. Inness et al.: Monitoring and assimilation tests with TROPOMI data                                                       3943

Figure 1. TROPOMI NRT TCO3 in Dobson units (DU) at (a) full resolution and (b) super-obbed to the model resolution of T511 on
29 November 2017, 12:00 UTC over Europe.

individually and over all 450 rows, resulting in an array of       “super-observations” before they are included in the CAMS
450 numbers, ranging between 0.99 and 1.015. Multiplying           system. For this super-obbing, the data are averaged to the
the VCD with the correction factor changes the result by           T511 resolution of the model. The averaging is carried out
about ±1 %. The correction factor has been rechecked but           for all good data and the errors of the data are averaged
no update seemed necessary up to now. The TROPOMI re-              in the same way as the observations. The super-obbing re-
trieval is described in the S5P/TROPOMI Total Ozone ATBD           duces the random errors in the data. In the past a “random”
(Spurr et al., 2018).                                              thinning to 0.5◦ × 0.5◦ was used in the CAMS system and
   We use the following quality checks to remove any out-          this is still applied to the TCO3 retrievals from GOME-2
liers of the TROPOMI TCO3 data. Data are only used in the          and OMI. The super-obbing applied to TROPOMI data has
following cases:                                                   the advantage that it does not simply throw out the majority
                                                                   of the observations but uses the information from all good
 1. the value of the quality flag is given in the data (qa flag)   data to create average observations. In future, super-obbing
    between [0,100],                                               will also be tested for the other ozone data sets. An example
 2. the ozone values are between [0,900 DU],                       of TROPOMI TCO3 NRT data at full resolution and super-
                                                                   obbed to T511 is shown in Fig. 1. The super-obbing reduces
 3. the surface altitude is between [−399,8850 m],                 the number of good TROPOMI TCO3 data from about 15–
                                                                   16 million per day to about 500 000 while still making use of
 4. the cloud fraction is between [0,1],
                                                                   the information given by all good data.
 5. the latitude is between
      a. [−90◦ ,90◦ ]   for   the   monitoring     assimilation    3   Results
         (Sect. 3.1)
                                                                   Two experiments were run with NRT TROPOMI TCO3 data
      b. [−60◦ ,60◦ ] in the active assimilation (Sect. 3.2).      super-obbed to T511 horizontal resolution. In the first control
   Data that pass the above four checks are flagged as “good”      experiment (CTRL, Sect. 3.1) the TROPOMI data were in-
and used for the studies presented in this paper. In the current   cluded passively; in the second one (ASSIM, Sect. 3.2) they
TROPOMI TCO3 products v1.1.x (Pedergnana et al., 2018),            were actively assimilated. The experiments cover the period
the qa flag will allow the user to identify good quality data,     from 26 November 2017 to 30 November 2018 and were run
but this was not yet the case in v1.0.0. For consistency with      using CY45R1 of the CAMS system. We look at time se-
the earlier period the qa value filter was not applied for ver-    ries for the whole period and at fields averaged over the pe-
sion 1.1.2 data in this study.                                     riods February to April (FMA) and September to November
   Because the horizontal resolution of TROPOMI data               (SON) 2018.
(3.5 km × 7 km) is higher than the model resolution of T511
(about 40 km × 40 km) the TROPOMI data are not spatially
representative of the model grid boxes. To overcome this
representativeness error, the data are converted to so-called

www.atmos-chem-phys.net/19/3939/2019/                                               Atmos. Chem. Phys., 19, 3939–3962, 2019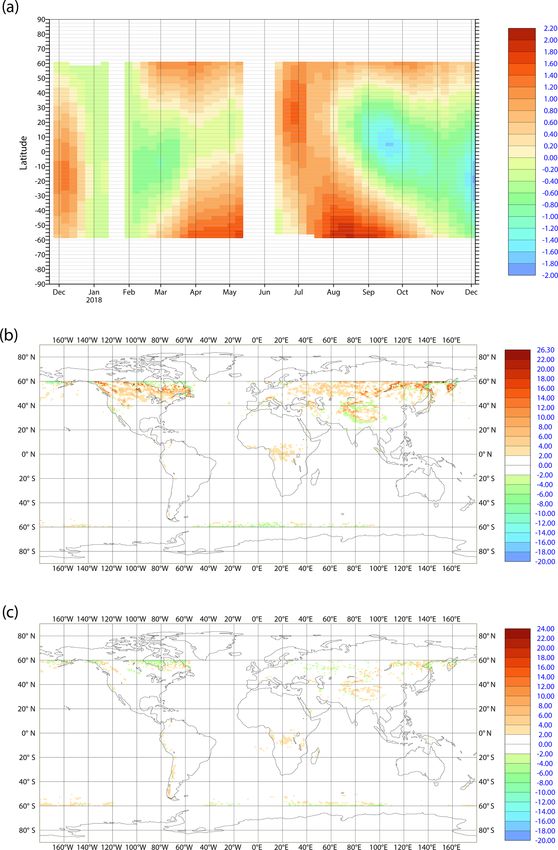
3944                                              A. Inness et al.: Monitoring and assimilation tests with TROPOMI data

Figure 2. (a) Time series of zonal mean weekly averaged TROPOMI NRT TCO3 for the period 26 November 2017 to 30 November 2018
and differences between (b) TROPOMI and OMI, (c) TROPOMI and GOME-2A and (d) TROPOMI and GOME-2B TCO3. Only good data
are shown. All values are in DU.

3.1    Monitoring of TROPOMI TCO3 NRT data                       ative differences (i.e. TROPOMI values lower than OMI) are
                                                                 found at the northern ends of the orbits from December 2017
Figure 2a shows a time series of zonal mean weekly averaged      to April 2018 and September to November 2018 and also
TCO3 values from TROPOMI for the period 26 Novem-                south of 60◦ S, particularly from March to October when
ber 2017 to 30 November 2018. The time series shows a re-        UV–Vis retrievals generally have larger problems because of
alistic evolution of the ozone field with high column values     the illumination conditions and the icy surfaces. On top of
in the NH during winter and spring, low values in the trop-      that, the TROPOMI retrievals have a larger bias at high lati-
ics throughout the year, higher values in the circum-Antarctic   tudes because the current NRT algorithm uses a surface cli-
band and the lowest absolute values over the Antarctic dur-      matology that does not fully represent the actual snow/ice
ing the ozone hole from August to November 2018. We also         conditions. Over large parts of the time series the differences
see a longer period without TROPOMI data in January 2018,        are below 4–6 DU, corresponding to less than 2 %. Larger
when the instrument was undergoing calibration activities.       departures are seen during some of the commissioning and
From mid-February 2018 onwards (outside the data gap in          differences of up to 20 DU are seen north of 40◦ N during the
May–June when data were not acquired by ECMWF) the               first half of the time series. However, TCO3 values are also
number of data is more stable (not shown), except from 1         larger at this time (Fig. 2a), so this still corresponds to agree-
week with low data numbers in March. To assess the quality       ments within about 5 %. The differences between TROPOMI
of the TROPOMI data they are compared with the other three       and GOME-2AB (Fig. 2c and d) are smaller than the differ-
TCO3 retrievals that are routinely assimilated in the CAMS       ences with OMI between 60◦ N and 60◦ S, but larger nega-
NRT system, i.e. OMI and GOME-2AB in Fig. 2b–d. The              tive differences are found at the northern end of the orbits,
TROPOMI NRT DOAS retrieval is a further development              especially south of 60◦ S. Again, larger departures are seen
of the operational AC-SAF GOME-2AB DOAS; therefore               during some of the commissioning phase. Apart from these
a better agreement can be expected for the comparison for        periods the differences between the TROPOMI and GOME-
those sensors compared to OMI, where a different algorithm       2AB data for latitudes between 60◦ N and 60◦ S are between
(TOMS-like) is applied. The differences between TROPOMI          2 and 6 DU or less than about 2 %.
and OMI are positive (i.e. TROPOMI values higher than
OMI) in most latitude bands throughout the time series. Neg-

Atmos. Chem. Phys., 19, 3939–3962, 2019                                            www.atmos-chem-phys.net/19/3939/2019/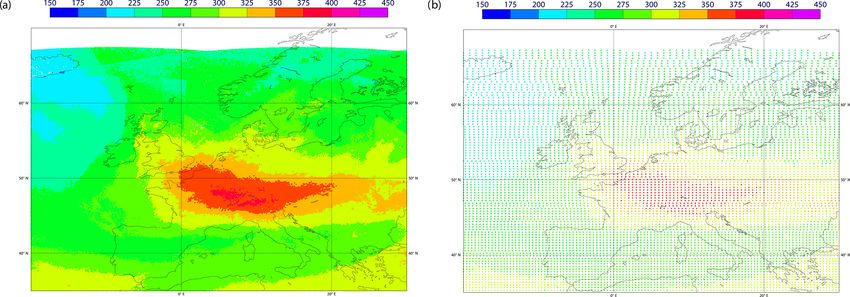
A. Inness et al.: Monitoring and assimilation tests with TROPOMI data                                                 3945

Figure 3. Averages over (a) FMA 2018 and (b) SON 2018. (1) Mean TROPOMI TCO3 fields, differences between (2) TROPOMI minus
GOME-2A, (3) TROPOMI minus GOME-2B and (4) TROPOMI minus OMI. Only good data are shown. All values are in DU.

  Figure 3 shows the mean TROPOMI TCO3 fields aver-            and GOME-2AB polewards of about 60◦ , which seem to be
aged for FMA and SON 2018 and the differences between          mainly negative over ice and sea and positive over land. Dur-
TROPOMI, OMI and GOME-2AB. TROPOMI shows high                  ing FMA there are also large differences in the NH north
TCO3 values in FMA during spring in the NH and low val-        of about 40◦ N. However, these differences are still within
ues over the Antarctic ozone hole during SON. The figure       about 20 DU (or less than 5 %) in most areas south of 60◦ N
shows that there are large differences between TROPOMI         for GOME-2B and only slightly larger for GOME-2A. These

www.atmos-chem-phys.net/19/3939/2019/                                          Atmos. Chem. Phys., 19, 3939–3962, 2019
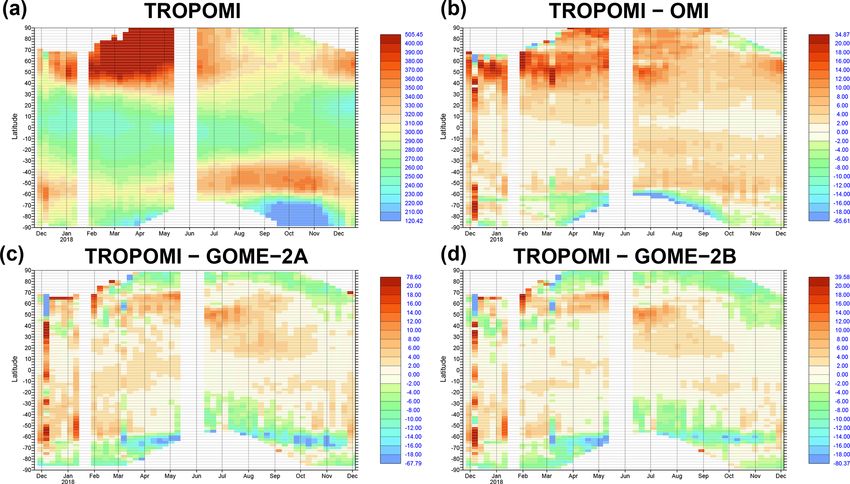
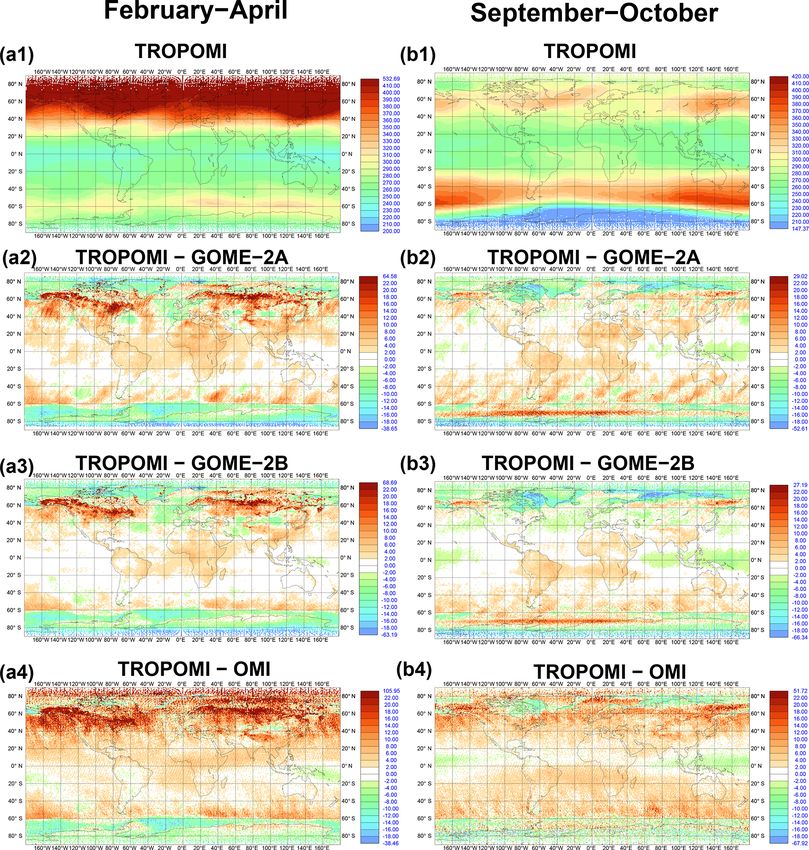
3946                                              A. Inness et al.: Monitoring and assimilation tests with TROPOMI data

Figure 4. TCO3 standard deviation of good data for the period 26 November 2017 to 30 November 2018 from (a) TROPOMI, (b) OMI,
(c) GOME-2A and (d) GOME-2B in DU.

differences come mainly from the surface albedo climatol-        pospheric ozone wave one structure into account. The differ-
ogy that is used in the TROPOMI NRT retrieval algorithm          ences between TROPOMI and OMI are slightly larger than
of the v1.0.0–v1.1.2 data. The employed surface albedo cli-      the differences between GOME-2AB and TROPOMI but still
matology, based on OMI data (Kleipool et al., 2008), has a       less than about 8 DU (or 4 %) over larger parts of the globe,
spatial resolution of 0.5◦ × 0.5◦ which seems coarser than       with TROPOMI generally higher than OMI, except over the
the spatial resolution of the TROPOMI pixels. Consequently,      maritime continent. Over Antarctica and some areas north of
surface albedo structures are found in the obtained TCO3         40◦ N positive and negative deviations are found. Because the
results, particularly over the polar regions, where the sur-     differences over Antarctica show similar structures for OMI
face albedo climatology sometimes has very few grid cells        and GOME-2AB they are likely to point to problems with
marked as no snow or ice (reflectivity 0.05), whereas the re-    the TROPOMI retrievals using the OMI surface climatology
flectivity is close to 1 for the neighbouring ones with snow.    rather than the other data sets.
In the future, it is planned to replace this coarse climatol-       Figure 4 shows maps of the standard deviation of the
ogy with a new surface albedo retrieval using S5P data (Loy-     four TCO3 retrievals over the whole period from 26 Novem-
ola et al., 2019a). For all three instruments, the differences   ber 2017 to 3 November 2018. All retrievals show the same
in the NH are smaller in SON than FMA. During summer,            features with highest variability in the northern high latitudes
when there is no snow cover, the resolution of the surface       and over Antarctica, where TCO3 values vary most during
albedo is less of an issue and larger positive differences be-   the course of a year, and the lowest variability in the tropics.
tween TROPOMI and GOME-2AB are confined to Alaska                   We now look at differences between TROPOMI and the
and Kamchatka. We expect the largest problems to occur in        CAMS ozone analysis, i.e. analysis departures. These de-
spring and autumn, when the snow cover changes locally.          parture plots show problems in the TROPOMI data more
Equatorward of those areas the differences between the in-       clearly than the comparison between instruments in Fig. 3,
struments are smaller. Over oceans TROPOMI and GOME-             because they are not affected by issues from two different
2AB mainly agree to within ±4 DU, i.e. less than about 2 %       retrievals. Nevertheless, the main findings from Fig. 5 are
of the tropical TCO3 values, with slightly larger differences    similar to those from Fig. 3. Figure 5a shows a time series
over land (up to 10 DU, ∼ 5 %). During SON, negative differ-     of zonal mean weekly averaged TROPOMI analysis depar-
ences of up to −6 DU are found over the maritime continent.      tures for the period 26 November 2017 to 30 November 2018
This is probably caused by the update of the a priori in the     and like Fig. 3 has the largest, mainly negative departures
TROPOMI algorithm v1.1.2, as the new one takes the tro-          polewards of 60◦ . Between 50◦ N and 60◦ S the zonal mean

Atmos. Chem. Phys., 19, 3939–3962, 2019                                           www.atmos-chem-phys.net/19/3939/2019/
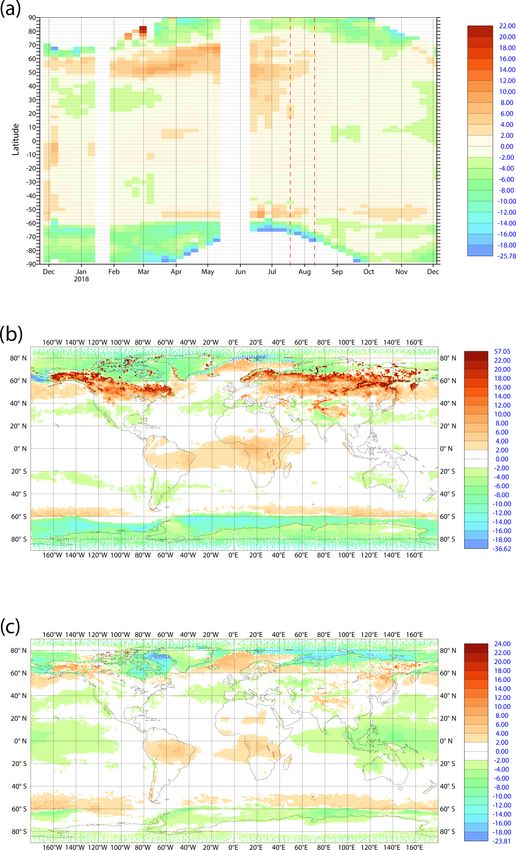
A. Inness et al.: Monitoring and assimilation tests with TROPOMI data                                                          3947

Figure 5. (a) Time series of zonal mean weekly averaged TROPOMI TCO3 analysis departures (observations minus analysis) for the period
26 November 2017 to 30 November 2018. The red dashed lines mark changes in the retrieval versions (see Table 2). (b) Mean TROPOMI
TCO3 analysis departures averaged over FMA 2018 and (c) mean analysis departures averaged over SON 2018. Only good data are shown.
All values are in DU. Values smaller than 2 DU are white.

www.atmos-chem-phys.net/19/3939/2019/                                                 Atmos. Chem. Phys., 19, 3939–3962, 2019

3948                                                  A. Inness et al.: Monitoring and assimilation tests with TROPOMI data

Table 3. Mean bias and standard deviations of the TCO3 retrievals against the CAMS ozone analysis in DU from the control experiment
(CTRL) for the periods 26 November 2017 to 3 May 2018 and 11 June to 30 November 2018. Numbers in bold mark where the biases and
standard deviations of the other TCO3 data sets are smaller than in TROPOMI, italic marks where they are larger. Only good data are shown
for TROPOMI and used data for the other instruments.

              Instrument    Period             90–60◦ N        60–30◦ N      30◦ N–30◦ S        30–60◦ S         60–90◦ S
              TROPOMI       Nov–May       −1.07 ± 17.30     2.10 ± 9.47      0.06 ± 3.83    −0.05 ± 4.95     −6.81 ± 7.32
              OMI           Nov–May        −2.85 ± 8.11    −2.70 ± 7.99      0.18 ± 7.45     0.83 ± 7.35      2.17 ± 6.42
              GOME-2A       Nov–May         0.81 ± 6.35    −0.60 ± 5.88      0.06 ± 3.14    −0.10 ± 3.40      0.86 ± 3.38
              GOME-2B       Nov–May         0.29 ± 6.25     0.42 ± 6.14      0.16 ± 2.97    −0.19 ± 3.33     −0.46 ± 3.31
              TROPOMI       Jun–Nov       −1.46 ± 10.40     0.31 ± 6.00     −0.47 ± 3.88    0.82 ± 10.10     −2.39 ± 6.99
              OMI           Jun–Nov        −1.57 ± 7.22    −1.63 ± 7.77      0.48 ± 7.15     0.73 ± 7.95      2.07 ± 6.65
              GOME-2A       Jun–Nov         0.19 ± 5.11    −0.25 ± 4.51      0.02 ± 3.55     0.24 ± 5.08      0.67 ± 3.56
              GOME-2B       Jun–Nov         0.68 ± 4.80     0.53 ± 4.45     −0.18 ± 3.27     0.04 ± 5.08     −0.29 ± 3.65

departures are within ±2–4 DU during most of the time se-              tween 90 and 60◦ N, 2.10 ± 9.47 DU between 60 and 30◦ N,
ries, i.e. less than 2 % of the zonal mean TCO3 (Fig. 2a).             0.06 ± 3.83 DU between 30◦ N and 30◦ S, −0.05 ± 4.95 DU
Larger positive departures are found between 50 and 60◦ N              between 30 and 60◦ S and −6.81 ± 7.32 DU between 60 and
until August 2018 and between 50 and 60◦ S after the end of            90◦ S. The mean bias between 90 and 60◦ N is relatively
March. After the latest algorithm change to v1.1.2 in Au-              small because the positive biases over land and the negative
gust, the zonal mean departures are less than ±2 DU be-                ones over ice compensate (see Fig. 5a and b). This is also
tween 60◦ N and 60◦ S most of the time and also smaller                illustrated by the large standard deviation between 90 and
than −4 DU most of the time between 60 and 90◦ S. During               60◦ N. Table 3 also lists the values from the other three TCO3
FMA (Fig. 5b) TROPOMI is lower than the CAMS analy-                    retrievals and shows that the mean biases of TROPOMI are
sis south of 60◦ S and over land or snow/ice north of 60◦ N.           larger than those of GOME-2AB between 90 and 30◦ N and
TROPOMI is considerably higher than the CAMS analysis                  between 60 and 90◦ S but smaller between 30◦ N and 60◦ S.
over land in the NH north of about 40◦ N with differences              TROPOMI has smaller mean biases than OMI in all areas
between 20 and 40 DU in places, a result of the issues with            except 60–90◦ S. The standard deviations of the TROPOMI
the surface albedo climatology discussed above. However, as            departures are larger than those of GOME-2AB in all areas
TCO3 values are also large in these areas (see Fig. 3a1), this         and larger than those of OMI between 90 and 30◦ N and
is still within about 10 % of the mean observation values.             between 60 and 90◦ S but smaller than those of OMI be-
Large positive TROPOMI TCO3 departures are also seen                   tween 30◦ N and 60◦ S. It should be born in mind, though,
over the Himalayas in FMA. In the other areas, TROPOMI                 that used data are shown for GOME-2AB and OMI, and
agrees better with the model, with positive departures over            the CAMS analysis draws on the data, thus reducing the
the tropical Atlantic, Africa and South America (up to 8 DU,           standard deviation of the departures, while good data are
about 4 %) and small negative departures elsewhere. During             shown for TROPOMI and the TROPOMI data do not affect
SON (Fig. 5c) the departures are generally smaller than dur-           the CAMS analysis. For June to November 2018 TROPOMI
ing FMA, especially over land in the NH. The largest neg-              has mean bias of −1.46 ± 10.40 DU between 90 and 60◦ N,
ative departures are found over sea/ice north of 60◦ N (up             0.31 ± 6.00 DU between 60 and 30◦ N, −0.47 ± 3.88 DU be-
to −20 DU). Over the maritime continent larger negative de-            tween 30◦ N and 30◦ S, 0.82 ± 10.10 DU between 30 and
partures (up to −8 DU) are found during SON and FMA. As                60◦ S and −2.39±6.99 DU between 60 and 90◦ S. Again, the
mentioned above this is probably caused by the update of               TROPOMI biases and standard deviations of the departures
the a priori in the TROPOMI retrievals that takes the tropo-           are larger than those of GOME-2AB in most areas, while
spheric ozone wave one structure into account. We will show            the biases are smaller than those of OMI between 90◦ N and
in Sect. 3.2.2 that the assimilation of TROPOMI improves               30◦ S and larger between 30◦ and 90◦ S.
the CAMS results compared to tropospheric ozone sondes                    Figure 6 shows scatter plots of TROPOMI TCO3 analysis
and IAGOS measurements in the tropics, suggesting these                departures for the period 26 November 2017 to 30 Novem-
differences point to a model bias rather than a problem with           ber 2018 for latitude, solar elevation and scan position. Such
the data.                                                              plots can be very useful in identifying retrieval problems
   Table 3 lists mean biases and their standard deviations             depending on the chosen parameters. In FMA, the scatter
for the first half (November 2017–May 2018) and the sec-               plot for latitude shows small mean departures between about
ond half (June–November 2018) of the time series. Aver-                60◦ S and 45◦ N, positive departures between 45 and 70◦ N
aged over November 2017–May 2018 TROPOMI shows a                       and negative departures polewards of 70◦ N and 60◦ S. This
mean bias with respect to CAMS of −1.07 ± 17.3 DU be-                  agrees with the averaged analysis departures shown in Fig. 5b

Atmos. Chem. Phys., 19, 3939–3962, 2019                                                  www.atmos-chem-phys.net/19/3939/2019/
A. Inness et al.: Monitoring and assimilation tests with TROPOMI data 3949 Figure 6. Scatter plots of good TROPOMI NRT TCO3 analysis departures for (1) latitude, (2) solar elevation and (3) scan position for (a) FMA 2018 and (b) SON 2018. Values are in DU. www.atmos-chem-phys.net/19/3939/2019/ Atmos. Chem. Phys., 19, 3939–3962, 2019
3950                                                      A. Inness et al.: Monitoring and assimilation tests with TROPOMI data

Figure 7. Row 1: Time series for the period 26 November 2017 to 30 November 2018 of global mean weekly averaged TCO3 first-guess
(solid blue) and analysis departures (solid red), bias-corrected first-guess (dotted blue) and analysis departures (dotted red) and bias correction
(black) in DU. Row 2: standard deviation of first-guess (blue) and analysis departures (red) in DU. Row 3: number of data (used in blue, all
in magenta) from (a) TROPOMI, (b) OMI, (c) GOME-2A and (d) GOME-2B. Used data are shown.

Atmos. Chem. Phys., 19, 3939–3962, 2019                                                        www.atmos-chem-phys.net/19/3939/2019/
A. Inness et al.: Monitoring and assimilation tests with TROPOMI data                                                         3951

Figure 8. (a) Time series of zonal mean weekly average bias correction applied to TROPOMI TCO3 for the period 26 November 2017 to
30 November 2018 and mean bias-corrected analysis departures for (b) FMA 2018 and (c) SON 2018 (compare with Fig. 5). All values are
in DU.

and the Hovmöller plot in Fig. 5a and illustrates that there is     erally small and do not show high values between 45 and
a problem with the retrievals at high latitudes. The plot also      70◦ N any more. They are still negative polewards of 70◦ N
shows that there is a large scatter polewards of 50◦ N and          and 60◦ S but smaller than in FMA. In FMA, the TROPOMI
60◦ S. Larger scatter at high latitudes is also seen for OMI        departures show a strong dependency on solar elevation with
and GOME-2AB if all good data are plotted (not shown). In           increasingly negative departures at solar elevations below
SON, the mean departures plotted against latitude are gen-          25◦ . The SOE dependency is smaller in SON. For a sun-

www.atmos-chem-phys.net/19/3939/2019/                                                Atmos. Chem. Phys., 19, 3939–3962, 2019
3952                                                 A. Inness et al.: Monitoring and assimilation tests with TROPOMI data

Table 4. Mean bias and standard deviations of the TCO3 retrievals against the CAMS ozone analysis in DU from the assimilation experiment
(ASSIM) for the periods 26 November 2017 to 3 May 2018 and 11 June to 30 November 2018 for used data. Numbers in bold mark where
the biases or standard deviations are smaller in ASSIM than in CTRL (Table 3), italic numbers mark where they are larger.

          Instrument (used data)   Period          90–60◦ N        60–30◦ N      30◦ N–30◦ S        30–60◦ S         60–90◦ S
          TROPOMI                  Nov–May         Not used      0.51 ± 6.64     0.07 ± 2.44    0.003 ± 3.24         Not used
          OMI                      Nov–May     −3.19 ± 8.09     −3.34 ± 8.25     0.22 ± 7.42     1.08 ± 7.21      2.20 ± 6.41
          GOME-2A                  Nov–May      0.71 ± 6.38     −0.90 ± 5.88     0.06 ± 3.13     0.02 ± 3.56      0.86 ± 3.38
          GOME-2B                  Nov–May      0.20 ± 6.28      0.14 ± 6.27     0.20 ± 3.06    −0.13 ± 3.43     −0.47 ± 3.31
          TROPOMI                  Jun–Nov         Not used      0.07 ± 4.09     0.03 ± 2.64     0.29 ± 4.63         Not used
          OMI                      Jun–Nov     −1.76 ± 7.22     −1.82 ± 7.87     0.67 ± 7.10     0.25 ± 7.75      2.03 ± 6.63
          GOME-2A                  Jun–Nov      0.17 ± 5.12     −0.15 ± 4.60     0.05 ± 3.77     0.03 ± 5.24      0.59 ± 3.61
          GOME-2B                  Jun–Nov      0.71 ± 4.80      0.68 ± 4.67    −0.16 ± 3.45    −0.29 ± 5.16     −0.41 ± 3.69

synchronous orbiting satellite, the SOE is mainly a function          IFS (see Sect. 2.1). The figure shows that the TROPOMI bias
of the latitude; therefore this deviation might be caused by          correction successfully removes the biases between the data
the latitudinal deviation discussed above. Departures in both         and the model, so that the bias-corrected analysis departures
seasons vary slightly depending on the scan position with in-         are small. The bias correction calculates maximum values of
creasingly negative departures towards the edges of the scan,         about 1 DU in the global mean with the largest positive val-
especially on the western side of the scan. There is no depen-        ues between June and August and the largest negative values
dency of the departures on cloud cover or cloud top pressure          in November 2018. The magnitude of the global mean bias
(not shown).                                                          correction that is applied to TROPOMI is smaller than that of
                                                                      the other three TCO3 retrievals. Figure 7 shows that the anal-
3.2     Assimilation tests with TROPOMI TCO3 NRT                      ysis is drawing on the TROPOMI data (and the other three
        data                                                          data sets), i.e. analysis departures are smaller than the first-
                                                                      guess departures and the standard deviation of the departures
We showed in Sect. 3.1 that the TROPOMI TCO3 data are                 is reduced. About 2.4 million TROPOMI observations are
of good quality over large parts of the globe, but that there         used every week, which is 10 times as many observations as
are some issues at high latitudes and low solar elevations,           from OMI, 5 times as many as from GOME-2A and 3 times
especially in FMA. The biases we observe outside those re-            as many as from GOME-2B.
gions are of similar magnitude to the biases of the other total          Table 4 lists mean biases and standard deviations from AS-
column data sets assimilated in CAMS (see Table 3), and               SIM for all four TCO3 retrievals for the period 26 Novem-
we therefore do not expect any problems with the assimila-            ber 2017 to 3 May 2018 and 11 June to 30 November 2018
tion of TROPOMI NRT TCO3 if we bias correct the data                  for used data. It shows that TROPOMI TCO3 bias and stan-
and blacklist them appropriately. Hence, assimilation tests           dard deviation values are reduced in all three areas compared
are carried out with the TROPOMI NRT TCO3 data for the                to the values in CTRL (see Table 3) as the analysis is drawing
period 26 November 2017 to 30 November 2018, blacklisting             on the data. The fit to the other data sets is slightly degraded
them for solar elevations less than 10◦ and poleward of 60◦ .         in some areas and improved in others when TROPOMI data
Restricting the assimilated data between 60◦ S and 60◦ N ex-          are also assimilated (see Table 4), but overall the differences
cludes the ozone hole observation in these tests. Variational         between the biases and the standard deviations of the depar-
bias correction is applied to the data in the same way as it is       tures of GOME-2AB and OMI from ASSIM and CTRL are
used for the other TCO3 data, i.e. with solar elevation and a         small.
global constant as predictors. The choice of these bias cor-             Figure 8a shows a time series of the zonal mean weekly
rection parameters can be altered in the future if needed.            averaged bias correction that is applied to TROPOMI data
                                                                      for the period 26 November 2017 to 30 November 2018.
3.2.1    Impact of the TROPOMI assimilation                           The figure illustrates how the bias correction changes with
                                                                      time as it adapts to the data and that the mean bias-corrected
Figure 7 shows time series of global mean weekly averaged             TROPOMI analysis departures for FMA (Fig. 8b) and SON
TROPOMI, OMI and GOME-2AB TCO3 departures, bias                       (Fig. 8c) are small compared to CTRL (Fig. 5b and c) as the
correction, standard deviation of departures and number of            analysis is drawing on the TROPOMI data. Some larger pos-
observations between 26 November 2017 and 30 Novem-                   itive departures remain over land in the NH in FMA, where
ber 2018 for used data, i.e. the data that fulfil the blacklist       observation outliers are given less weight by the analysis.
criteria and quality checks listed in Table 1 and pass the vari-         Figure 9 shows the mean TCO3 fields from ASSIM for
ational quality control and first-guess checks applied by the         FMA and SON 2018 as well as the absolute and relative dif-

Atmos. Chem. Phys., 19, 3939–3962, 2019                                                 www.atmos-chem-phys.net/19/3939/2019/
A. Inness et al.: Monitoring and assimilation tests with TROPOMI data 3953 Figure 9. Average fields for (a) FMA and (b) SON 2018. (1) Mean TCO3 analysis from ASSIM, (2) the absolute differences between ASSIM and CTRL in DU and (3) the relative differences between ASSIM and CTRL in percent. ferences between ASSIM and CTRL. It illustrates that the Figure 10 shows cross sections of zonal mean relative O3 impact of the TROPOMI assimilation in relative terms is mixing ratio differences from ASSIM minus CTRL averaged small with relative differences of less than 2 % everywhere over FMA and SON. Again, the impact of TROPOMI assim- and less than 1 % in most areas. The absolute differences ilation is small with the largest relative differences found in are largest over land in the NH in FMA, with ASSIM up to the troposphere. Here the TROPOMI data act to lower the 10 DU higher than CTRL. However, the absolute TCO3 val- ozone values in ASSIM in the zonal mean. In FMA the im- ues are also largest then. Positive differences are also found pact is less than 1 % everywhere. In SON, the differences in in an area stretching from South America over the Atlantic the troposphere are slightly larger and reach values of up to to Africa in FMA and SON and in small bands around 60◦ S. −3 % near the surface at NH midlatitudes and over the South In most other areas, the differences are below −2 DU and Pole. Note that no TROPOMI data were assimilated south negative. of 60◦ S so the changes seen here come from transport. Also, www.atmos-chem-phys.net/19/3939/2019/ Atmos. Chem. Phys., 19, 3939–3962, 2019
3954                                              A. Inness et al.: Monitoring and assimilation tests with TROPOMI data

Figure 10. Cross section of relative zonal mean O3 mixing ratio differences from ASSIM minus CTRL averaged over (a) FMA 2018 and
(b) SON 2018 in percent.

Figure 11. Time series of weekly averaged TCO3 bias in DU from ASSIM (red) and CTRL (blue) compared to WOUDC Brewer data
averaged over (a) the globe (between 15 and 33 sites) and (b) NH midlatitudes (between 12 and 19 sites).

note that the absolute O3 values in the lower troposphere over    the presence of steep gradients and where the ozone amount
the Antarctic are small.                                          is low. The same order of precision was found by Stein-
                                                                  brecht et al. (1998) for Brewer–Mast sondes. (3) Ozone pro-
3.2.2   Validation with independent observations                  files from instruments mounted on commercial aircraft from
                                                                  the In-service Aircraft for a Global Observing System (IA-
To assess if the assimilation of TROPOMI TCO3 retrievals          GOS). The IAGOS ozone data have a detection limit of
improves or degrades the CAMS analysis, the O3 fields             2 ppbv and a precision of ±(2 ppbv + 2 %) (Marenco et al.,
from ASSIM and CTRL are compared with independent                 1998). (4) Ground-based data from the World Meteorologi-
observations. We use the following data sets for compari-         cal Organisation’s Global Atmosphere Watch (GAW) surface
son. (1) Brewer spectrometer measurements were obtained           observation network (e.g. Oltmans and Levy, 1994; Novelli
from the World Ozone and Ultraviolet Radiation Data Centre        and Masarie, 2014). The GAW observations represent the
(WOUDC). The Brewer data are calibrated with a precision          global background away from the main polluted areas. GAW
of 1 % (Basher, 1982). (2) Ozone sonde data came from a va-       O3 data have a precision of ±1 ppbv (Novelli and Masarie,
riety of data centres: WOUDC, Southern Hemisphere ADdi-           2014).
tional OZonesondes (SHADOZ), Network for the Detection               Figure 11 shows time series of the weekly averaged TCO3
of Atmospheric Composition Change (NDACC), and cam-               biases from ASSIM and CTRL against Brewer measure-
paigns for the Determination of Stratospheric Polar Ozone         ments averaged over the globe and NH midlatitudes for the
Losses (MATCH). The precision of electrochemical concen-          period 26 November 2017 to 30 November 2018. The Figure
tration cell (ECC) ozone sondes is of the order of ±5 %           shows a generally good agreement of both experiments with
in the range between 200 and 10 hPa, between −14 % and            the Brewer data with maximum biases of less than 6 DU. It
+6 % above 10 hPa, and between −7 % and +17 % below               confirms that the impact of the TROPOMI assimilation in
200 hPa (Komhyr et al., 1995). Larger errors are found in

Atmos. Chem. Phys., 19, 3939–3962, 2019                                            www.atmos-chem-phys.net/19/3939/2019/
A. Inness et al.: Monitoring and assimilation tests with TROPOMI data 3955 Figure 12. Mean relative O3 bias for FMA 2018 in percent between ASSIM (red) and CTRL (blue) and ozone sondes averaged over the (a) globe, (b) Arctic, (c) NH midlatitudes, (d) tropics, (e) SH midlatitudes and (f) Antarctic. the CAMS system is small with differences between ASSIM and July–September (JAS) 2018. In both seasons, we see a and CTRL of less than 1 DU in the total column. Despite be- positive impact from the assimilation of TROPOMI TCO3 ing small, the impact usually leads to an improved fit to the data over West African airports, where the negative bias seen WOUDC data in ASSIM. in CTRL is reduced when assimilating TROPOMI TCO3 Compared with ozone sondes averaged over FMA data. This increase in tropospheric O3 agrees with the in- (Fig. 12) and SON (Fig. 13) the impact in relative terms creased TCO3 seen in ASSIM over Africa in FMA and SON is also small. However, an improved fit to the data is seen (Fig. 9) but does not show up in the zonal mean cross sections in ASSIM in the tropics during SON, when the positive (Fig. 10). bias seen in CTRL is reduced. Ozone profiles from AS- Finally, we compare ASSIM and CTRL with GAW O3 sur- SIM and CTRL are also compared with IAGOS aircraft data face observations over Europe in Fig. 15 and again see only (Fig. 14). Because not many IAGOS profiles were avail- a small, slightly negative impact. However, only very few able during October and November 2018 we show FMA GAW stations were available and the means are calculated www.atmos-chem-phys.net/19/3939/2019/ Atmos. Chem. Phys., 19, 3939–3962, 2019
3956                                              A. Inness et al.: Monitoring and assimilation tests with TROPOMI data

Figure 13. Mean relative O3 bias for SON 2018 in percent between ASSIM (red) and CTRL (blue) and ozone sondes averaged over the
(a) globe, (b) Arctic, (c) NH midlatitudes, (d) tropics, (e) SH midlatitudes and (f) Antarctic.

from between three and five stations over Europe and more         icking the configuration of CTRL but without OMI (CTRL-
data would be needed for a meaningful validation of surface       OMI) and the other mimicking the configuration of ASSIM
O3 .                                                              without OMI (ASSIM-OMI). Compared to ozonesondes and
   On the whole, the impact of the TROPOMI assimilation           IAGOS data the differences between these experiments and
in the CAMS system is relatively small because the CAMS           ASSIM and CTRL are very small indeed. The largest differ-
analysis is already well constrained by the other O3 data         ences between the four experiments are found at the SH mid-
sets that are assimilated routinely, which are a combina-         latitudes when compared with ozone sondes (Fig. 16a) and
tion of TCO3 data (OMI, GOME-2AB), O3 layers (SBUV/2,             over West African airports compared with IAGOS (Fig. 16b).
OMPS) and O3 profiles (MLS) (see Table 1). If no other O3         Even here, the differences between ASSIM and ASSIM-OMI
data were available and only TROPOMI TCO3 data were as-           are small and both fit the independent observations better
similated, the impact on the CAMS O3 analysis would be            than CTRL and CTRL-OMI. There is even a sign that remov-
larger. To confirm that TROPOMI could serve as a good             ing OMI leads to a small improvement in the fit to IAGOS
replacement if one of the older TCO3 instruments (OMI,            over West Africa. In all other areas the differences between
GOME-2AB) failed, two further experiments were run for            the experiments with and without OMI were negligible when
the period 26 November 2017 to 30 April 2018, one mim-            compared to sondes or IAGOS. These findings agree with re-

Atmos. Chem. Phys., 19, 3939–3962, 2019                                           www.atmos-chem-phys.net/19/3939/2019/
A. Inness et al.: Monitoring and assimilation tests with TROPOMI data                                                       3957

Figure 14. Mean relative O3 difference in percent of ASSIM minus IAGOS aircraft data (red) and CTRL minus IAGOS (blue) for (a) FMA
and (b) JAS 2018 averaged over (1) European airports, (2) SE Asian airports and (3) West African airports.

sults from longer observation system experiments that were            The main advantage of assimilating TROPOMI into the
carried out with the CAMS system for the years 2013 and            CAMS system seems to be the improvement in tropo-
2014 in a different context (not shown), which showed only         spheric ozone. This is because MLS defines the stratosphere,
small changes to the CAMS O3 analysis if one of the TCO3           whereas OMI, GOME-2 and TROPOMI are also sensitive
instruments was removed, confirming that the CAMS analy-           to the troposphere and add extra information here (see also
sis is well constrained and that there is some redundancy in       Lefever et al., 2015). Adding TROPOMI to the CAMS sys-
the system. We are therefore confident that TROPOMI will           tem fits the CAMS analysis better to independent tropo-
be able to counterbalance the loss of one of the older TCO3        spheric data.
instruments. Removing MLS O3 profiles has a much larger
(negative) impact on the CAMS O3 analysis (e.g. Flemming
et al., 2011) and TROPOMI would not be able to replace the         4   Conclusions
MLS profiles as it does not provide data with a similar verti-
cal resolution.                                                    TROPOMI NRT TCO3 retrievals for the period 26 Novem-
                                                                   ber 2017 to 30 November 2018 have been included in the

www.atmos-chem-phys.net/19/3939/2019/                                               Atmos. Chem. Phys., 19, 3939–3962, 2019
3958 A. Inness et al.: Monitoring and assimilation tests with TROPOMI data
2 % over large parts of the globe in weekly mean zonal mean
time series and averaged over FMA and SON 2018. How-
ever, there are problems with the TROPOMI TCO3 NRT
retrievals at high latitudes, at low solar elevations and over
snow/ice (e.g. Antarctica or ice-covered areas in NH). These
differences, which are most prominent over land in the NH
north of 45◦ N before May 2018, come mainly from the sur-
face albedo climatology that is used in the TROPOMI NRT
retrieval algorithm and has a spatial resolution of 0.5◦ × 0.5◦ ,
which is coarser than the spatial resolution of the TROPOMI
pixels. It is planned to replace this climatology with a cli-
matology based on TROPOMI data when data for a long
Figure 15. Time series of weekly averaged O3 bias in ppb from enough period are available. The bias of TROPOMI TCO3
ASSIM (red) and CTRL (blue) compared to GAW surface data av- has a dependency on solar elevation, with increasingly neg-
eraged over Europe (between three and five sites). ative biases at solar elevations less than 25◦ , especially in
FMA 2018. During SON 2018 the dependency on solar ele-
vation is considerably smaller. The bias of TROPOMI TCO3
relative to CAMS also depends slightly on scan position,
with an increasingly negative bias towards the western edge
of the scan.
Relative to CAMS and averaged over the period
26 November 2017 to 3 May 2018, TROPOMI TCO3 NRT
data show a mean bias with respect to CAMS of −1.07 ±
17.3 DU between 90 and 60◦ N, 2.10 ± 9.47 DU between 60
and 30◦ N, 0.06±3.83 DU between 30◦ N and 30◦ S, −0.05±
4.95 DU between 30 and 60◦ S and −6.81±7.32 DU between
60 and 90◦ S. For June to November 2018 TROPOMI has
a mean bias of −1.46 ± 10.40 DU between 90 and 60◦ N,
0.31 ± 6.00 DU between 60 and 30◦ N, −0.47 ± 3.88 DU be-
tween 30◦ N and 30◦ S, 0.82 ± 10.10 DU between 30 and
60◦ S and −2.39 ± 6.99 DU between 60 and 90◦ S. This pa-
per illustrates the power of using a global assimilation system
Figure 16. Mean relative O3 difference in percent for FMA 2018 to monitor new satellite products, as it provides continuous
against (a) ozone sondes at SH midlatitudes and (b) IAGOS air- global coverage, allows us to build up global and regional
craft data at West African airports from ASSIM (red), ASSIM-OMI statistics quickly and can help to identify problems with the
(orange), CTRL (blue) and CTRL-OMI (green). retrievals (e.g. biases against solar elevation, latitude, scan
position, surface albedo dependencies) that might be more
difficult to discover when comparing TROPOMI retrievals
CAMS data assimilation system to first monitor the data against sparse in situ observations.
and to then carry out assimilation tests with them. The Assimilation tests were carried out with the TROPOMI
TROPOMI data used for the work presented in this paper TCO3 data, blacklisting them poleward of 60◦ and at solar
were TROPOMI TCO3 data (v1.0.0), which had been repro- elevations less than 10◦ and applying the ECMWF varia-
cessed with the NRT algorithm until 3 May 2018 and NRT tional bias correction scheme to the data with solar eleva-
TROPOMI (v1.0.0 to v1.1.2) data for the period 11 June to tion and a global constant as predictors. These assimilation
30 November 2018 (Loyola et al., 2019b). TROPOMI was tests showed that the bias correction successfully removed
still in its commissioning phase until 24 April 2018, but even the biases between the model and the data. Overall, the im-
the early TROPOMI TCO3 data generally agreed well with pact of the TROPOMI data in the CAMS assimilation system
the CAMS analysis over large parts of the globe and were of was found to be relatively small, because the ozone analy-
good enough quality to test their use in the CAMS system. sis is already well constrained by several other ozone data
Monitoring of TROPOMI TCO3 data in the CAMS sys- sets that are assimilated routinely (OMI, GOME-2AB, MLS,
tem has shown that the data are of good quality over large SBUV/2, OMPS). Mean differences between a run with and
parts of the globe. The TROPOMI TCO3 biases relative to without assimilation of TROPOMI TCO3 NRT data over the
the CAMS O3 analysis are of similar magnitude to biases of FMA and SON 2018 were less than 2 % for TCO3 every-
OMI and GOME-2AB TCO3 between 60◦ N and 60◦ S and where and less than 1 % in most areas. For average zonal
TROPOMI agrees with the CAMS ozone analysis to within mean O3 mixing ratio profiles the differences between AS-
Atmos. Chem. Phys., 19, 3939–3962, 2019 www.atmos-chem-phys.net/19/3939/2019/You can also read