Exploring the value of parent-tracked baby data in interactions with healthcare professionals - Pure
←
→
Page content transcription
If your browser does not render page correctly, please read the page content below
Exploring the value of parent-tracked baby data in interactions
with healthcare professionals
Citation for published version (APA):
van Kollenburg, J. W. M., Bogers, S. J. A., Rutjes, H., Deckers, E. J. L., Frens, J. W., & Hummels, C. C. M.
(2018). Exploring the value of parent-tracked baby data in interactions with healthcare professionals: A data-
enabled design exploration. In CHI 2018 - Extended Abstracts of the 2018 CHI Conference on Human Factors in
Computing Systems: Engage with CHI (Vol. 2018-April). [297] Association for Computing Machinery, Inc.
https://doi.org/10.1145/3173574.3173871

DOI:
10.1145/3173574.3173871

Document status and date:
Published: 20/04/2018

Document Version:
Accepted manuscript including changes made at the peer-review stage

Please check the document version of this publication:
• A submitted manuscript is the version of the article upon submission and before peer-review. There can be
important differences between the submitted version and the official published version of record. People
interested in the research are advised to contact the author for the final version of the publication, or visit the
DOI to the publisher's website.
• The final author version and the galley proof are versions of the publication after peer review.
• The final published version features the final layout of the paper including the volume, issue and page
numbers.
Link to publication

General rights
Copyright and moral rights for the publications made accessible in the public portal are retained by the authors and/or other copyright owners
and it is a condition of accessing publications that users recognise and abide by the legal requirements associated with these rights.

       • Users may download and print one copy of any publication from the public portal for the purpose of private study or research.
       • You may not further distribute the material or use it for any profit-making activity or commercial gain
       • You may freely distribute the URL identifying the publication in the public portal.

If the publication is distributed under the terms of Article 25fa of the Dutch Copyright Act, indicated by the “Taverne” license above, please
follow below link for the End User Agreement:
www.tue.nl/taverne

Take down policy
If you believe that this document breaches copyright please contact us at:
openaccess@tue.nl
providing details and we will investigate your claim.

Download date: 01. May. 2021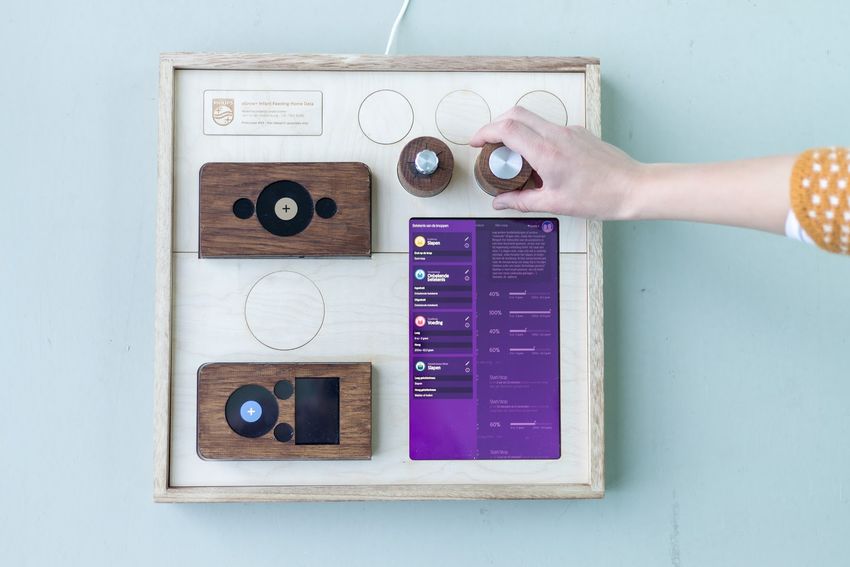
Exploring the Value of Parent-Tracked Baby Data in
              Interactions with Healthcare Professionals:
                   A Data-Enabled Design Exploration
                    Janne van Kollenburg1,2, Sander Bogers2,1, Heleen Rutjes2, Eva Deckers1,
                                      Joep Frens2, Caroline Hummels2
                            1                                                          2
                       Philips Design,                                                     Eindhoven University of Technology,
                Eindhoven, the Netherlands                                                     Eindhoven, the Netherlands
             janne.van.kollenburg@philips.com                                                      s.j.a.bogers@tue.nl

ABSTRACT
This paper presents a designerly exploration of the potential
values of parent-tracked baby data in interactions between
parents and healthcare professionals (HCPs). Where
previous work has used parent-tracked data as part of the
solution to a problem, we contribute by starting our design
exploration from data, using it as creative material in our
design process. As we intend to work towards a system that
could be viable across different levels of care, we invited
three different types of HCPs and five families with
newborns, for a five-week situated design exploration.                                           Figure 1: the uGrow baby app
Facilitated by an open and dynamic data collection toolkit,
parents and HCPs could together decide what data to                               The uGrow baby development tracker app, launched by
collect. In a continuous dialogue, they reflected on the                          Philips in 2016, is a personal informatics system that aims
relevance of that data in their interaction. Based on this, we                    to help new parents in understanding and supporting their
continuously and remotely developed two concepts.                                 baby’s healthy development (figure 1). It provides
                                                                                  personalized feedback, advises on what to expect at each
INTRODUCTION
                                                                                  stage of development, and gives assurance that the
Personal informatics systems [24, 9] gather data about our
                                                                                  development of the baby is on track. This is driven by the
behavior, facilitate interpretation of the data, and thereby
                                                                                  data collected through manual trackers in the app (e.g., how
help us in gaining a better understanding of ourselves (e.g.
                                                                                  long the baby sleeps, how much the baby is eating) or
Fitbit [11], Nokia Health [31], Apple HealthKit [3]). When
                                                                                  through a range of automated loggers in the form of
applied in the healthcare domain, personal informatics
                                                                                  connected products (e.g. Philips Avent [34] smart ear
systems can be valuable enablers of patient-provider
                                                                                  thermometer, smart baby monitor).
collaboration [14,16,19,28]. These can support diagnosis;
personalize treatment; increase patient motivation and                            As part of the uGrow innovation team at Philips Design, we
accountability; highlight unarticulated patient goals; and                        see potential in bringing parent-tracked baby data
facilitate visit management [5, 6]. However, commercially                         [12,26,30,33] into interactions with healthcare professionals
available personal informatics systems are generally not                          (HCPs), yet a direct transfer of uGrow (developed for
developed with a healthcare professional perspective in                           family use) to the healthcare domain would likely be
mind and thereby often lack mechanisms for effective                              unsuccessful. We therefore set out to explore, in a
communication, resulting in overwhelmed healthcare                                designerly manner, what and how parent-tracked baby data
professionals (HCPs) and frustrated patients [7, 41].                             can be of value in the interaction between parents and
                                                                                  HCPs.
Permission to make digital or hard copies of all or part of this work for
personal or classroom use is granted without fee provided that copies are         In our data-enabled design approach [4], we use situated
not made or distributed for profit or commercial advantage and that copies
                                                                                  explorations with remote design interventions to translate
bear this notice and the full citation on the first page. Copyrights for
components of this work owned by others than ACM must be honored.                 insights into new designs continuously. To do this, we
Abstracting with credit is permitted. To copy otherwise, or republish, to         shape a playground of physical data loggers and screen-
post on servers or to redistribute to lists, requires prior specific permission   based dashboards, enabling parents and HCPs to explore
and/or a fee. Request permissions from Permissions@acm.org. CHI 2018,             together what data is of interest and how it can be relevant
April 21–26, 2018, Montreal, QC, Canada © 2018 Association for
Computing Machinery. ACM ISBN 978-1-4503-5620-6/18/04…$15.00                      in their specific use cases. By making changes to the
https://doi.org/10.1145/3173574.3173871                                           playground – or data-enabled canvas – inspired by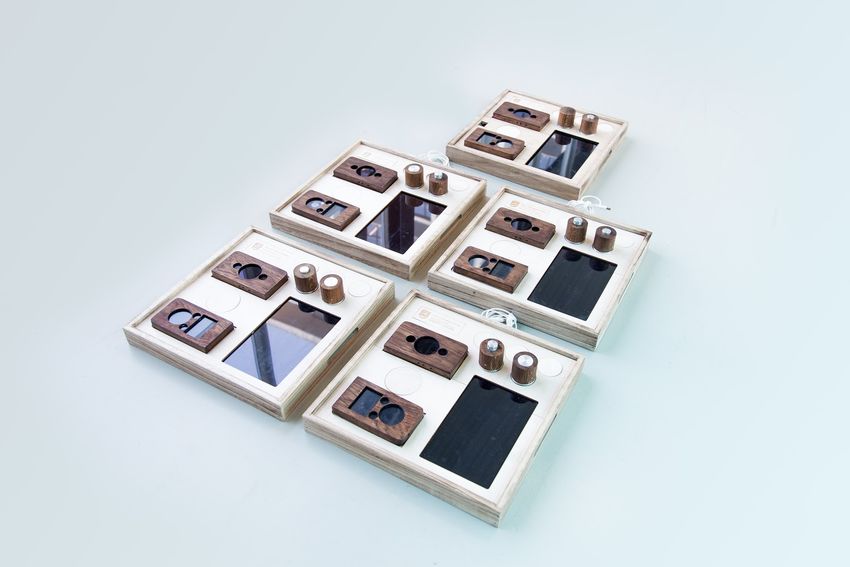
contextualized insights, the design researchers continuously     context should consider multiple caregivers (e.g.
make new ideas experiential.                                     babysitters), multiple locations and timings of care.
                                                                 Additionally, it argues for easy data collection via
In this paper, we first outline and reflect on previous work,
                                                                 automated trackers (e.g. smart thermometer with automated
both in the domain of parent-tracked data for HCPs and
                                                                 temperature history), and a comprehensive yet clear data
self-tracked data for HCPs in general. These insights helped
                                                                 overview for HCPs to make consultation more efficient.
in shaping the initial setup of our ‘data-enabled design
canvas’. Based on our design exploration with three HCPs         Conclusion:
and five families over five weeks, we describe how               Previous work shows how parent-tracked baby data,
different insights have led iteratively to new design            collected at home, has potential value across multiple levels
implementations. Finally, the paper discusses our findings       of care, from prevention to diagnosis and treatment.
and how our approach has influenced these. The                   However, all case studies in this domain start from pre-
contribution of this paper is found in how data is used as a     defined challenges and needs. They define a specific set of
creative material in the process of design for interaction       data as part of the solution to the problem, and parents’
between parents and HCPs.                                        and/or HCPs’ experience of the solution is then evaluated.
                                                                 Building on our previous experience designing the
RELATED WORK
                                                                 connected baby bottle, we were curious to find out what
The related work we outline here falls into two categories:
                                                                 would happen if we again took the (parent-tracked) data as
(1) case studies that operate in the same application domain
                                                                 a starting point instead of concrete needs. We expected this
as our work, and (2) other approaches to self-tracked data
                                                                 to result in a variety of use cases and pitfalls of data usage
and HCPs in other healthcare domains. We used the
                                                                 not yet identified in previous work.
insights from these case studies as inspiration for our design
exploration, and reflect on their approaches to inform           (2) Explorations starting from data in other healthcare
construction of our own. These particular case studies were      domains
selected as we see them as representative of a larger body       When broadening our perspective to work that explores
of work in this research area.                                   how home-collected data can be valuable in interactions
                                                                 with HCPs which are not specific to babies, we see a larger
(1)   Health     technologies       in    parent-healthcare      body of work that does start with the data itself.
professional interactions
The projects Baby Steps [18] and @Baby Steps [38] show a         Mentis et al [28] present a case study that explores the
new approach to existing development assessment surveys,         value of Fitbit step count data in a clinical visit. They stress
used for preventative care, which are not reliably completed     that when self-tracking is brought into a clinical consult, the
by parents. This software tool helps parents to remember         data is reshaped by the goals and expertise that exist within
and record developmental milestones on a daily basis.            that healthcare framework [29]. Building a common
Design recommendations highlight the importance to               understanding of the data requires work by both the patient
design for limited anxiety by mixing more serious medical-       and the clinician, as it is shaped and co-interpreted by both
related features with lightweight features, such as capturing    [1,13,15,17,35]. The approach whereby patient and
the milestone of a first haircut.                                clinician build a shared understanding of the data (e.g. by
                                                                 discussing outliers) provides a valuable additional layer of
For aiding diagnosis in higher levels of care, the MediCubes
                                                                 meaning to the data.
[39] project shows the value of bringing playful
technology-aided diagnostic tools to the home context. The       The Fitbit data used by Mentis et al is a clear example of
child’s health is monitored via a set of noninvasive sensors     how the domain of self-tracking and quantified-self shows a
placed on the toy (e.g. measuring pulse, temperature and         clear trend from manual tracking towards automated or
lung capacity) while interacting with a storytelling game.       passive tracking. Challenges that are often associated with
Monitoring the child’s health in their natural environment       manual tracking in the healthcare domain include: (1) that it
can lead to better health assessments, since the examination     is more difficult to maintain manual logging because of the
is decoupled from the data-gathering process, and thus any       higher burden [40,21], and (2) that the data is less reliable
anxiety relating to the examination no longer influences the     than data collected automatically [20].
data collected.
                                                                 However, Yamashita et al [40] highlight that manually
The ENSURE concept [32] supports parents in                      logging data can be advantageous as it can lead to more
automatically recording, retrieving and transferring health      careful self-observation, which increases self-awareness
information (related to medication adherence) to their HCP.      and engagement [23,25]. Their study, which was designed
The concept was an answer to the needs of parents finding        to explore the value of manually tracked data for caregivers,
it difficult to adhere to medical advice and prescription        focused on a manual mood-tracking system for family
regimens due to having hectic lives, and the need of HCPs        caregivers caring for a depressed family member. The study
to make effective use of consultation time. The work             found that it helped the caregivers gain better insight into
highlights that data collecting technologies in the home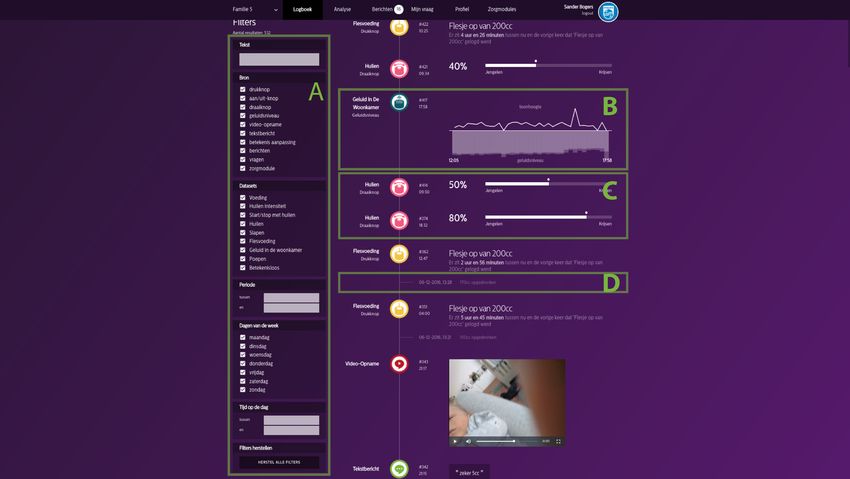
the behavior of the care recipient, for example, and to          data-enabled canvas. The data-enabled canvas facilitates
develop concrete action plans.                                   the explorative and open nature of this approach. It is
                                                                 designed to be sufficiently open to facilitate a variety of
Conclusion:
Although not in the domain of baby care, there are clear         explorations, based on the insights gained during the
examples of studies that depart from data rather than from       situated explorations. These cannot be planned upfront, and
problems and needs. The direct insights are arguably less        thus will continuously change. Our data canvas needs to
                                                                 grow together with our solution to enable continuity of the
valuable to us, as they are heavily influenced by their
                                                                 design explorations [37].
context. The approach, however, is of interest. In the Fitbit
case study, the building of a shared understanding of the        More simply put, by collecting and showing data to
data by patients together with clinicians is of value. Even      participants, they come up with new questions or ideas.
though the study started from exploring the potential value      From a distance, we can quickly update elements of the
of data, it were the researchers who defined what data was       data canvas to embody these ideas, and participants can
used. A similar argument could be made for Yamashita’s           then experience them. These again trigger new ideas for
case study, as the application provided a fixed template for     participants and researchers. In this way, we can explore
what data to manually keep track of. Although we have            continuously and remotely.
only highlighted a limited number of cases, we have not
found case studies that do not pre-define the data involved.     DESIGN CASE
As we set out to use data as creative material to inspire our    Our design case in this paper is a data-enabled design
design iterations, we argue for a more open and dynamic          exploration of how baby data collected in the home can be
approach, as described in the following section.                 valuable in the interaction between parents and HCPs. For
                                                                 our situated explorations we invited three HCPs from the
DATA-ENABLED DESIGN (METHOD)                                     Netherlands. As we set out to design for a system that is
We build on our data-enabled design approach [4] to              valuable across different levels of care, we invited (1) a
explore what data is valuable in what way. This approach         consultation office nurse, who takes a preventative and
was developed and described at an earlier stage, based on a      informative role in screening the overall health and
design exploration of a connected baby bottle. The               development of children, executing vaccinations and
approach is outlined below, after which we elucidate how it      providing parenting strategies; (2) a general practitioner,
was used in the case.                                            who helps parents in solving common medical conditions or
Data-enabled design sets out to use data as creative material    refers them to a specialist in a higher level of care; and (3) a
from the early stages of the design process to ascertain new     pediatrician, who is there for newborns that need specialist
design directions. This is very different from a data-driven     treatment in hospitals or other medical services.
design approach [8], in which data is used as evidence for       The three HCPs were each asked to recruit two families to
design decisions (i.e. in AB testing). Discussions about the     participate in the study for five weeks (see table 1).
data become far more personal and detailed if the data is        Families involved in current, ongoing treatment with the
real and belongs to an individual [22]. We use a                 pediatrician were excluded, as from a medical ethical point
combination of sensor data to gain detailed insights in          of view we did not want to interfere with diagnosis or
behavioral patterns and qualitative methods for providing a      treatment of severe issues. The pediatrician had difficulty in
detailed     understanding       of    related    experiences.   recruiting families, and so started the study supervising
Consequently, the data-enabled explorations are situated in      only one family. However, Family 4 was, coincidentally,
a real-life context, for a longer period of time. We             referred to the pediatrician by the GP during the situated
deliberately refer to these as ‘situated explorations’ because   explorations; hence, all HCPs interacted with two families.
they are not static validations, field trials or home            When referring to participants hereafter, we refer to all
placement tests.                                                 participating families and HCPs. This setup was positively
Data is used as a means to collect insights remotely and         evaluated in a Philips internal ethical committee board and
continuously, but also to remotely design interventions. For     the Dutch Medical Ethical Committee at Maxima Medical
example, in the connected baby bottle case, bottle feeding       Center (METC [27]).
data was remotely collected and displayed in real time on a      Part of our data-enabled design approach was to shape a
researcher data-dashboard. This screen-based interface           data-enabled canvas that allowed us to gain insights, and to
displayed data visualizations that gave insight into the         respond to these insights in a continuous manner through
behavior, experiences and context of the participants. Based     design interventions. This meant that after two weeks the
on insights from this data, content was then sent to a           canvas could be completely different for Family 1 than for
connected mobile app.                                            Family 5. As a whole, our data-enabled canvas comprised
The playground that is shaped through all the tools involved     of (1) a family toolkit; (2) a healthcare professional
(e.g. physical and digital prototypes, software platforms,       dashboard; and (3) a researcher dashboard.
apps, researchers’ dashboards) is what we refer to as the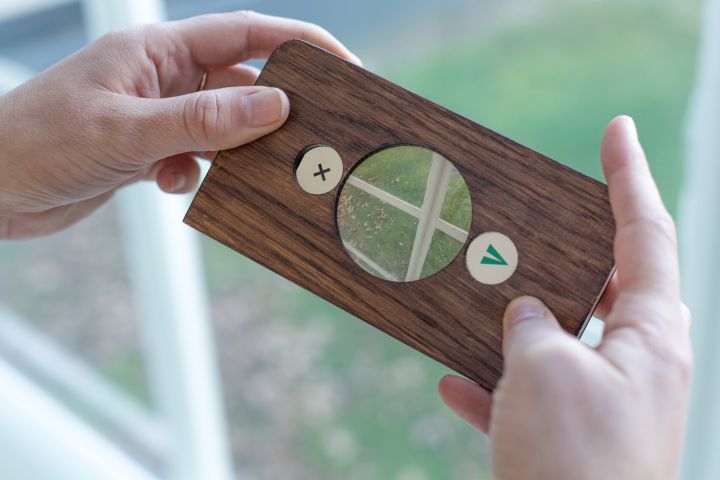
(CON) Consultation             (P) Pediatrician       (GP) General
  Office Nurse                                          Practitioner
  Family 1        Family 2        Family 3        Family 4        Family 5
  Baby: 5w       Baby: 3w        Baby: 5m        Baby: 3m         Baby: 6w
  Father: 37     Father: 33      Father: 35      Father: 27       Father: 37
  Mother: 34     Mother: 32      Mother: 34      Mother: 26       Mother: 30
                                 Sister: 3y
 High level of   High level of   Middle level    Middle level    Middle level
 education       education       of education    of education    of education
 No health       Born            Was             Excessive       Reflux
 issues          lightweight     hospitalized    crying
 Preventative    Focus on        Issue solved,   Unraveling      Lowering
 focus           growth          prevention      cause           medication
                                                                                 Figure 2. The family toolkit. Clockwise from bottom-left: text
 Two home        Two home        6 consults &    Family is 2     Family is 1,5   module, video module, rotating knob, push button (in hand),
 visits of CON   visits of CON   hospitalized    years with GP   years with GP
                                                                                                      parent dashboard.
 Handwritten     Babytracker     No tracking     No tracking     Handwritten
 diary           app             of data         of data         diary           Was valuable to keep track of how often a baby was being
 Table 1. Overview of participating healthcare professionals                     fed, they could use the parent dashboard to assign the label
and families with ages, education levels, health problem, care                   ‘feeding’ to the push button. From that point onwards,
  focus, patient-provider relationship, and data experience.                     when the push button was pressed, a new ‘feeding’ event
                                                                                 would be recorded. The assigned labels could be freely
A data-enabled canvas
                                                                                 changed at any point in time. All recorded events would be
The domain of home-collected (baby) data is heavily
                                                                                 displayed on the parent and HCP dashboard as a simple log
connoted with apps, screen interfaces and quantified self
                                                                                 of all events (figure 4). In addition, a message center in all
products. We aimed to enable participants to think freely
                                                                                 dashboards allowed communication between the parents,
about the possible benefits of sharing data with HCPs,
                                                                                 HCPs and design researchers.
instead of what the next great app (feature) could be.
                                                                                 It is important to note that the physical loggers were
(1) Family Toolkit
                                                                                 deliberately designed to be used for a single purpose.
By introducing a physical ‘family toolkit’ for parents, as
part of our data-enabled canvas, we aimed to position                            Hence, it would be impossible for parents to start logging
ourselves outside of the digital only frame of reference. In                     everything; they had to make conscious decisions on what
addition, we hoped that the physicality of the loggers made                      data was most relevant.
them stand out in the home context, so that everyone (e.g.
                                                                                  Data logger                 Functionality
mother, father, grandmother, sister, nanny) could decide to
keep track of things, instead of only those who had the app
                                                                                  (a) push-button module      saves when it is pressed
installed on their phone. Especially in the context of family
care where, for example, grandparents and daycare are also                        (b) rotation-knob module    saves when it is pressed and at
responsible for the care of the baby, it would be a missed                                                    what position (from 0 to 100)
opportunity not to include them in data collection.
The family toolkit (figures 2 & 5) can facilitated a dialogue                     (c) video module            saves short videos (max. 5 mins)
between the parents and the HCPs through data collected at
                                                                                  (d) text module             saves text messages
home. As related work has given little insight into what
data may be relevant for parents to keep track of (let alone                     Table 2. Overview of physical data loggers, with functionality
how this could be tracked), the toolkit does not define this.
Instead, it is set up as a multi-purpose and dynamic set of                      Not only did we envision the physical trackers to be open-
tools for parents and HCPs to use in a way they see fit. The                     ended, we also designed the underlying technology in a way
toolkit consisted of (a) a collection of physical data loggers                   that would allow us to quickly design and introduce new
and (b) a parent dashboard displayed on a touchscreen (see                       physical data loggers. The smaller cylindrical loggers (A,
figure 2).                                                                       B) were built using the same hardware platform (i.e.
                                                                                 ESP8266 [10] with custom-designed printed circuit board).
The physical data loggers are generic, internet-connected,                       They were battery operated and could run for more than
manual trackers (see figure 3) that could be placed                              five weeks without a recharge; they were also wireless,
anywhere the parents wanted. Every data logger has a                             enabling parents to place them at a convenient place
different interaction style, resulting in different types of                     associated with the event (e.g. putting a ‘wet diaper’ logger
data (see table 2). Using the parent dashboard, parents                          next to the diaper changing table). Loggers C and D were
could, together with their HCP, define what the physical                         built using Android phones, and could be used wirelessly
loggers would be used for. For example, if they decided it                       and charged, but only had a battery lifespan of about a day.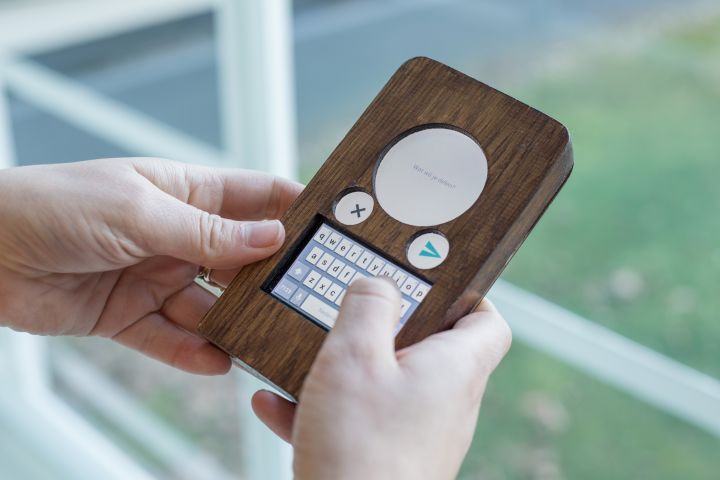
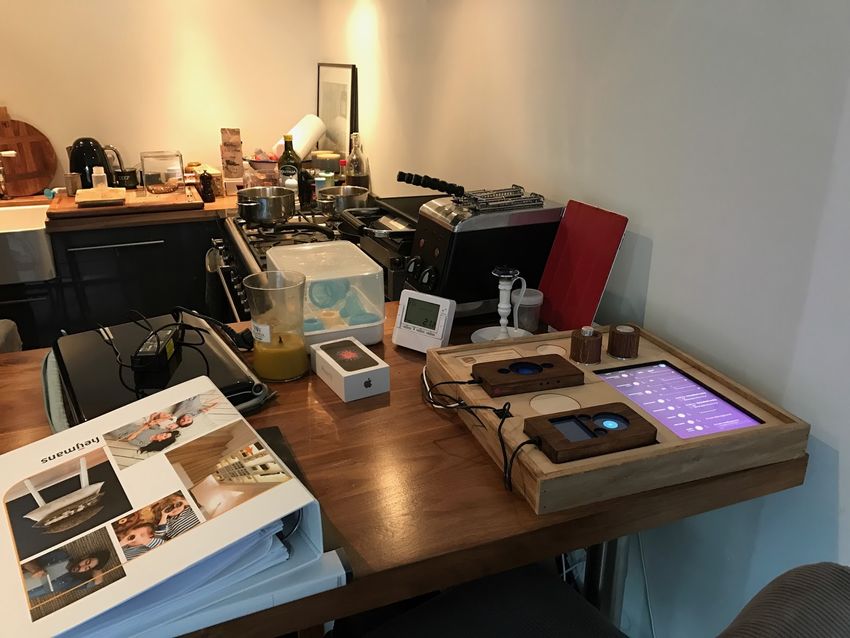
Figure 5. The 5 toolkits handed out to families
              Figure 3. The physical data loggers
                                                                   Procedure
                                                                   The situated explorations were planned to run for five
                                                                   weeks for all participants. Participants were phased in at
                                                                   different times to allow for any technical immaturities at the
                                                                   start, and to provide more time for new explorations. The
                                                                   study therefore ran for nine weeks in total. We hereafter
                                                                   refer to week numbers in relation to the starting date of
                                                                   each participant (i.e. week 1 of Family 1 will have a
                                                                   different date range to week 1 of Family 3).
                                                                   – For families
                                                                   In the introductory meeting at the family’s home, we
                                                                   introduced the purpose of the study and the functionality of
                                                                   the toolkit (figure 6). To help them become acquainted with
                                                                   how to log data and change the labels assigned to the data
                                                                   loggers, the parents were asked to label each module, based
                                                                   on what they thought could be useful to keep track of. In
                                                                   this way, we quickly learned about aspects that are of
                                                                   (temporal) relevance for them to discuss with their HCPs.
                                                                   We explained that the toolkit allows for quick updates, and
 Figure 4. Different elements of the HCP dashboard: (A) data       so encouraged them to actively think and make suggestions
   filters for the HCP; (B) visualization of the audio tracker     that we could respond to.
 (introduced later); (C) data logs of the physical trackers; (D)
                                                                   In the second week, a session was held with the parents in
                    annotations on data points.
                                                                   which we discussed their first experiences. In the weeks
(2) HCP Dashboard                                                  thereafter, there were only contact moments when specific
In the system, each family was connected to their HCP,             issues arose (e.g. technical malfunctioning, questions about
giving the HCP access to that family’s data. As with the           the study, changing health condition of the baby requiring
parent dashboard, the HCP dashboard initially displays the         exclusion from the study).
logbook (figure 4), but also offers some additional filters
and controls to zoom in/out to discover relations and              In the fifth (i.e. final) week, we met with the families twice.
patterns (figure 4-A). The HCP also has access to the              The first meeting was a session at home to reflect on their
messaging interface.                                               experiences, and to discuss their perspective on the
                                                                   relevance of home-collected baby data for themselves and
(3) Researcher Dashboard                                           their HCPs. The second was in a consult with the HCP and
The design researchers had access to the data of all families      design researchers, where they shared and discussed
and HCPs. As well as having a copy of the HCP dashboard,           experiences and asked any remaining questions.
the researcher dashboard contains more experimental data
visualizations and some metadata (when participants visit          – For healthcare professionals
the dashboard) to gain insight into the current exploration.       In an introductory meeting at the HCP’s office, the purpose
It can also be used to communicate with the participants           and setup of the study was explained. Both the family
and as a place to try out new features before going ‘live’.        toolkit and the HCP dashboard were introduced. To give
                                                                   HCPs a better understanding of the potential opportunities
                                                                   of the family toolkit, the researchers gave some hands-on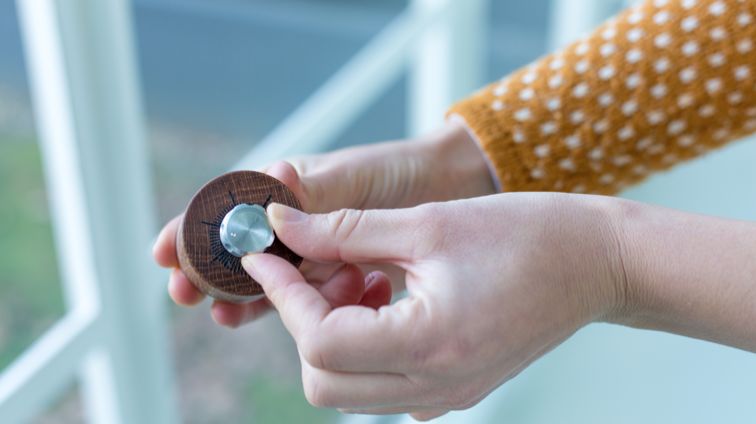
demos. Once every week the researchers visited the HCP to       In general, the system was very well received. Initially,
review the data collected by their families through the HCP     parents struggled with defining which labels to assign to the
dashboard, and to discuss new ideas. We explained that we       physical loggers, as the system was so open that it was
intended to design and explore ‘on-the-fly’, meaning that       challenging to find a starting point.
things would continuously change as their ideas and
                                                                “I am doubting what kind of information I should collect:
feedback were directly implemented.                             information around my questions of care or information about
                                                                everything I do? I would like to have answers to my questions but
                                                                think it might also be interesting to have the HCP access my
                                                                routines. There might be aspects which I find normal but which
                                                                the consultation officers find striking.” – Family 1
                                                                After using the system for several days, and as a result of
                                                                interactions with their HCP, this became clearer. From this
                                                                point onwards, the parents started to enthusiastically collect
                                                                extensive datasets.
                                                                Although very curious, the HCPs were more reluctant at
                                                                first. It was not immediately clear how the data could help
                                                                them, as it was hard to imagine what the parents would use
   Figure 6. The family toolkit installed during the situated   the data loggers for. This quickly changed once they
                         explorations                           received real data, as this gave them a better idea of what
– For design researchers                                        access to the data could mean for them, and what changes
In a weekly design meeting, all results and insights from       were required to move towards that. We present two
interviews and dashboard reviews were discussed. These          distinct directions, as the insights from the general
ranged from participant quotes and study questions to           practitioner and pediatrician showed large similarities but
technical difficulties or bug fixes. When participants sent     were unlike the insights from the consultation office nurse.
messages using their dashboard message center, we aimed         A design narrative towards My Care Question (for the
to respond within a couple of hours. Based on these             consultation office nurse)
insights, the team would collectively brainstorm and decide     The families started to collect data before having data-
which actions and new designs would have the largest            related interaction with their consultation office nurse. At
priority. The designs would balance the questions and ideas     this level of preventative care, the issues are less prominent
from the participants with the ideas of the design team,        and the parents found it difficult to pinpoint what data to
based on their insights.                                        collect. Consequently, they began with the most commonly
SITUATED EXPLORATIONS                                           tracked data: feeding and sleeping. Parents were very
In this section, we share two design narratives which           dedicated to tracking this repetitive information accurately,
describe the evolution of our situated explorations, and the    as they valued a complete overview.
rich and detailed stories that have driven them. These          “Sometimes I click the button twice as I forgot to log the previous
narratives are formed from a study timeline where,              one. But that doesn’t show the real situation.” – Family 2
throughout the exploration, we tracked user behavior and
experiences, resulting insights and new design                  As this seemed an important value, we introduced the
interventions. As most design interventions were directly       ability to manually add data points at a certain time (in the
connected to one or more insights resulting from other          past) and the ability to delete (wrong) data points (figure 4).
design interventions, they clearly show the design              To achieve this, we integrated a comment option for each
narratives throughout the situated explorations. Where          data point. Parents could use the comment facility to record
relevant, we use reflection on action, as described by Schön    what was wrong with a given data point and what needed to
[36], to describe the design narratives. From a collection of   be changed. This was visible to the design research team,
                                                                who initially updated the data manually.
multiple narratives, we selected those that lead to the more
concrete design concepts.                                       “I am so pleased with the adaption possibilities. When I forget it
                                                                in the middle of the night and enter the data in the morning, it
Cumulatively, families participated for 127 days over a         automatically ‘jumps’ to the right position on the timeline – so
period of nine weeks. In total, we collected 1372 data          nice.” – Family 3
entries from the physical data loggers, which were divided
over 25 different assigned labels. The HCPs typed 20            After the first weeks, the consultation office nurse received
messages to families. We sat together with participants for a   extensive overviews of accurately tracked data in the form
total of 36 hours, and made changes to the data-enabled         of a timeline. There was so much data that it took the HCP
canvas continuously.                                            about 30 minutes to go through it. At many points she saw
                                                                something she thought could be worth giving feedback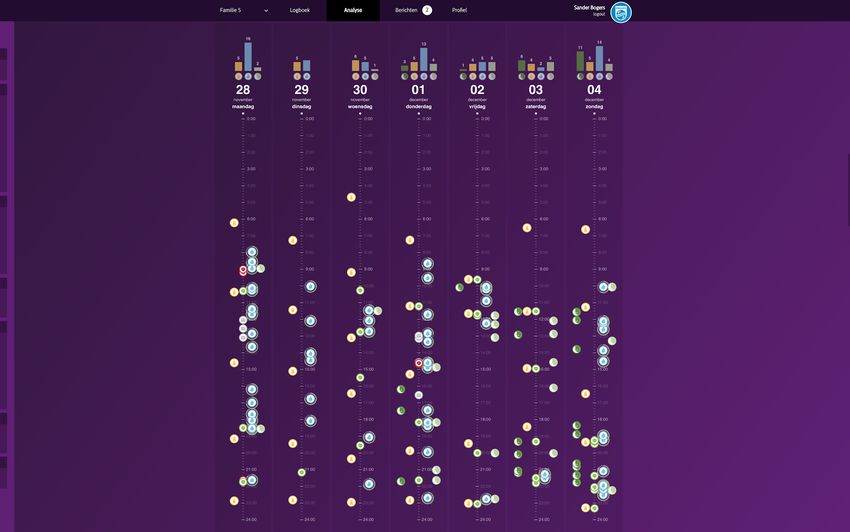
about, however, she also did not want to worry parents               and the HCP receives the list of questions with associated
about something that was not causing any problems.                   data.
“I am doubting. I see a lot of data that I could respond to,         The My Care Question module was introduced to Family 2
but I’m hesitant to do so as I do not want to create issues or       two weeks before the end of the situated explorations, It
concerns that are not there.” – Consultation Office Nurse            immediately proved its relevance, as shown below.
The nurse made a case for easier browsing through the data,
as this could significantly speed up the task of reviewing it.
We therefore implemented data filters so that irrelevant data
could be hidden.
In the meantime, the parents continued to track the same
data but also started to use the comments facility. Although
intended as a workaround for manual data adjustment, they
also used comments to give more qualitative information
about the data they collected. As the comments were
previously only visible to the design research team, we
quickly enabled the HCP to not only see them, but also to
write new comments.
As a comment on “sleep” by the parent – “Baby went to sleep at
21:00, after a feed at 18:30 we took a shower, baby was awake in
my arms. In his crib he cried a lot, fell asleep in my arms in the
nursing room, then I put him to bed in the nursing room. – Family
1
The comment above shows the ‘obvious’ first data tracked
by the family becoming more detailed and nuanced through
the addition of context and personal experiences. As the
HCP started to gain a better understanding of what the data
might bring, she started to ask for other details that could
provide more contextual insight. Together, the HCP and the
family decided to start tracking the ‘easiness of falling
                                                                     Figure 7. An example question asked in the My Care Question
asleep’, using the rotation knob. After doing this for several
                                                                      module. At the top, the question is formulated (A). Next, the
days, based on whether her experience of ‘falling asleep              relevant data types can be selected, using a number of filters
peacefully’ matched what can be expected of a five-week-             (B). A simple summary data visual is then shown (C), followed
old baby, the HCP discussed this with the parents further.                               by all data points (D).
Although the consultation office nurse was now equipped              The mother of Family 2 used the new My Care Question
with a dashboard that allowed for easier filtering of data           module to ask how she could increase her breastfeeding
and had a better contextual understanding of the data                supply through expressing (i.e. pumping) (figure 7). She
through the comments from the parents, she still clearly             connected data about the duration and volume of expressing
struggled with the large amount of data and how to deal              to the question. As this clearly illustrated a highly irregular
with it. In contrast to her normal approach, where parents           routine during that time, the consultation office nurse
ask questions and she tries to answer them, there now                advised her to pump delicately every two hours for two
seemed to be an expectation for her to give advice without a         days. Unfortunately, that advice did not have the desired
clear question. She clearly appreciated it when a concrete           effect (also visible in the data).
question appeared in one of the comments, and explained
that she always used a question-based approach whereby               “After 29 years of experience, I have not often experienced that
                                                                     breastmilk amounts do not increase [after giving this advice].” –
parents explained what was on their mind and she would try           Consultation Office Nurse
to find a solution.
                                                                     To find suitable advice, the consultation office nurse
Inspired by this, we built the ‘My Care Question’ concept.           reached out to a lactation consultant. She communicated the
This is a different tab/window in the parent dashboard               new advice through the My Care Question module, and it
where new questions can be initialized and data points               had a positive effect. In the reflective session, both the
(historic or to be collected) can be selected, where the data        mother and the consultation office nurse reported being
points are relevant for the HCP to better help with the              very satisfied with the functionality of the module.
question (i.e. the question module provided a filter on the
data set by the parents for the HCP). Based on the data              “Now I get much more information (...). Maybe, when you [mum]
points, the system creates a simple data summary overview,           had seen me two weeks after, you might have already stopped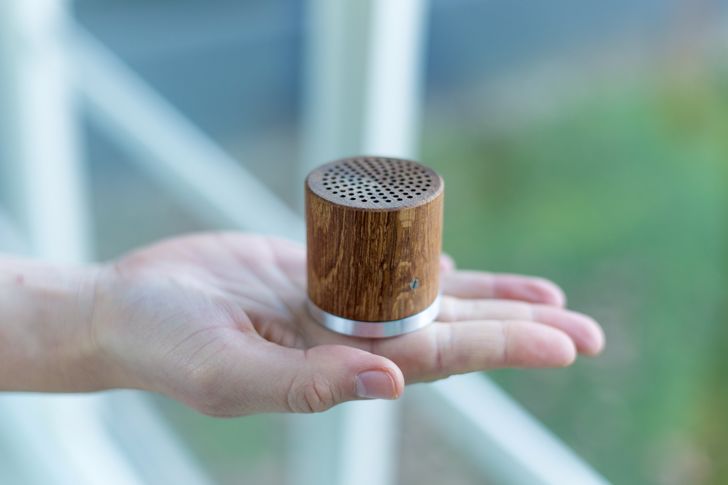
expressing. You might have thought ‘this isn’t working out’ and       still struggled in coming up with more usable data
maybe you would have switched to bottle feeding already. [mum         visualizations. As the physical loggers could be used to
confirms]” – Consultation Office Nurse                                keep track of any kind of data, our visualizations needed to
A design narrative towards Care Paths (for the GP and                 be abstract representations that had no understanding of
pediatrician)                                                         context. As they had to be generic, we kept coming back to
When the parents received the toolkits, we encouraged                 timeline visualizations that stayed the same conceptually
them to start logging the data they expected to be relevant           but had improved readability.
for them in interactions with their HCP. Compared to the
families participating with the consultation office nurse,
these families found it a little easier to define what their
data loggers would collect as there was a clearer issue at
hand. They appreciated the fact that they were now able to
keep track of a problem so that their HCP would “see what
our baby is going through” (Family 5).
After the first week, the data collected by the families was
presented to the GP and pediatrician in the form of a
logbook of events (figure 4). Both professionals struggled
to make sense of the data. It was difficult to get an
overview as an extensive set of data had already been
collected. We agreed that this was probably the case
because having an overview alongside the ability to look at
the data from different angles was necessary, but widely
missing. In response, we developed the first version of a              Figure 9. A new data visualization. Different days are shown
timeline data visualization, for the HCP dashboard (see                    next to each other; icons represent labels. At the top,
figure 8).                                                                   cumulative charts show how often events occur.
                                                                      From the HCP perspective it was clear what kind of data
                                                                      was needed in a specific case. In an ideal world that data
                                                                      would be collected as accurately as possible. Manually
                                                                      tracked data had clear advantages, as it was open and
                                                                      almost anything could be collected, but the HCPs
                                                                      sometimes questioned its quality. For example, was there
                                                                      no feeding at a given point because there was no feeding, or
                                                                      because it was not logged?
                                                                      To support a request for sleep tracking and explore the
Figure 8. Data visualization, first version. The color of the dots
                                                                      value of an automated data logger, we introduced two new
      is mapped to the type of physical data logger used.
                                                                      data loggers: (1) the two-state toggle button, and (2) the
The new visualization did not provide a solution to the               audio module.
issues highlighted during the first meeting. It was still
                                                                      (1) The two-state toggle button (figure 10) was introduced
difficult for the HCPs to get a good overview, and they
                                                                      to support the sleep request. Where the other buttons only
argued strongly that the data collected by the parents was
                                                                      register an event at a particular moment in time, this button
way too much: they only needed to see specific things that
                                                                      registers when it is in its pressed state and thus logs the
could help to answer some of their unanswered questions.
                                                                      duration of events. (2) The audio module (figure 10) was
Also, the GP felt that by tracking data some parents may
                                                                      introduced to elicit responses about automated data loggers.
become so obsessed with it that it had the potential to
                                                                      The module can be freely placed throughout the house and
magnify the problem. As a result, both HCPs asked parents
                                                                      continuously keeps track of environmental sound levels and
to keep track of specific things.
                                                                      tone heights. Approximately every five hours a
“I am a GP, I only want to see information related to the care        visualization appears in the parent and HCP dashboard,
question. Parents visit me because they have a problem, not to        summarizing that time slot (figure 4).
show videos of how cute their baby is.” – GP
                                                                      Although the data in current form was hard to interpret
“I want to stimulate the family to make videos of skin rash or
                                                                      initially, the parents started exploring how these modules
uncommon behavior, that is very valuable to me. We can stop with
tracking full (poo) diapers, and replace it by wet diapers. Also, I
                                                                      could be valuable. They came up with unexpected use cases
want the family to track sleep.” – Pediatrician                       and questions as to how this information could be relevant.

Where the HCP partly found a solution to data overload by             Although both HCPs expected to see a ‘universal truth’
helping parents focus on what data to collect, we together            from the automated data collectors, it became clear that, for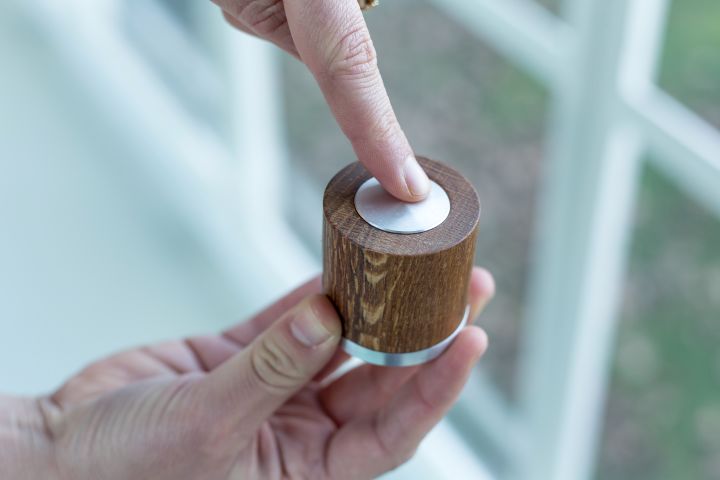
both the manual and the automated loggers, it was
important to build a shared understanding of what the data
means. Only then can it become meaningful for both
parties.

                                                                       Figure 11. A care path-specific data visualization for reflux,
                                                                            showing the time between feeding and spitting up
                                                                      Because the care paths pre-define the problem and
 Figure 10. The toggle button (left) and audio module (right)         concurrent data request, where the data gains contextual
                                                                      value, we were able to move away from generic timeline
 “I wonder, if he [my baby] makes a lot of noise during the night,    visualizations. This allowed us to create care path-specific
is he doing that constantly or only 15 minutes before he wants
                                                                      data visualizations that would emphasize other elements.
food?” – Family 2
We see a good example of this in how Family 4 used the                Figure 11 shows the first version of a care path-specific
video module to annotate the rotation knob. Initially the             visualization for reflux. It shows the temporary relation
                                                                      between feeding (in the center) and spitting up (the green
rotation knob was set to track ‘crying’. The minimum of the
                                                                      lines), compiled from data from the reflux module gathered
knob was manually defined as ‘whining’, and the maximum
                                                                      by Family 5. From this visualization, it can be seen that,
as ‘screaming’. Upon questions from the GP, the mother
                                                                      over the previous 14 days, the baby never spat up within an
made two videos, one showing whining, and the other
                                                                      hour after feeding. We presented this visualization to the
screaming. Immediately, the GP had a frame of reference
                                                                      GP, who quickly responded:
for that data.
                                                                      “There is no spitting after a feed, only before. That doesn’t seem
In short, we discovered that the HCP would like to be in              to be a reflux problem...” – GP
control and somehow regulate what is being kept track of,
to prevent parents from worrying too much.                            Mother elaborated: “When my baby spits up, I give him a little sip
                                                                      to rinse away that disgusting taste.” – Family 5
Building on this, we introduced ‘Care Paths’: problem-
specific care modules. HCPs could start these modules                 The care path-specific data visualization helped the GP to
when there was a clear indication for a problem or a                  gain insight into what might be causing the baby to spit up,
diagnosis had already been made. Each problem-specific                and how she could best help the family to make it better. In
module pre-lists a set of data points that are important for          addition, it provided her with the tools to monitor
the parent to keep track of. After the HCP initializes a              improvement.
module, the request shows up on the parent dashboard.
Upon acceptance, all the labels for the physical loggers              Together with the HCP, we developed six Care Path
automatically update to those defined by the module. For              modules, and defined what data was relevant for each one.
example, the allergies care module may ask parents to take            However, we also learned that the set of data defined by the
a video of a skin condition, using the video module, every            HCPs; the Care Path modules should have the flexibility to
day. As the Care Path modules focus on more specific                  enable parents to track extra data points if they want to.
issues, they can also involve function-specific automated
loggers (e.g. a smart baby bottle for feeding issues).                DISCUSSION
                                                                      In this paper, we presented a data-enabled design
We implemented a Care Path reflux module during the last              exploration where we explored, in context, how parent-
week of the situated explorations and discussed this in final         tracked baby data can be valuable in the interaction
interviews. Although the HCPs were enthusiast about the               between parents and HCPs. We chose this approach
concept, the parents were less convinced of it in its current         because (1) we wanted to explore what data could be
form. In the current setup, they felt that what they found to         valuable, in contrast to prior work that defined this upfront;
be valuable was not integrated enough. This is clearly                and (2) because we wanted to be able to translate our
evident in the following quotes:                                      insights immediately into designs that could be
“In this case, I just want to know when the baby is fed, when he      experienced, thus enabling us to explore how data can be
spits up and when he cries. It is as simple as that.” – GP            relevant in their interactions.
“If I only tracked feeds, spitting up and crying, I don’t think the   The exploration of what data is relevant
GP would have enough understanding of the situation. Sometimes        By enabling parents and HCPs to have a continuous
my baby is not crying but clearly uncomfortable, you could notice     dialogue about what data was relevant for them, working
that by not going to sleep.” – Family 5                               together, they quickly went beyond the most commonly
tracked data (e.g. feeding, sleeping, diapers, milestones). removed almost all of them), the pediatrician really
The data loggers were set to track more detailed and appreciated these. He argued that because he has no
nuanced activities that often provided an experiential layer background knowledge of the family coming to the consult,
on top of the data [2]. The assigned labels ‘easiness of the videos could help him to get a rich contextual snapshot
falling asleep’, ‘response to reflux’, and ‘position of waking of the family (e.g. a chaotic household) and thereby allows
up’ as well as parents’ comments to data points are good for advice personalization [32]. This example, again,
examples of this. It is interesting to see how these labels reinforces the fact that different HCPs have different needs
became more detailed over time, as the questions of the and different ways of working.
parent and HCP did. We would argue that, had we started
At the start of the situated explorations, parents and HCPs
this exploration from existing baby apps as uGrow, without
initially struggled to find a direction for data gathering.
a dynamic data-enabled canvas, it would have been more
However, regardless of their initial choices, the experience
difficult to go beyond this (in our eyes, superficial) layer.
of gathering and reviewing data inspired a collaborative
By selecting HCPs from different levels of care, we were data-relabeling process between the parent and HCP. It
able to corroborate our belief that different types of made them, and thus also the design research team, see
professionals have different data needs [6]. The possibilities and pitfalls of data that they would not
consultation office nurse, for example, wanted to necessarily have thought of before. For the same reason, we
understand development, while the pediatrician wanted to directly implemented new design ideas arising from the
know how long after a feeding the baby would spit up. insights that emerged. And again, it was the experience of
Alongside the differences between types of professionals, participants using the updated data-enabled design canvas
the personality of individual professionals also played a that gave the most valuable insights to move forward. As
role. All had developed their own way of working the tools were designed to be open for remote updates, we
throughout their careers and preferred that the data have been able to run multiple insight-to-design iterations
respected that. The open nature of the data trackers proved in a single set of continuous situated explorations. The
to be very valuable in allowing professionals to use them in participants (i.e. families, healthcare professionals and
a way that they saw fit. researchers), study location and setup have had a clear
impact on how these situated explorations developed.
A critical note here is that although we clearly created more
Hence, we treat the presented narratives and concepts as
openness in what data was used than other case studies in
well-grounded starting points for future research rather than
this domain have shown, the boundaries of what could be
fully evaluated outcomes.
collected were not infinite. Through our toolkit, we created
a frame of reference for the participants that clearly CONCLUSION
influenced their perspective (i.e. nobody asked for medical From related previous work, we saw two clear ways in
measures such as pulse or lung capacity). which others have approached data-intensive projects. The
first uses data only as part of the solution; the second
The exploration of how data can be relevant
departs from data and questions how it might be relevant in
In the section on the situated explorations, we presented a
a given context. The latter, however, always defined what
variety of real-life use cases. For example, we saw the GP
data was used upfront. In this paper, we present a third
using manual feeding, spitting up and crying data to gain
approach, based on situated and explorative data-enabled
insight into potential reflux-related issues; the pediatrician
design approach. Many of our initial insights show a large
using video to monitor allergic skin responses; and the
overlap with those presented in previous work. However, as
consultation office nurse using breast pumping data to give
we moved forward and used different designs to embody
advice on how to increase milk production. Exploring
these insights, they became more detailed, nuanced and,
through these real-life use cases gave us a better
simply, different; they build on more complex insights from
understanding of the full complexity of the design space [5,
combinations of data in different settings that continuously
7, 19, 28]. As a result, we were not only able to identify
evolve. In the case study, we have shown how we brought
certain pitfalls but could also explore how to design around
together parents, HCPs and design researchers who were
them. For example, the GP strongly argued for limiting the
enabled to actively contribute by means of the data-enabled
amount of data that was collected by the families, as it
canvas. Through this, we demonstrated how different
would only make them more worried and focused on the
stakeholders, as experts in their own areas, together with
problem. Our response to this was that the design of the
design researchers have used data as a creative material to
Care Path modules would only allow certain types of data
allow new design interventions to emerge iteratively, while
collection for a fixed moment of time. For example, it
situated in real life.
would only allow tracking of crying for two weeks. The
situatedness of the explorations also allowed for the ACKNOWLEDGEMENTS
continuous emergence of inspiring and unexpected use This research was supported by the IMPULSE perinatology
cases. Whereas the GP argued strongly against the logging framework.
of ‘see how cute my baby is’ videos (and manuallyREFERENCES 13. Stefan Hirschauer. 1991. The Manufacture of Bodies in
1. Margunn Aanestad. 2003. The Camera as an Actor Design- Surgery. Social Studies of Science 21, 2: 297-319.
in-Use of Telemedicine Infrastructure in Surgery.
Computer Supported Cooperative Work (CSCW) 12, 1: 1- 14. Nicholas Huba, and Yan Zhang. 2012. Designing patient-
20. centered personal health records (PHRs): health care
professionals’ perspective on patient generated data.
2. Amid Ayobi, Paul Marshall, Anna L Cox and Yunan Chen. Journal of Medical Systems 36, 6: 3893-3905.
2017. Quantifying the Body and Caring for the Mind: Self-
Tracking in Multiple Sclerosis. In proceedings of the 2017 15. Kelly Joyce. 2005. Appealing Images: Magnetic
CHI Conference on Human Factors in Computing Systems Resonance Imagining and the Production of Authoritative
- CHI’17, 6889-6901. Knowledge. Social Studies of Science 35, 3: 437-462.
3. Apple. 2017. A bold way to look at your health. Retrieved 16. Marije Kanis, Saskia Robben, Judith Hagen, Anne
December 11, 2017 from Bimmerman, Natasja Wagelaar and Ben Kröse. 2013.
https://www.apple.com/ios/health/ Sensor Monitoring in the Home: Giving Voice to Elderly
People. In proceedings of conference on Pervasive
4. Sander Bogers, Joep Frens, Janne van Kollenburg, Eva Computing Technologies for Healthcare. 97-100.
Deckers, and Caroline Hummels, 2016. Connected Baby
Bottle: A design case study towards a framework for data- 17. Bonnie Kaplan. 1995. Objectification and negotiation in
enabled design. In Proceedings of the 2016 ACM interpreting clinical images: implications for computer-
Conference on Designing Interactive Systems (DIS’16), based patient records. Artificial Intelligence in Medicine 7,
301-311. 5: 439-454.
5. Chia-Fang Chung, Jonathan Cook, Elizabeth Bales, 18. Julie Kientz, Rosa Arriaga, Gregory Abowd. 2009. Baby
Jasmine Zia, and Sean A. Munson. 2015. More than Steps: Evaluation of a System to Support Record-Keeping
telemonitoring: Health provider use and nonuse of life-log for Parents of Young Children. In Proceedings of the 2009
data in irritable bowel syndrome and weight management. CHI Conference on Human Factors in Computing Systems
Journal of Medical Internet Research, 17(8). doi: - CHI’09, 1713-1722.
10.2196/jmir.4364. 19. Soo-Cheol Kim, Young-Sik Jeong, Sang-Oh Park. 2013.
6. Chia-Fang Chung, Kristin Dew, Allison Cole, Jasmine Zia, RFID-based indoor location tracking to ensure the safety of
James Fogarty, Julie A. Kientz and Sean A. Munson. 2016. the elderly in smart home environments. Pers Ubiquit
Boundary negotiating artifacts in personal informatics: Comput 17:1699–1707.
Patient-provider collaboration with patient-generated data. 20. Yoojung Kim, Eunyoung Heo, Hyunjeong Lee, Sookyoung
In Proceedings of the 19th ACM Conference on Computer- Ji, Jueun Choi, Jeong-Whun Kim, Joongseek Lee,
Supported Cooperative Work & Social Computing. Sooyoung Yoo. Prescribing 10,000 Steps like Aspirin:
7. DEE Mary Jo Deering, Erin Siminerio, and Scott Designing a Novel Interface for Data-Driven Medical
Weinstein. 2013. Issue Brief: Patient-Generated Health Consultation. In Proceedings of the 2017 CHI Conference
Data and Health IT. Office of the National Coordinator for on Human Factors in Computing Systems - CHI’17, 5797-
HealthInformation Technology 5796.
8. Biplap Deka. 2016. Data-driven Mobile App Design. In 21. Predrag Klasnja and Wanda Pratt. 2012. Healthcare in the
Proceedings of the User Interface Software and pocket: Mapping the Space of Mobile-phone Health
Technology Symposium –UIST '16 Adjunct, 21-24. Interventions. J Biomet Inform 45, 1: 184-198.
9. Daniel A. Epstein, An Ping, James Fogarty, and Sean A. 22. Janne van Kollenburg, Sander Bogers, Eva Deckers, Joep
Munson. 2015. A Lived Informatics Model of Personal Frens, Caroline Hummels. 2017. How Design-inclusive
Informatics. In Proceedings of the 2015 ACM International UXR Influenced the Integration of Project Activities:
Joint Conference on Pervasive and Ubiquitous Computing Three Design Cases from Industry. In Proceedings of the
(UbiComp '15). 2017 CHI Conference on Human Factors in Computing
Systems - CHI’17, 1408-1418.
10. Espressif Systems IOT Team. 2017. ESP8266EX
Datasheet. Retrieved September 18, 2017 from https://cdn- 23. Eun Kyoung Choe, Nicole Lee, Bongshin Lee, Wanda
shop.adafruit.com/product-files/2471/0A- Pratt and Julie Kientz. 2014. Understanding Quantified-
ESP8266__Datasheet__EN_v4.3.pdf. selfers’ Practices in Collecting and Exploring Personal
Data. In Proceedings of the 2014 CHI Conference on
11. Fitbit. Find your fit. 2017. Retrieved December 11, 2017 Human Factors in Computing Systems - CHI’14, 1143-
from www.fitbit.com/. 1152.
12. Glow Inc. 2017.Glow Baby - Baby Tracker App. Retrieved 24. Ian Li, Anind K. Dey and Jodi Forlizzi. 2010. A stagebased
September 18, 2017 from model of personal informatics systems. In Proceedings of
https://itunes.apple.com/us/app/id1077177456. the SIGCHI Conference on Human Factors in Computing
Systems (CHI '10). ACM25. Ian Li, Anind K. Dey and Jodi Forlizzi. 2011. http://www.philips.co.uk/c-m-mo/ugrow-healthy-baby-
Understanding my data, myself: supporting self-reflection development-app.
with ubicomp technologies. In Proceedings of the
35. Amit Prasad. 2005. Making Images/Making Bodies:
Conference on Ubiquitous Computing - UbiComp’11, 405-
Visibilizing and Disciplining through Magnetic Resonance
414.
Imaging (MRI). Science, Technology & Human Values 30,
26. Life'n Stats LLC. 2017. MammaBaby - Breast feeding App 2: 291-316.
& Baby Log Tracker. Retrieved September 18, 2017 from
https://itunes.apple.com/us/app/mammababy-breast- 36. D.A. Schön. 1983. The Reflective Practitioner: How
feeding-app-baby-log-tracker/id618601202?mt=8. Professionals Think in Action. New York: Basic Books.
27. Máxima Medisch Centrum. 2017. De METC van het 37. Jelle Stienstra, Sander Bogers, Joep Frens. 2015.
Máxima Medisch Centrum. Retrieved September 18, 2017 Designerly Handles: Dynamic and Contextualized Enablers
from for Interaction Designers. In Proceedings of Conference on
https://www.mmc.nl/professionals/wetenschappelijk_onder Design and Semantics of Form and Movement 2015. 86-94.
zoek_in_mmc/metc/introductie. 38. Hyewon Suh, John Porter, Alexis Hiniker, Julie Kientz.
28. Helena Mentis, Anita Komlodi, Katrina Schrader, Michael 2014. @BabySteps: Design and Evaluation of a System for
Phipps, Ann Gruber-Baldini, Karen Yarbrough and Lisa using Twitter for Tracking Children’s Developmental
Shulman. 2017. Crafting a View of Self-Tracking Data in Milestones. In Proceedings of the 2014 CHI Conference on
the Clinical Visit. In Proceedings of the 2017 CHI Human Factors in Computing Systems - CHI’14, 2279-
Conference on Human Factors in Computing Systems - 2288.
CHI’17, 5800-5812. 39. Emanuel Vonach, Marianne Ternek, Georg Gerstweiler,
29. Gina Neff and Dawn Nafus. 2016. Self-Tracking. MIT Hannes Kaufmann. 2016. Design of a Health Monitoring
Press, Cambridge, MA. Toy for Children. In Proceedings of the 2016 Interaction
Design and Children Conference - IDC’16, 58-67.
30. Nighp Software LLC. 2017. Baby Tracker (Feed timer,
sleep, diaper log). Retrieved September 18, 2017 from 40. Naomi Yamashita, Hideaki Kuzuoka, Keiji Hirata, Takashi
https://itunes.apple.com/us/app/baby-tracker-feed-timer- Kudo, Eiji Aramaki and Kazuki Hattori. 2017. Changing
sleep-diaper-log/id779656557?mt=8. Moods: How Manual Tracking by Family Caregivers
Improves Caring and Family Communication. In
31. NOK- Nokia. 2017. An ideal weight loss companion. Proceedings of the 2017 CHI Conference on Human
Retrieved December 11, 2017 from Factors in Computing Systems - CHI’17, 158-169.
https://health.nokia.com/us/en/body-plus.
41. Haining Zhu, Joanna Colgan, Madhu Reddy, and Eun
32. Sun Young Park, Hee Young Jeong, John Zimmerman. Kyoung Choe. 2016. Sharing Patient-Generated Data in
2008. ENSURE: Support for Parents in Managing their Clinical Practices: An Interview Study. In AMIA Annual
Children’s Health. In \Proceedings of the Conference on Symposium Proceedings American Medical Informatics
Design and Emotion. The Design and Emotion Society. Association, 1303–1312.
33. Philips AVENT. 2017. Philips AVENT. Retrieved January
22, 2017 from http://www.philips.co.uk/c-m-mo/philips-
avent-and-your-baby.
34. Philips AVENT. 2017. uGrow- the world’s first medical
baby app with connected devices giving you personal
advice that matters. Retrieved September 18, 2017 fromYou can also read