The eggficient Prinzen - Insights in the throughput time - University of Twente Student Theses
←
→
Page content transcription
If your browser does not render page correctly, please read the page content below

2021

 The eggficient Prinzen
 Insights in the throughput time.

UNIVERISITY OF TWENTE
BACHELOR THESIS INDUSTRIAL ENGINEERING AND MANAGEMENT (IEM)
FACULTY OF BEHAVIOURAL, MANAGEMENT AND SOCIAL SCIENCES (BMS)

BY JAAP LEUVERINK
 PRINZEN | WEVERIJ 18, 7122 MS
 Supervisor: Gayane Sedrakyan
 2nd supervisor: Asad Abdiesfandani
 Company supervisor: Mike Kiens
1
“Who controls the past controls the future: who controls the present
 controls the past”

 ~ George Orwell

 2
Preface
The report you are about to read is the result of the bachelor thesis conducted at Prinzen to
complete the bachelor Industrial Engineering and Management at the University of Twente.
The thesis was under the supervision of the team leader operations and the affairs & resource
officer of Prinzen.
I would like to thank my supervisors and all other employees, whether they were involved in
my project or not, for allowing me to do my bachelor thesis at Prinzen. A special thanks to all
the employees who contributed to the research and showing support. I felt, and still feel very
welcome at Prinzen. Therefore, I am glad that our collaboration does not end with the thesis
because of the opportunity to work for Prinzen.
Also, a special thanks go to the supervisor from the University of Twente, Gayane Sedrakyan.
The thesis would not be the same without your fast reactions to my emails, the feedback, and
the suggestions. I would also like to thank the second reader of this report, Asad
Abdiesfandani.
At last, I Would like to thank my family and friends for always believing in me during my study
and research, and allowing me the opportunity to make sure this thesis came to a good end.
A special thanks goes to my buddies: Yorick Beekman, Siemen Kaak, and Jimmy van Santen.
Your feedback and support improved my thesis and helped me to stay on track.
Jaap Leuverink
July 2021

 3
Management summary
Introduction
Prinzen is a company based in Aalten, the Netherlands, and specialized in egg handling
equipment. Prinzen is part of the Vencomatic Group, the group provides solutions in housing
equipment, egg handling, and climate control. The Vencomatic group tries to deliver solutions
with the lowest possible environmental impact while achieving the highest animal welfare
levels. The specialty of Prinzen is a machine that produces a 99.7% points down setting of the
eggs.

Prinzen wants to be eggficient, part of this plan is that they deliver machines to clients with a
throughput time of 4, 8, or 12 weeks. However, the current situation is that they rarely meet
those target values. This leads to the following action problem:

 At this moment the throughput time is difficult to measure and inconsistent due to several
 reasons mentioned below, that is why Prinzen is not able to reach their target times of 4, 8,
 or 12 weeks.

Interviews with the stakeholders identified several possible problems for a too long throughput
time, but all problems mentioned were based on feelings and observations from the practice.
The current throughput time was not known, and this is necessary to know where the problem
is occurring. Therefore the following main research question is answered in this thesis:

 How can Prinzen get a clear image of what the current throughput time is concerning the
 planned throughput figures?

Solution method
To solve the core problem and answer the main research question a solution method is
designed. The solution method is based on a summary of methods in theories found from the
current academic literature combined with inputs from the practice. The method is easy to use,
fits the characteristics of the case, is measurable, and has an added value for future use. It
consists of 5 steps. The first step is to analyse the order process flow. The second step is to
identify key performance indicators (KPIs). Since there is no data available for this particular
company case the third step is to create dummy data. The fourth step is to create a dashboard
with the output of all the previous steps. For this company case, the dashboard shows what
could be monitored if the data was available. The dashboard also has a simulation function,
which was a suggestion by Prinzen. The fifth and last step is to evaluate the output of the
solution method with the stakeholders. The solution method is a mixed research method. It
uses quantitative research for the analysis of the dummy data, but it also uses qualitative
research for the analysis of the order process. The analysis of the order process is achieved
by the use of interviews with Prinzen employees.

Implementation
The implementation is divided into three parts, KPIs, dummy data, and the dashboard. The
KPIs were found in the literature and mentioned by stakeholders of the different departments
in Prinzen. The KPIs are prioritized according to the analytical hierarchy process (AHP). This
method is based on the pairwise comparison, the comparison is done by the problem owner.
The following list, from highest to lowest prioritization, is the results of the AHP.

 • Value-added time
 • Average time per phase

 4
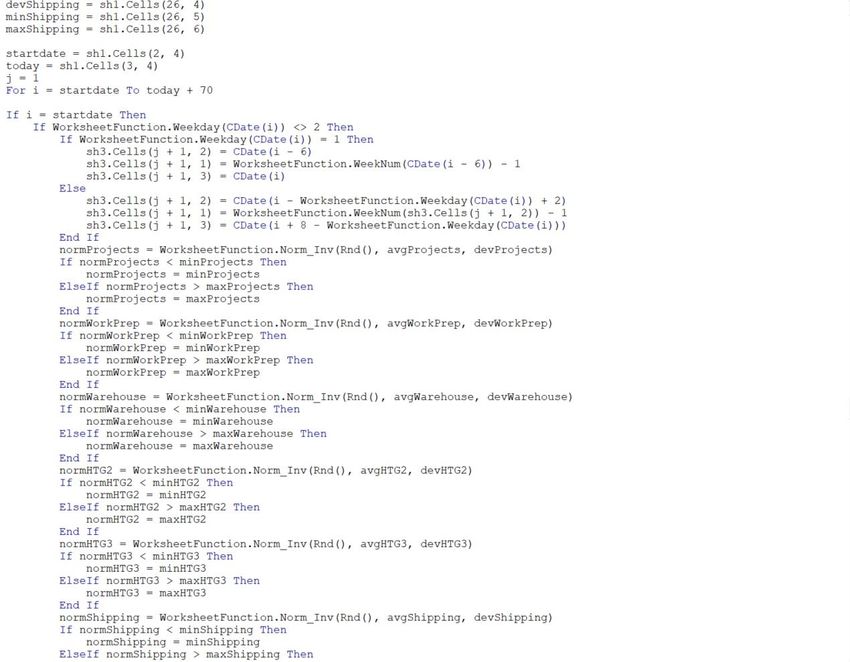
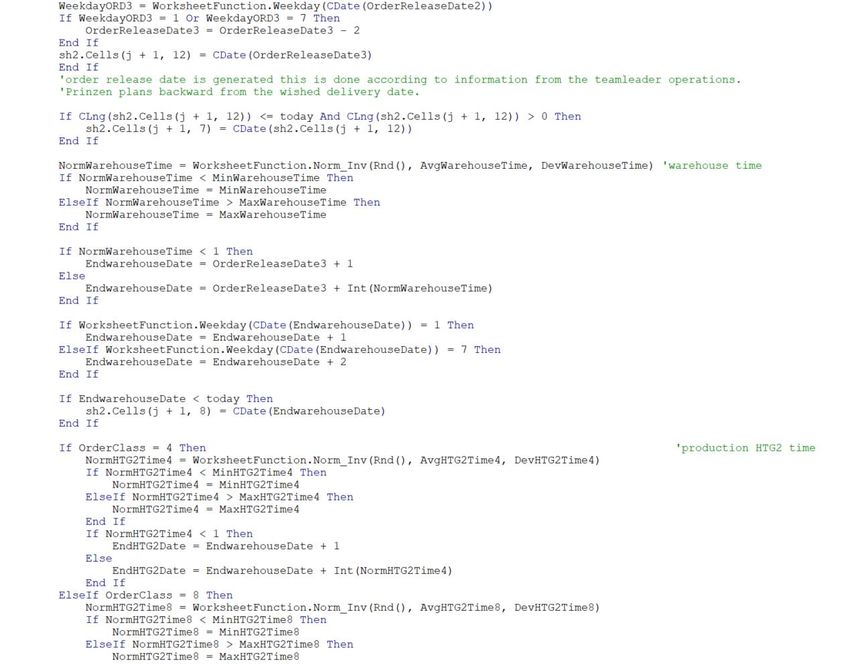
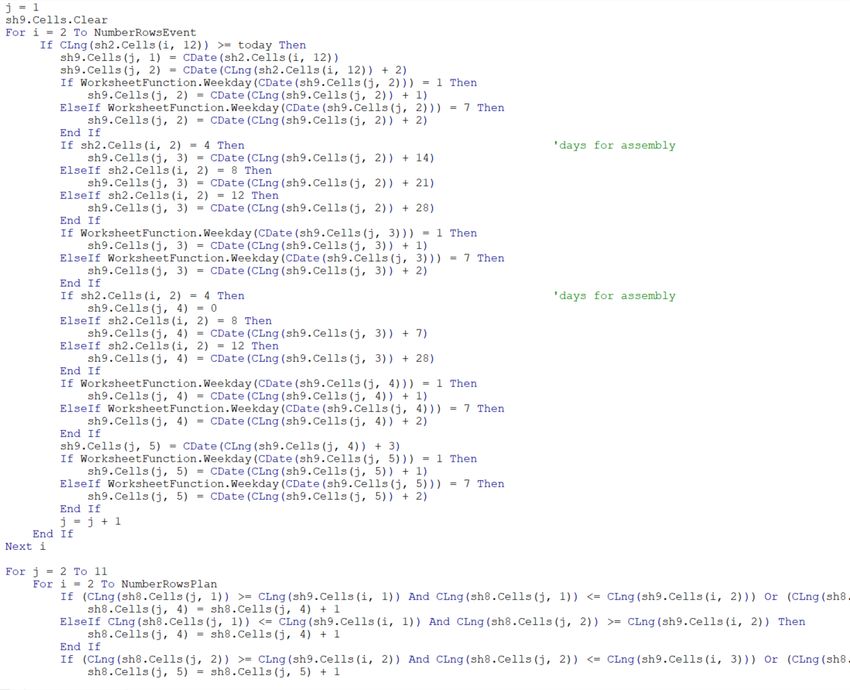
• Number of orders in progress per phase
 • Warning for too long throughput times
 • Planned orders in progress
 • Planned operation time

The second part of the implementation is the creation of the dummy data. The input for the
dummy data came from interviews with the stakeholders of different departments in Prinzen.
With the use of Visual Basic for Applications (VBA) the input data generated two sheets, one
event log and two a capacity sheet. The event log is filled with orders and the times the
departments are finished. The capacity sheet is filled with the number of full-time employees
available each week per department in Prinzen.

The third part of the implementation is the generation of the KPIs for the dashboard. Each KPI
is generated on its sheet, with the use of a VBA code. The table in the sheet is transformed
into a graph and shown on the dashboard. All KPIs are implemented, except for the value-
added time. For this KPI, not enough data was available at this moment. An extra feature is
added to the dashboard which makes it possible for the user to simulate one day further in
time. If the input data represents the current situation, then this feature can be used to see
what happens if the team leader operations change certain parts of the order process.

Conclusion & recommendations
The research concludes that with the necessary data available the dashboard with its KPIs is
able to give insight into the throughput time. It is unfortunate that the data is not available and
that the dashboard is therefore based on dummy data only. Two recommendations were
proposed to make sure that Prinzen is able to make a dashboard based on the real data of the
order process. The first is to keep track of the order process with the use of an event log. The
second recommendation is to label orders with their target time as soon as they are entered
into the system. This label will be useful for the analysis of the throughput time.

Evaluation
This research has its limitations. The biggest limitation of the research is the lack of useful
data. The data gathered via interviews is based on feelings and observations from the practice.
While for this research it would be more useful to have already recorded data of the order
process from the past. The observations could be erroneous, and observations change from
day to day. The second limitation is the correctness of the data, this is a known problem for
Prinzen. The data from the Enterprise Resource Planning (ERP) system shows something else
than what happens in reality. A positive thing is that the dashboard has a sufficient capability
to allow for issues detection earlier during the process.

 5
Table of contents
1. Introduction .................................................................................................................... 9
 1.1. Company introduction ............................................................................................. 9
 1.2. Problem identification .............................................................................................. 9
 1.2.1. Action problem ................................................................................................. 9
 1.2.2. Problem cluster ...............................................................................................10
 1.3. Research design ....................................................................................................13
 1.3.1. Research questions.........................................................................................13
 1.3.2. Reliability, Validity & Limitations ......................................................................14
 1.3.3. Intended deliverables ......................................................................................14
2. Desired process ............................................................................................................15
 2.1. Process flow chart ..................................................................................................15
 2.2. Order classification .................................................................................................17
 2.3. Process conclusion ................................................................................................19
3. Data analysis.................................................................................................................19
 3.1. SAP (ERP system) .................................................................................................19
 3.2. Monday (project management tool) ........................................................................19
 3.3. Data analysis conclusion ........................................................................................20
4. Literature .......................................................................................................................20
 4.1. Throughput time .....................................................................................................20
 4.2. Process mining.......................................................................................................21
 4.3. KPI’s for process performance ...............................................................................21
 4.4. Operationalization ..................................................................................................22
5. Solution method ............................................................................................................23
 5.1. Prerequisites ..........................................................................................................23
 5.2. Steps of the method ...............................................................................................24
 5.2.1. Step 1 – Process analysis ...............................................................................24
 5.2.2. Step 2 – Identify KPIs ......................................................................................25
 5.2.3. Dummy data ....................................................................................................25
 5.2.4. Step 4 – Performance dashboard ....................................................................26
 5.2.5. Step 5 – Method evaluation .............................................................................26
 5.3. Research methods .................................................................................................26
 5.4. Solution method conclusion....................................................................................27
6. Implementation ..............................................................................................................27
 6.1. Key performance indicators ....................................................................................27
 6.1.1. KPI list .............................................................................................................27

 6
6.1.2. KPI prioritization process .................................................................................28
 6.2. Data selection procedure........................................................................................30
 6.2.1. Dummy data input ...........................................................................................30
 6.2.2. Dummy data macro’s ......................................................................................31
 6.2.3. Dummy data output .........................................................................................32
 6.3. KPI dashboard .......................................................................................................32
7. Conclusion ....................................................................................................................34
 7.1. Conclusions............................................................................................................34
 7.2. Recommendations .................................................................................................35
 7.3. Evaluation ..............................................................................................................35
 7.4. Future research ......................................................................................................36
References ...........................................................................................................................37
Appendices ..........................................................................................................................40
 Appendix A: Machines ......................................................................................................40
 Hatchery eggs ...............................................................................................................40
 Appendix B: Conversation.................................................................................................40
 Appendix C: Order type ....................................................................................................43
 Appendix D: Eggfiecency ..................................................................................................44
 Appendix E: Interview .......................................................................................................45
 Appendix F: Machine classification interview ....................................................................52
 Appendix G: Macro’s.........................................................................................................54
 Appendix G.1: macro generating event log data ............................................................54
 Appendix G.2: macro generating capacity data .............................................................58
 Appendix G.3: macro simulate one day .........................................................................60
 Appendix G.4: KPI average time per phase macro ........................................................64
 Appendix G.5: KPI order in progress macro ......................................................................65
 Appendix G.6: KPI warning long throughput times macro .................................................66
 Appendix G.7: KPI which department too late ...................................................................67
 Appendix G.8: KPI planned orders in progress .................................................................69
 Appendix G.9: KPI number of FTEs ..................................................................................70

 7
List of figures
Figure 1 Problem cluster with relations of Prinzen ................................................................12
Figure 2 The general process flow of Prinzen .......................................................................15
Figure 3 Speedpack 110 classification .................................................................................17
Figure 4 PSPC 7 classification .............................................................................................17
Figure 5 Smartpack classification .........................................................................................18
Figure 6 Speedpack 220 classification .................................................................................18
Figure 7 Order E classification..............................................................................................18
Figure 8 Order H classification .............................................................................................18
Figure 9 Order dashboard in Monday ...................................................................................20
Figure 10 Smart model .........................................................................................................22
Figure 11 Steps of the method .............................................................................................24
Figure 12 Dummy data input sheet .......................................................................................31
Figure 13 Event log example of one order ............................................................................32
Figure 14 Prinzen Dashboard ...............................................................................................33
Figure 15 Order type ............................................................................................................43
Figure 16 Eggficiency poster ................................................................................................44
Figure 17 order classification ................................................................................................54

List of tables
Table 1 Relative importance KPIs, team leader operations ..................................................29
Table 2 Weighted relative importance KPIs ..........................................................................29
Table 3 KPI weights .............................................................................................................29
Table 4 Hatchery eggs machines .........................................................................................40
Table 5 Consumption eggs machines...................................................................................40
Table 6 Hatchery automation machines ...............................................................................40
Table 7 interview results .......................................................................................................53
Table 8 Interview results.......................................................................................................53

List of Abbreviations
KPI(s) = Key Performance Indicator(s)
AHP = Analytical Hierarchy Process
VBA = Visual Basic for Applications
ERP = Enterprise Resource Planning
MTO = Make To Order
SMART = Specific, Measurable, Attainable, Realistic and Time-sensitive
FTE = Full-Time Equivalent

 8
1. Introduction
 1.1. Company introduction
Prinzen is a company based in Aalten. Prinzen is a part of the Vencomatic Group. The
Vencomatic Group consists of several companies. The Vencomatic Group provides solutions
in housing equipment, egg handling, and climate control. They do this for any type of poultry.
Their slogan is: “Think ahead with poultry people”. They try to deliver solutions with the lowest
possible environmental impact while achieving the highest animal welfare levels.

Prinzen is the company that makes the egg handling equipment. Prinzen was founded in 1984,
they soon started to develop their hatching egg packers and simple transfer. They developed
a machine that produces 99.7% points down setting of the eggs, this is 2,7% higher than when
it is manually done. When an egg is pointed down onto a tray the air pocket in the egg helps
to keep the yolk centered, this reduces the risk of the egg spoiling. In hatching, this is very
important, because more eggs hatching means more money for the farmer. The machines for
the hatchery have a capacity of 12.000 to 30.000 eggs per hour. The consumption egg
machines have a capacity of 18.000 to 80.000 eggs per hour. More information about the
machines is found in appendix A.

Prinzen wants to promise their clients that they can deliver different machines in 4, 8, or 12
weeks. The current situation is that they rarely meet those target values. The throughput-time
of the company is too long. The thesis aims to reduce the throughput time. This can be done
by a key performance indicator that shows what the throughput time is for the whole company,
a KPI about the throughput time per department, and a KPI that will show what the capacity is
based on the throughput time.

 1.2. Problem identification
A lot can be improved during all phases of the process at Prinzen according to the team leader
production. This section presents the action problem. The core problem that needs to be solved
is also identified. The core problem is determined via a problem cluster.

 1.2.1. Action problem
The problem that arises at Prinzen is that the targets in relation to delivery times are not always
met. The delivery times are mostly affected by the throughput times. The throughput time is
defined as the time an order is in the company, that is from order entry till the order leaves the
company. The throughput times that Prinzen uses as classifications are 4, 8, or 12 weeks,
depending on the complexity of the order. The problem has been around for some time, and
no one can say exactly where the problem originates. Prinzen wants to achieve throughput
times of 4, 8, or 12 weeks because it wants to differentiate itself from the competition.

Conformance of the desired and actual processes
The industry asks for a short delivery time. The delivery time is mostly influenced by the
throughput time. To become an industry leader, the plant manager of Prinzen set a norm for
the throughput time. The norm that Prinzen wants to achieve is 4 weeks for standard machines,
8 weeks for multiple machines (combination of 2 or 3 machines), and 12 weeks for complete
lines. What the reality exactly is, is difficult to say. The throughput time varies widely. Also, it
is not clear where in the organization the problem occurs. The problem owner is the Team
leader operations.

Action problem

 9
At this moment the throughput time is difficult to measure and inconsistent due to several
reasons mentioned below, that is why Prinzen is not able to reach their target times of 4, 8, or
12 weeks.

 1.2.2. Problem cluster
To identify the core problem, all the causes of the action problem are analyzed and identified.
The relationships to the root causes are further analyzed. Then they are shown in the problem
cluster figure below the problems that are mentioned by the stakeholders. To identify the root
causes conversations took place with representatives from various levels within the company.
A description of the conversation can be found in Appendix B.

 • The non-flexibility of resource planning in production.
 Prinzen made a competence matrix, in this matrix every production worker is assessed
 on his skills on a certain machine or task. Then according to that matrix, production
 workers are planned on building a machine with a certain productivity percentage.
 Someone with a lot of experience will be planned with 100% productivity, at the same
 time a new person will only be planned with a productivity of 50%. There are too few
 people who have a productivity of 100% on diverse machines.

 • Production workers are not technical enough.
 The production workers of Prinzen learned how to build a certain machine, however,
 this skill is not sound i.e. based on solid experience and technical knowledge. They
 learned the tricks on how to build a machine. There is a lack of technicality.

 • The manipulation of bills of materials causes problems.
 At Prinzen the machines are standardized, but they can be changed according to the
 wishes of the customers. The employees of work preparation change the bills of
 materials in such a way that the wishes of the customers are considered. Those
 changes in the bills of materials cause problems in the production, due to missing,
 wrong or too many parts.

 • Suppliers do not deliver on time.
 A lot of suppliers of Prinzen do not deliver on time. The materials arrive too early or too
 late.

 • Suppliers deliver poor quality.
 The materials delivered by the suppliers are damaged or not according to the technical
 standard. Therefore Prinzen needs to order new materials, which causes a delay.

 • Ad hoc day off for production workers.
 Sometimes materials are not delivered in time, production workers then ask if they can
 go home because they do not have work. They go home and then the next day the
 materials arrive. This creates twice the amount of work on the next day.

 • Mistakes in order picking
 Sometimes the warehouse workers make a mistake with order picking. It causes a lot
 of time to return the item back in stock and picking the right item.

 • The client wants to change the product (during production)
 It happens that a client wants to change their product when it is already in production.
 This causes problems in production because this means they must use different bills of

 10
materials. This is also the case when clients want adaptions to the product before
 production. This causes a lot of unplanned extra work.

 • Projects wait with entering sales-order
 Projects only enter the orders in the system once every two days. This causes already
 a delay. The order is already in the company, but only projects knows about it since it
 is not yet in the system. This causes a lot of problems because planning knows too late
 about an order.

 • Not noticing a problem until fine-tuning
 Problems are not noticed until fine-tuning. It often happens that during fine-tuning there
 is found a problem in the product. The production workers do not notice the problem
 during the production process. It cost a lot of time breaking down the machine and then
 building it back up. This problem goes hand-in-hand with the problem of the production
 workers being not technical enough.

 • Not clear what score a machine should get to pass the crack test.
 Prinzen has a so-called Crack-test. It is a way to test how sensitive the machine is to
 an egg. At first, Prinzen said that the machine should score a ten, but then almost no
 machine passed the test. So they change the passing mark, but it is not clear what that
 passing mark exactly is, and how the passing mark reflects the reality.

 • Prinzen is not flexible.
 Prinzen cut their storage by half two years ago and started working with stock orders.
 Therefore everything that is in storage is already matched with a certain product. So if
 there comes a last-minute order, they cannot produce it in time.

 • No insight in current throughput times
 Prinzen does not have a clear KPI or graph in which the current throughput time is
 shown. So they know it is too long, but do not know how much too long. This is also
 because it varies a lot. They cannot see in which department of the company the long
 throughput time originates.

 • The throughput time varies a lot.
 From one week to another week the throughput time can change a lot. For projects,
 this is very difficult. First, a customer gets a delivery time of 5 weeks, then when the
 customer orders next week the delivery time can be 5,5 weeks. For a customer which
 already ordered the chickens, this can be a big problem. If the chickens are back in the
 stable they cannot put a machine in it.

The analysis of initial interviews revealed the issues the processes and issues the company
experiences, which were further converted into a conceptual model showing the influences,
relations, and causes.

 11
Figure 1 Problem cluster with relations of Prinzen

In figure 1 the problem cluster of Prinzen is shown. The cluster map shows that the throughput
time can be affected by a lot of problems. In order to know which problem to solve, one should
get insight into what currently the exact throughput time is per department of the company.

Core problem
Prinzen does not have a clear image of what currently the exact throughput time is. It is
complex to keep track and optimize processes influenced by multiple dynamic variables.

Motivation
It is necessary to know where the problem is occurring, to solve the problem of the inconsistent
throughput time which is difficult to measure. So there needs to be data enabling measuring
what the current throughput time is. This is not the case at Prinzen. Choosing this problem the
rules of thumb (Heerkens & Van Winden, 2017) needed to be used. The first rule is that the
problem cluster shows all problems identified at the company. The second rule deals with
following the problems back to other problems which have no direct cause. The core problem
must be influenceable. The last rule of thumb is to choose the most important problem if more
than one problem remains. Following those rules, a core problem was found to be that Prinzen
does not have a clear image of what currently the exact throughput time is. Starting with
another problem is not a wise way to go because there was no certainty if it could be the cause
of the inconsistent throughput time. The problem is influenceable because one can make sure
that data shows what the current throughput time is per department. Projects will be able to
give an adequate delivery time if the current throughput time is shown. Throughput time was
chosen because it can influence the delivery time, and because it has the biggest impact on

 12
the process, in addition, it is a variable that can include multiple other linked to throughput
metrics which, even though may not be known at this stage, can be derived during the thesis
work.

 1.3. Research design
The following section gives a brief description of the research. The limitations and the
intended deliverables are also described in this section.

 1.3.1. Research questions
The research is done according to the seven phases of Managerial Problem-Solving Method
(Heerkens & Winden, 2021). The goal of the research is to answer the main question. The
main question will be answered by researching the knowledge questions.

Main research question
The core problem should be solved to achieve the norm, which is a clear insight into the
current throughput time. Based on that information recommendations can be done to Prinzen
for achieving their desired throughput time of 4, 8, or 12 weeks. The following main research
question should be answered:

 How can Prinzen get a clear image of what the current throughput time is concerning
 the planned throughput figures?

Sub-questions:
 ➢ What is the desired process flow of Prinzen?
 ➢ What does the current data tell about the throughput time?
 ➢ What method can be designed, based on literature, to implement at Prinzen?
 • What solutions design can work for the company to track the processes
 effectively, measured by the timely discovery of issues and ease of use?
 ➢ To which extend does the design satisfy the requirements measured by its’
 capability to allow for issues detection earlier during the process?

Sub-question 1 From customer order to delivery, every step should be considered. This
question provides information to answer the other sub-questions, but also the main question.
Based on the desired process the current process is evaluated. The departments and activities
that impact the throughput times are known. The desired process flow is made based on
interviews. There also is a movie that shows all the departments in Prinzen, this movie served
as information for the process flow.

Sub-question 2 Data that is already available should be investigated. For a KPI that will present
the throughput time per department, the machine should be tracked all along the process. This
question will be answered with a combination of data analysis methods and if possible, process
mining. Process mining is only possible when the data is event-based.

Sub-question 3 The core problem is solved by means of a certain method. This method is
based on literature and information given by the employees. The method will lead to possible
solutions, or the method can be the solution. It is important that the method is easy to use and
enables early issue detection. This question provides a redesigned method which forms the
basis of the solutions that will achieve the main goal of the research. Extended with excel data
analysis, which will give insights into the current throughput time, the designed method
discovers issues timely and is easy to use.

 13
Sub-question 4 Evaluating the design is important. For the evaluation, the following questions
will be targeted. 1.Does it detect issues early? Evaluation is one of the most important steps
in the research. The evaluation should also answer question two. To what extend the designed
method matches the reality at Prinzen. The answer to this question is used to form a conclusion
of the research. The aim is also to evaluate the solution that is chosen. Interviews with the
stakeholders will provide the information for the evaluation and conclusion. The stakeholders
need to assess the design on the ability to detect issues early.

 1.3.2. Reliability, Validity & Limitations
During the research, there may occur some issues regarding reliability, validity, and limitations.
These issues are discussed below, furthermore it also states how to preserve the highest
reliability and validity.

The data received from Prinzen may have quality issues.
It is known that the production workers shuffle hours from one project to another. Therefore it
is not clear how much time is exactly spent on a certain order. Sometimes an order is finished
faster than the data says because the production workers add hours from another order. This
is an already known problem. In order to achieve the highest reliability and validity, the data
should always be questioned. Also, the production workers should be told that only when the
data is of sufficient quality (e.g. not corrupt), the problem can be fixed.

Theories may not apply directly to the reality at Prinzen.
Most of the time theories are limited to the concepts, relationships and, rationale behind
phenomena and do not provide ready answers to real-world cases with respect to their
applications in practice. The assumptions should always be checked if they apply and are
experienced also for Prinzen. To preserve the validity and reliability of the research, the
findings from the literature should be narrowed down to the context of the company case,
tested, evaluated, and refined with regard to the context of Prinzen.

Interviews are snapshots.
The answer to questions can change from day to day. Answers can also differ on the mood of
the interviewee. The department projects could have had difficulties with the production
department on the day the interview with projects employee is conducted. The projects
employee will then automatically be more negative towards the production department. That
is why interviews should be conducted across the whole organization on different days. The
results of an interview should not be approached as automatically true.

The covid-19 pandemic effects.
The government of the Netherlands made rules to fight covid-19. One of these rules requires
that workers should work as much as possible from home. Therefore employees of Prinzen
work remotely. Interviews therefore also should mostly be conducted online. During an online
interview, it is sometimes more difficult to get tangible insights about a certain topic of interest.
In a live interview, there are fewer limitations, e.g. time-related, formality instead of friendly
talks, i.e. extra opportunities to find what the interviewee can also tell more about the topic.
Another limitation of the covid-19 rules is that I am not able to see the company working at full
capacity and get familiar with the processes on spot.

 1.3.3. Intended deliverables
The following section gives the intended deliverables, these are the results of the thesis
assignment. Each sub-question provides at least one intended deliverable.

 14
• A process flow of the desired process, which shows the fraction of the time a
 department can spend on an order.
 • Insights in the data that is available of the process at Prinzen.
 • Recommendations on data collection.
 • A method in which the effectivity of the process is measured based on throughput time.
 • Evaluation of the design based on the requirements.

2. Desired process
This chapter describes the analysis of the desired process. Also known as the “soll” situation.
The sub-question answered in this chapter is:

 What is the desired process flow of Prinzen?

 2.1. Process flow chart
The first step in answering the sub-question is to understand the flow of orders in the process.
According to Barjis (2008), technical systems fail because the system does not adequately
support the underlying business process, this is due to poor conceptual modeling. Therefore
the first step is to make a general process flow, and after that for every phase a detailed
process flow. The general process flow is only used to determine the phases.

Figure 2 The general process flow of Prinzen

This process flow is based on previously made process flows and conversations with heads of
different departments. The outcome of the conversations improved the accuracy of the old
process flow. Although the process flow is checked on representing the reality, there are some
possible errors. According to Dietz, Barjis, & Goldkuhl, (2002) process flows can be
irreproducible and ambiguous. This means that based on the conversations another person
will come up with a different process flow, or has the same flow but has a different interpretation
of it. To prevent this, the process flow is checked multiple times with different persons in the
organization. The process starts from the moment an order is confirmed. Projects puts the
order in the ERP system. The order then goes to work preparation/planning. They make the
bills of materials and plan the order. The order is then on hold until it reaches its start date in
planning. The order is released which then goes to the warehouse. All the materials are picked.
Then the order moves to production HTG2, HTG2 makes the machines. If the order is a whole
project the order goes further to production HTG3, HTG3 combines the machines into big
projects. Then the order goes to shipping preparation. After that, the order is shipped to the
customer. There are certain phases not included in the process flow, like shipping the product,
or the negotiations with the customer. The pertinent phases are shown in the general process
flow.

From the general process flow six phases are determined. Each phase is described in more
detail based on information gathered during the interviews. The interview can be found in

 15
appendix E. It is important to understand each step taken in the process, because from that
target times for certain tasks or phases are determined.

Projects - this is the department of Prinzen that receives the order from the dealer. Projects is
responsible for order entry, with accessory information, in the ERP system. They form a layout
of the order if that is necessary. The following phase is able to start working when all the
information is in the ERP system. The throughput time of this phase is measured from the
moment they receive an order, till the complete order is in the ERP system. Two
representatives of projects stated that projects should process an order in two days.

Work preparation - the first step they take is to check the information they received from
projects. A plan order is linked to the customer order and becomes a production order. They
manipulate the bills of materials according to the wishes of the customer. They also check
whether the materials are in stock. The last step is to make hard copies of the bills of materials
and a production scheme, these are put together in a map and put aside till the order is
released. The second phase starts from the moment the order is in the ERP system till the
moment that work preparation has gathered all the information production and warehouse
employees need, and work preparation put the order in an office cabinet. A representative of
work preparation stated that he processes an order in one day, based on the most standard
order. The bigger or more complicated the order is, the larger the throughput time will be.

Warehouse / Order picking - in between the previous phase and this phase the affairs and
resource officer must release the order. In other words, there is a possible waiting time
between these two phases. To make sure the waiting time is not taken into account with the
throughput time. This phase throughput time will start from the moment the order is released.
Based on the bills of materials, the employees pick certain materials. The materials will then
be put on one cart, such that all materials for a certain machine are on the same cart. The cart
is then ready for production HTG2, and the throughput time will end from this moment. The
team leader operations, who is also responsible for this phase, stated that the warehouse
should pick an order in two days.

Production HTG2 - the production workers need certain things to assemble a machine, the cart
from the warehouse and the map with all information from work preparation. In the map, there
is a manual that tells step by step how the machine should be assembled. The manual is
straightforward, almost everybody is able to build a machine with it. The carts with the materials
have wheels and for the machine the production worker gets trolleys. For this reason, the
production worker is able to assemble a machine everywhere on the production floor. As a
result of that, there is a lot of space available for assembling machines, so Prinzen can make
more machines at once. A finished machine goes either to the parking place until it goes to
production HTG3 or goes to logistics. Before the machine is finished it is fine-tuned and it
needs to pass the crack test. This phase starts when the cart is ready and ends when the
machine is finished. The team leader operations stated that this phase should be done in about
two to four weeks depending on the size of the order.

Production HTG3 - the fifth phase starts from the moment that the machines are finished at
HTG2. Production HTG3 will then combine more machines in bigger projects. The belts
between different machines to transport the eggs are made. The complete project is fine-tuned,
and also needs to pass the crack test. The phase is finished if the complete project is finished
and ready to be packed and shipped. Production HTG3 will only work on an order if more

 16
machines need to be combined. The team leader operations stated that production HTG3
should finish an order in one to four weeks again depending on the size of the order.

Shipping preparation - this phase starts either when a machine is finished or when a project is
finished. The logistic employee puts the machine on a pallet and makes sure it can not move.
At last, a manual is added and the machine is covered in plastic. Then a truck comes to pick
up the machine. From that moment this phase is finished, and the whole throughput process
is finished. This phase should at most take two days to process an order, according to the
team leader operations.

 2.2. Order classification
The desired process flow processes orders in 4, 8, or 12 weeks. However, in the ERP system
this classification cannot be found. This brings up the question: “How do employees know
which classification an order or machine gets?” In the interview, employees have to classify
the machines and certain orders from the ERP system. The eggficiency plan with the 4, 8, or
12 weeks classification should be widely supported in the whole organization. The answers to
the questions tell whether this is true or not.

The results of the interview questions about the order classification can be found in appendix
F. The tables show the role of the interviewee on the horizontal header and the machines on
the vertical header. In the cells, the throughput time in weeks can be found. To test whether
every employee has the same idea about the order classification the answers were compared
to each other.

From the results, the following summary can be concluded. Only 5 of the 16 machines that
Prinzen sells have been classified with the same number by all interviewees. 6 machines are
classified by everyone but one employee with the same number. Below the results for four
machines are shown, because the employees have a different view on the throughput time for
that certain machine.

 Speedpack 110 PSPC 7

 4 8 12 4 8 12

Figure 3 Speedpack 110 classification Figure 4 PSPC 7 classification

 17
Speedpack 220 Smartpack

 4 8 12 4 8 12

Figure 6 Speedpack 220 classification Figure 5 Smartpack classification

The above figures show that not for every employee the eggfiecency plan with the idea of 4,
8, and 12 weeks is clear. For example the PSPC 7, half of the interviewees say the throughput
time should be four weeks, the other half says eight weeks. A solution should be found to make
sure that every employee knows the exact amount of time in which the machine should leave
the company. Orders consist most of the time out of multiple machines, therefore the same
question was asked for eight example orders. Out of the eight orders, four are classified in the
same category by all interviewees. Two orders are, similarly to the machines, classified in
different categories and therefore shown below.

 Order E Order H

 4 8 12 4 8 12

Figure 7 Order E classification Figure 8 Order H classification

Half of the interviewees think that order H has a throughput time of four weeks, the other half
thinks it is 8 weeks. There can not be any difference in what the target time is for a certain
order. This difference will cause difficulties in analyzing the throughput time. Therefore in the
method a solution for this problem will be taken into account.

 18
2.3. Process conclusion
The general process flow of Prinzen is described in Figure 2 The general process flow of
Prinzen. The process flow can be divided into six phases. The throughput time will be
measured per phase in such a way that the problem owner, the team leader operations, is able
to detect a problem in a certain phase early.

The desired throughput time is 4, 8, or 12 weeks according to the complexity and size of the
order. The research in this chapter showed that not all employees classify the orders and
machines in the same way. This causes difficulties in analyzing the data. For example, Prinzen
receives a certain order, projects classifies the order as 4 weeks while the team leader
operations thinks it is 8 weeks. The order will eventually flow through all the phases in 6 weeks.
Projects will then think they did a bad job while the team leader operations thinks he did a great
job. All employees must be on the same page. Therefore I recommend adding a label to an
order which tells the category the order has, 4, 8, or 12 weeks. This recommendation will be
used in the dummy data during the research, such that it makes it easier to analyze the
throughput time.

3. Data analysis
In this section, an overview of the collected data is given. In this overview, the place where the
data is stored is mentioned. Then the data overview is analyzed, and sub-question two is
answered.

 What does the current data tell about the throughput time?

The throughput time is taken as a metric because it describes a source of competitive
advantage and the fundamental measure of manufacturing performance. (Neely, Gregory, &
Platts, 1995). The metric tells something about the efficiency of Prinzen. According to Neely et
al. (1995) efficiency measures the economic utilization of the firm’s resources. The data
however should be suitable for certain data analysis methods. This is also taken into account
during the data collection.

 3.1. SAP (ERP system)
SAP is the Enterprise Resource Planning system used at Prinzen. SAP ERP is used within the
Vencomatic Group. The system is suitable for large to middle-large companies. SAP is a very
complicated system. Only a handful of people tend to have all the knowledge on how to use
SAP. The search for data started with them, with an event log of the process being the goal.
Despite being an ERP system that is able to track orders, Prinzen does not do this. Therefore
the employees are not able to hand over an event log. The system however will be used to
track the order input date. This is a data type which is kept track of in SAP. Another type of
data that is valuable for the research, is the wished delivery time by the customer. These two
things are taken into account in the data analysis.

 3.2. Monday (project management tool)
Monday is a project management tool. In Monday every employee can be assigned to a certain
task. Each manager is able to see what the employees are working on. Also, every order can
be tracked in Monday. Every department is able to work in Monday. Employees are able to
communicate with each other via Monday. They can start a discussion linked to an order.
Managers are able to see in which department an order is delayed. In other words, Monday is
a good alternative to get data from.

 19
Figure 9 Order dashboard in Monday

In the image above an overview of a part of the order dashboard is shown. For every machine,
in this case, the “Prinzen 50”, a separate list keeps track of the orders. In the first column the
order number is shown with the buyer. The second column shows the country the order goes
to. The fourth column shows the production planning, and the fifth column shows the start of
assembly. Then the loading date is shown in the sixth column. The following five columns are
for work preparation. After that there are some columns for software and manual making. The
dashboard shows dates for work preparation tasks and production. This is useful data to
implement in the data analysis. However similar to the ERP system data cannot be withdrawn
in the form of an event log.

 3.3. Data analysis conclusion
This section answers the research question: What does the current data tell about the
throughput time. In this chapter, the search for data about the throughput time is done in
several systems. However, in all the systems there is not any type of data that tells what the
current throughput time is. Prinzen knows their throughput time is too long from feeling rather
than from data telling them. This makes it difficult to research the throughput time, since for a
dashboard with KPIs about the throughput time the data is also necessary. For the KPIs data
should therefore be created, synthetic or dummy data is going to tell what type of data Prinzen
needs to store in their systems. Besides that, the dummy data is also going to show what can
be done with that data if it is available. However, currently Prinzen does not have the data
available to say anything about the throughput time. The assumption that the throughput time
is too long is only based on feelings from the practice.

4. Literature
 4.1. Throughput time
A quick throughput time is getting more and more important for companies. “Leading
companies seek to introduce products quickly and to respond to customer orders in minimum
time” (Lederer & Li, 1997). Order today, receive tomorrow is the standard for the new
generations. In the case of Prinzen, a company with a make-to-order (MTO) strategy, the
delivery time depends on the throughput time plus the shipping time. The shipping time varies
because of the distance between Prinzen and the client. Consequently, a decrease in delivery

 20
time requires a shorter throughput time. Quick throughput time leads to improvements in cost,
productivity, and profitability (Stalk, 1988; Stalk & Hout, 1990; Schmenner, 1988; Blackburn,
1991; Suri & De Treville, 1986; Suri, 1994). Tatsiopoulos, & Kingsman, (1983) state that the
quality of the planning data affects the production planning. Good quality of engineering data
(e.g. bills of materials), capacity data (e.g. workforce), and lead time data (e.g. manufacturing
lead times) are all required for successful production planning according to Tatsiopoulos, &
Kingsman, (1983). From the problem cluster (figure 1) it can be stated that Prinzen has more
problems that lead to unsuccessful production planning. The bill of materials lacks quality and
the insights in the lead time are not present. Insights in the lead time are necessary to shorten
the throughput time.

 4.2. Process mining
One of the possible ways to come to an insight in the throughput time is to apply process
mining. Searching theories about process mining is done according to a systematic literature
review. Process mining analyses the event logs of a process (Cheng & Kumar, 2015). Process
mining aims to discover, monitor, and improve an existing process (Tadanai & Tanuska, 2015).
Therefore process mining is the ideal method to analyse and improve the throughput time of
Prinzen. The only counter side of process mining is that the event logs need to be very clear.
Noisy event logs produce bad models (Cheng & Kumar, 2015). There are multiple software
options for process mining, for instance, Disco and Prom. Prom is the most commonly used
one (Grigorova, Malysheva & Bobrovskiy, 2017). The first step is to investigate if the data at
the company is sufficient enough for process mining, otherwise, the research should be
continued into other data analysis methods. The team leader operations of Prinzen has already
informed that process mining would certainly be a preference, but he also noticed that the data
is not sufficient yet. The level of detail in the data covering all aspects of the process is not
sufficient enough. Therefore the data needs to be generated or other methods of solving this
problem need to be found. This can be a framework that would help the company to collect
relevant data to enable process mining.

 4.3. KPI’s for process performance
Another way to analyze the process performance of Prinzen is to create several key
performance indicators (KPIs). KPIs can reveal poor or satisfactory performance and
improvement potential (Lindberg, Tan, Yan, & Starfelt, 2015). The KPIs can be put in a
dashboard such that the COO of Prinzen can easily detect how the process performs.
According to Lindberg, Tan, Yan, & Starfelt, (2015) important KPIs for operation are scheduled
operation time in percentage and the actual uptime of the scheduled time in a percentage both
over a certain period. A useful planning KPI is the planned time – actual production time. This
KPI shows if the planning is too tight. KPIs related to time are meaningful for this problem.
“Time has been described as both a source of competitive advantage and the fundamental
measure of manufacturing performance” (Neely, Gregory, & Platts, 1995). Certain KPIs
mentioned by Neely, Gregory, & Platts (1995) that may be of value for this research are value-
added time and distance traveled. The value-added time is measured as a percentage of the
total time. Maskell (1989) suggests seven principles for designing a performance
measurement system.

 • The KPIs should directly contribute to the firm’s strategy
 • The KPIs should not only measure financial values

 21
• There is not a KPI that suits all departments, therefore KPIs should differ per
 department.
 • The KPIs should change as the process is changing.
 • The KPIs should be easy to use
 • The KPIs should provide fast evaluation
 • The KPIs are designed to stimulate improving the process, rather than monitoring the
 process.

Shahin, & Mahbod, (2007) propose that KPIs should be based on the criteria of SMART
(Specific, Measurable, Attainable, Realistic, and Time-sensitive) see Figure 10 Smart model.

Figure 10 Smart model

The key performance indicators should be as specific as possible to make them measurable,
e.g. not too broad or vague. KPIs are measured against the desired situation, this situation
must not be out of context reach. Hence the KPI should be attainable. Furthermore, an
attainable KPI should also be realistic. With a certain KPI comes a goal. The goal must be
time-sensitive, in other words in a certain amount of time the goal must be completed.

 4.4. Operationalization
The conclusion from the literature is that there are several ways to improve throughput time.
Process mining is one of the methods that can be used to give an inside into where the variable
throughput time is caused. Also, process mining should give a clear image of what the
throughput time is. The contra-side to using process mining is that the data should describe
every event in the process in detail, and the data should be available. Prinzen does not yet
have the right data to perform process mining, further research at the company will reveal if
process mining is available after creating or changing the data. If the outcome of the research
is that process mining is not possible, then KPIs should be formed to give a clear image of
what the throughput time is. The KPIs will be drafted according to qualitative research and
quantitative research. The qualitative research will be interviews with the stakeholders, they
will state what is necessary to know for improving the throughput time. The quantitative
research will be a search into the data that is available at Prinzen. Possible KPI’s that can be

 22
You can also read