WHO IS ENROLLING IN KIWISAVER? - PROFILING, USING THE SOFIE-INLAND REVENUE LINKED DATA SET
←
→
Page content transcription
If your browser does not render page correctly, please read the page content below
Who is enrolling in KiwiSaver?

     Profiling, using the SoFIE–Inland Revenue linked
     data set

Prepared for:
KiwiSaver Evaluation Steering Group

Prepared by:
National Research and Evaluation Unit

February 2015
Who is enrolling in KiwiSaver?
Who is enrolling in KiwiSaver?
Disclaimer Acknowledgements
The views, opinions, findings, and conclusions expressed The National Research and Evaluation Unit (R&E), Inland
in this report do not necessarily reflect the views of Revenue, is immensely grateful to Simon Leong, Senior
Inland Revenue. Researcher/Evaluator, Inland Revenue for this work.
R&E is also appreciative of the efforts of other analysts
Inland Revenue has made every effort to ensure that the
from Inland Revenue and the Treasury who have
information contained in this report is reliable, but does
contributed to this work.
not guarantee its accuracy or completeness and does
not accept any liability for any errors. Finally, the members of the KiwiSaver evaluation
steering group from:
The information and opinions contained in this report
the Ministry of Business, Innovation, and
are not intended to be used as a basis for commercial
Employment
decisions and Inland Revenue accepts no liability for any
decisions made in reliance on them. The Treasury
The material contained in this report is subject to Crown the Commission for Financial Capability
copyright protection unless otherwise indicated. The the Financial Markets Authority
Crown copyright protected material may be reproduced
free of charge provided it is reproduced accurately and the Ministry of Social Development
not used in a derogatory manner or in a misleading Victoria University of Wellington
context. Where the material is being published or issued
to others, the source and copyright status should be Statistics New Zealand
acknowledged. The permission to reproduce Crown who through their expertise provided guidance that
copyright protected material does not extend to any helped shape the report into its current version, are also
material in this report that is identified as being the acknowledged.
copyright of a third party. Authorisation to reproduce
such material should be obtained from the copyright To all, a big thank you.
holders.
© Crown copyright 2014
ISBN: 978-0-478-41832-3
National Research and Evaluation Unit
Te Wāhanga ā-motu mo te Rangahau me Aromātai
Prepared by: National Research and Evaluation UnitWho is enrolling in KiwiSaver? Table of Contents Executive summary .....................................................................................................................................................1 Methodology ...................................................................................................................................................................... 1 Section 1. Introduction............................................................................................................................................3 Background and objectives ................................................................................................................................................. 3 Analytical sample ................................................................................................................................................................ 3 Section 2. Profile of KiwiSaver members and non-participants ...............................................................................4 Key findings ......................................................................................................................................................................... 4 Overview of enrolment trends ........................................................................................................................................... 5 KiwiSaver demographics ..................................................................................................................................................... 6 Comparisons of KiwiSaver members and those who have never enrolled ...................................................................... 15 Profile summary................................................................................................................................................................ 19 Section 3. KiwiSaver membership status and enrolment methods ........................................................................ 22 Key findings ....................................................................................................................................................................... 22 Trends in KiwiSaver membership status ........................................................................................................................... 23 Demographic profiles of groups defined by their membership status ............................................................................. 24 Demographic characteristics associated with enrolment method ................................................................................... 27 Section 4. Choice of scheme provider, contribution rates and contributions holidays .......................................... 31 Key findings ....................................................................................................................................................................... 31 Choosing a contribution rate ............................................................................................................................................ 31 Scheme choices ................................................................................................................................................................ 32 Making member contributions ......................................................................................................................................... 35 Contributions holidays ...................................................................................................................................................... 36 Conclusion ................................................................................................................................................................. 38 Who is enrolling? .............................................................................................................................................................. 38 Enrolment types ............................................................................................................................................................... 38 Who is saving more? ......................................................................................................................................................... 39 Appendix 1: Methodology ......................................................................................................................................... 40 Data source ....................................................................................................................................................................... 40 Analysis techniques .......................................................................................................................................................... 42 Limitations ........................................................................................................................................................................ 42 Appendix 2: KiwiSaver features and glossary............................................................................................................. 43 Appendix 3: Demographics associated with KiwiSaver participation ......................................................................... 45 Appendix 4: Demographics associated with enrolment type ..................................................................................... 46 Prepared by: National Research and Evaluation Unit
Who is enrolling in KiwiSaver?
Executive summary
This report summarises the key trends and 124,475 have opted out
demographic profiles from the analysis the KiwiSaver participation rate of 18 to 24 year
findings of the SoFIE (Survey of Family, Income olds has reached 66.0%, which is the highest among
and Employment) and Inland Revenue all age groups.
KiwiSaver administrative linked data set.
Membership profile
It covers three main areas, each describing: There is a slightly higher proportion (53.7%) of female
KiwiSaver members than male. Females are also 30%
• the profile of KiwiSaver members and drawing
more likely to join directly through a scheme provider.
comparisons between KiwiSaver members and those
who have never enrolled
Age distribution of individuals differs notably between
• the profile of KiwiSaver members in relation to members and those who have never joined, as well as
membership status and enrolment type between methods of enrolment. Individuals aged
between 18 and 24 are approximately one-third more
• the profile of KiwiSaver members in relation to the
likely to join KiwiSaver compared to other age groups.
use of KiwiSaver features.
The profile of those who have been automatically
enrolled is more heavily weighted towards this younger
Methodology group, suggesting that automatic enrolment has been
effective in enrolling individuals who are new to the
The analysis conducted in this report makes use of SoFIE workforce. Opting in through a provider is more popular
waves 6 to 8 (October 2007 to September 2010) linked for those over 55. Those opting in through an employer
with Inland Revenue-held KiwiSaver administrative tend to be middle-aged with nearly 48% between the
records. ages of 35 to 55 years.
The linked SoFIE and Inland Revenue KiwiSaver The most common main income sources for KiwiSaver
administrative data provides a comprehensive data set. members are salary and wage earners (71.0%) followed
Information on people’s demographic characteristics by beneficiaries (10.5%) and self-employed individuals
such as ethnicity, employment, education, family and (9.3%). When comparing KiwiSaver membership by main
relationships were linked to KiwiSaver members’ income source individuals earning salary and wages are
contribution value, membership status and method of much more likely to be in KiwiSaver than other types of
enrolment. The linked data set also gives us an income sources. Members earning salary and wages are
opportunity to compare members’ demographic also more likely to be either automatically enrolled (for
characteristics with those who have never joined those 18 to 24 years olds) or opt in through their
KiwiSaver. employer (35 to 55 years olds) over other income
sources while self-employed and beneficiaries tend to
opt in through a provider.
Key results
Although the difference in income bands between
Enrolment patterns members and those who have never enrolled are not
significant, individuals with $30,000 or less employment
From weighted SoFIE data, at the end of wave 8: income are more likely to join KiwiSaver among all other
933,865 individuals aged 18+ or 44.2% have income bands. Those in the $30,000 or less income band
enrolled while 1.2 million individuals or 55.8% have are more likely to be automatically enrolled rather than
never enrolled opting in through an employer or a scheme provider.
of the 933,865 enrolments: Individuals who are university educated, including those
- 38.6% were automatically enrolled who also have a postgraduate degree, are more likely to
- 22.1% opted in through their employer be KiwiSaver members than those who have lower
- 39.3% opted in directly through a provider
1
Prepared by: National Research and Evaluation UnitWho is enrolling in KiwiSaver?
qualifications, in particular, to those with no formal members contributing the minimum employee
qualifications. contribution rate from their salary or wages to their
accounts.
Saving choices
Compared to auto-enrolees and members who opted in
For those who are automatically enrolled or opted in
through a provider, members who opted in through
through their employer, it appears that scheme
their employer have the highest mean contribution
membership is being influenced by the enrolment
value, and are associated with gender, age and income
process. Of those who have been allocated to a scheme
levels. Males, members aged between 45 and 55 years
(default allocated or employer nominated), the majority
old, and those with high income, contribute more.
does not actively switch to another scheme later.
Members with mid-high income and older age groups
Members in the 25 to 34 year old age band with lower
are more likely to switch to another scheme.
to middle incomes are more likely to have taken a
contributions holiday than others.
The default contribution rate influences the level of
members’ contributions, with over half of KiwiSaver
Who are KiwiSaver members?
In the scenario below, “Ben” and his family represent typical KiwiSaver members and a range of
circumstances based on findings from this report.
In July 2007 (wave 6), Sarah was a 22-year old university graduate and had just found a full-time job as
a junior sales consultant in a well-known retail trade corporation. On the first day of her new job she
received a KiwiSaver information pack and was automatically enrolled into KiwiSaver by her employer.
She was randomly allocated one of the six default KiwiSaver schemes and started to contribute the
minimum employee contribution rate. One month later she decided to opt out and asked for a refund
of the KiwiSaver contribution already deducted by her employer. Sarah was living with her partner Ben,
a 28 year old earning $70,000 a year. His employer established a KiwiSaver scheme and he decided to
opt in. On top of contributing the 2% minimum into KiwiSaver he also received contributions from his
employer and member tax credits from the government.
Ben’s parents Chris and Amy were, respectively, a 60 year old self-employed real estate agent and a 50
year old unemployed female. Chris made an active decision to opt in through a KiwiSaver scheme
provider and contributed both on a regular and an ad hoc basis at his preferred contribution amount.
Amy decided not to join KiwiSaver because she was happy with her current retirement savings plan.
Late in 2007 Sarah found a new job with a better salary and was automatically enrolled into KiwiSaver
again. Three years passed (June 2010—wave 8) and Sarah noticed that she had made approximately
$3,000 of member contributions. Ben had accumulated between $5,000 and $6,000 of member
contributions due to his higher income earnings. Chris’s contribution was somewhere between Sarah’s
and Ben’s. Because Sarah wanted to save for a wedding and for a deposit on a first home, she decided
to apply for a contributions holiday. Ben continued to contribute to KiwiSaver. Chris retired at the age
of 65 and withdrew all his KiwiSaver funds.
2
Prepared by: National Research and Evaluation UnitWho is enrolling in KiwiSaver?
Section 1. Introduction
The purpose of this report is to summarise the Revenue-held KiwiSaver administrative records to seek
findings on the analysis of the SoFIE–Inland answers to two questions:
Revenue linked data set. 1. What are the individual and household
characteristics associated with KiwiSaver
We are interested in the: membership?
demographic characteristics of KiwiSaver members 2. What are the characteristics associated with
and how those differ to the demographics of those KiwiSaver membership enrolments and the use of
who do not want to participate KiwiSaver features?
demographic characteristics of KiwiSaver members This report aims to assess characteristic differences that
in relation to membership status, such as opting out may be observed to gain a greater understanding of the
and enrolment types profile of KiwiSaver participants. By taking advantage of
use of KiwiSaver features by members such as this longitudinal data set, this report tries to identify
contributions holiday. uptake trends across SoFIE waves.
Section 2 discusses a set of demographic characteristics
Background and objectives that highlights demographic differences between
KiwiSaver members and those who have never enrolled.
KiwiSaver is a voluntary work-based saving scheme that It also looks at trends of uptake across different waves
aims to make it easier for New Zealanders to save for and results from multivariate analysis that identify key
their retirement. While membership is not compulsory, member characteristics associated with KiwiSaver
anyone aged 18 years and over who starts a new job uptake. Section 3 presents findings on membership type
with a new employer and is not already a member is and enrolment methods. Section 4 focuses on members’
automatically enrolled. It is possible to choose to opt contributions, KiwiSaver features, choices in schemes
out of KiwiSaver between two and eight weeks after and contribution rates. Section 5 briefly reviews the
enrolment. Scheme enrolment is not automatic for analysis conducted and main findings.
workers under 18, over 64, employed for less than four
weeks, or who were employed when KiwiSaver started
in 2007. They may join voluntarily. Those who are self-
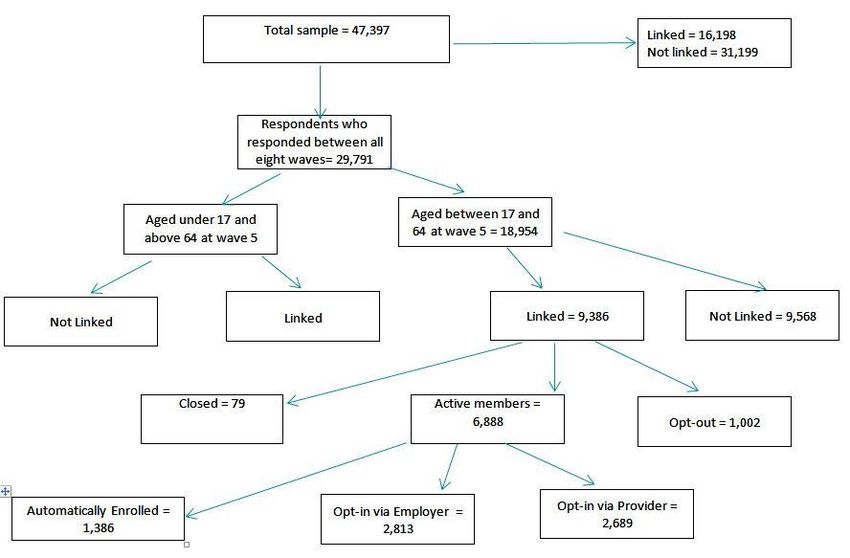
Analytical sample
employed, beneficiaries, and non-workers can join
KiwiSaver by making payments directly to scheme This paper used a sample selected from SoFIE
providers. respondents who had the following characteristics:
They were eligible and responding individuals in
Inland Revenue collects a wealth of KiwiSaver data in its wave 1 of the survey and continued to respond for
role as administrator. Linking Inland Revenue’s all eight waves.
KiwiSaver administrative data with Statistics New
Zealand’s SoFIE provides a number of advantages: They have a complete longitudinal history. This
means they have responded to all eight waves of the
It yields a broader set of demographic and survey. Using respondents with a complete
socioeconomic information. longitudinal history allows the sample to be
It also improves the quality of the survey data. weighted appropriately for each wave.
A counter-factual group can be identified. They were between the ages of 17 and 64 in wave 5.
This ensures that they were eligible to be part of
We are able to study the same group of individuals KiwiSaver when the scheme was first introduced in
over a period of time (across waves). 2007, which coincides with the end of wave 6 of
SoFIE.
This report makes use of data from SoFIE waves 6 to 8
(October 2007 to September 2010) linked with Inland
3
Prepared by: National Research and Evaluation UnitWho is enrolling in KiwiSaver?
Section 2. Profile of KiwiSaver members and non-
participants
This section provides a demographic KiwiSaver members are more likely to be young
description of KiwiSaver members and those individuals who are in the early stage of their career.
who have never joined. A profile of A likely KiwiSaver member profile would be:
demographics that associates with KiwiSaver
• between 18 and 24 years old
membership is explored.
• university educated
One purpose of KiwiSaver is to encourage a long-term
• partnered
savings habit and asset accumulation for individuals who
are not in a position to enjoy standards of living in • working in lower white collar occupations (ie,
retirement similar to those in pre-retirement. Three lower-skilled white collar).
years after its introduction, over one million individuals
1 • working in retail and health care industries
had signed up from the eligible population (KiwiSaver
Annual Evaluation Report, Inland Revenue). • earning below $50,000 in employment income.
By analysing a sample of the linked data set, this section: Non-KiwiSaver participants who have never enrolled
are more likely to be middle aged or non-salary and
1. gives an overview of KiwiSaver enrolment trends
wage earners with moderate personal income.
2. explores demographic profiles of KiwiSaver
members A likely non-KiwiSaver profile would be:
3. compares KiwiSaver members and those who have • aged between 35 and 55 (middle-aged)
never enrolled in the eligible population.
• without formal qualifications
• working in upper blue collar (ie, higher-skilled blue
Key findings collar) occupations or no employment income
• ethnic minority groups with moderate earnings
At the end of wave 8, KiwiSaver participation levels
($50,000 or above).
reached 44.2% of the sample population.
What the results show:
• 18 to 24 year old individuals are enrolling in
KiwiSaver at an increased rate, with approximately
66% having joined.
• Ethnic minority groups continue to enrol.
• More low-income earners are enrolling.
• Steady numbers of mid-income earners are
enrolling.
• Fewer high income earners are enrolling.
1
Refer to Appendix 2: KiwiSaver features and glossary
4
Prepared by: National Research and Evaluation UnitWho is enrolling in KiwiSaver?
It is evident that most KiwiSaver members chose to join
Overview of enrolment fairly quickly after the scheme came into existence. Of
the 933,865 individuals who between waves 6 and 8
trends have joined KiwiSaver, 538,209 individuals (57.6%)
joined by wave 6, a further 215,911 new individuals
Table 1 shows KiwiSaver uptake trends across waves. (23.1%) become members in wave 7 and 179,745
(19.2%) joined in wave 8. However, the trend in
Taking into account the 124,475 who have opted out, KiwiSaver participation for eligible respondents aged
there are 1.2 million individuals (55.8%) who have between 18 and 65 at wave 6 shows a declining rate of
neither joined KiwiSaver nor opted out of it. This growth from 40.1% in wave 7 to 23.8% in wave 8.
suggests that at the end of wave 8, uptake reached
44.2% of those aged between 18 and 65 years. A point
will be reached at which the number of prospective new
KiwiSaver members becomes limited.
Table 1: KiwiSaver membership reach into sample population (weighted)
KiwiSaver membership Wave 6 Wave 7 Wave 8
Non-participants (never been a member) Count 1,745,885 1,426,954 1,177,650
% 76.4% 65.4% 55.8%
KiwiSaver member (current) Count 538,209 754,120 933,865
% 23.6% 34.6% 44.2%
% change from previous wave 40.1% 23.8%
Member and non-participants 2,284,094 2,181,074 2,111,515
Members who had opted out Count 61,479 101,665 124,475
% 2.6% 4.5% 5.6%
Total 2,345,573 2,282,739 2,235,990
Although membership continues to grow, 55.8% of the membership growth reached 66.0% of the 18 to 24 age
analytical sample has never enrolled in KiwiSaver. The group, growing from 27.8% in wave 6. Figures for those
age distribution of KiwiSaver members exhibits three in the 18 to 24 year age band reflect the automatic
patterns. Table 2 shows KiwiSaver membership uptake enrolment of those entering the job market, while those
rate differ by age group across waves. For those in the other age bands show a steady growth across
entering the workforce for the first time (ie, 18 to 24 waves.
year olds), they demonstrate the fastest growth rate
among other age groups. By wave 8, KiwiSaver
Table 2: KiwiSaver reach in to sample population by age across waves (cumulative)
Age band at KiwiSaver membership Analytical sample Uptake
joining wave
Wave 6 Wave 7 Wave 8 Wave 6 Wave 7 Wave 8 Wave 6 Wave 7 Wave 8
18–24 years 94,919 139,132 169,481 341,462 290,571 256,623 27.8% 47.9% 66.0%
25–34 years 87,453 129,103 166,626 416,432 393,075 377,544 21.0% 32.8% 44.1%
35–44 years 98,861 144,747 182,460 529,450 501,861 481,294 18.7% 28.8% 37.9%
45–55 years 118,862 164,411 207,795 539,102 536,366 535,538 22.0% 30.7% 38.8%
55–65 years 138,113 176,723 207,497 457,647 459,199 460,513 30.2% 38.5% 45.1%
Total 538,208 754,119 933,864 2,284,094 2,181,073 2,111,514 23.6% 34.6% 44.2%
5
Prepared by: National Research and Evaluation UnitWho is enrolling in KiwiSaver?
enrolled. This is consistent with the median age in the
KiwiSaver demographics eligible sample.
This section examines the demographic characteristics Table 4 shows that the KiwiSaver participation rate of
of the analytical sample, KiwiSaver members and, those individuals aged between 45 and 65 years has remained
who have never enrolled into KiwiSaver. It also suggests high, but has gradually fallen from a 47.8% in wave 6
how KiwiSaver enrolment is related to, and varies with, down to 41.2% at the end of wave 8. In particular, the
each characteristic. This section takes into account proportion of KiwiSaver members aged between 55 and
demographics that affect earnings and earnings over 65 has decreased from 25.7% in wave 6 to 17.1% in
time, such as age, education and occupation. wave 8. Conversely, individuals in the 25 to 34 year age
group have risen from 16.3% to 20.9% between wave 6
Age and sex profile and wave 8. Despite this, the overall participation rate of
individuals aged between 45 and 65 years is higher, due
A higher proportion of females and 18 to 24 year old to the greater proportion (around 50%) of individuals in
individuals are joining KiwiSaver this age group in the eligible population.
Table 3 shows the KiwiSaver member group contains
slightly more females than males with just over half Figure 1 shows that females aged over 30 are more
(53.7%) being female. likely to join KiwiSaver than males of the same age
bands.
Furthermore, in the 18 to 24 year old age band,
individuals are more likely to be KiwiSaver members
(14.9%) compared to those who have never been a
member (7.1%). The median age of KiwiSaver members
is 44, compared to 45 for those who have never
Table 3: Age and sex profile of KiwiSaver members (weighted percentage)
Demographic characteristics KiwiSaver member % Never been a member % All persons %
Age band at joining wave nweighted = 908,962 nweighted = 1,224,802 nweighted = 2,133,764
nunweighted= 6,889 nunweighted = 10,982 nunweighted = 17,871
18–24 years 14.9 7.1 10.5
25–34 years 17.2 17.2 17.2
35–44 years 19.3 24.4 22.3
45–55 years 22.3 26.8 24.9
55+ years 26.2 24.5 25.2
100.0 100.0 100.0
Average age 42.8 44.4 45.2
Median age 44.0 45.0 45.0
Gender
Male 46.3 50.6 48.8
Female 53.7 49.4 51.3
100.0 100.0 100.0
6
Prepared by: National Research and Evaluation UnitWho is enrolling in KiwiSaver?
Table 4: Age distribution of KiwiSaver members and those who have never enrolled across waves (weighted
percentage)
Age band at Wave 6 Wave 7 Wave 8 Total
joining wave
Member Never Member Never Member Never Member Never
% been a % been a % been a % been a
member member member member
% % % %
18–24 years 17.6 14.1 20.5 10.6 16.9 7.4 18.1 11.2
25–34 years 16.3 18.8 19.3 18.5 20.9 17.9 17.8 18.5
35–44 years 18.4 24.7 21.3 25.0 21.0 25.4 19.5 25.0
45–54 years 22.1 24.1 21.1 26.1 24.1 27.8 22.3 25.7
55–65 years 25.7 18.3 17.9 19.8 17.1 21.5 22.2 19.7
100.0 100.0 100.0 100.0 100.0 100.0 100.0 100.0
Figure 1: Age distribution of KiwiSaver members by gender as proportions of sample population
9% 8.5%
8.2%
8%
7% 6.6% 6.6%
6.3%
6.0% 6.0%
5.8% 5.8%
6%
5.2%
5.0% 5.0%
Percentage
5% 4.5%4.4% 4.4% 4.2% 4.1%
4% 3.6%
3%
2%
1%
0%
18-25 26-30 31-35 36-40 41-45 46-50 51-55 56-60 61-65
Age bands
Male Female
Ethnicity profile Results in Figure 2 show individuals from a non-New
Zealand European ethnic group earn less than New
Ethnic minority groups with high earnings are less likely
Zealand Europeans with 53.7% of New Zealand
to be KiwiSaver members than New Zealand Europeans
European KiwiSaver members earning $50,000 or less
in the same earnings group
(excluding zero income) and 58.8% of non-New Zealand
Table 5 shows 29.3% of KiwiSaver members are from a European KiwiSaver members earning less than $50,000.
non-New Zealand European ethnic group (Māori, Pacific New Zealand European and non-New Zealand European
Island, Asian and other ethnicity) which is consistent groups in the upper earning bands show similar results
with the ethnicity distribution in the sample population. between members and non-members.
7
Prepared by: National Research and Evaluation UnitWho is enrolling in KiwiSaver?
Non-New Zealand Europeans with zero income are more The New Zealand European ethnic group has the highest
likely to be KiwiSaver members compared to New KiwiSaver participation rate, although declining from
Zealand Europeans who are in the same income bands 73.8% in wave 6 to 63.8% in wave 8. Apart from the
(25.7% compared to 18.3%). As income increases, the other ethnicity group, the second lowest participation is
difference between members and non-members from the Pacific Island ethnic group, although this has
narrows. KiwiSaver members, who are New Zealand slightly increased from 5.4% in wave 6 to 7.8% in wave
Europeans earning $50,000 or more, overshadow those 8. The other two ethnic groups, Māori and Asian, also
who are non-New Zealand European in the same show increasing participation rates across waves.
earnings bands.
Table 6 shows trends in participation for different ethnic
groups.
Table 5: Ethnicity profile (weighted percentage)
Demographic characteristics KiwiSaver member % Never been a member % All persons %
at wave 8
Ethnicity (prioritised) nweighted = 908,962 nweighted = 1,224,802 nweighted = 2,133,764
nunweighted= 6,889 nunweighted = 10,982 nunweighted = 17,871
New Zealand European 70.7 71.2 71.0
Māori 13.5 13.8 13.7
Pacific Island 6.1 5.3 5.6
Asian 7.5 8.1 7.8
Other ethnicity 2.2 1.6 1.9
100.0 100.0 100.0
Figure 2: Individuals’ earning by ethnicity
40
35
30
25
Percentage
20
15
10
5
0
Zero Income $30,000 or less $30,001-$50,000 $50,001-$80,000 $80,001-$120,000 $120,000+
Annual employment income at wave 8
European (Never been a member) Non-European (Never been a member)
European (KS members) Non-European (KS members)
8
Prepared by: National Research and Evaluation UnitWho is enrolling in KiwiSaver?
Table 6: Ethnicity diversity across waves (weighted percentage)
Ethnicity at joining Wave 6 Wave 7 Wave 8 Total
wave
Member Never Member Never Member Never Member Never
% been a % been a % been a % been a
member member member member
% % % %
New Zealand European 73.8 70.3 67.7 70.3 63.8 70.9 70.4 70.5
Māori 11.8 14.4 15.8 14.4 17.8 14.0 13.9 14.3
Pacific Island 5.4 5.6 7.0 5.6 7.8 5.3 6.2 5.5
Asian 7.0 7.9 7.6 7.9 8.0 8.2 7.3 8.0
Other ethnicity 2.1 1.8 1.9 1.8 2.6 1.6 2.1 1.8
100.0 100.0 100.0 100.0 100.0 100.0 100.0 100.0
Highest qualifications We can see that 58.4% of the eligible sample is made up
of individuals with post-School Certificate qualifications
University-educated young individuals are likely to be
(trade/diploma, bachelor’s degree and postgraduate).
KiwiSaver members
Those individuals with School Certificate/NCEA and no
Table 7 shows that KiwiSaver participation is associated formal qualifications make up 41.6% of the eligible
with the level of qualifications, with those individuals sample.
holding bachelor and postgraduate degrees more likely
to join KiwiSaver than those with no qualifications.
The proportions of those with School Certificate or
trade/diploma do not differ significantly in relation to
being a KiwiSaver member or not.
Table 7: Highest qualification of KiwiSaver members (weighted percentage)
Demographic KiwiSaver member Never been a member All persons
characteristics at wave 8 % % %
Highest qualification nweighted = 908,962 nweighted = 1,224,802 nweighted = 17,655
nunweighted= 6,831 nunweighted = 10,824 nunweighted = 17,871
No qualification 13.5 16.9 15.5
School Certificate/NCEA 26.8 25.6 26.1
Trade/diploma 35.7 37.5 36.7
Bachelor’s degree 15.4 12.6 13.8
Postgraduate 8.5 7.4 7.9
100.0 100.0 100.0
Table 8 shows individuals in all age bands and with a
bachelor’s or postgraduate degree are more likely to be
KiwiSaver members than non-members. We can also see
that level of education changes as individuals’ age
increases for KiwiSaver members. Members aged
between 18 to 24 years old are more likely to have
School Certificate/NCEA qualifications while members in
other age bands more likely to have a trade/diploma.
9
Prepared by: National Research and Evaluation UnitWho is enrolling in KiwiSaver?
Table 8: Highest qualifications of KiwiSaver members by age bands (weighted percentage)
Age bands
18–24 25–34 35–44 45–54 55–65
Highest qualification Member Never Member Never Member Never Member Never Member Never
% been a % been a % been a % been a % been a
member member member member member
% % % % %
No qualification 9.5 11.1 8.1 10.7 9.2 13.1 14.7 17.5 21.1 24.0
School Certificate/NCEA 46.7 48.5 21.9 24.0 23.2 25.0 24.5 24.2 23.3 22.8
Trade/diploma 25.7 27.8 37.1 40.4 37.6 38.2 37.2 37.9 37.8 37.5
Bachelor’s degree 14.6 10.6 24.6 18.4 19.1 14.9 12.5 12.1 9.9 7.8
Postgraduate 3.5 2.0 8.3 6.6 10.8 8.8 11.0 8.3 8.0 8.0
100.0 100.0 100.0 100.0 100.0 100.0 100.0 100.0 100.0 100.0
Occupations profile
Lower white collar workers are more likely to enrol in
KiwiSaver
Table 9 shows lower white collar workers are more likely
to be KiwiSaver members than upper blue collar
workers. This may be due to those individuals in the
early stage of their career being automatically enrolled.
Correspondingly, upper blue collar workers are less
likely to enrol in KiwiSaver.
Table 9: Occupation profile of KiwiSaver members (weighted percentage)
Demographic KiwiSaver member % Never been a member % All persons %
characteristics at wave 8
Occupation nweighted = 749,549 nweighted = 943,337 nweighted = 1,692,886
nunweighted = 4,000 nunweighted = 4,996 nunweighted = 8,996
Upper white collar 48.5 48.6 48.6
Lower white collar 27.2 21.3 23.9
Upper blue collar 11.0 17.4 14.6
Lower blue collar 13.0 12.3 12.6
Unidentifiable 0.4 0.3 0.3
100.0 100.0 100.0
10
Prepared by: National Research and Evaluation UnitWho is enrolling in KiwiSaver?
Main income sources and earnings
Young individuals are more likely to enrol in KiwiSaver
compared to older with the same level of earnings
Differences in age in relation to level of earnings are
evident. Those individuals aged between 18 and 24 with
$30,000 or less (62.7%) and over $30,000 to $50,000
(61.6%) are slightly more likely to join KiwiSaver than
other age groups.
Table 10: Income by age bands (weighted percentage)
18–24 25–34 35–44 45–54 55–65 All
Personal M% No % M% No % M% No % M% No% M% No% M% No%
income
Zero 43.4 56.6 15.8 84.2 13.3 86.7 31.7 68.3 22.6 77.4 24.6 75.4
income
$30,000 or 62.7 37.3 47.4 52.6 39.3 60.7 35.9 64.1 39.5 60.5 44.1 55.9
less
Over 61.6 38.4 43.1 57.0 38.3 61.7 40.8 59.2 51.9 48.2 45.6 54.4
$30,000 to
$50,000
Over 52.2 47.8 38.7 61.3 37.8 62.2 40.0 60.0 48.4 51.7 41.3 58.7
$50,000 to
$80,000
Over 40.0 60.0 41.7 58.3 35.7 64.3 39.8 60.3 46.5 53.5 40.6 59.4
$80,000 to
$120,000
Over 0.0 0.2 7.4 6.4 19.4 27.3 36.9 38.4 36.3 27.6 37.4 62.6
$120,000
M = member
No = never been a member
Figure 3 provides average gross annual income of wage earnings are more likely to join KiwiSaver while
KiwiSaver members and non-members by age bands. self-employed and beneficiaries are less likely to join.
Although individuals aged between 18 and 24 are more
likely to join KiwiSaver than other age groups, the The proportion of salary and wage earners joining
average gross income for members is similar to those KiwiSaver decreased over time, while beneficiaries show
who have never joined. KiwiSaver members aged the opposite trend, as shown in Table 12. For KiwiSaver
between 45 and 54 tend to earn more than those who members/non-members whose main source of income
are in the same age group but have never joined. is not salary and wages or government benefits, the
Income between members and non-members in other proportions are relatively stable across waves.
age groups is also similar.
Table 11 shows the most common main income sources
for KiwiSaver members are salary and wages (71.0%),
followed by benefits (10.5%) and self-employed income
(9.3%). Comparing the same income sources for those
who have never enrolled, individuals with salary and
11
Prepared by: National Research and Evaluation UnitWho is enrolling in KiwiSaver?
Figure 3: Annual income by age bands
Annual personal income ($) 70,000
60,000
50,000
40,000
30,000
20,000
10,000
0
18-24 25-34 35-44 45-54 55-65
Age bands
Never been a member KiwiSaver Members
Table 11: Employment status (weighted percentage)
Main income source at KiwiSaver member % Never been a All persons %
wave 8 member %
nweighted = 908,962 nweighted = 1,224,802 nweighted = 2,133,764
nunweighted= 6,889 nunweighted = 10,982 nunweighted = 17,871
Salary and wages 71.0 57.9 63.7
Self-employed 9.3 14.8 12.2
NZ Super 1.1 2.1 1.7
Government benefits 10.5 14.4 12.8
Interest and investment 3.3 4.3 3.9
Other sources 3.3 3.3 3.3
No income source 1.5 3.3 2.5
100.0 100.0 100.0
12
Prepared by: National Research and Evaluation UnitWho is enrolling in KiwiSaver?
Table 12: Income sources of KiwiSaver and non-members across waves
Main income source at Wave 6 Wave 7 Wave 8 Total
joining wave
Member non- Member non- Member non- Member non-
(n = member (n = member (n = member (n = member
3,888) (n = 1,629) (n = 1,372) (n = 6,889) (n =
14,511) 12,341) 10,562) 37,414)
Salary and wages 73.3 63.2 70.5 60.8 63.8 59.2 70.8 61.3
Self-employed 9.0 12.3 9.2 13.5 9.3 14.9 9.1 13.4
NZ Super 0.5 0.9 0.6 0.8 0.6 0.8 0.6 0.8
Government benefits 7.8 13.6 12.1 14.4 17.8 14.5 10.7 14.1
Interest and investment 3.7 3.9 3.5 3.9 1.9 4.1 3.3 3.9
Other sources 3.6 3.2 3.3 3.3 4.0 3.2 3.6 3.1
No income source 2.2 3.0 0.8 3.6 2.7 3.4 1.9 3.3
100.0 100.0 100.0 100.0 100.0 100.0 100.0 100.0
Industry sectors
Employees in retail trade and accommodation sectors
are more likely to enrol than those in other industry
sectors
KiwiSaver members are spread across all industry
sectors, but as Table 13 shows, over 50% work in just
four major sectors: retail trade and accommodation
(15.6%), rental, hiring and real estate services (14.9%),
health care and social assistance (11.7%) and
manufacturing (10.1%).
Of those four major sectors only manufacturing shows a
slightly smaller proportion of members than non-
members.
In addition, individuals who work in primary industry
sectors with high employment turnover such as
agriculture, forestry and fishing and construction, and
those industry sectors such as education and training
and government administration, are less likely to enrol
in KiwiSaver.
13
Prepared by: National Research and Evaluation UnitWho is enrolling in KiwiSaver?
Table 13: Industry sectors (weighted percentage)
Occupation at joining wave 8 KiwiSaver member % Never been a member All persons %
%
nweighted = 908,962 nweighted = 1,224,802 nweighted = 2,133,764
nunweighted = 10,831 nunweighted = 6,834 nunweighted = 17,665
Agriculture, forestry and fishing 5.6 8.9 8.5
Mining 0.3 0.3 0.2
Manufacturing 10.1 11.9 12.0
Electricity, gas, water and waste services 0.5 0.5 0.6
Construction 6.8 8.5 8.3
Wholesale trade 5.9 5.6 5.8
Retail trade and accommodation 15.6 11.6 12.6
Transport, postal and warehousing 4.8 3.5 3.8
Communication services 1.5 1.6 1.6
Financial and insurance services 2.9 2.5 2.7
Rental, hiring and real estate services 14.9 14.0 13.4
Government administration 4.7 5.5 5.4
Education and training 7.6 10.2 9.4
Health care and social assistance 11.7 7.9 8.4
Arts, recreation and other services 7.1 7.6 7.4
Not elsewhere included 0.0 0.0 0.0
100.0 100.0 100.0
Household type one adult as a KiwiSaver member and approximately
15% have two adults as KiwiSaver members.
Higher proportion of KiwiSaver members live in a
partnered household
There are no noticeable differences in KiwiSaver uptake
The following analysis looks at household memberships between households with children and those without.
of KiwiSaver. Note, only households with at least one
adult aged 18 to 65 years are included. Households earning high-income levels (over $80,000)
are more likely to have one or more KiwiSaver members
Analysis of various household types suggests that in the household.
households with more than one adult are more likely to
have one or more KiwiSaver members in the household.
Table 14 shows 19.7% of households in the analytical
sample consist of a single adult. Of those single
households, 36.9% (with no resident children) and
39.0% (with resident children) of adults are KiwiSaver
members.
Households that consist of two adults (respondent plus
partner), regardless of whether or not they have
dependent children, show approximately 49% of neither
adult as members of KiwiSaver, approximately 35% have
14
Prepared by: National Research and Evaluation UnitWho is enrolling in KiwiSaver?
Table 14: Household (weighted percentage)
No KiwiSaver One Two Two or more All
members in KiwiSaver KiwiSaver KiwiSaver households
household % member in members in members in %
household household % household %
%
Household type
Single, no resident children 63.1 36.9 -- -- 11.2
Single, with resident children 57.3 39.0 -- 3.8 8..5
Partnered, no resident children 49.2 35.3 15.5 -- 24.1
Partnered, with resident children 49.3 32.3 15.5 2.9 44.1
Partnered, with others 55.3 32.5 12.2 -- 0.7
Combined household income
Loss 77.5 14.5 6.1 1.9
Zero income 76.9 18.7 4.4 0.0
$30,000 or less 55.2 42.4 2.2 0.2
Over $30,000 to $50,000 53.0 41.7 5.0 0.3
Over $50,000 to $80,000 54.6 34.7 10.0 0.8
Over $80,000 to $120,000 46.4 31.9 19.2 2.5
Over $120,000 42.9 30.8 22.4 4.0
Comparing KiwiSaver members to those who have never
Comparisons of KiwiSaver enrolled we see the following:
members and those who KiwiSaver members are more likely to be younger
with 60.9% of the 18 to 24 age group being
have never enrolled members. Those aged between 35 and 55 years are
less likely to join KiwiSaver.
In the previous section we explored demographic Females are slightly more likely to enrol than male
characteristic profiles of KiwiSaver members and those (44.6% compared to 40.5% for males).
who have never enrolled. Findings show there are
distributional differences of demographics in each Of those who do not have a formal qualification, the
profile. proportion of KiwiSaver members is 25.4 percentage
points lower than those who have never enrolled,
In this section we test the magnitude of these while individuals who are university educated are
demographic differences between KiwiSaver members more likely to be members.
and those who have never enrolled, look at whether
Individuals living in a single household with no
they are a function of other demographic differences
children are less likely to be KiwiSaver members.
between the groups and consider the significance of
these factors as predictors of KiwiSaver membership Individuals working in upper blue collar occupations
uptake. are less likely to be KiwiSaver members.
There are considerable differences between the
Table 15 shows, at the end of wave 8, the demographic
main income source characteristics. Individuals who
characteristic differences between KiwiSaver members
are salary and wage earners are more likely to join
and those who have never been a member.
KiwiSaver (than those earning other income sources)
while those without income or receiving NZ Super
are less likely to be KiwiSaver members.
15
Prepared by: National Research and Evaluation UnitWho is enrolling in KiwiSaver?
Table 15: Differences between KiwiSaver members and those who have never been a member
Demographic characteristics at wave 8 KiwiSaver Never been a % Difference Proportion of
member % member % eligible sample %
Age band nweighted = nweighted = nweighted = 2,133,764
908,962 1,224,802 nunweighted = 17,871
nunweighted= nunweighted =
6,889 10,982
18–24 years 60.9 39.1 21.8 10.5
25–34 years 42.6 57.4 -14.8 17.2
35–44 years 37.0 63.0 -25.9 22.3
45–55 years 38.2 61.8 -23.5 24.9
55–65 years 44.3 55.7 -11.4 25.2
100.0
Gender nweighted = nweighted = nweighted = 2,133,764
908,962 1,224,802 nunweighted = 17,871
nunweighted= nunweighted =
6,889 10,982
Male 40.5 59.5 -19.0 48.8
Female 44.6 55.4 -10.7 51.3
100.0
Ethnicity nweighted = nweighted = nweighted = 2,133,764
908,962 1,224,802 nunweighted = 17,871
nunweighted= nunweighted =
6,889 10,982
New Zealand European 42.4 57.6 -15.1 71.0
Māori 41.9 58.1 -16.1 13.7
Pacific Island 46.5 53.5 -7.0 5.6
Asian 40.8 59.2 -18.3 7.8
Other ethnicity 50.4 49.6 0.8 1.9
100.0
Highest qualification nweighted = nweighted = nweighted = 2,133,764
908,962 1,224,802 nunweighted = 17,871
nunweighted= nunweighted =
6,889 10,982
No qualification 37.3 62.7 -25.4 15.5
School Certificate/NCEA 43.7 56.3 -12.6 26.1
Trade/diploma 41.4 58.6 -17.1 36.7
Bachelor’s degree 47.8 52.2 -4.4 13.8
Postgraduate 46.0 54.0 -8.1 7.9
100.0
Household type nweighted = nweighted = nweighted = 2,133,764
908,962 1,224,802 nunweighted = 11,591
nunweighted= nunweighted =
6,889 6,682
Single, no resident children 38.4 61.6 -23.1 11.2
Single, with resident children 41.5 58.5 -17.1 8.5
Partnered, no resident children 45.0 55.0 -10.1 24.1
Partnered, with resident children 40.5 59.6 -19.1 44.1
Partnered, with others 38.5 61.5 -23.0 0.7
Other household situation 13.6 9.6 4.0 11.3
100.0
Occupation nweighted = nweighted = nweighted = 1,692,886
749,549 943,337 nunweighted = 8,996
nunweighted = nunweighted =
4,000 4,996
Upper white collar 44.2 55.8 -11.6 48.6
Lower white collar 50.4 49.6 0.9 23.9
Upper blue collar 33.4 66.6 -33.2 14.6
16
Prepared by: National Research and Evaluation UnitWho is enrolling in KiwiSaver?
Demographic characteristics at wave 8 KiwiSaver Never been a % Difference Proportion of
member % member % eligible sample %
Lower blue collar 45.5 54.5 -9.0 12.6
Unidentifiable 34.1 65.9 -31.8 0.3
100.0
Main income source nweighted = nweighted = nweighted = 2,133,764
908,962 1,224,802 nunweighted = 17,871
nunweighted= nunweighted =
6,889 10,982
Salary and wages 47.7 52.3 -4.7 63.7
Self-employed 31.8 68.2 -36.5 12.2
NZ Super 29.4 70.6 -41.1 1.7
Government benefits 35.2 64.9 -29.7 12.8
Interest and investment 36.2 63.8 -27.6 3.9
Other sources 42.3 57.7 -15.4 3.3
No income source 25.5 74.5 -49.0 2.5
100.0
Employment Income nweighted = nweighted = nweighted = 2,133,764
908,962 1,224,802 nunweighted = 17,665
nunweighted = nunweighted =
10,831 6,834
Zero Income 24.6 75.4 -50.8 3.5
$30,000 or less 44.1 55.9 -11.8 35.0
Over $30,000 to $50,000 45.6 54.4 -8.8 27.1
Over $50,000 to $80,000 41.3 58.7 -17.4 21.7
Over $80,000 to $120,000 40.6 59.4 -18.8 7.6
Over $120,000 37.4 62.6 -25.2 5.1
100.0
Those with no income were less likely to join KiwiSaver.
Demographic characteristics associated with KiwiSaver
Compared to the lower white collar workers those
participation
classed as upper blue collar are 25.0% less likely to join
We next examine KiwiSaver participation between wave KiwiSaver. Those in the middle to high income band
6 and wave 8 in a multivariate analysis framework. This ($50,000 to $120,000+) show that the main source of
allows us to examine the relationships between various income is not significantly associated with KiwiSaver
demographic characteristics and KiwiSaver participation, participation.
holding all other characteristics constant. The following
findings are from a logistic regression model which Bachelor’s degree graduates are 17.4% more likely to be
examined the characteristics that relate to KiwiSaver KiwiSaver members compared to those who have a
participation. diploma/trade certificate and 25.3% more likely than
those without a formal qualification.
Individuals aged between 18 and 24 are 36–43% more
likely to be KiwiSaver members than individuals aged Results do not show significant differences by gender.
between 25 and 54. The participation rate for individuals
aged 55 to 65 is similar to that of those aged between In summary, these initial results were generally
18 and 24. consistent with the descriptive findings in previous
sections. The findings demonstrate the relevance of the
Other than the 18 to 24 year age group, individuals who characteristics studied as drivers of KiwiSaver
reported themselves as a Māori or Pacific Islander are participation. The next section will group individuals’
less likely to join KiwiSaver. characteristics of KiwiSavers and non-participants into
clusters.
Other than age characteristic, the income characteristic
suggests individuals on lower employment incomes
($30,000 or less) are 24.0% more likely to join KiwiSaver
than those earning between $30,000 and $50,000.
17
Prepared by: National Research and Evaluation UnitWho is enrolling in KiwiSaver? Table 16: Results of logistic regression model showing significance level Characteristics at joining wave Odds ratio Respondent is a female 1.098** Age (ref = 18–24 years) 25–34 years 0.633*** 35–44 years 0.568*** 45–54 years 0.644*** 55–65 years 1.069*** Ethnicity (ref = respondent is ) New Zealand European NS Māori 1.397** Pacific Islanders 1.327* Asian NS Other NS Highest qualification (ref = Bachelor’s degree) No qualification 0.747*** School Certificate/NZCA 0.827* Diploma/trade certificate 0.826* Postgraduate 0.999*** Household composition (ref = single live alone) Single with children NS Couple only 1.149* Couple with children NS Major income sources (ref = earnings) No income source NS Self-employed NS NZ Super NS Other government benefits NS Investment NS Other NS Occupation (ref = lower white collar) Lower blue collar NS Upper blue collar 0.75** Upper white collar NS Employment income band (ref = $30,001–$50,000) Zero income 0.632*** $30,000 or less 1.240*** $50,001–$80,000 NS $80,001–$120,000 NS $120,001+ NS Note: *p
Who is enrolling in KiwiSaver?
Mapping the characteristics The main groups based on income sources for KiwiSaver
are salary and wage earners (71.0%), followed by
In an effort to further understand the relationships
beneficiaries (10.5%) and self-employed individuals
between KiwiSaver participation (ie, members and those
(9.3%). Comparing the main income sources of those
who have never enrolled) and individuals’ demographic
who have enrolled, individuals with salary and wage
characteristics, a multiple correspondence analysis was
earnings are more likely to join KiwiSaver than self-
carried out on those two groups. Correspondence
employed and beneficiaries. KiwiSaver offers additional
analysis is a multivariate technique which maps
channels to encourage salary and wage earners to
attributes (gender, ethnicity, highest qualification
participate. Individuals with new employment are
occupation and employment income band which are
automatically enrolled with an opt-out option, or
strongly associated with the KiwiSaver interaction)
individuals can enrol with their existing employers. They
against the variable of interest (KiwiSaver participation
also benefit from the employer contributions that their
status) allowing the exploration of relationships.
employer contributes.
Results are consistent with what the logistic regression
Age is strongly associated with KiwiSaver participation.
model has found and are listed below.
Individuals aged between 18 and 24 are 35–44% more
likely to join KiwiSaver than other age groups, with the
KiwiSaver members are likely to be:
exception of the 55 to 65 age group which shows similar
Aged between 18 and 24 odds of participating. Annual income by age band shows
that KiwiSaver members aged between 45 to 54 years
earning $50,000 or less
old earn more than those who never enrolled, while
female income differences between those two groups in the
other age groups are minimal.
lower white collar.
Although there is a higher proportion of female in
Non-members are likely to be: KiwiSaver than males, there is no difference in gender
aged between 35 and 54 when comparing KiwiSaver enrolment and those who
have never enrolled. In terms of ethnicity breakdown,
zero income or middle level of income there is no clear evidence to suggest ethnic diversity is
upper blue collar worker. strongly associated with KiwiSaver participation. When
comparing ethnicity and income, non-Europeans with
zero or low income are more likely to join KiwiSaver,
Profile summary compared to New Zealand Europeans with the same
level of income (25.7% versus 18.3%). In relation to
Overview of KiwiSaver enrolment trends income, there is a lower participation difference for
those who earned between $30,000 and $50,000. There
By the end of wave 8 of SoFIE, 933,865 individuals, or
is a higher proportion of KiwiSaver participation among
44.2% of the analytic sample had been enrolled in
Europeans who earned $50,000 or more, compared to
KiwiSaver. Among all age groups, the 18 to 24 year age
non-Europeans.
group demonstrated the fastest growth, from 27.8% in
wave 6 to 66.0% at the end of wave 8. Those in other Individuals who are university educated, including those
age bands were shown to grow steadily during waves. who have a postgraduate degree, are 25.3% more likely
This finding may suggest that the rapid growth in to join KiwiSaver than those who have no formal
membership for the young is related to auto-enrolment
qualifications.
for those who enter the workforce.
Of those in lower white collar occupations, the
Although membership continues to grow steadily, 55.8% proportion of KiwiSaver participation compared to those
of those in the analytic sample have never enrolled in who have not enrolled is almost evenly split (50.4%
the scheme (excluding those who have opted out). versus 49.6%). The lowest KiwiSaver participation rate
observed belongs to upper blue collar workers with
Demographic characteristics of KiwiSaver members
33.4% joining KiwiSaver. Lower white collar workers are
Results suggest that income levels are strongly 25.0% more likely to join KiwiSaver than upper blue
associated with KiwiSaver participation. Individuals collar workers.
earning $30,000 to $50,000 are 36.8% more likely to join
KiwiSaver than those who have zero income and those
earning $30,000 or less are 24.0% more likely to join
KiwiSaver than those earning $30,000 to $50,000.
19
Prepared by: National Research and Evaluation UnitWho is enrolling in KiwiSaver?
KiwiSaver members are spread across all industry
sectors studied. The top four sectors were retail trade
and accommodation (15.6%), rental, hiring and real
estate services (14.9%), health care and social assistance
(11.7%) and manufacturing (10.1%). These four sectors
comprise over 50% of KiwiSaver members among all
industry sectors.
Results suggest that partnered adults are more likely to
have at least one KiwiSaver member in the household,
compared to single adult households. Around 37% of
single adults living alone are KiwiSaver members
compared to 51% of partnered households with no
children having at least one KiwiSaver member in the
household. Households with resident children share
similar percentages to those with no children.
Results comparing housing income with KiwiSaver
uptake suggest that households with zero or low income
are more likely to have no KiwiSaver members living in
them, while a one-KiwiSaver member household is more
likely to come from households with income between
$30,000 and $50,000. Not surprisingly, households with
two KiwiSaver members have higher household income.
To summarise, a likely KiwiSaver member is:
younger, employed, university educated and married
or living with a partner
in the low–middle income bands with $50,000 or less
in employment earnings
a low white collar worker and working in retail, the
manufacturing, rental or health care industries.
These characteristics indicate that KiwiSaver members
are more likely to be young individuals who are in the
early stage of their career.
20
Prepared by: National Research and Evaluation UnitWho is enrolling in KiwiSaver?
Figure 4: Mapping membership by demographic characteristics
21
Prepared by: National Research and Evaluation UnitWho is enrolling in KiwiSaver?
Section 3. KiwiSaver membership status and enrolment
methods
This section investigates who is participating, Automatic enrolment is more likely to affect young
through automatic enrolment or voluntary individuals who had just entered the workplace for the
first time.
enrolment, and opting out.
When compared with other enrolment methods a likely
KiwiSaver is a voluntary savings scheme. Individuals who auto-enrolee’s profile would be:
are eligible can opt in any time, either through their
employer or directly through a KiwiSaver scheme single and between 18 and 24 years old
provider. Individuals who start a new job and who are
Māori or Pacific Islander
not already members are automatically enrolled by their
employers. They have the choice to opt out of the secondary school educated
scheme within an eight-week period. Previous research
working in a lower white collar occupation
suggests age distribution differs notably by method of
enrolment. The profile of those who have been working in the retail trade and accommodation
automatically enrolled is more heavily weighted towards industry
younger individuals. Opting in through a provider peaks
at the over-55 year age bands. Those who opt in through earning $30,000 or less in employment income.
an employer tend to be over 45. Apart from age
Opting in through an employer is more likely for
distribution, what are the other characteristics we may
associate with KiwiSaver membership enrolments? middle-aged individuals with moderate earnings.
Section 2 looked at demographic characteristics and When compared to other enrolment methods a likely
profile for those opting in through an employer would
differences between KiwiSaver members and those who
have never been members. This section’s focus is on be:
membership status and enrolment types. Key analysis aged between 35 and 55 years old
includes comparing the distributions of demographic
characteristics related to membership status and types New Zealand European
as well as exploring characteristics that are associated university educated
with the decision to opt in as distinct from auto-
enrolment. working in upper white collar positions
working in wholesale trade, manufacturing and
Key findings health care and social assistance industries
earning between $30,000 and $80,000 in
Automatic enrolment and opt-ins through a scheme employment.
provider are the two most popular enrolment
methods. Opting in through a scheme provider is more likely to
be chosen by non-salary and wage earners.
At the end of wave 8:
When compared to other enrolment methods, a likely
39.3% of members chose to opt in to KiwiSaver, profile for those opting in through a scheme provider
through a scheme provider would be:
38.6% of members were automatically enrolled, with aged between 55 and 65
around 9%, deciding to opt out later
Asian
22.1% of members chose to opt in to KiwiSaver with
their employer. female
self-employed or receive interest and investment or
beneficiaries
without employment income.
22
Prepared by: National Research and Evaluation UnitYou can also read