Working (From Home) During a Crisis: Online Social Contributions by Workers During the Coronavirus Shock - Prithwiraj Choudhury Wesley W. Koo Xina ...
←
→
Page content transcription
If your browser does not render page correctly, please read the page content below
Working (From Home) During a
Crisis: Online Social Contributions by
Workers During the Coronavirus
Shock
Prithwiraj Choudhury
Wesley W. Koo
Xina Li

Working Paper 20-096
Working (From Home) During a
 Crisis: Online Social
 Contributions by Workers
 During the Coronavirus Shock
 Prithwiraj Choudhury
 Harvard Business School

 Wesley W. Koo
 INSEAD

 Xina Li
 INSEAD

 Working Paper 20-096

Copyright © 2020 by Prithwiraj Choudhury, Wesley W. Koo, and Xina Li.
Working papers are in draft form. This working paper is distributed for purposes of comment and discussion only. It may
not be reproduced without permission of the copyright holder. Copies of working papers are available from the author.
Funding for this research was provided in part by Harvard Business School.
Working (From Home) During a Crisis:
 Online Social Contributions by Workers During the Coronavirus Shock

 Prithwiraj Choudhury, Wesley W. Koo and Xina Li1

Prior research has documented that during mortality-related crises workers face psychic costs
and are motivated to make social contributions. In addition, management practices that
encourage workers to make social contributions during a crisis create value for firms. However,
the coronavirus crisis of 2020 is unprecedented given conditions of social distancing. It raises the
question of whether workers who continued to work (albeit from home) during this crisis were
constrained in their ability to make social contributions and exhibited disproportionately greater
psychic costs compared to workers who could not work from home. We exploit this shock to
estimate differences in content contributions to an online community by workers who work
from home (WFH) relative to workers who cannot work from home (CWFH). Online content
contributions are especially pertinent in our context because social distancing constrained
traditional forms of social contributions such as physical volunteering. Using data from a popular
question-and-answer platform, we estimate a difference-in-differences specification and report
nuanced results: while WFH workers made 19% fewer online contributions on average and
contribute less to topics such as ‘family’, they make 148% more contributions on topics related
to ‘WFH best practices.’ Using natural language processing tools, we also find that WFH
workers exhibited greater psychic costs than CWFH workers. We provide evidence for a
plausible mechanism, i.e. time allocation, and show that WFH workers attempted to catch up on
social contributions at the end of their workday, suggesting time constraints. Our research
contributes to literatures on managing workers during a crisis, WFH and online communities,
and have several immediate implications for managing WFH and CWFH workers during the
coronavirus crisis.

Keywords: crisis, social contributions, work from home (WFH), cannot work from home
(CWFH), social distancing, online communities, coronavirus, COVID-19.

1
 Prithwiraj Choudhury, Harvard Business School (email: pchoudhury@hbs.edu); Wesley W. Koo (email:
wesley.koo@insead.edu) and Xina Li (xina.li@insead.edu) from INSEAD. All authors made equal contributions to
the project and are listed alphabetically. We are thankful to Rajshree Agarwal, Ryan Allen, Lizhi Liu, Victoria
Sevcenko, Andrew Shipilov, Gabriel Szulanski, and Phebo Wibbens for comments on a prior draft.

 1
1. Introduction

 The coronavirus shock of 2020 is one of the most acute crises affecting companies and

workers in recent times. In prior literature, Carnahan et al. (2017) highlight that a mortality-

related crisis (in their paper, the 9/11 shock) leads to psychic costs for workers and motivates

them to make pro-social contributions. In addition, management practices that encourage

workers to make social contributions during a crisis create value for firms.2 In fact, prior

literature in strategic human capital has stressed that firms should motivate workers by offering

them opportunities that increase worker satisfaction (Gambardella et al. 2015) and this insight is

deeply relevant during a major crisis. However, the coronavirus crisis is unprecedented in that

conditions of social distancing forced companies around the globe to ask millions of workers to

work from home (Bodewits 2020). This created variation in work arrangements across industries

as workers in some industries cannot work from home and raises the question of whether

workers who continued to work (albeit from home) during this crisis were constrained in their

ability to make social contributions. We also ask whether workers who made the drastic switch

to working from home exhibited greater psychic costs and were constrained for time in the

immediate aftermath of the crisis, compared to workers who could not work from home.3

 Mandatory social distancing not only created variation in work arrangements for workers,

it also constrained traditional forms of social contributions such as physical volunteering.

However, workers could still make social contributions, albeit online. In today’s digital economy,

an important form of social contribution by workers relates to the unpaid content they

contribute to online communities (Boudreau and Lakhani 2013; Zhang and Zhu 2006, 2011;

Ghose and Han 2011; Luca 2015). Such content represents an example of a “positive spillover”

2
 Carnahan et al. (2017) document that incentivizing social contributions by workers creates value for firms in the
form of reduced turnover of workers. Prior literature on pro-social behavior by workers has focused on
contributions such as physical volunteering hours and pro-bono cases (Bénabou and Tirole 2006; Exley 2018).
3
 It is possible that in the longer term, workers who can and cannot work from home will be affected differently by
factors such as forced turnover and it is not the intention of the paper to claim that the patterns observed will be
sustained over time.

 2
from the internet to society as discussed by Chan et al. (2013). To quote Zhang and Zhu (2011),

“Many public goods on the Internet today rely entirely on free user contributions. Popular

examples include open source software development communities (e.g., Linux, Apache), open

content production (e.g., Wikipedia, Open Courseware), and content sharing networks (e.g.,

Flickr, YouTube).” (ibid, page 1601). Thus, we adopt a broad definition of social contribution to

mean any free contribution to an online public good.

 We exploit the coronavirus shock and provide causal evidence of how workers who

work from home (WFH) differ from workers who cannot work from home (CWFH) with

respect to content contributed to online communities. The online community of interest is one

of China’s largest online question and answer communities. In prior literature, Wang et al. (2013)

study online question and answer communities such as Quora and Stack Overflow and conclude

that “community question and answer sites provide a unique and invaluable service to its users”

(ibid, 1350). Thus, our measure of individual worker output (i.e., the number of answers

contributed to the online community) meets the characterization of social contributions (i.e.

“helping others”) articulated by Carnahan et al. (2017).

 Our pre-period comprises the Chinese New Year holidays when most workers are on

vacation in their hometowns. In the post-period, all workers were under mandatory lockdown

facing social distancing. However, while individuals working in certain industries (such as the

internet industry and the software industry) were asked to WFH, workers in industries such as

airlines, computer hardware, and manufacturing could not work from home under lockdown.

We estimate a difference-in-differences specification comparing content contributions of

individuals working from home in the post-period to contributions made by individuals who

cannot work from home in the post-period.

 We report several results. On average, WFH workers posted 19% fewer answers than

CWFH workers. However, WFH workers provided more answers in certain socially helpful

categories such as advice on how to work from home. Using natural language processing tools,

 3
we also document evidence of greater psychic costs exhibited by WFH workers compared to

CWFH workers. Additionally, we explore a key mechanism (i.e. time allocation) and analyze

hourly contributions by WFH and CWFH workers. This reveals that while during work hours

WFH workers contributed less than CWFH workers, they contributed equally between 8pm and

midnight. In other words, WFH workers tried to “catch-up” on the social contributions at the

end of the workday, suggesting disproportionate constraints on their time. Our findings

contribute to several streams of the strategic human capital literature and have implications for

how managers and firms should manage WFH and CWFH workers during a major crisis.

2. Setting and Data

2.1. Work-From-Home during COVID-19 Lockdown

 In December 2019, several cases of pneumonia emerged near the Huanan seafood

market in Wuhan, China. Later, it was revealed to be triggered by a novel coronavirus that is

both highly contagious and deadlier than the common flu (Huang et al. 2020). The Chinese New

Year public holiday lasted from January 24 to February 2, 2020. 4 In order to enforce social

distancing and slow the diffusion of the virus, provincial governments across mainland China

implemented a household lockdown across the country, and barred companies from resuming

physical work until February 10. The government also encouraged companies to adopt WFH

arrangements starting February 3.5 On Monday, February 3, 2020, workers in certain industries

(such as software development) began to work from home (Liang 2020). The weekly downloads

of business and remote work applications on the iOS App Store increased from 2.4 million in

late January to 14 million in the week of February 3 (Liao 2020). In contrast, workers in other

industries for which remote work is unfeasible (such as airlines, computer hardware, and

manufacturing) stayed home and could not work. A detailed timeline of major events is shown in

Table A1 in the Appendix.

4 The Lunar New Year holiday was originally to end on January 30 and later extended to February 2 to contain
COVID-19 outbreak (Xinhua, 2020).
5
 We study provincial government policies, based on news reports such as China News Services (2020).

 4
We screened meticulously for evidence indicating that certain industries had started

WFH at scale on February 3. The information was obtained through outlets such as news

portals, forums, and blogposts. Specifically, industries that started WFH on February 3 include

E-Commerce, Internet, and Software Development.6 Workers from these industries form our

treatment group. Next, we screened for industries that almost certainly did not start remote work

on February 3. These industries include traditional industries that would require physical work as

well as industries for which we found concrete evidence for a later start date. Industries where

workers could not work at home after February 3 include Airlines, Automobile, Banking,

Computer Hardware, Construction Tools, Education, Electronics, Indoor Decoration,

Machinery, Manufacturing, and Restaurants. These workers form our control group.

 To emphasize, our research question relates to how WFH workers differ from workers

who cannot work from home (CWFH) with respect to their content contributions to online

social communities. In the past, identifying a causal relationship between WFH and community

contributions was challenging because workers’ choices of work arrangements would likely be

endogenous and affected by unobservable worker characteristics and by social and economic

conditions. In this study, we use the coronavirus-induced variation in work arrangements to

construct a natural experiment. Since the government policy to prohibit return to physical work

until February 10 was driven by the rapid spread of coronavirus across the country, it creates an

exogenous shock where workers in the treatment group are asked to WFH and workers in the

control group cannot work from home. Additionally, the online platform we focus on did not

implement any major design changes or marketing campaigns to differentially affect WFH

workers’ and CWFH workers’ content contributions in that window of time.

6 For more information on group assignment, please see the last footnote under Appendix Table A1.

 5
2.2. Data and Methods

 The data for this study was acquired from a popular question-and-answer platform based

in China. In 2019, the platform had over 200 million registered participants, similar in size to its

American counterpart, Quora. On this platform, participants mainly engage in two activities:

answer others’ questions and ask their own questions.7 They also engage in activities such as

“liking” a question or answer, following an account, publishing an article, and posting a photo.

To acquire data on worker behavior and characteristics, we used nine newly registered accounts

to scroll down a total of 151,000 questions recommended by the platform. Among the 664,000

workers who contributed to these questions, we randomly selected 30,000 workers with the

restriction that at least 3,000 workers (10%) were from Wuhan. For these 30,000 workers, we

crawled down their historic platform contribution, including the content and time-stamp of

every answer and every question they posted, the content and the number of likes, followers,

visits, and comments on every answer and every question they posted, as well as background

information and worker characteristics such as location, industry, gender, and number of fans.

 In this study, we focus on analyzing workers’ answering patterns. The main dataset

contains 3.7 million answers posted by the 30,000 workers from when they registered their

accounts until February 15, 2020. We then collapsed the data to form a panel dataset at the

worker-date level. We focus on two periods: 1) the pre-period is from January 24 to February 2,

when workers were at home on vacation during the Chinese New Year holiday; 2) the post-

period is from February 3 to February 7, when workers in the treatment group started WFH and

workers in the control group could not work.8 Our final dataset contains daily information on

100,680 worker-dates: 6,712 unique workers posted 18,065 answers from January 24 to February

7, 2020. WFH and CWFH workers comprise 64% and 36% of the sample, respectively. The

main dependent variable is Answers (number of answers posted by a worker on a given day). To

7Hereon, we refer to all platform users as “workers” to stay consistent with the rest of the paper.
8We excluded February 8 and 9 from the post-period because they were weekend days. We also excluded all student
contributors because they do not abide by the traditional work schedule and are not considered workers.

 6
reiterate, answers to questions posed by members of the community represent online social

contributions. Additionally, we investigate the characteristics of workers’ contributions –

specifically, the popularity of the questions they choose to answer, the topics (e.g., family and

WFH), and workers’ sentiment expressed in their answers. We control for the following

variables: the number of New Infections of COVID-19 reported in a worker’s city on a given day,

the numbers of Fans a worker has, times a worker has helped the platform Edit public content,

times a worker’s post is Featured by the platform, times a worker is publicly Recognized by other

top contributors, as well as a worker’s Gender (0 = female; 1 = male).9 Table A2 in the Appendix

shows the summary statistics and pairwise correlations.

 We use the Poisson quasi-maximum likelihood (QML) estimator with conditional fixed

effects to estimate the main models with count dependent variables, and we run ordinary least

squares (OLS) regressions for other dependent variables. Poisson QML with conditional fixed

effects accommodates over-dispersion and autocorrelated error terms (Wooldridge 2010). The

following regression illustrates the specification in our main models:

 ( [ | ]) = × + ′ + + ,

where i indexes individual worker, d indexes industries, c indexes cities, and t indexes days.

and are the industry and date fixed effects, respectively. × is the treatment

indicator, which equals 1 if a worker-date is in a WFH industry on or after February 3. is the

vector of control variables. Finally, all standard errors are clustered at the industry level, which is

the level of treatment (Bertrand et al. 2004). We also use worker fixed effects in robustness tests.

9 We take the natural logarithms of all control variables except for Gender. Data on daily infected cases is from The
Paper, a Chinese news portal that published daily city-level numbers of infections after consolidating data from the
local ministries of health and local news channels. Count data at the worker level (e.g., Fans, times Recognized) are
values from February 16.

 7
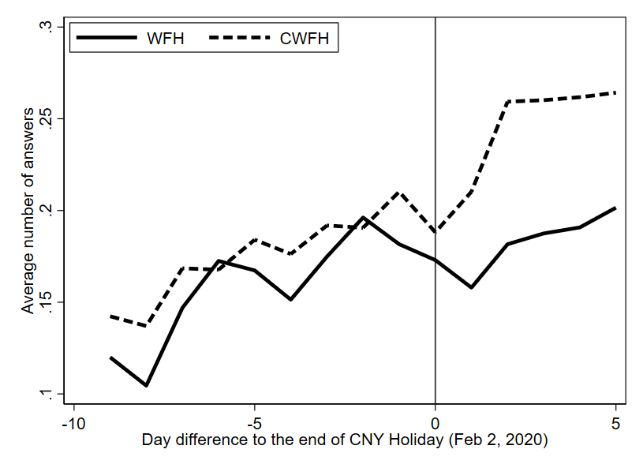
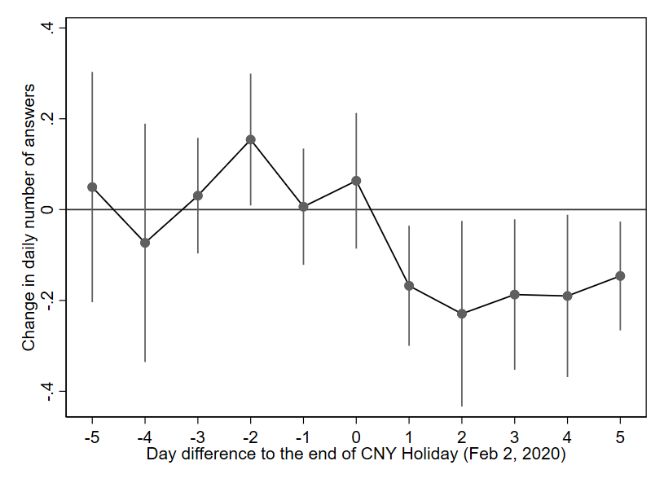
3. Results

3.1. Effects of WFH on the Level and Heterogeneity of Content Contributions

 We first test whether, and to what extent, WFH affected workers’ social contributions.

Figure 1a illustrates these results: WFH workers’ contribution level barely changed in the post-

period, but CWFH workers displayed a visible increase in contribution. When both groups had

no work prior to February 3, the average treated worker answered 0.16 questions per day and the

average control worker answered 0.18 questions per day. After February 3, the average treated

worker answered 0.18 questions per day and the average control worker answered 0.25 questions

per day. Regressions in Table 1, Models 1-3 show that, after February 3, the average treated

worker (WFH) generated about 19% fewer answers than the average control worker (CWFH)

(exp(-0.211) – 1 = -0.19). In terms of the economic effects for the entire platform, the reduction

in answer count among WFH workers amounts to a decrease of roughly 260,000 answers per

day and 8.8 million views per day on the platform – about 4.4% of all platform activities (see

Appendix Note N3 for details on the calculation).

 Our results are driven mainly by the intensive margin, as opposed to the extensive

margin; the lower relative contribution among WFH workers can be mainly attributed to active

workers answering relatively fewer number of questions, as opposed to active workers becoming

inactive in the post-period. Additionally, Figure 1b shows the dynamics of treatment effects

before and after February 3. To generate this graph, we created a set of dummy variables

indicating the days before and after February 2 (from t = -5 to t = +5). We then interact those

dummy variables with the WFH indicator and regress the interaction terms against our

dependent variables with control variables and fixed effects included. The graph shows that the

WFH effect is close to zero in the pre-period and becomes negative in the post-period. This

result satisfies the parallel trends assumption and offers additional support for our main result.

 Next, we explore the heterogeneity of worker contributions – what types of questions

workers tend to answer. To test this, we use data on the tags associated with each answered

 8
question to construct six topic categories that are most popular on the platform: Arts, Business,

Education, Emotions, Entertainment, and Family. We include one additional category which is

relevant to our setting, Remote Work, to gauge if workers helped address questions regarding

how to work from home (e.g., what software to use, how to do video conferencing).10 We run

seven regressions to compare the number of answers belonging to different categories between

WFH workers and CWFH workers (Table 2). The results show that WFH workers answered

significantly fewer questions in the categories of Arts, Emotions, and Family than CWFH

workers after February 3. In the post-period, relative to the pre-period, WFH workers answered

43%, 21%, and 26% fewer questions related to arts, emotions, and family, respectively, than

CWFH workers. These results suggest that contributions were particularly depressed in

categories that are arguably more related to maintaining work-life and work-family balance.

However, WFH workers answered 148% more questions related to remote work than CWFH

workers in the post-period. This result suggests that WFH workers were educating the

community about the details and best practices of remote work.

3.2. Mechanism: Time Allocation

 Building on the literature on time budget allocation by workers (Perlow 1999), we

propose a mechanism that may plausibly explain the observed patterns: differences in time

budget allocation. Whereas the mechanism may seem straightforward, it is important to

empirically examine 1) its validity and 2) how it plays out. We first categorize all answers into two

types – answers during working hours (8am-12pm; 1-7pm) and answers outside of working

hours.11 At the worker-date level, we construct two variables, number of Working-Hour Answers

and number of Non-Working-Hour Answers. Regressions of those two variables over the WFH ×

Post interaction term show that WFH led to a more drastic decrease in contributions during

working hours (21% decrease) than during non-working hours (17%) (Table 3, Models 1-2).

10 Appendix Note N2 provides more information on the keywords used to categorize the topic categories.
11 There is one unified time zone in all of China.

 9
This result provides support for the time substitution mechanism that WFH workers

likely took time away from social contributions due to the onset of remote work. It also

highlights an interesting phenomenon: not only did workers reduce their contribution level due

to WFH, they also redistributed their contributions over different hours of the day. To further

investigate this phenomenon, we examine the hourly effects of WFH. Specifically, we generate

24 dependent variables corresponding to the number of answers posted within each one-hour

period and run 24 regressions over the WFH × Post interaction term. Figure 2 combines the

coefficients in an hourly graph. It shows that, relative to CWFH workers, WFH workers

experienced a drop in contributions during all working hours in the post-period. The most

significant drops occurred at around 2am, 2pm, and 6pm. This is likely because in the post-

period WFH workers could no longer stay up too late, needed to resume work after lunchbreak,

and needed to finish work at around 6pm. Starting at around 8pm till midnight, there are no

differences in contributions between WFH and CWFH workers, suggesting that WFH workers

might have been “cramming in” their online contributions after work before bedtime.

3.3. Effects on Worker Sentiment

 While the crisis imposes psychic costs on all workers (Carnahan et al., 2017), challenges

in managing time (Perlow 1999) and transitioning between work, life and social roles (Ashforth

et al. 2000) might have led to disproportionately higher psychic costs for WFH workers in the

immediate aftermath of the crisis. In the WFH literature, Gajendran and Harrison (2007) have

documented that workers who practice WFH on a temporary or ad-hoc basis (such as the

workers in our sample) might be less effective at managing work-life boundaries leading to

greater conflicts and psychic costs, compared to workers who practice WFH on a regular basis.

 We test WFH’s effects on worker sentiment by conducting a sentiment analysis of all

answer texts using natural language processing techniques. We use JiebaR, the latest Chinese

word segmentation program in R, to intelligently segment the text into words (Qin and Wu

2019). Using sentiment dictionaries compiled by Tsinghua University (Li 2011), we calculate the

 10
sentiment scores by counting the number of words indicating positive and negative sentiment in

each answer.12 Then, we regress the sentiment scores over the interaction term. Results show

that, in the post-period, WFH workers’ answers displayed 6.6% less positive sentiment than

CWFH workers’ answers relative to the pre-period (Table 3, Models 3-4).

3.4. Physical Work as an Alternative Baseline

 An additional question to answer is whether the WFH and CWFH conditions affect

social contributions differently from physical, in-office work. To answer that question, we need

to find a counterfactual worker group who are similar to the WFH and CWFH groups but start

physical work instead of remote work or remaining workless at home. To do that, we exploit the

fact that we observe workers’ historic contribution. Specifically, we study the behavior of the

same groups of workers from February 4 to February 15, 2019 – the same period one year

earlier. The 2019 period also includes a pre-period (seven days during the Chinese New Year

holiday) and a post-period (five days after workers resumed physical work post-holiday). By

looking at WFH and CWFH workers’ contributions from 2019, we are able to construct a

scenario in which workers transition from vacation to regular, physical work. Regressions show

that, in the post-period, whereas CWFH workers generated 87% higher contributions in the

post-period than they did last year, the contributions among WFH workers were also 73% higher

than last year (Appendix Table A5, Panel C). This result could be affected by time trends and

differences in contexts, and it should be treated as correlational. The large effect sizes, however,

offer some support for the statement that both WFH and CWFH generate higher contributions

than physical work.

3.5. Robustness Checks and Limitations

 As robustness checks for empirical design, we modify the industries in the treatment and

the control groups to test alternative group compositions. First, we exclude e-commerce

12 Appendix Note N1 provides more information on the sentiment dictionaries.

 11
workers, who could have been more familiar with WFH than other types of workers due to the

nature of their work, from the WFH treatment group. Then, we exclude the bank and airline

industries from the control group because a small percentage of workers in these two industries

could have been engaging in physical work during the lockdown in order to keep essential

services running for the public. Results remain highly similar with those changes (Appendix

Table A6, Panel A). Additionally, we re-estimate our main results using different model

specifications such as worker fixed effects and negative binomial regressions with unconditional

fixed effects (Allison and Waterman 2002; Wooldridge 2010). Results remain similar (Appendix

Table A6, Panel B; Appendix Figures A1-A2 show DID and hourly graphs with worker FE).

 Our study has several limitations. First, we do not know if we would observe similar

patterns if the workers were not under social distancing and/or had more time to prepare for

WFH. Second, the workers in our sample are likely to be those who were particularly active

during our window of observation. It is unlikely to affect our main results, but it may bias our

results on WFH and CWFH’s comparison to physical work one year earlier. Finally, it is not our

intent to state that making social contributions are the only driver of worker utility and/or these

patterns would be observed with a prolonged crisis. Long periods of not working and/or

unemployment during a crisis might negatively and severely affect worker utility and future

research should compare productivity and psychic costs of WFH and CWFH workers using a

broader set of measures and over a longer time frame.

4. Contributions and Conclusion

 The coronavirus shock is arguably the biggest crisis facing firms and workers in recent

times. The prior literature, notably Carnahan et al. (2017), has documented that during a crisis,

workers are motivated to make social contributions, and management practices that encourage

workers to make social contributions during a crisis create value for firms. However, the

coronavirus shock is unprecedented because unlike prior crisis, social distancing created variation

in work arrangements for workers. While workers in certain industries continued to work (albeit

 12
from home), other workers could not work from home. Given these conditions, we estimate a

causal difference in an important social contribution, i.e. content contributions to online

communities, between WFH and CWFH workers. This form of social contribution is

particularly salient in our context, given that social distancing constrained the ability of workers

to engage in traditional forms of social contribution such as physical volunteering. We report a

nuanced set of causal results: while WFH workers made 19% fewer online contributions on

average and contributed less to socially helpful topics such as “family”, they made 148% more

contributions on socially helpful topics related to “remote work best practices”.

 Using natural language processing tools, we also document greater psychic costs faced by

WFH workers compared to CWFH workers in the immediate aftermath of the crisis. We also

provide evidence around a key mechanism and using hourly contributions show that WFH

workers tried to catch-up on social contributions at the end of the workday. This suggests that

WFH workers were plausibly experiencing conditions of “time famine”, i.e. a “pervasive feeling

of having insufficient time in daily life” (Perlow, 1999; page 244) that leads to stress, anxiety and

psychic costs. These results speak to a prior literature in strategy on worker well-being and firm

productivity (e.g. Lee and Miller 1999) and is especially salient to how firms should manage

worker well-being during a crisis.

 Our study also contributes to the remote work literature. While prior literature (Bloom et

al. 2015; Choudhury et al. 2019) has compared output of workers under conditions of WFH and

physical work, to the best of our knowledge, this is the first study to compare individual

contributions of WFH and CWFH workers. Also, while we have prior literature on how physical

isolation from the office (Bartel et al., 2012) and professional isolation (Cooper and Kurland

2002) affects WFH workers, to the best of our knowledge, this is the first study that documents

output of WFH workers under conditions of social distancing.

 In this paper, we underscore three immediate managerial and policy implications of our

study. First, given that our study demonstrates that WFH workers make disproportionately

 13
greater online contributions to socially helpful topics such as remote work best practices and yet

face disproportionately higher psychic costs and possibly time famine, managers might consider

awarding WFH workers temporal flexibility in the form of a few “free hours” to engage in online

contributions and other “virtual watercoolers” in order to deal with work-social and work-life

balance. In fact, Katherine Maher, CEO of Wikimedia, the nonprofit organization behind

Wikipedia announced that workers can work 20 hours per week and still get paid for 40 hours

during the crisis (Gardeman 2020).

 Second, our result on the greater psychic costs of WFH workers compared to CWFH

workers is important to highlight: while current debate is centered around the psychic costs of

CWFH workers (such as gig workers who cannot work, e.g. Scott, 2020), managers should also

consider strategies to mitigate the psychic costs of workers who have made a drastic switch to

WFH and might have insufficient time to fulfill their work, social and family roles. Third, while

there have been widespread concerns at the loss of human capital returns for idle workers,

especially for workers who cannot work at home during this coronavirus shock (Morona, 2020),

a silver lining in this very dark cloud is that CWFH workers may continue to generate social

returns to their human capital by contributing free content to online communities. In conclusion,

our paper advances literatures on managing workers during a crisis, WFH and online

contributions and have several immediate managerial and policy implications for managing

workers during the coronavirus shock.

 14
Figures and Tables

 (a) Average daily contributions of WFH (work-from-home)
 workers versus CWFH (cannot-work-from-home) workers.

 (b) Daily effects of WFH on contribution differences between
 WFH and CWFH workers. “1” on the x-axis indicates the first
 day of remote work for WFH workers (95% Confidence
 Intervals).

 Figure 1. Contribution Differences Between WFH and CWFH Workers

 15
Figure 2. Hourly Effects of WFH on Contribution Differences
 (95% Confidence Intervals)

 Table 1. WFH Effects on the Level of Content Contribution
 Dependent variable Answers
 Full Sample Intensive Margin
 (1) (2) (3) (4)
 WFH × Post -0.211*** -0.210*** -0.211*** -0.205***
 (0.050) (0.055) (0.055) (0.054)
 Post 0.357*** 0.397***
 (0.046) (0.050)
 New Infections -0.083*** -0.100*** -0.062***
 (0.021) (0.024) (0.020)
 Fans 0.073*** 0.073*** 0.008
 (0.009) (0.009) (0.010)
 Edit 0.114*** 0.114*** 0.020
 (0.024) (0.024) (0.020)
 Featured -0.165 -0.164 -0.015
 (0.116) (0.117) (0.112)
 Recognized 0.187* 0.185* 0.027
 (0.104) (0.105) (0.094)
 Gender 0.165 0.165 0.037
 (0.125) (0.126) (0.113)
 Industry FE No Yes Yes Yes
 Date FE No No Yes Yes
 Observations 100,680 91,995 91,995 28,780
 Log-likelihood -60,117.3 -54,022.1 -53,828.9 -35,491.8
Notes: Models are estimated using the Poisson QML estimator with conditional fixed effects. “Intensive
margin” sample includes only active workers with at least one answers per period. Standard errors in
parentheses are clustered at the industry level. p
Table 2. WFH Effects on Contribution Topics
 Arts Business Education Emotions Entertainment Family Remote Work
 Dependent variable
 Answers Answers Answers Answers Answers Answers Answers
 (1) (2) (3) (4) (5) (6) (7)
 ** ** **
 WFH × Post -0.554 -0.084 -0.050 -0.234 0.033 -0.301 0.918**
 (0.248) (0.163) (0.101) (0.107) (0.069) (-0.111) (0.405)
 Controls Yes Yes Yes Yes Yes Yes Yes
 Industry FE Yes Yes Yes Yes Yes Yes Yes
 Date FE Yes Yes Yes Yes Yes Yes Yes
 Observations 8,441 8,396 8,441 8,441 8,441 8,441 8,374
 Log-likelihood -2,749.1 -1,902.4 -4,789.7 -4,405.9 -7,608.5 -2,742.5 -1,053.1
Notes. Models are estimated using Poisson QML. Sample excludes worker-date observations with no answers. Standard errors in
parentheses are clustered at the industry level. p
References
Aaltonen A, Seiler S (2016) Cumulative growth in user-generated content production: evidence from
 Wikipedia. Management Science 62(7):2054–2069.
Allison PD, Waterman RP (2002) Fixed-effects negative binomial regression models. Sociological
 Methodology 32(1):247–265.
Ashforth, Blake E., Glen E. Kreiner, and Mel Fugate. "All in a day's work: Boundaries and micro
 role transitions." Academy of Management Review 25, no. 3 (2000): 472-491.
Bartel CA, Wrzesniewski A, Wiesenfeld BM (2012) Knowing where you stand: Physical isolation,
 perceived respect, and organizational identification among virtual employees. Organization Science
 23(3):743–757.
Bénabou R, Tirole J (2006) Incentives and prosocial behavior. American Economic Review 96(5):1652–
 1678.
Bertrand M, Duflo E, Mullainathan S (2004) How much should we trust differences-in-differences
 estimates? Quarterly Journal of Economics 119(1):249–275.
Bloom N, Liang J, Roberts J, Ying ZJ (2015) Does working from home work? Evidence from a
 Chinese experiment. The Quarterly Journal of Economics 130(1):165–218.
Bodewits K (2020) Working from home because of COVID-19? Here are 10 ways to spend your ti
 me. Science | AAAS. Retrieved (March 24, 2020), https://www.sciencemag.org/careers/2020/
 03/working-home-because-covid-19-here-are-10-ways-spend-your-time.
Boudreau KJ, Lakhani KR (2013) Using the crowd as an innovation partner. Harvard Business Review
 91(4):60–9.
Carnahan S, Kryscynski D, Olson D (2017) When does corporate social responsibility reduce
 employee turnover? Evidence from attorneys before and after 9/11. Academy of Management
 Journal 60(5):1932–1962.
Chan J, Ghose A, Seamans R (2013) The Internet and Hate Crime: Offline Spillovers from Online
 Access.
China News Service (2020) Timetable for Returning to Work or School. Education Online, Retrieved (
 March 29, 2020), https://news.eol.cn/yaowen/202002/t20200203_1707941.shtml.
Chinazzi M, Davis JT, Ajelli M, Gioannini C, Litvinova M, Merler S, Pastore Y Piontti A, et al.
 (2020) The effect of travel restrictions on the spread of the 2019 novel coronavirus (COVID-
 19) outbreak. Science.
Choudhury P, Foroughi C, Larson B (2019) Work-from-anywhere: The Productivity Effects of
 Geographic Flexibility. Harvard Business School Technology & Operations Mgt. Unit Working Paper
 (19–054).
Cooper CD, Kurland NB (2002) Telecommuting, professional isolation, and employee development
 in public and private organizations. Journal of Organizational Behavior: The International Journal of
 Industrial, Occupational and Organizational Psychology and Behavior 23(4):511–532.

 18
Exley C (2018) Incentives for prosocial behavior: The role of reputations. Management Science
 64(5):2460–2471.
Gajendran RS, Harrison DA (2007) The good, the bad, and the unknown about telecommuting:
 Meta-analysis of psychological mediators and individual consequences. Journal of applied psychology
 92(6):1524.
Gambardella, Alfonso, Claudio Panico, and Giovanni Valentini. "Strategic incentives to human
 capital." Strategic Management Journal 36, no. 1 (2015): 37-52.
Gerdeman D (2020) The New Rules for Remote Work: Pandemic Edition. HBS Working Knowledge.
 Retrieved (March 31, 2020), http://hbswk.hbs.edu/item/the-new-rules-for-remote-work-
 pandemic-edition.
Ghose A, Han SP (2011) An empirical analysis of user content generation and usage behavior on the
 mobile Internet. Management Science 57(9):1671–1691.
Huang C, Wang Y, Li X, Ren L, Zhao J, Hu Y, Zhang L, et al. (2020) Clinical features of patients
 infected with 2019 novel coronavirus in Wuhan, China. The Lancet 395(10223):497–506.
Lee, Jangwoo, and Danny Miller. "People matter: Commitment to employees, strategy and
 performance in Korean firms." Strategic Management Journal 20, no. 6 (1999): 579-593.
Li J (2011) Chinese negative and positive sentiment dictionaries v1.0. Tsinghua University, Retrieved
 (March 20, 2020), http://nlp.csai.tsinghua.edu.cn/site2/index.php/13-sms.
Liang LH (2020) How COVID-19 led to a nationwide work-from-home experiment. BBC. Retrieved
 (March 20, 2020), https://www.bbc.com/worklife/article/20200309-coronavirus-covid-19-
 advice-chinas-work-at-home-experiment.
Liao R (2020) Amid coronavirus, tech firms offer ways to maintain China’s lifeblood. TechCrunch.
 Retrieved (March 20, 2020), https://techcrunch.com/2020/02/23/china-roundup-tech-
 companies-coronavirus/.
Luca M (2015) User-generated content and social media. Handbook of Media Economics. (Elsevier),
 563–592.
Morona J (2020) Stuck at home due to coronavirus? 10 ways to make that idle time count. Cleveland,
 Retrieved (March 24, 2020), https://www.cleveland.com/entertainment/2020/03/stuck-at-
 home-due-to-coronavirus-10-ways-to-make-that-idle-time-count.html.
Perlow LA (1999) The time famine: Toward a sociology of work time. Administrative Science Quarterly
 44(1):57–81.
Qin W, Wu Y (2019) jiebaR - Chinese text segmentation with R. Github. Retrieved (March 18,
 2020), https://github.com/qinwf/jiebaR/.
Scott J (2020) The human impact of COVID-19 – and how business can help. World Economic Forum.
 Retrieved (March 29, 2020), https://www.weforum.org/agenda/2020/03/this-is-the-human-
 impact-of-covid-19-and-how-business-can-help/.
Wang G, Gill K, Mohanlal M, Zheng H, Zhao BY (2013) Wisdom in the social crowd: an analysis of
 quora. Proceedings of the 22nd international conference on World Wide Web. 1341–1352.

 19
Wooldridge JM (2010) Econometric analysis of cross section and panel data 3rd ed. (The MIT Press,
 Cambridge, MA).
Xinhua (2020) China extends Spring Festival holiday to contain coronavirus outbreak. The State Coun
 cil, PRC. Retrieved (March 29, 2020), http://english.www.gov.cn/policies/latestreleases/20200
 1/27/content_WS5e2e34e4c6d019625c603f9b.html.
Zhang XM, Zhu F (2006) Intrinsic motivation of open content contributors: The case of Wikipedia.
 Workshop on Information Systems and Economics. (Evanston, IL).
Zhang XM, Zhu F (2011) Group size and incentives to contribute: A natural experiment at Chinese
 Wikipedia. American Economic Review 101(4):1601–15.

 20
You can also read