Intellectual Capital of a Trading Company: Comprehensive Analysis Based on Reporting - MDPI
←
→
Page content transcription
If your browser does not render page correctly, please read the page content below
sustainability

Article
Intellectual Capital of a Trading Company:
Comprehensive Analysis Based on Reporting
Oksana Pirogova 1 , Olga Voronova 1 , Tatyana Khnykina 1 and Vladimir Plotnikov 2, *
 1    Graduate School of Service and Trade, Institute of Industrial Management, Economics and Trade,
      Peter the Great St. Petersburg Polytechnic University, 29 Polytechnicheskaya St.,
      195251 St. Petersburg, Russia; kafedra17@rambler.ru (O.P.); iliina_ov@spbstu.ru (O.V.);
      hnykina_ts@spbstu.ru (T.K.)
 2    Department of General Economic Theory and History of Economic Thought, St. Petersburg State University
      of Economics, Sadovaya Str. 21, 191023 St. Petersburg, Russia
 *    Correspondence: plotnikov_2000@mail.ru; Tel.: +7911-949-1321

 Received: 31 July 2020; Accepted: 27 August 2020; Published: 31 August 2020

 Abstract: The study is devoted to the analysis of the efficiency of use and the effectiveness of disclosing
 the intellectual capital (IC) of a trading company operating in the market of the Russian Federation.
 The subject of the research is an assessment of the quality of disclosure of information about the IC
 company involved in the creation of financial results of activities and the growth of the company’s
 value. The study examines the assessment of IC and the search for links between the involvement of
 IC in the formation of the financial result of a trading company and the degree of its reflection in
 the company’s annual reports. Methods of using intellectual value-added coefficients (VAIC) such
 as the trademark logo (written as ™), Calculated Intangible Value (CIV) and content analysis of
 the company’s annual reports are used to assess the IC and its elements. The influence of IC and
 its components, on the financial results of a trading company are also investigated and calculated
 using various methods. It is shown that there are no statistically significant relationships between
 the assessments of IC and its elements obtained using financial ratios, and those obtained using
 content analysis. This indicates that the opinions and assessments of the heads of a trading company
 regarding IC are formed regardless of the size of IC involved in the formation of economic results
 and testifies to the absence of an effective investment management policy in the studied company.
 Some of the results obtained confirm the trends in IC structures previously observed for companies in
 other industries. The results also indicate that the existing system for preparing annual reports does
 not sufficiently consider the size, dynamics and efficiency of using the intangible assets of a trading
 company. The results of this study are likely to be useful to management and academics.

 Keywords: intellectual capital; human capital; disclosure of information on intellectual capital;
 financial results; content analysis; annual report

1. Introduction
     Research on intellectual capital came to the fore in economic research at the end of the 20th century.
Lev called the emergence of the concept of intellectual capital “the main economic event of the late XX
and early XXI centuries” [1]. This attention by researchers towards the new economic categories of
“intellectual assets” and “intellectual capital” was due to several factors.
     First, at the end of the 20th century, annual investments in intangible assets in the corporate
sector were at first equalized, and then began to exceed investments in tangible assets [1–3], while a
significant part of the market value of companies is still not reflected in any way in the balance sheets

Sustainability 2020, 12, 7095; doi:10.3390/su12177095                      www.mdpi.com/journal/sustainability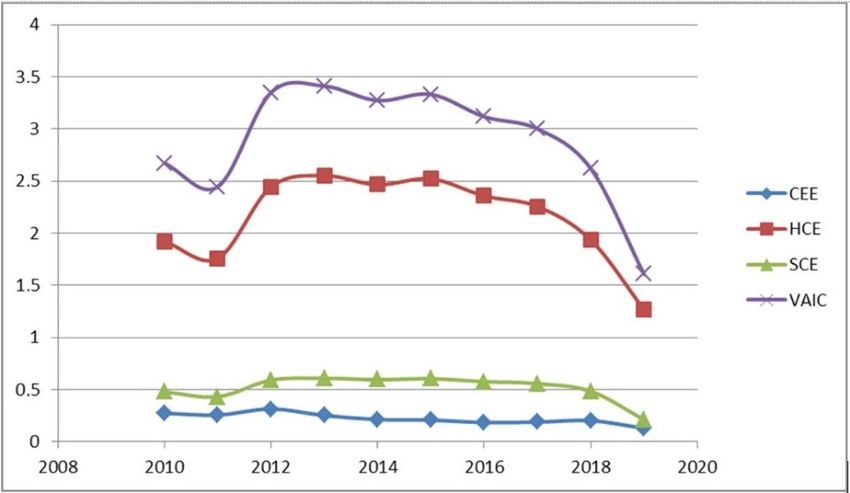
Sustainability 2020, 12, 7095                                                                         2 of 21

of companies, i.e., remains unidentifiable, and, therefore, is difficult to use to predict value. All this
leads to a situation of having insufficient information when making investment decisions.
       Secondly, the concept of company management on the basis of value, actively developed and
used since the end of the 20th century, made it possible to identify financial levers for successful
management of the operation and development of companies [4–7]. At the same time, it became clear
that the use of only financial leverage to manage a company is insufficient, and there are additional,
non-financial management tools that often play a more significant role in shaping the success of a
company. This led to the formation of a new direction in assessing the aspects of the activities and
development of companies, and the emergence of such new tools as the Balanced Scorecard (BSC) [8],
Skandia Navigator™ [9] and others. In them, an attempt to assess the intellectual company’s capital
was made, based on the implementation of an indicators system that reflects the dynamics of individual
components of intellectual capital. The analysis of the peculiarities of the companies functioning
revealed that the basis of the company’s success and their competitive advantage is knowledge and
the ability to use it effectively.
       The third aspect is the development of the knowledge economy, as well as the infrastructure that
contributes to their formation, accumulation and effective use in the process of activity. The development
of technologies for informatization and networkization of activities has also made a significant
contribution to the development of the concept of intellectual capital and marked the transition to a
completely new paradigm of company management based on intellectual capital. Now every company,
if it wants to succeed and ensure its sustainable existence and development, must be able to manage its
IQ, using the widest arsenal of various metrics and management methods [10,11].
       Another factor is the further development of the resource theory of the enterprise [12–14].
In accordance with this, the competitive advantages of an enterprise are formed due to its ability to
combine available resources in such a way as to achieve superiority in the competition, providing a
higher rate of return on invested capital. Thus, the ability of the organization, as codified knowledge,
becomes the fundamental basis for the success of activities [15–17]. Currently, IC is becoming the
most important factor in sustainable development both at the country and regional level, and at the
enterprise level. The factor of intellectual capital becomes the leading one in the management of
production and reproduction processes in the economic system [18,19].
       Thus, it can be stated that the well-known concept of “land-labor-capital” at the end of the twentieth
century was transformed into a new concept of “land-labor-capital-entrepreneurship-knowledge” [20].
Thus, among all factors of production, the greatest value added return was the knowledge that began to
be generated. This knowledge, in the economic interpretation of the key factor that allows generating
benefit over a long period of time by ensuring a company’s competitive edge, is the basis of intellectual
capital. This knowledge, combined with the potential of human skills, competencies, ideas, intuition,
professional experience, working methods and customer relationships, is called intellectual capital [20].
       The main purpose of this study is to analyze the existing possibilities for assessing the intellectual
capital of companies based on their reporting, which includes not only accounting and financial
statements, but also annual statements. The use of the entire aggregate of available reports for the
analysis makes it possible to form a unified approach to the study of the intellectual capital of companies
without using internal management reporting, which is often inaccessible for external evaluation
and is, in a sense, subjective. In this study, it is proposed to expand the analysis base by attracting
information and annual reports of a company.
       This approach will expand the basis for assessing the intellectual capital of an enterprise, obtain
information for a balanced assessment of individual elements and assess the attention that the
company’s management pays to the management of intellectual capital. Taken together, all this makes
it possible to give a balanced assessment of intellectual capital and assess how much the company’s
results coincide with the way the company organizes intellectual capital management.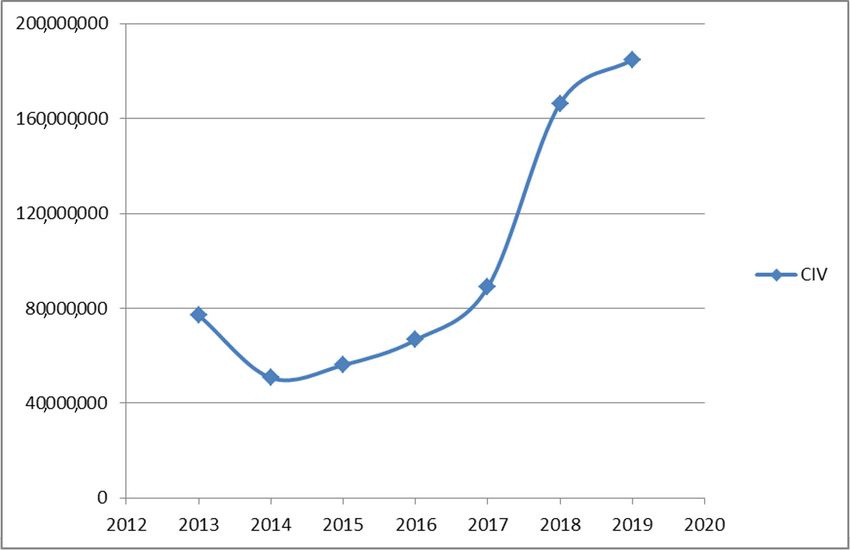
Sustainability 2020, 12, 7095                                                                         3 of 21

2. Literature Review and Hypothesis Development

2.1. The Concept and Essence of IC
     Intellectual capital (IC) is a complex economic concept consisting of two terms reflecting its features.
The leading concept in this phrase is capital. Capital is a complex economic concept, the phenomenon
of which is manifested in its constant movement and interaction with other factors of production [21].
Attempts to use a static approach for the concept of capital, as a rule, significantly narrow down its
understanding and do not reveal all the features of capital as an economic category [22].
     IC is a special type of capital, which, along with ordinary capital, has become one of the most
important factors of production since the late 1970s. The reason for this was the development of a
post-industrial society [23,24], which is characterized by the dominant role of theoretical knowledge
and the expansion of the service sector relative to the industrial sector. According to D. Bell, knowledge
is becoming the leading source of surplus value in post-industrial society, just as labor and capital
were the leading sources of surplus value in industrial society [25].
     In the modern sense, IC is an intangible asset involved in creating value together with other assets
by transforming them into other intangible resources, or into material resources in order to maximize
the current value of the company from the point of view of owners and stakeholders.
     In our opinion, the definition proposed in [26] is deeper, where the intellectual capital of a company
is understood as resources and abilities that are strategic in nature, difficult to imitate and affecting the
formation of unique capabilities of a company.
     IC, as a new factor in the development of the economy of companies, has several features that
make it unique. These features include the following:

•     intangible assets that form the basis of intellectual capital, unlike physical assets, do not have a
      material embodiment (it is important not to confuse tangible assets with their physical carriers,
      which allow them to be stored and used in activities), which means certain mechanisms are
      required for their effective use [3];
•     the elements forming intellectual capital have “partial exclusion” [3], which means there is an
      absence of mechanisms for complete control as well as for ensuring certainty and the protection of
      the company’s intellectual capital property rights, which leads to the problem of accounting for
      these assets in corporate balance sheets;
•     non-marketability of elements of intellectual capital, which is due to their practical lack of
      tradability in the markets, and, as a consequence, the lack of a basis for assessing these elements,
      incomplete rights to these intellectual assets as well as high market asymmetry (this factor also
      causes a higher vulnerability for companies with a high intellectual capital) [11].

     In addition to the features discussed above, the authors would like to note several features
that, as a rule, are not considered by researchers. In the modern concept of the resource approach,
the resource advantage is ensured, first, in the advantage in intellectual resources (the importance of
the advantage in material resources decreases due to the expansion of access to the most advanced
equipment and technologies and the development of telecommunication technologies). Other notably
features are:

•     the duality of the nature of intellectual capital, which is due to the fact that, from the point of
      view of the resource concept, it acts on the one hand as a resource (factor), and on the other hand,
      as an “organizational ability” (how the IC is structured, ordered and involved in the company’s
      activities), which solves the problem of not only efficient production, but also the problem of
      effective reproduction (both conventional and extended) [27,28];
•     the need to solve problems of not only production but also reproduction (including extended) leads
      to the emergence of conflicting requirements for intellectual capital, its structure and individual
      elements, for example, to the composition and characteristics of the company’s personnel [27,28];
Sustainability 2020, 12, 7095 4 of 21
• high uncertainty in the lifespan of certain elements of intellectual capital, which, on the one hand,
is due to the high information asymmetry between those who use intellectual capital and those
who try to copy it, and on the other hand, the rapid obsolescence of elements of intellectual capital,
that is, there are no clear criteria for determining the time during which an element of intellectual
capital retains its advantages.
In this regard, it is obvious that the disclosure of information about a company’s intellectual capital
reduces uncertainty and helps to increase investor confidence. This can explain the success of such a
tool for working with IC as Edvinson’s “Scandia Navigator” [9], which, acting as an innovation, allows
external agents to reduce the degree of uncertainty. At the same time, we would also like to note that
in the future will be impossible to exclude manipulations with indicators and indicators of intellectual
capital. The lack of standards for measuring and presenting information about intellectual capital to
external users can lead to the temptation of manipulating data about it, as has already happened in the
field of financial capital (Here it is appropriate to recall the examples of the firms Enron and Marconi).
The IC category is a generally recognized term for intangible and intangible assets involved in
creating a company’s value together with other assets by transforming them into other intangible
resources, or into tangible resources in order to maximize the company’s current value from the point
of view of owners and stakeholders. It is the use of such assets in the process of value creation that
transforms intangible and intangible assets into capital. This, during its circulation, leads to the creation
of additional value in a company through the creation of value for owners and stakeholders.
The above features bring the task of managing IC to the fore in the company’s management
system. However, in order to manage intellectual capital, it is necessary to solve a few fundamental
problems, which include the following:
• Building a system for measuring IC and its elements in a company, consistent with its
development strategy;
• Development of models of the relationship between the value of the IC and its elements and
the performance of the company (in this case, it is necessary to consider the correlation between
individual elements within the IC);
• Development of a system of factors and drivers (levers), impact on the value of IC;
• Development of specific mechanisms and technologies for managing the level of IC and its
elements in the company;
• Development of IC management policies and programs, consistent with the company’s
development strategy, representing the basic rules and principles, as well as coordinated activities
such as research and development, linked in place, time and resources, which should lead to the
achievement of certain goals in the company’s activities and development;
• Integration of the developed management policy and programs into the company’s management
system, control of the implemented measures in the field of IC management;
• Development of effective and adequate methods of ensuring communication with stakeholders
regarding the disclosure of the results and intentions of the company’s management in terms of
management and development of IC.
From the problems listed above, it becomes clear that IC management in a company should be
purposeful and systematic, i.e., represent regular management. At the same time, as practice shows,
there is still a deep chasm between the recognition of intellectual capital as the most important category
and object of management in modern company management and the development of specific methods,
technologies, policies and management programs. In [29], the author compares the IC of a company
with the underwater part of an iceberg. In addition, unfortunately, we have not yet fully explored this
underwater part.
The current structure of intellectual capital usually includes three main elements: human capital
(HC), structural capital (SC) and relational capital (RC).Sustainability 2020, 12, 7095 5 of 21
There are other types of classification of IC elements, which in one direction or another expand
the classification of IC. At the same time, if we compare the structure of the IC and the formal model
of the value chain, it will become obvious that these structures are not fully correlated with each
other. So, for example, human capital, as one of the most important elements of IC, is barely reflected
in the value chain; moreover, value creation networks, as more complete models of the process of
creating value in a company in their modern known form, do not contain value creation cycles for
personnel of a company. We understand that personnel (employees)are one of the most important
stakeholders, are suppliers of resources such as labor, which is one of the most fundamental factors for
a company’s existence and its ability to create added value; finally, personnel are a bearer of knowledge
and skills, an element of intellectual capital. Thus, using the example of human capital, we see that to
evaluate it will obviously require a rather complex system of indicators that should evaluate it from
various angles.
At the same time, within the framework of the approaches available, other stakeholders, such as
suppliers, government authorities and public organizations, are included in the value chains or
networks, and then it becomes necessary to use a value creation network, based on which a network of
costs for the production of a specific type of value can be formed. The network or value chain provides
insight into how elements of intellectual capital are incorporated. Thus, it becomes possible to evaluate
IC [11].
It is important to note that the purpose of a company’s activities in relation to stakeholders is to
create value, in relation to owners to ensure the growth of shareholder value is not lower than the
required level and in relation to itself to ensure a safe state of operation, in which the growth in value
plays a leading role. In this regard, quite extensive research is currently aimed at studying the impact
of intellectual capital, as well as its components, on the value of companies [26,27,30].
In these studies, it is possible to find a stable positive multiplicative relationship between the
elements of IC and the performance of companies. However, this result often depends on the chosen IC
assessment model, the considered markets and regions in which the companies operate as well as their
industry affiliation [31]. In addition, econometric studies have not yet fully answered the question of
how investment in IC elements and returns are related. Often, in order to make a decision, we need to
be confident that the returns must be increasing in nature, but there is not enough research on this yet.
2.2. Methods for Assessing the IC of Enterprises
Currently, several approaches have been formed to assess the level of a company’s intellectual
capital. The systematization of methods for assessing a company’s IC is presented in the works of D.
Luiti, M. Williams, M. Ruus [11,32,33]. Currently, there are five groups of methods for assessing IC at
the micro level:
• Return on Assets Methods, ROA [34–39];
• Market Capitalization Methods, MCM [34,36]
• Direct Intellectual Capital Methods, DICM [40–44];
• Balanced card techniques, SC [8,9,45–47].
• Proper Measurement Systems, MS [11].
The application of most methods requires the use of accounting, financial statements, as well as
confidential information about the company’s activities. In addition, some methods require different
market metrics to be used to determine risk-free rates, industry average beta, industry average
profitability levels, etc., which vary greatly by market type and current economic environment.
Currently, another method for assessing the company’s intellectual capital has been developed,
which consists in conducting content analysis of the company’s annual or integrated reports. The same
category includes methods for analyzing information from external sources—company websites,
speeches of officials and top managers, analysis of the number of shares, etc.Sustainability 2020, 12, 7095 6 of 21
2.2.1. VAIC Intellectual Capital Assessment Method
The Value Added Intellectual Coefficient (VAIC™) method is the most common method for
assessing and measuring IC, which is widely used by many scientists and practitioners in IC
research [48–50].
In [11,51,52], the following advantages of the VAIC™ method for assessing IC are noted, namely:
1. VAIC is simple and straightforward for measuring IC value.
2. The VAIC method is distinguished by the presence of detailed links between the company’s
operations, the resources used and the financial result.
3. The calculation of the VAIC™ indicator can be performed based on the information of the
corporate financial report; in addition, it does not require the use of specific market indicators
and significant transformations of indicators.
4. The VAIC™ method is more objective than other assessment methods because the data and results
used are easy to verify.
5. VAIC™ allows cross-comparison because other measurement methods require both financial and
non-financial estimates, which can sometimes be subjective.
6. The VAIC™ method can be used to measure IC and organize activities in all types of industries.
These features have led to a widespread use of the VAIC method for measuring and evaluating IC.
Using this method, the influence of IC on the value, sustainable growth, and the cost of equity capital
of companies in various industries is studied [53–60].
The idea of the method is that, according to the author, the creation of benefit in a company
is determined by two components: physical capital and IC [39]. Therefore, the efficiency of benefit
creation will be determined by the efficiency of the use of physical (or involved) capital (CEE) and the
efficiency of IC (ICE). ICE itself is composed of Human Capital Efficiency (HCE) and Structural Capital
Efficiency (SCE). ICE is the simple sum of these three efficiencies.
At the same time, despite its widespread use, some authors point out that it is not always possible
to find a relationship between IC indicators and the market value of a company [30,61].
In addition, the disadvantages of VAIC include the fact that it does not consider the traditional
third component of IC—relational capital. Many researchers believe that the missing relational
capital component in VAIC is the reason for the inconsistency of IC research results using this VAIC
method [62].
The development of the VAIC methodology is currently a modified MVAIC model, in which
the coefficient of efficiency of using relational capital RCE is added [51,63]. According to the MVAIC
model, ICE will have three components: HCE, SCE and RCE. At the same time, the use of the MVAIC
model requires the involvement of additional information about the company’s activities, which is
not always adequately reflected in the financial statements; therefore, the MVAIC model is much less
common than the VAIC. In this study, we also used the VAIC model.
2.2.2. Method for Assessing Intellectual Capital Using the CIV Indicator
Calculated Intangible Value (CIV) is a scheme developed by Thomas Stewart in 1997 to help
investors and company management assess the value of knowledge-intensive companies and increase
interest in intellectual capital [64]. This calculation method assumes that investments in physical assets
can bring only the average industry income, and everything that the company receives in excess of it is
due to the competent use of its intangible assets. An increase in the CIV indicator over time indicates a
company’s ability to generate income in the future, and vice versa, a decrease in the indicator indicates
that investments in intangible assets or structural changes in the company do not pay off [65]. Among
the advantages of this method, researchers note the simplicity of calculations and the availability of
data, which can be obtained directly from the annual reports of public companies on official websites.
In addition, the indicator is suitable for both intra-industry and inter-industry comparisons [66].Sustainability 2020, 12, 7095 7 of 21
The disadvantages of this method include the following [66]:
First, within the framework of this method, intangible assets are not disaggregated and not
separated; for example, it does not separate the physical and financial assets of the company.
Secondly, the method is based on the return on assets indicator, which can be overestimated,
underestimated or negative for some companies.
Third, the key idea of the method is that only companies with a profitability higher than the
industry average have intellectual capital, but in some, especially knowledge-intensive, industries,
even medium-sized companies have intellectual capital, so estimates can be significantly biased.
The method, in addition to the company’s financial statements, requires the use of specific market
and economic indicators, which complicates the calculations.
To overcome these shortcomings, in [66], a modified model for assessing IC based on the return
on net assets is proposed. In this model, the part of the cost that exceeds the industry average return
on the company’s net assets and is capitalized over an infinite time interval at the weighted average
rate of capital costs, which acts as an assessment of the IC.
2.2.3. Method for Assessing Intellectual Capital Using Content Analysis of Annual Reports
Expanding the range of approaches and methods used to analyze IC companies is important.
This makes it possible to expand both the initial empirical base for assessment and to present a broader
system of working with intellectual capital in a company for stakeholders.
One of the promising methods for changing the intellectual capital of companies is a method based
on content analysis of annual reports and integrated reporting of companies [67–69]. This approach
differs from the well-known approaches based on financial information because there is no unified
methodology for presenting and disclosing information about the intellectual capital of companies and
its elements in the annual reports and integrated reports of companies. In modern reports, there is
no corresponding section dedicated to the management of intellectual capital. At the same time, it is
obvious that management understands the importance of using annual reports as a communication
channel with stakeholders and uses this channel to disclose information about their company’s IC.
The study of a company’s IC based on content analysis of annual and integrated reports of the
company is based on the measurement of IC elements and its value as a whole based on the frequency
of disclosure of certain components in the texts of the above documents.
From a methodological point of view, the types of content analysis that are currently used to
study various socio-economic aspects are divided into two approaches depending on the methods for
registering counting units.
The first approach is based on calculating the facts of disclosure of certain accounting units.
When a unit is found in the text, the search stops. In this case, the information disclosure indices act
as a quantitative assessment, as the ratio of disclosed counting units to the total number of counting
units that are searched for in the text [70–74]. In this approach, information items are only used once.
At the same time, this approach, called the “virginity principle” or “appearance approach” of counting
information, does not allow us to assess the importance of a counting unit that is conveyed in the
analyzed document.
The second approach is based on counting the number of mentions of certain accounting units.
Many researchers point out that the amount of disclosure is important, as it shows the importance of a
category [75–78]. In the opinion of these researchers, volumetric analysis is a completely acceptable
research method, which allows you to reveal the importance of information.
In addition, in content analysis, approaches are distinguished based on the calculation of various
transcoding units. These can be words, sentences or paragraphs. Obviously, the category of text, as a
single element, cannot be used in the content analysis of annual and integrated reports due to the wide
variety of topics covered, as well as its rather large volume. Regarding the use of different recoding
units, each of the approaches has its own advantages and disadvantages [68,75]. Thus, the use of
words (or phrases) as a transcoding unit does not always allow us to accurately determine whetherSustainability 2020, 12, 7095 8 of 21
it belongs to a particular category. On the other hand, the use of sentences or paragraphs requires
considering the multiple forms of content, and, as a result, the use of special analytical procedures that
would allow for separating these topics. This, in turn, can also lead to certain errors when calculating
in an automatic way. In any case, the choice of the transcoding unit remains with the researcher,
the fundamental point is that all the basic rules, conditions for transcoding, as well as dictionaries or
categories and subcategories of transcoding are strictly disclosed in the study. All this will allow us in
the future to increase the comparability and reliability of the results obtained, as well as to choose the
most adequate options for the content analysis method.
It is believed that reflecting information about IC in annual reports, as well as in integrated
reports, will help with the management and control of company knowledge, as it shows stakeholders
how and with what efforts a company develops its intellectual capital [79,80]. Placing information
about IC in the annual reports of companies is one of the key channels of voluntary disclosure for
stakeholders [81–83]. However, in the total number of studies, the use of the content analysis method
of annual reports for IC research is much less common than research using other methods, for example,
methods based on the analysis of the financial statements of companies.
Several studies have found results showing that content analysis in annual reports is
dominated by information from relational capital (RC), reflecting the prevailing value for
shareholders [69,70,75,82,84–86]. Comparable RC disclosures in research are evident, showing that
companies around the world agree that RC information is strategically more important than HC and
SC. Some prominent IC categories that may reflect the importance of adding value to companies
are information about customers, employees, community, director skills, distribution channels and
business partners [87].
Using content analysis, quantitative estimates of the intellectual capital ICR and its structural
elements—human capital resources (HCR), structural capital resources (SCR) and relational capital
resources (RCR)—were obtained.
2.3. Intellectual Capital of Trading Companies
The trade sector in the Russian Federation belongs to a group of traditional sectors of the economy
with a relatively low level of intangible assets and innovations. Currently, its share of national trading
activity in GDP is 16.7%, the average annual number of employees is 18.5%, investments in fixed
assets are 4.3% and the share of tax payments is 11.1%. The modern trade sector in Russia is one of
the most stable sectors of its national economy. Comparative analysis of GDP growth rates and retail
trade turnover over the past ten years allows us to conclude that the trade industry as a whole is
characterized by relatively higher growth rates compared to GDP [88]. Moreover, trade is characterized
by high levels of growth in gross added value compared to other sectors of the economy.
Retail trade is one of the branches of the economy that is highly dependent on knowledge [89].
Because retail trade is an element of the commodity-producing system, it does not create a product itself;
therefore, there are practically no product innovations in retail trade. At the same time, such factors of
success in retail trade as simplicity, level of personnel costs, overhead costs, supply chains, costs and
online channels come to the fore [90].
These key success factors rely heavily on a good knowledge management system, human capital
and customer relationships that are part of the IC components to help retailers effectively manage their
assets and knowledge to achieve these factors. For this reason, IC is also important for retail businesses.
Another important aspect of the activities of modern companies is the expansion of external
communication channels with stakeholders. One of these channels is a company’s annual reports,
where management presents the results and future vision of its strategy. Since IC has a strategic
importance in a company’s activities, considerable attention is paid in the annual reports to the
disclosure of information on the results and prospects of managing IC for trading companies.
However, studies that would include a comprehensive analysis of IC trading companies based on
financial and non-financial information are rare. As a rule, IC research is carried out based on financialSustainability 2020, 12, 7095 9 of 21
statements [52,91], or based on non-financial information, for example, analysis of annual or integrated
reports [67,70,87].
Sustainability 2020, 12, x FOR PEER REVIEW 9 of 21
2.4. Key Research
2.4. Key Research Hypotheses
Hypotheses
The
The purpose
purpose of of this
this study
study is is to
to quantify
quantify the
the value
value ofof the
the intellectual
intellectual capital
capital of
of aa trading
tradingcompany,
company,
as
as well as its components, and to identify the influence of the size and structure of intellectual capital
well as its components, and to identify the influence of the size and structure of intellectual capital
on
on the
the results
results of of aa company’s
company’s business.
business. Calculations
Calculations were
were performed
performed using using alternative
alternative methods
methods forfor
assessing IC.
assessing IC.
The
The research
research method
method is is aa combined
combined one, one, which
which includes
includes thethe use
use ofof three
three different
different measurement
measurement
methods
methods forfor assessing
assessing IC: IC: VAIC,
VAIC,CIV CIVandandcontent
contentanalysis
analysis(CA).
(CA).
The
The empirical
empirical base baseof ofthe
thestudy
studyisisthe
thefinancial
financialand
andannual
annual statements
statements of of
a company
a company operating
operatingin
the retail
in the sector
retail in the
sector Russian
in the Russian Federation,
Federation,as well as information
as well as information from the the
from statestate
statistics bodies
statistics of the
bodies of
Russian Federation and from the ratings and analytical agency
the Russian Federation and from the ratings and analytical agency Bloomberg. Bloomberg.
Research
Research hypothesis:
hypothesis: ititwas wasassumed
assumedthatthatthere
thereare
arepositive
positive relationships
relationships between
between thethe
amount
amount of
aofcompany’s
a company’s intellectual
intellectual capital
capitalusedused
and and
the efficiency of itsof
the efficiency financial activities,
its financial the company’s
activities, value
the company’s
as well as the level of information disclosure about IC in the company’s
value as well as the level of information disclosure about IC in the company’s annual reports. annual reports.
Several
Several hypotheses
hypotheses were were considered
considered in in the
the work.
work. The
The general
general scheme
scheme of the research
of the research hypotheses
hypotheses
proposed
proposed in in the
the work
work is is shown
shown in in Figure
Figure 1.
1. All
All hypotheses
hypotheses werewere divided
divided into
into 55 groups.
groups.
H5
VAIC ICR
CEE HCR
HCE SCR
SCE RCR
H1
H2 H4
H3
ROA ROE
EVA CIV
Figure 1. General scheme of research hypotheses.
Figure 1. General scheme of research hypotheses.
The first group of hypotheses consisted of assessing the impact of intellectual capital and its
The firstcalculated
components, group of using
hypotheses consisted
the VAIC and CA ofmodels,
assessing
on the
the impact of assets.
return on intellectual capital and its
components, calculated using the VAIC and CA models, on the return on assets.
Hypothesis (H1). IC
Hypothesis 11 (H1). IC and
and its
its components
components have
have aa significant
significant positive
positive impact
impact on
on the
the return
return on
on assets.
assets.
H1 included
Hypothesis H1 included four
four particular
particular hypotheses:
hypotheses:
Hypothesis 1.1 (H1.1). The elements of intellectual capital calculated using the VAIC model have a significant
Hypothesis 1.1 (H1.1). The elements of intellectual capital calculated using the VAIC model have a significant
positive impact on the return on assets.
positive impact on the return on assets.
Hypothesis 1.2 (H1.2). VAIC has a significant positive impact on the return on assets.
Hypothesis 1.2 (H1.2). VAIC has a significant positive impact on the return on assets.
Hypothesis 1.3 (H1.3). The structural elements of intellectual capital HCR, SCR and RCR, calculated using
CA, have a significant positive impact on the return on assets.
Hypothesis 1.4 (H1.4). ICR, calculated using CA, has a significant positive impact on the return on assets.Sustainability 2020, 12, 7095 10 of 21
Hypothesis 1.3 (H1.3). The structural elements of intellectual capital HCR, SCR and RCR, calculated using
CA, have a significant positive impact on the return on assets.
Hypothesis 1.4 (H1.4). ICR, calculated using CA, has a significant positive impact on the return on assets.
ROA = a0 + a1 · HCE + a2 · SCE + a3 · CEE + ε;
ROA = a0 + a1 · VAIC + ε;
(1)
ROA = a0 + a1 · HCR + a2 · SCR + a3 · RCR + ε;
ROA = a0 + a1 · ICR + ε.
The second group of hypotheses consisted of assessing the impact of intellectual capital and its
components, calculated using the VAIC and CA models, on the return on equity.
Hypothesis 2 (H2). IC and its components have a significant positive impact on the return on equity.
Hypothesis H2 included four particular hypotheses:
Hypothesis 2.1 (H2.1). The elements of intellectual capital calculated using the VAIC model have a significant
positive impact on the return on equity (ROE).
Hypothesis 2.2 (H2.2). VAIC has a significant positive impact on the ROE.
Hypothesis 2.3 (H2.3). Structural elements of intellectual capital HCR, SCR and RCR, calculated using CA,
have a significant positive impact on the return on assets.
Hypothesis 2.4 (H2.4). ICR calculated using CA has a significant positive impact on the return on assets.
ROE = a0 + a1 · HCE + a2 · SCE + a3 · CEE + ε;
ROE = a0 + a1 · VAIC + ε;
(2)
ROE = a0 + a1 · HCR + a2 · SCR + a3 · RCR + ε;
ROE = a0 + a1 · ICR + ε.
The third group of hypotheses was to assess the relationship between intellectual capital and its
components, calculated using the VAIC and CA models and the assessment of intellectual capital,
performed using the CIV model.
Hypothesis 3 (H3). IC and its components have a significant positive effect on CIV.
Hypothesis H3 included four particular hypotheses:
Hypothesis 3.1 (H3.1). The elements of intellectual capital calculated using the VAIC model have a significant
positive impact on CIV.
Hypothesis 3.2 (H3.2). VAIC has a significant positive effect on CIV.
Hypothesis 3.3 (H3.3). The structural elements of intellectual capital HCR, SCR and RCR, calculated using
CA, have a significant positive impact on CIV.
Hypothesis 3.4 (H3.4). ICR, calculated using CA, has a significant positive impact on CIV.Sustainability 2020, 12, 7095 11 of 21
CIV = a0 + a1 · HCE + a2 · SCE + a3 · CEE + ε;
CIV = a0 + a1 · VAIC + ε;
(3)
CIV = a0 + a1 · HCR + a2 · SCR + a3 · RCR + ε;
CIV = a0 + a1 · ICR + ε.
The fourth group of hypotheses was to assess the impact of intellectual capital and its components,
calculated using the VAIC and CA models, on the growth of the company’s value (EVA).
Hypothesis 4 (H4). IC and its components have a significant positive impact on the growth of a company’s value.
Hypothesis H4 included four particular hypotheses:
Hypothesis 4.1 (H4.1). Elements of Intellectual Capital calculated using the VAIC model have a significant
positive impact on the growth of company value.
Hypothesis 4.2 (H4.2). VAIC has a significant positive impact on a company’s value growth.
Hypothesis 4.3 (H4.3). The structural elements of intellectual capital HCR, SCR, RCR, calculated using CA,
have a significant positive impact on the growth of a company’s value.
Hypothesis 4.4 (H4.4). ICR, calculated using CA, has a significant positive impact on the growth of
company value.
EVA = a0 + a1 · HCE + a2 · SCE + a3 · CEE + ε;
EVA = a0 + a1 · VAIC + ε;
(4)
EVA = a0 + a1 · HCR + a2 · SCR + a3 · RCR + ε;
EVA = a0 + a1 · ICR + ε.
Additionally, the study formulated hypotheses designed to test the presence of a relationship
between the structural elements of IC, determined by VAIC and CA methods, as well as between
the indicators of intellectual capital, which were assessed using the VAIC, CIV and CA methods.
These hypotheses were formulated in order to determine the presence of a relationship between the
involved IC value and the level of its disclosure.
Hypothesis H5 included three particular hypotheses:
Hypothesis 5.1 (H5.1). The level of disclosure of human capital in annual reports reflects the level of human
capital involvement in creating benefit.
Hypothesis 5.2 (H5.2). The level of disclosure of structural capital in the annual reports reflects the level of
involvement of structural capital in the creation of benefit.
Hypothesis 5.3 (H5.3). The level of IC disclosure in the annual reports reflects the level of IC involvement in
creating benefit.
HCR = a0 + a1 · HCE + ε;
SCR = a0 + a1 · SCE + ε; (5)
ICR = a0 + a1 · VAIC + a2 · CIV + ε;Sustainability 2020, 12, 7095 12 of 21
3. Methodology
3.1. Initial Data
The research used the annual and financial statements of a trading company operating on the
Russian market as the initial data. Since historically the creation of companies in the form of joint stock
companies, which obligatory submit annual reports, began not so long ago, systematic data for 7 years
were available. In addition, we were able to calculate the CIV index for the previous 9 years.
3.2. Variables
3.2.1. Dependent Variables
Guided by various works [49,51,54], return on assets (ROA) and return on equity (ROE) are
usually used to measure financial results.
ROA measures the efficiency of companies in using total assets and is calculated by dividing net
income by average total assets.
ROE is the return to shareholders of ordinary shares and is calculated by dividing net income by
the average share capital.
The CIV is the discounted weighted average cost of capital amount of the future residual operating
income generated by the intangible assets of a company over an infinite period. In this context, CIV is
an assessment of the IC generated by a company because of strategic development.
The method for calculating the CIV indicator includes the following steps:
1. For a series of data over several years, smoothing is performed (with a moving average of over
3 years);
2. The pre-tax income of the company (Earnings Before Interest and Taxes, EBIT) (smoothed data)
is calculated;
3. The moving average of tangible assets TA is calculated;
4. The moving average of intangible assets IA is calculated;
5. The return on assets of the company is calculated;
6. The industry average return on assets is calculated;
7. Excess income is calculated as the difference between the pre-tax income of the enterprise and the
income of the assets of the enterprise, calculated according to the average industry profitability
(6). The formula only works if the company’s return on assets is higher than the industry average
return on assets.
If ROAcomp > ROAind , then the CIV is calculated as:
∞ (EBIT − TA × ROA
ind(i) ) × (1 − t)
X
CIV = . (6)
WACC
i=1
In the case of an infinite period of capitalization of intellectual capital, it is simplified to the
following form:
∞
X REOIi REOI
CIV = = (7)
WACC WACC
i=1
where: WACC—weighted average rate of company capital costs; t—income tax rate; A—depreciation.
Economic value added (EVA) is the amount of profit that remains at the disposal of the company
for the reporting period, taking into account all economic and opportunity costs of capital employed.
Traditionally EVA is an indicator of the growth of the company’s value. In this work, EVA was
calculated using the expression:
EVA = (NOPAT − IC) ∗ WACC. (8)Sustainability 2020, 12, 7095 13 of 21
3.2.2. Independent Variables
1. VAIC and its three components—CEE, HCE and SCE—are used as independent variables.
VAIC calculation procedures are as follows:
VAIC = HCE + SCE + CEE, (9)
where: HCEshows how effectively human capital is used (equal to the ratio of value added and labor
costs); SCE shows how effectively organizational capital is used (equal to the ratio of value added
minus human capital and value added); CEE shows how effectively used capital is used.
The individual components of the VAIC were calculated as follows:
HCE = VA/HC, (10)
where: VA—value added; HC—human capital, measured by the wages of all workers.
SCE = SC/VA. (11)
where: SC—structural capital measured by the difference between VA and HC.
CEE = VA/CE. (12)
where: CE—the capital employed book value of net tangible assets of the company.
The value added in expressions (9)—(11) was calculated using the following expression:
VA = C + D + A + OP, (13)
where: C—company employee salary; D—depreciation; A—depreciation; OP—operating profit.
2. Assessments of IC and its components were carried out using content analysis.
The content analysis of the annual reports was carried out by counting the number of words
and phrases used in relation to three subcategories of intellectual capital—human capital HCR,
structural capital SCR and relational capital RCR. As an indicator reflecting the level of disclosure
of IC and its components, the number of mentions of words and phrases revealing subcategories
of intellectual capital was considered in total for human capital—22 subcategories, for structural
capital—18 subcategories, for relational capital—21 subcategories. The composition of the subcategories
was taken from [70]. For each mention of a word or phrase, 1 point was assigned. The number of
points was presented as the disclosure rating.
4. Empirical Results
Before proceeding to the description of the results of the constructed models and testing of
hypotheses, let us consider the results of the assessment of the IC, performed by various methods.
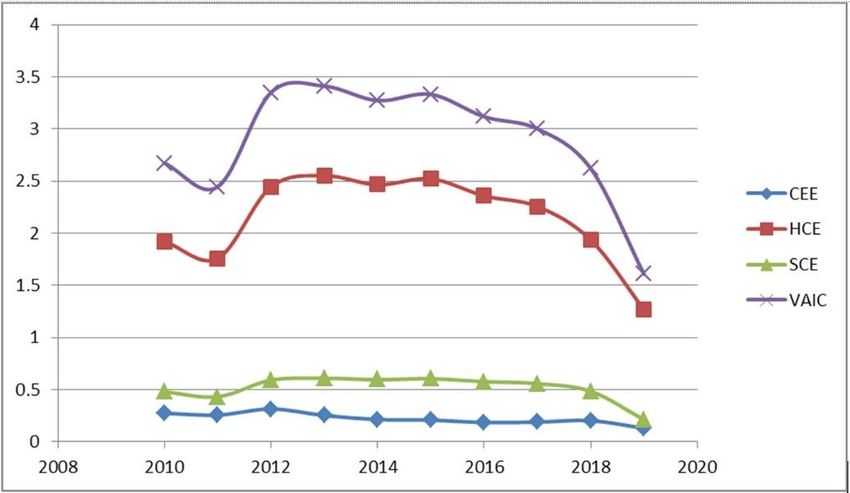
On Figure 2, the results of the IR calculation by the VAIC method are presented.
Figure 3 shows the results of calculating the IC by using the CIV method.
In Figure 4, the results of calculating the IC by the content analysis method are presented.
From the presented results, it can be seen that the VAIC and CA methods reflect the ratio of the
IC elements in different ways. According to the VAIC, most of the IC is formed at the expense of the
human capital efficiency indicator HCE, which gives about 75% of the contribution to VAIC.
For the CA model, a different picture is observed. Here, HCR human capital takes the smallest
position for IC elements, and structural and relational capitals take the largest position. The use of
content analysis in [5] showed that relational capital takes a significant position, then human capital
and structural capital. According to the authors, the significant role of relational capital in annualcapital
was was considered
presented in totalrating.
as the disclosure for human capital—22 subcategories, for structural capital—18
subcategories, for relational capital—21 subcategories. The composition of the subcategories was
taken
4. from [70].
Empirical For each mention of a word or phrase, 1 point was assigned. The number of points
Results
was presented as the disclosure rating.
Before proceeding to the description of the results of the constructed models and testing of
hypotheses,
Sustainability
4. Empirical2020,let
12,us consider the results of the assessment of the IC, performed by various methods.
7095
Results 14 of 21
On Figure 2, the results of the IR calculation by the VAIC method are presented.
Before proceeding to the description of the results of the constructed models and testing of
hypotheses,
reports is becauselet us consider the
a company results
uses ofdemonstrate
this to the assessment
to of the IC, performed
investors its attitudeby variousvarious
towards methods.
groups
On Figure 2, the results of the IR calculation by the VAIC method are presented.
of stakeholders.
Figure 2. Dynamics of intellectual capital (IC) indicators calculated by the Value Added Intellectual
Coefficient (VAIC) method.
Figure 2. Dynamics of intellectual capital (IC) indicators calculated by the Value Added Intellectual
Figure 3
Figure 2. shows
Dynamics
theofresults
intellectual capital (IC)the
of calculating indicators calculated
IC by using by the
the CIV Value Added Intellectual
method.
Coefficient (VAIC) method.
Coefficient (VAIC) method.
Figure 3 shows the results of calculating the IC by using the CIV method.
Sustainability 2020, 12, x FOR PEER REVIEW 14 of 21
In Figure
Figure
Figure4,3.the
3. Dynamics results
Dynamics of
of theofICcalculating
indicator
the the IC by
calculated
IC indicator the
using
calculated content
the
using analysis
Calculated
the method
Intangible
Calculated are (CIV)
Value
Intangible presented.
Value (CIV)model.
model.
Figure 3. Dynamics of the IC indicator calculated using the Calculated Intangible Value (CIV)
model.
Figure 4. Dynamics of IC indicators calculated by the method of content analysis.
From the presented results, it can be seen that the VAIC and CA methods reflect the ratio of the
IC elements in different ways. According to the VAIC, most of the IC is formed at the expense of the
human capital efficiency indicator HCE, which gives about 75% of the contribution to VAIC.
For the CA model, a different picture is observed. Here, HCR human capital takes the smallest
position for IC elements, and structural and relational capitals take the largest position. The use of
content analysis in [5] showed that relational capital takes a significant position, then human capitalSustainability 2020, 12, 7095 15 of 21
From Table 1, the average VAIC value is 2.908, which means that the trading company managed
to create an added value of 2.908 rubles for every 1 ruble invested in the company. The descriptive
statistics also show that HCE is the most influential component in creating added value for retailers,
with an average of 2.2 rubles. In addition, this study also yields a result that is consistent with the
proposed theory in the IC literature, which states that IC or intangible assets create greater added
value for companies compared to tangible assets, which can be shown by the average CEE score
(0.196) [49,51]. The contribution of the individual components is almost the same as the contribution of
the individual elements of IC and physical capital in a study of retailers in Indonesia.
Table 1. Descriptive statistics of models.
Index N Minimum Maximum Mean Std. Deviation
VAIC 7 1.6073 3.4108 2.9087 0.6313
HCE 7 1.7582 2.5512 2.2882 0.3164
SCE 7 0.2110 0.6080 0.5189 0.1423
CEE 7 0.1289 0.2516 0.1964 0.0370
HCR 7 141 333 256.7143 61.3262
RCR 7 545 1121 858.8571 168.6154
SCR 7 321 1054 606.2857 251.4304
ICR 7 1007 2508 1721.8571 453.2440
ROA 7 0.105 0.154 0.131 0.019
ROE 7 −0.025 1.497 0.687 0.501
CIV 7 5.069 × 10⁷ 1.848 × 10⁸ 9.866 × 10⁷ 5.432 × 10⁷
EVA 7 −4.127 × 10⁶ 7.173 × 10⁶ 7.968 × 10⁵ 4.440 × 10⁶
The results of the analysis of the obtained models are presented in Table 2. It presents the results
of analysis of variance of models, as well as analysis based on criterion and linearity.
Table 2. Results of analysis of models for testing hypotheses of the study.
Model F-Test R Sqare Multiple R Result
H1.1 0.08257016 0.862869427 0.928907653 Not statistically significant
H1.2 0.013151988 0.738776204 0.859520915 Accepted
H1.3 0.226404486 0.722455417 0.849973774 Not statistically significant
H1.4 0.873152053 0.005614471 0.074929776 No model
H2.1 0.33829048 0.628433017 0.792737672 Rejected
H2.2 0.192143743 0.312369316 0.558900095 No model
H2.3 0.597868841 0.42282647 0.650251082 Not statistically significant
H2.4 0.463326439 0.111907883 0.334526356 No model
H3.1 0.038988383 0.917827065 0.958032914 Only SCE is statistically significant
H3.2 0.005584544 0.812157392 0.901197754 Temporary clustering is observed
H3.3 0.045263268 0.909062438 0.953447659 Only SCE is statistically significant
H3.4 0.555059769 0.07400878 0.272045548 No model
H4.1 0.334685493 0.631365049 0.794584828 Not statistically significant
H4.2 0.47846453 0.104933627 0.323934603 No model
H4.3 0.332485385 0.633156835 0.795711528 Not statistically significant
H4.4 0.052521476 0.561463952 0.749308983 Not statistically significant
H5.1 0.025669632 0.663501091 0.814555763 The free term is not statistically significant
H5.2 0.417061329 0.135225035 0.367729568 No model
H5.3 0.555941249 0.254385321 0.504366257 No model
The analysis of the results presented in the table allowed us to conclude that from all the hypotheses
of the study, the hypothesis of the relationship between VAIC and return on assets was statistically
confirmed. This model is:
ROA = 0.055 + 0.026 × VAIC. (14)Sustainability 2020, 12, 7095 16 of 21
In addition, for the hypothesis of the third group, the presence of a statistical relationship between
the indicator CIV and the structural capital, determined both by the VAIC model and by means of
content analysis, was obtained: the form of these models is presented below:
CIV = −18,096,414 + 72,827,205 × HCE − 558,695,710 × SCE + 1,222,451,506 × CCE. (15)
CIV = −15,289,541 + 573,821 × HCR − 306,027 × SCR + 177,195 × RCR. (16)
Models for the hypotheses of the fourth group were not confirmed.
Among the models of group 5, a model was confirmed that reflects the relationship between the
use of human capital in creating benefit and the level of disclosure of human capital in annual reports.
Model view:
HCR = −104.55 − 157.88 × HCE. (17)
5. The Discussion of the Results
Based on the results presented above, we will give a brief description of the presented results.
The first conclusion that can be drawn is the influence of IC on the profitability (profitability) of a
trading company. A statistically significant relationship was found between return on assets and VAIC
(model H1.2). This result agrees with the results obtained in [49,51]. At the same time, no statistically
significant relationship was found for individual VAIC components, which may indicate the instability
of the impact of human and structural capital on a company’s profitability. Thus, we can conclude that
investment in intellectual capital can lead to an increase in the return on assets. The growth in return
on assets per VAIC point is 0.026, i.e., about 2.6%, which is a high figure.
It should be noted that a sufficiently high relationship level was also found for the return on assets
and elements of intellectual capital, which are reflected in the annual reports (a high R2 was obtained).
In our opinion, this indicates that, overall, the company’s management adequately assesses the level of
development and the effectiveness of the return on the elements of IC, although this is not statistically
significant in nature.
The study of the relationship between the return on equity and IC elements, calculated both
by the VAIC model and reflected in the reports, did not reveal a statistically significant relationship.
Perhaps this is due to the fact that during the period under review, the company under study carried
out a fairly intensive market expansion, which led to sharp fluctuations in the capital structure and,
as a consequence, to significant fluctuations in the return on equity. Perhaps, observation on a wider
sample and a wider time interval will provide more significant results on the return on equity.
Interesting results were obtained for the third group of hypotheses. A stable statistical relationship
was revealed between the coefficient of intellectual value CIV and the value of structural capital.
Moreover, this relationship is an inverse one, i.e., an increase in structural capital (SCE and SCR) leads
to a decrease in CIV, i.e., to its destruction of the company’s intellectual value. At the same time, human
capital (HCE and HCR) in the H3.1 and H3.3 models and the RCR relational capital in the H3.3 model
have a more significant positive impact on CIV. This influence of structural capital on the formation of
the company’s intellectual value may be due to the fact that currently, institutional investors and asset
managers are focused on obtaining short-term profits (faster earnings per share), rather than long-term
profits. It also shows that they place more emphasis on innovation and growth than on investment.
This result is to some extent consistent with the results obtained in [52], where a statistically significant
inverse relationship between structural capital and company value was also revealed.
The study of the influence of the IC and its elements on the market value did not reveal any
connection between them. This result is consistent with research [91–93]. The reasons for this result
may be due, on the one hand, to the closeness of data on IC, which is confirmed by the results of this
study (the absence of relationships in the hypotheses of the fifth group). On the other hand, market
value is highly influenced by market sentiment and external factors such as risk aversion by investors
that make them ignore a company’s financial reality, even if it has improved its financial results.You can also read