Global Gateway for NSW: the - economic impact of a container terminal at the Port of Newcastle
←
→
Page content transcription
If your browser does not render page correctly, please read the page content below
December
2018

Global Gateway for NSW: the
economic impact of a container
terminal at the Port of Newcastle
Prepared by AlphaBeta for Port of Newcastle

Important Notice on Contents – Estimations and Reporting

This report has been prepared by AlphaBeta for Port of Newcastle. All information in this report is derived or
estimated by AlphaBeta analysis using both proprietary and publicly available information, other than CGE
modelling which was performed by Cadence Economics with input from AlphaBeta. Where information has been
obtained from third party sources and proprietary research, this is clearly referenced in the footnotes.

The values in this report are specified in cumulative, NPV terms at from 2018 to 2050, in 2018 dollars, unless
otherwise indicated.

                                                                                                    αlphaβeta | i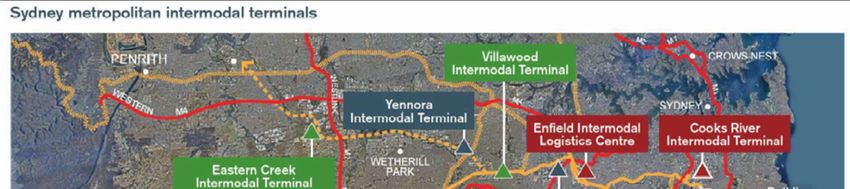
CONTENTS
Table of Contents
   1. Foreword .................................................................................................................................... 2
   2. Executive Summary .................................................................................................................... 5
   3. Generating savings in the Hunter and Northern NSW regions through a more efficient freight
      network…….……………………………………………………………………………………………………………….….……..7
   4. Savings for NSW consumers and businesses in a more competitive freight market…………..…18
   5. Improving liveability in Sydney by reducing pressure on infrastructure, congestion and
      pollution………………………………………………………………………………………………………..……..….…………23
   6. Regional sustainability - generating jobs and growth in regional NSW……………………..….…....35
   7. Appendix A – Detailed methodology……………………………………………………………….………….……….42
   8. Appendix B – Local Government Areas………………….…………………………………….…….………..….…..46
   9. Bibliography…………………………………………………………………………..…..…………………………….………..48

                                                                                                                                   αlphaβeta | ii
αlphaβeta | 1
1. Foreword
The New South Wales (NSW) and global trade picture has greatly changed over the past decade, and
the freight task is not the same as it was in 2013-2014, when Port of Newcastle was leased.
Australia’s freight task is the now the fifth largest in the world,1 and 97 per cent of Australia’s
imports and exports are seaborne.2 Consequently, it is critical to Australia’s economic performance
to have modern, highly-efficient and productive ports.

Transport for NSW projects the total state freight task and container freight will grow by 28 per cent
and 77 per cent respectively by 2036. Global containerisation continues to grow, with 2018 on track
to achieve 5.3 per cent growth. The number of “twenty-foot equivalent units” (TEU) handled by
Australia grew by 11.6 per cent to 8.0 million in the past year alone.

The imperative to move larger volumes of containerised goods at lower costs has driven, and
continues to drive, an increase in the size of vessels. This has resulted in infrastructure investments
in ports around the world to facilitate and attract the larger container vessels. With the widening of
the Panama Canal in June 2016, the major global shipping lines have changed their fleet mix. Pre-
2016, the container ship “workhorse” had a capacity of around 5,000 TEU.

The workhorse of industry now has a capacity of between 8,000 and 10,000 TEU and shipping lines
are moving to even larger 10,000-plus TEU vessels such as the Maersk Line E-3, carries 18,900 TEU.
The over-10,000 TEU vessels are reducing the slot prices (unit cost of transporting a container),
reducing the carbon footprint and making fleets smaller and easier to maintain and manage. The
larger vessels should cascade to so-called secondary lanes like those servicing Australia, however
existing port infrastructure limits the number, size, frequency and efficient handling of 10,000-plus
TEU vessels.

Currently, there are only two locations on the East Coast of Australia capable of handling the large
vessels – one berth in Melbourne and another at Port of Brisbane. Both ports have widely
acknowledged handling and land-side freight movement constraints. While Brisbane is the best
placed of the existing container ports to handle 10,000-plus TEU vessels, it will have to invest in land-
side improvement and dredging, and it is entirely reliant on trucks which create bottlenecks and
restrictions on truck access to the surrounding metropolitan roads.

Port of Newcastle plans to develop the only “New Panamax” container terminal (13,500-plus TEU
vessels) in Australia. The fully developed (stage 3) Newcastle Container Terminal (NCT) will be a fully
automated, 11 quay crane terminal with integrated intermodal and warehousing inside the port
boundary. This would allow shipping lines to send their larger vessels to Australia, reducing the
nation’s slot prices.

1
    OECD (2018)
2
    Deloitte (2013)

                                                                                            αlphaβeta | 2
Port of Newcastle will be able to offer multiple berths with a fully integrated, automated process
from wharf to warehouse, eliminating intermodal double-handling. The Port is uniquely positioned
to take advantage of this opportunity due to:
■ extensive land holdings;
■ existing heavy rail infrastructure with direct access to the waterfront;
■ direct access to major road and rail freight routes;
■ a channel that is only 47% utilised; and
■ a channel that can accommodate New Panamax vessels.
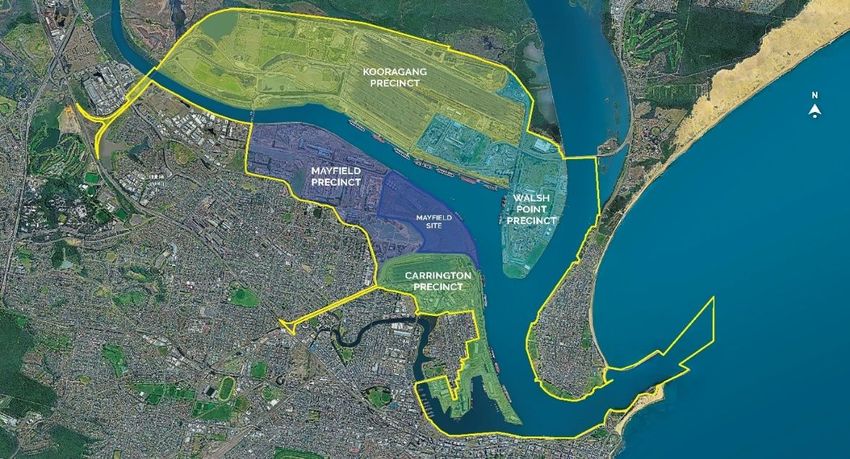
EXHIBIT 1: PROPOSED PLAN FOR CONTAINER TERMINAL
SOURCE: Port of Newcastle
Port of Newcastle is the largest coal port in Australia, exporting approximately 160 million tonnes of
coal per annum. It also handles fuel, grain, bulk cargo, liquids and project cargo. More recently, the
Port’s uses have evolved to match the changing face of the local economy, including opening a high-
tech naval shipyard.
Australia has five major container ports, at Brisbane, Sydney (Botany), Melbourne, Adelaide and
Fremantle. In New South Wales, Port Botany handles containers, Port Kembla handles cars and steel
and Port of Newcastle handles coal, wheat and fuels. Botany and Kembla are co-owned. Port of
Newcastle is limited in how many containers it can facilitate, based on a penalty system.
αlphaβeta | 3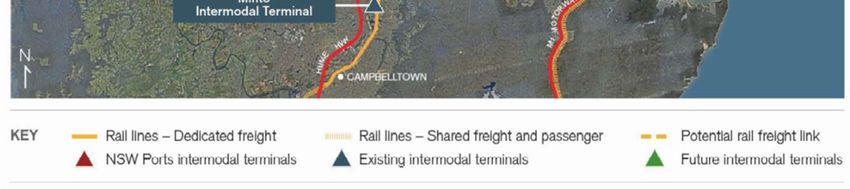
EXHIBIT 2

    Australia has five major container ports spread around the coastline

                                                                       Brisbane

      Fremantle
                                                                     Sydney

                                          Adelaide

                                                         Melbourne

Source: Ports Australia (2018)

Port of Newcastle has physical assets that make it well-positioned for the future of world container
trade which entails larger vessels and container ports and automated stevedoring that can facilitate
a high-productivity unmanned port.

Port of Newcastle commissioned AlphaBeta to model the economic benefits of the proposed NCT for
NSW as a whole, including regional NSW, both in terms of freight costs for businesses and as a
complement to Port Botany for optimal handling of the anticipated growth of container traffic.

A restriction currently imposed on Port of Newcastle prevents it from developing a large-scale,
commercially viable container terminal capable of accepting larger vessels. However, the study
models a scenario where the restriction is assumed not to apply to understand the potential
economic impact for the state of taking advantage of global innovations in the container freight
market.

AlphaBeta's report clarifies for us that not only will Hunter and northern NSW businesses and
households benefit from a container port at Newcastle, but so will Sydney in terms of pollution,
congestion and freight costs, which will come down with competition from Newcastle.

AlphaBeta also confirms our own internal assessment: that port-related freight costs are reduced
when there is a shorter journey and more efficient operations. This creates significant points of
difference for a new, modern large-scale container port. We welcome this independent report,
which demonstrates that a container terminal at Port of Newcastle would be good for regional NSW
consumers and businesses, and would represent a major economic boost to the state as a whole.

Craig Carmody - CEO, Port of Newcastle

                                                                                         αlphaβeta | 4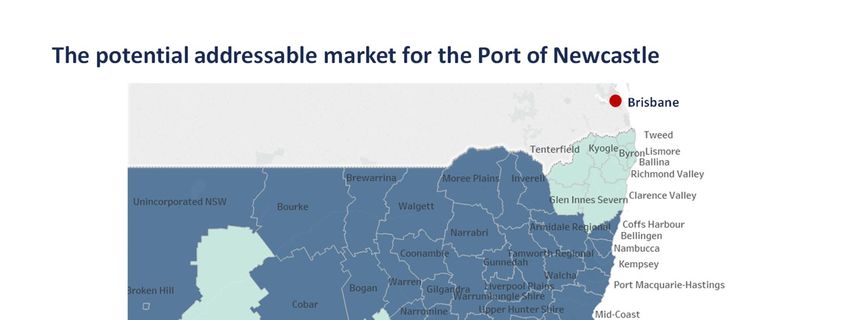
2. Executive Summary
This report examines the economic impact of opening a container terminal at Port of Newcastle. It
finds the NCT will increase NSW Gross State Product (GSP) by $6 billion by 2050. Over half of the $6
billion in new economic value for the state comes from lower freight costs. Customers will save $2.8
billion in land transport costs in Port of Newcastle’s potential market by 2050 through shorter
journeys and more efficient operations. The average land transport journey to port for northern
NSW exporters (compared with Botany) will nearly halve. Meanwhile, customers served by Port
Botany will save $1.2 billion in freight costs as competitive pressure leads to lower prices. Sydney
will also benefit from less freight traffic on its roads. This will create $500 million in extra value from
avoided infrastructure spending, and reduced congestion and pollution costs (see Exhibit 3).

EXHIBIT 3
    1. Overview of benefits

     A container terminal at the Port of Newcastle could drive $6 billion in
     additional economic value in NSW by 2050
         Benefits                       Additional value (NPV $b to 2050)          Driver

         Lower costs for                                                           • Land freight costs fall by 40% in
                                                       2.8
         PON customers                                                               Northern NSW, as served by a closer port

         Lower costs for                                                           • Competitive pressure leads to 10% price
                                                        1.2
         PB customers                                                                drop at Port Botany over time

                                                                                   • Infrastructure supporting Port Botany
         Avoided infrastructure spend                         0.4
                                                                                     freight expansion is deferred

                                                                                   • Road freight traffic associated with Port
         Reduced congestion                                    0.1
                                                                                     Botany declines

                                                                                   • Adjustments across sectors and regions
         Economic response                                           1.5             to lower costs, eg via access to world
                                                                                     markets

         Total                                                                 6.0 • Net economic benefits

                                                                           3
SOURCE: CGE modelling, AlphaBeta analysis

Opening a container terminal in Newcastle will also have broader economic and social benefits,
including stimulating exports and jobs in the Hunter Region and Northern NSW. Key sectors, such as
agriculture, food processing and advanced manufacturing, would see exports grow in value by an
extra $800 million by 2050. More than 4,600 jobs would be created in the Hunter Region and
Northern NSW by 2050, in industries as diverse as transport, construction, agriculture,
manufacturing and local services.

Approach taken to assessing economic impact
This report analyses the potential economic impact of the proposed container terminal at Port of
Newcastle by 2050 at a regional, state and national level.

3
    Numbers may not sum to totals due to rounding

                                                                                                                                 αlphaβeta | 5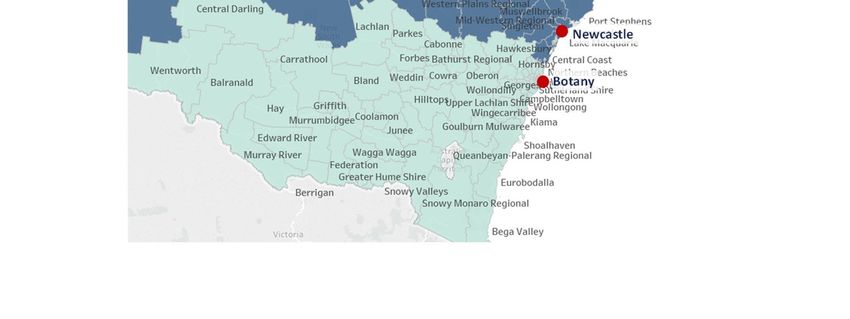
The analysis compared the impact of two scenarios from the present day until 2050. The baseline
scenario assumed that Port Botany continues to operate as the sole container port in NSW. In the
second scenario, Port of Newcastle opens a second container terminal, which scales and serves the
Hunter Region and Northern NSW. It did not consider the impact of more ambitious growth
scenarios, such as expanding the addressable market for NSW with the advent of inland rail.

Both scenarios applied NSW Treasury GSP and population growth projections. Growth in the
container freight market was assumed to be GDP growth plus one, recognising that historically trade
volumes have exceeded GDP.

Methodology

There were three stages to our methodology.

In the first stage, we modelled the container freight market in NSW. Using data on population,
incomes and industry output by local government area, we estimated where imports go to and
where exports originate from, across NSW and the ACT. We also projected growth in the market to
2050.

Using the freight market model, we then estimated the direct value to container freight customers
routing their traffic through a container terminal at Port of Newcastle. Using freight rates to all the
east coast container ports, we then estimated the potential land freight cost savings of accessing a
Newcastle terminal to customers addressable market. We estimated the benefits to customers of
being able to site intermodal centres and distribution centres adjacent to the Newcastle terminal,
rather than being separated by an additional rail or road link such as the 40 kilometre link between
Port Botany and the Moorebank intermodal site.

In the second stage, we estimated the broader potential benefit and impacts across the NSW
economy of a Port of Newcastle terminal. We calculated the potential savings from deferred
infrastructure spending in Sydney and from lower congestion and pollution, and the potential for
incumbent terminals at Port Botany to improve productivity in response to competitive pressure
from Newcastle. We also added the capital investment required to build a container terminal in
Newcastle, and the associated intermodals and distribution centres.

In the third stage, we integrated all these changes into a computable general equilibrium (‘CGE’)
model of the NSW economy, yielding changes in output, employment, incomes across regions and
industries, as well as the export of containerised freight, out to 2050.

The following chapters of the report explain the findings on the economic impacts associated with
establishing a container terminal at Port of Newcastle.

                                                                                            αlphaβeta | 6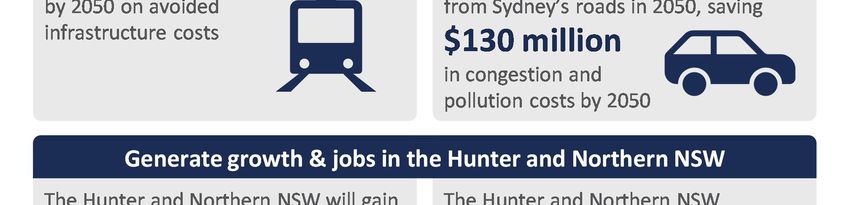
3. Generating freight savings in the
       Hunter Region and Northern NSW
       through a more efficient freight
       network
Adding a container terminal to Port of Newcastle could generate $2.8 billion in freight savings to
importers and exporters in the Newcastle, Hunter and Northern regions of NSW by 2050. Currently,
importers and exporters are served by Port Botany in Sydney or Port of Brisbane.

Both ports are hundreds of kilometers from the origin or destination points of freight in the Hunter
Region and Northern NSW, an area responsible for about a sixth of imports and exports in NSW.
Opening a container terminal in Newcastle would nearly halve the average overland freight journey
in these areas, immediately reducing transportation costs for imports and exports.

As Port of Newcastle will be home to a new, fully automated container terminal with an integrated
intermodal terminal facility, it would also introduce productivity improvements in freight handling,
generating further savings for Hunter Region and Northern NSW customers. If all freight customers
in the potential addressable market switched to being served from Newcastle, the cumulative
savings would be equivalent to $2.8 billion in additional GSP in NPV terms by 2050.

Potential market for Port of Newcastle

To calculate the potential savings for freight customers from a Port of Newcastle container terminal,
it is first necessary to identify the potential market for the port. This study defines the potential
market as NSW regions that are more cost-effectively served from Port of Newcastle than from
alternative ports such as Port Botany, Port of Brisbane, and Port of Melbourne.

To identify the addressable market, we modelled the current cost of delivering freight to population
centres across NSW from the ports of Botany, Melbourne, Brisbane and Newcastle. Next, we
identified geographic areas in the State that had freight transport links to Port of Newcastle and
were more cost effective to serve than from Port Brisbane or Port Botany.

To determine cost-effectiveness, we estimated journey length to key population centres from the
different ports; the transport mode share for imports and exports; and the price per TEU for
different modes and journey lengths. Any areas that were more cost-effectively served from Port of
Newcastle were deemed to be within the port’s addressable market.

Based on this analysis, the potential market for a Port of Newcastle container terminal extends
across the Hunter Region and Northern NSW and parts of Central NSW (the area shown in blue in

                                                                                          αlphaβeta | 7
Exhibit 4). The Port’s catchment is estimated to comprise 16.5 per cent of the total import-export
4
containerised freight market in NSW. Imports to the area, including groceries, clothing and
consumer electronics, serve major regional population centres such as Newcastle, Tamworth and
Port Macquarie. The region is also host to containerised exporting industries, such as agriculture and
forestry, food processing, and other forms of manufacturing, such as steel and machinery and
equipment.
EXHIBIT 4
SOURCE: AlphaBeta analysis
The model suggests that Port Botany would serve 79 per cent of NSW, that Port of Brisbane would
5
serve 3 per cent, and that Port of Melbourne would serve 2 per cent. In time, the area of
Newcastle’s addressable market could expand. It is possible, for example, that a container terminal
at Port of Newcastle could serve parts of the Sydney market, or that inland rail could expand the
addressable market served from NSW. However, these scenarios were not included as part of Port of
Newcastle’s potential market by 2050 in modelling for this study.
4
Our analysis suggests that the catchment of a container terminal at Port of Newcastle would cover about 16.5
per cent of NSW full import container movements, 28.8 per cent of full exports, and 20.5 per cent of full container
movements. As there are more full imports than full exports in the catchment, the port will export some empty
containers. The port’s share of all NSW import-export container movements, including fulls and empties, is 16.5
per cent. Deloitte Access Economics (2018) estimated the catchment at around 27 per cent of NSW full import
container destination and 38 per cent of full export container origins. The difference is largely due to our having
excluded areas where estimated transport costs to Newcastle are marginally higher than to Botany, and to our
having allocated some of the Northern NSW market to Port of Brisbane on the same basis.
5
AlphaBeta analysis.
αlphaβeta | 8Potential market growth
Freight demand in Port of Newcastle will grow significantly by 2050. This study has applied a freight
market growth rate of 3.5 per cent per annum, which is based on a GDP plus one growth rate. This
recognises that trade growth has historically outstripped GDP growth. Based on this assumption, the
volume of freight in Port of Newcastle’s potential market will grow from 460,000 TEU in 2020 to
6
close to 1.3 million TEU in 2050 (see Exhibit 5), including full and empty containers.
EXHIBIT 5
By 2050, the volume of freight through Port of Newcastle could reach
almost 1.3 million TEUs per annum
PON Volumes (000 TEUs)
1,400
1,289
1,200
1,000
914
800
648
600
459
400
200
0
2020 2030 2040 2050
Year of operation
SOURCE: AlphaBeta analysis. Includes empty export containers.
The choice of growth rate is material to freight volumes forecast for the area. Transport for NSW’s
modelling of freight growth rates assumes more modest growth rates for metropolitan and regional
NSW. For metropolitan areas, Transport for NSW assumes a growth rate of 3 per cent. This is
because, post the Global Financial Crisis (GFC), trade growth has been slower globally than GDP
growth. For regional areas of NSW, Transport for NSW assumes a more conservative 2.5 per cent
growth rate, because it assumes regional populations will decline. If these more modest growth
rates are applied, freight volumes would be between 945,000 TEUs and 1.1 million TEUs by 2050
(see Exhibit 6). The Transport for NSW assumptions contrast with those made by Port Botany, which
7
assumes a 4 per cent growth rate in the freight market.
6
Where there is an imbalance between imports and exports, some containers will be moved empty. Full imports
total about 1.2 million TEUs and full exports total about 500,000 TEUs (excluding parts of NSW served by
terminals in Melbourne and Brisbane), so more than half of containers exported from Botany are empty. We
estimate in the PON addressable market, the number of full exports is just 16 per cent lower than full imports, so
only about 8 per cent of containers exported from Newcastle would be empty, or about 35,000 at 2018
addressable market volumes.
7
Transport for NSW Freight and Ports Plan 2018 – 2023 and Strategic freight forecasts; NSW Ports (2018).
αlphaβeta | 9EXHIBIT 6
Growth scenarios drive long term volumes strongly
PON Throughtput Volumes (000 TEUs)
3.5 Per Cent Growth 3 Per Cent Growth 2.5 Per Cent Growth
1,400
1,200
1,000
800
600
400
200
0
2018 2020 2022 2024 2026 2028 2030 2032 2034 2036 2038 2040 2042 2044 2046 2048 2050
Year of operation
SOURCE: AlphaBeta analysis. Includes full and empty containers.
This study uses a 3.5 per cent growth rate for three reasons. Firstly, given that this study considers
the impact of a container terminal over a 30-year period, it is more likely that freight volumes will
reflect the long-term average growth rates of trade, rather than the growth rate of the last decade,
which has been aberrant. Supporting the view that trade will return to a rate above GDP, BITRE has
noted recently that “growth in annual TEU throughput at Australia’s container ports was 3.5 per cent
8
in the 12 months to June 2017, while non-farm GDP growth was 1.7 per cent over the same period”.
Secondly, the demand from Asia for agricultural exports and further containerisation of freight along
with population growth forecasts in Newcastle, the Hunter and the coastal regions of Northern NSW
suggests that growth in container import and export volumes may be stronger in the region than
9
forecast by Transport for NSW. Finally, a growth rate of 3.5 per cent is a midpoint of Transport for
NSW’s more modest figures for NSW and Port Botany’s more aggressive growth assumptions.
Potential savings in the Port of Newcastle market
A container terminal at Port of Newcastle could deliver $2.8 billion in freight savings for businesses
and consumers in the Hunter Region and Northern NSW by 2050. These freight savings are driven by
two factors: shorter journeys and more efficient operations.
Port of Newcastle is geographically closer to most markets in the Hunter Region and Northern NSW
than Port Botany and Port of Brisbane. This means, on average, freight journeys in the area would
fall by 40 per cent compared to the current journeys to Port Botany. The freight task to serve
Armidale in Northern NSW would drop by 150km, or 31 per cent. Journeys to Narrabri, Tamworth
and the Upper Hunter would all fall by 190 km, or 30-40 per cent. Even the Central Coast between
8
BITRE (2017)
9
Planning NSW (2018)
αlphaβeta | 10Sydney and Newcastle is much closer to Port of Newcastle than to Port Botany, once the trip from
Botany to distribution centres in Sydney’s west is factored in. Freight costs (also shown in Exhibit 7
for an indicative freight charge) would also fall materially. In some cases, Newcastle has the
advantage of being connected by rail to major population and distribution centres in the region,
while Port Botany and Port of Brisbane are not. This allows freight to switch from road to rail for
much of the journey, which can also have efficiencies, such as allowing greater scale in freight
deliveries.
EXHIBIT 7
Many major centres in Northern NSW will see significant decreases in
freight journey times and freight costs
Region KMs saved % change $ saved
Central Coast 72 45 193
Western Plains 79 17 214
Armidale 150 31 404
Narrabri 191 32 517
Tamworth 191 40 517
Upper Hunter 191 55 517
Kempsey 209 42 564
Newcastle 216 100 583
SOURCE: AlphaBeta analysis. Savings shown are for an indicative $2.70 per TEU-km. Actual savings
depend on mode and freight customer characteristics such as size. Savings are rounded.
The second source of savings is more efficient operations at Port of Newcastle. A container terminal
at Port of Newcastle will include a rail intermodal facility within the terminal, with an integrated
logistics hub located adjacent to it. This is a different arrangement to Port Botany, which by 2050 will
be transporting containerised freight to the Moorebank intermodal site, located 40 kilometres from
the port, and more distant sites, before the freight can be deconsolidated and sent to distribution
centres and other parts of the state (see Exhibit 8).
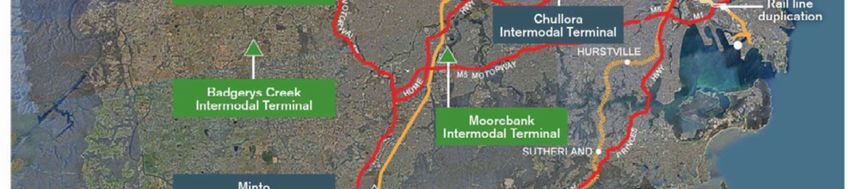
αlphaβeta | 11EXHIBIT 8
SOURCE: Port of Newcastle
There are five main productivity gains from integrating an intermodal facility with the container
terminal.
■ Vertically integrating the intermodal terminal and container terminal creates efficiencies by
reducing the coordination complexity for different groups in the freight supply chain in moving
goods between the container terminal and intermodal facility, and their ability to interlink with
onward transport modes such as rail.
■ It reduces the amount of internal transport infrastructure needed between the container
terminal and intermodal site, such as long-distance trucks and special cranes.
■ It reduces the external transport infrastructure needed because the operations are on a single
site.
■ Integrated sites can better utilise capital. Reducing queuing and decreasing timetable windows
(that is, periods where freight can be loaded and unloaded) allows trucks to spend less time
waiting, thereby increasing capital utilisation and labour productivity. Decreasing the time and
distance required to transport empty containers back to the port further increases the
utilisation rate of capital.
■ Finally, intermodal or distribution centres can be subject to curfews during peak hours because
of their effect on traffic. This reduces their hours of operation and therefore their productivity
and the productivity of the supply chains they service. The site at Port of Newcastle can
operate 24/7 with a predominant emphasis on rail as it is in an industrial area. By comparison,
the Moorebank terminal in Sydney has a partial curfew until it is completed in 2030, which
αlphaβeta | 12limits it to 16 hours of operation per day, although it will shift to 24/7 by 2030. The distribution
10
centres in Sydney serviced by Moorebank may also have curfews.
Case study: Namoi Cotton
David Titterton, Logistics and Commodities Manager for Namoi Cotton, is keen to see a new
container terminal at Port of Newcastle. Namoi Cotton is increasingly looking to export through Port
of Brisbane as the logistics of getting long trains through Sydney’s congested system into Port
Botany become more challenging every year.
Throughout the year, produce is railed to Port Botany from the Wee Waa and Warren warehouses
and packing facilities. Around 40 per cent of cotton exports go through Port of Brisbane. Titterton
expects all the cotton and grain from its facilities would go through Port of Newcastle if there was a
container terminal and the appropriate shipping lines operated from the port.
This could deliver significant savings for Namoi Cotton. The cost of freight from a warehouse to
Botany is currently around 8 per cent of the cost to Namoi Cotton of a bale of cotton, and around 15
per cent of the cost to growers of grain.
A significant and growing issue for Namoi Cotton in going through Port Botany is that the supply
chain through Sydney is ‘very inefficient’ and ‘expensive’. It requires going through three different
networks - John Holland, ARTC, then Sydney Metro.
Delay can mean missing a ship departure and having the train load go into a container park,
increasing costs by up to $300 per container. Titterton notes, ‘getting through Sydney Metro is very
difficult. If your train is a little bit late, you get held up. Once you miss your window, it can be very
costly.’
A new container terminal at Port of Newcastle would improve the cycle time of trains, reducing the
cost per bale exported. Return on the reduced cost to growers would make the goods more
competitive on the global market and underpin Namoi Cotton’s plans for further growth.
Namoi Cotton was originally established as a grower cooperative in 1962, owning and operating 14
cotton gins across NSW from Goondiwindi in the north to Hillston in the south. It is an ASX-listed
company with annual revenue of around $480 million. Namoi Cotton Alliance, which is a Joint
Venture with Louis Dreyfus Commodities, owns and operates warehouse and grain packing facilities
at Goondiwindi as well as Wee Waa and Warren in western and north-western NSW.
The cotton side of the business buys cotton from growers, gins and markets it, then exports to Asia.
The commodity packaging service side of the business has been developed over the last five years
with the aim of leveraging synergies with the cotton business and existing freight contracts. The
business is based on a toll packing model that provides a service to growers within its catchments
and traders looking for a containerised export service.
SOURCE: Hunter Research Foundation Centre (2018)
10
Liu (2010), Moorebank Intermodal Terminal Corporation (2014), Asciano (2015), Standing Committee on
Transport and Regional Services (2007)
αlphaβeta | 13Quantum of savings
Together, cumulative savings from shorter journeys and more efficient operations will total $2.8
billion by 2050 in NPV terms in Port of Newcastle’s potential market (see Exhibit 9). The bulk of the
savings come from shorter overland freight journeys (and some mode shift to more efficient rail),
which contributes $2.4 billion in savings by 2050. Efficiencies from terminal integration at Port of
Newcastle save a further $70 million a year by 2050, worth about $360 million in net present value.
EXHIBIT 9
A container terminal at PON could deliver $2.8 bn in freight savings by
2050
Land freight and terminal savings in the PoN Catchment ($ NPV)
2.8 2.8
0.4
2.4
2.4
2.0
1.6
1.2
0.8
0.4
0.0
Land Freight Terminal Total
SOURCE: Alphabeta analysis.
Impact on importers and exporters in the Hunter Region and Northern NSW
More efficient freight significantly lowers costs for importers and exporters in the Hunter Region and
Northern NSW. Importers could save $1.5 billion in total from lower freight costs by 2050 in NPV
(see Exhibit 10). This equates to annual savings of over $100 million in 2020, rising to $300 million
per annum by 2050. This is good news for firms that use imported capital goods and consumables,
and for households in the region, who are key end consumers of imported goods.
αlphaβeta | 14EXHIBIT 10
Importers in Port of Newcastle’s potential market could save $300m in
freight costs by 2050, on almost 650,000 containers
Potential importer land freight and terminal savings in the PoN Catchment ($m per year)
299
300
Land freight
250 Terminal costs
212
200
260 Cumulative savings
150
150 for importers by
184 2050 are $1.5b in net
106
100 present value
131
93
50
27 39
14 19
0
2020 2030 2040 2050
TEU 230 324 457 644
SOURCE: AlphaBeta analysis. Excludes any charges for empty container exports paid by importers.
By 2050, exporters, such as farmers and manufacturers, could save $1.3 billion in total in NPV from
lower freight costs (see Exhibit 11), based on TEU volumes growing to over 500,000 in 2050. This
equates to annual savings of $90 million in 2020, rising to $250 million per annum by 2050.
EXHIBIT 11
Exporters in Port of Newcastle’s potential market could save $250m in
freight costs by 2050, based on total TEUs of over 500,000
Potential exporter land freight and terminal savings in the PoN Catchment ($m per year)
250
250
Land freight
Terminal costs
200
177
150
217 Cumulative savings
125
for exporters by 2050
are $1.3b in net
100 89 154
present value
109
50 77
23 32
12 16
0
2020 2030 2040 2050
TEU 192 271 382 539
SOURCE: AlphaBeta analysis. Full containers only.
αlphaβeta | 15Alternative scenarios if actual market share is lower than the potential market
This study models the freight savings for all the importers and exporters that would be most cost-
effectively served from Newcastle. In practice, not all customers in Port of Newcastle’s potential
market may switch from Port Botany or Port of Brisbane, despite the cost advantages of doing so. If
only half or three quarters of potential customers switch, container volumes served by Port of
Newcastle will be between 644,000 TEUs to 966,000 TEUs by 2050 respectively (see Exhibit 12).
EXHIBIT 12
The volume of container freight handled by the Port of Newcastle will be
impacted by the market share achieved by the Port by 2050
PON Volumes (000 TEUs)
Addressable Market
75% market share scenario
1,400 50% market share scenario
1,289
1,200
1,000 966
914
800
685
648 644
600
459 486 457
400 344 324
230
200
0
2020 2030 2040 2050
Year of operation
SOURCE: AlphaBeta analysis. Includes empty export containers, which are expected to be about 16
per cent of exports and 8 per cent of all containers handled by the terminal.
Cumulative savings to the region would be $1.4 billion in NPV terms by 2050 were Port of Newcastle
to gain only a 50 per cent market share, and $2.1 billion with a 75 per cent market share (see Exhibit
13).
αlphaβeta | 16EXHIBIT 13
Potential freight savings in NPV terms range from 1.4 billion to 2.8 billion
depending on Port of Newcastle’s actual market share
Freight savings ($ billion, NPV) (excludes savings at port)
2.8 2.8
2.4
2.1
2.0
1.6
1.4
1.2
0.8
0.4
0.0
100% 75% 50%
market share
SOURCE: AlphaBeta analysis
αlphaβeta | 174. Savings for NSW consumers and
businesses in a more competitive
freight market
Greater competitive pressure on Port Botany could save businesses and consumers in Sydney and
Southern NSW $1.2 billion by 2050. Currently, there is little direct competition between container
port operators in NSW because Australian container ports are geographically dispersed.
Port of Newcastle is less than 200 kilometres from Port Botany, meaning there is substantial overlap
in the potential markets both ports can serve. This will create competitive pressure on Port Botany,
which is likely to lead to lower prices and more productive operations. This effect would not be
achieved from opening a container terminal at Port Kembla as it is owned by the same operator as
Port Botany.
Role of competition in NSW container freight market
Freight is a material cost for many imported and exported goods. Freight-related fees and charges
add approximately $1,000 per TEU to imported and exported goods in NSW that currently pass
through Port Botany (see Exhibit 14).
EXHIBIT 14
Freight costs can be up to 15% of value
Export fees and charges as a proportion of TEU values Import fees and charges as a proportion of TEU values
of key commodities of key commodities
Freight-related fees and charges Underlying good price Freight-related fees and charges Underlying good price
$62,156 $6,523 $16,549 $101,019 $37,019 $101,019 $201,019
2% 6% 1% 3% 1% 1%
15%
98% 94% 99% 97% 99% 99%
85%
Aluminium Wheat Cotton Mattresses Bananas Fridges Flat-
screen TVs
SOURCE: Aqua-calc (2018), Constellium (2018), Index Mundi (2018), Transport for NSW (2018),
Icontainers (2018), BITRE (2018).
Reducing port and freight related fees and charges through competitive pressure on price and the
efficiency of operations is therefore crucial to lowering the cost of imports and exports paid by NSW
αlphaβeta | 18consumers and businesses. NSW container port freight customers generally pay higher fees and
charges for imports compared with port customers in other Australian states. Australian port fees
are also high by international standards. Port Botany’s total port fees and charges are $11 per TEU
higher than the average of the four other container ports in Australia for imports.11 This is a
significant difference because imports account for approximately 70 per cent of the NSW
international container freight task. The higher costs to NSW customers come despite Port Botany
having a scale advantage over most other Australian container ports.
NSW freight customers are also more likely to experience congestion and higher waiting times
during busy periods compared to customers of other ports. Such delays and congestion decreases
transport productivity (see Exhibit 15). Both ship and truck turnaround times are longer at Port
Botany than the average of the other four Australian container ports. Port Botany’s crane rates also
are below the average performance of the four other container ports, despite Port Botany’s scale
advantage. As an exemplar for Port of Newcastle, the Port of Tauranga, just outside Auckland in New
Zealand, achieves a 59 per cent higher productivity outcome than the current Australian port
average (see box below).
EXHIBIT 15
Port Botany’s productivity is mixed compared to other Australian ports
Sydney Four ports average1
Sydney’s processes take longer Sydney’s performance is lower
when speed is important when higher rates are important
62.5 63.3
56.9
48.8
44.6
39.7
32.9
30.7 30.0
28.1
13.6
10.8
Truck turn- Ship turn- Ship turn- Average Average TEUs Crane rate
around around time: around time: waiting time per ship-hour (TEUs per hour)
time (mins) Median (hours) 95th percentile at anchorage at berth (TEUs
(hours) (hours) per hour)
SOURCE: ACCC (2017). The four ports average includes Brisbane, Melbourne, Fremantle and
Adelaide
The higher prices and mixed productivity experienced by NSW customers could be addressed by
allowing greater competition in the sea freight container market. Economic research into
competition amongst ports has found that competition can occur at three levels. The first form of
competition is intraport, where providers within a single port, such as stevedores, compete. The
second form of port competition is interport competition in the same geographic area, where two
port operators serve an overlapping market. The final form of competition is interport competition
11 BITRE, (2017).
αlphaβeta | 19at a national or international level, such as occurs between Port of Melbourne and Port Botany, or
between Singapore and Hong Kong (see Exhibit 16).
EXHIBIT 16
There is a lack of competition between separately owned container port
operators in the NSW market
Level of competition
Low Medium High
Types of port
competition Description Status in NSW Rationale
Competition between 3 major stevedores compete
service providers at the at Port Botany
1. Intra-port same port, e.g. stevedores
competition
Competition between Single container port in NSW
2. Inter-port ports or port clusters with limited market overlap
competition at serving an overlapping with interstate ports, e.g.
operator level hinterland Brisbane
Competition between sea Five major container ports
3. Inter-port ports under different port around Australia
competition Port authorities, e.g. Hong Kong
Authority level vs Singapore; Sydney vs
Melbourne
SOURCE: Meersman, Van de Voorde, Vanelslander (2010)
While pressure on sea freight exists at the intraport and national interport level in NSW, there is very
limited competition between container port operators as Australia’s five container ports are
geographically dispersed and have limited overlapping markets (see Exhibit 17).12
The introduction of a second, separately owned container port operator would apply competitive
pressure to Port Botany, likely leading to lower prices and improved productivity. Evidence from
other markets that have stronger operator-level competition shows that it can drive down prices
and improve productivity at the competing ports, as cost and supply chain efficiency are two primary
factors influencing whether shipping lines and freight customers switch to a competitor. A new
entrant competing for the same overlapping market can exert downward pressure on price.
Competition can also catalyse productivity improvements at the incumbent port, as the efficiency of
ports and their related freight supply chains are increasingly important to port and shipping cost
structures, and material factors in the decision on whether to stop at an additional port. Improving
productivity at the incumbent port can therefore be a key defensive play to avoid losing market
share to a new rival port operator.
Approach to estimating savings from competitive pressure
Incumbent terminal operators and the incumbent port operator can be expected to respond to the
entry of a competitor by cutting prices and intensifying their focus on productivity. While it is
12 The distribution of Australia’s container ports, and their related hub and spoke transport infrastructure that
radiates out from them, is also at odds with the distribution of Australia’s population, which concentrate on the
East Coast.
αlphaβeta | 20difficult to be precise about how strongly and when incumbents will respond, we assume customers
will see current prices fall by 10 per cent by 2050 for terminal and port services, reflecting some
erosion of margins in the short term, and improvements in productivity over time.
Quantum of savings from competitive pressure
By 2050, lower port prices at Port Botany resulting from competition could deliver $1.2 billion in
freight savings to the NSW businesses and consumers that rely on it (see Exhibit 17). Importers
would save $900 million, and exporters would save $300 million, in net present value terms. On an
annual basis, importers could save about $40 million per annum in 2020, rising to $200 million per
annum by 2050. Exporters could save about $15 million per annum in 2020, rising to over $70 million
per annum by 2050.
The benefits of competition for container freight will spread across Sydney and Southern NSW. As
importers compete for customers, they can be expected to pass on cost savings to consumers and
other customers. In turn, consumers will expand their purchases of other goods and services.
Ultimately, lower import prices benefit consumers, workers, and the owners and suppliers of firms
across Sydney and Southern NSW. Similarly, price cuts for exporters will also have broader effects
across the economy. As their returns rise, they expand production, increase their purchases from
other sectors, and bid up wages and the prices of inputs.
EXHIBIT 17
Lower prices at Port Botany due to competitive pressure could save
Sydney and Southern NSW businesses and customers $1.2 billion by
2050
Sydney and SNSW freight savings by 2050 ($ billion, NPV)
1.2
0.92
0.32
Exporters Importers Total
SOURCE: AlphaBeta analysis
αlphaβeta | 21CASE STUDY: EFFECTS OF PORT OPERATOR COMPETITION IN NEW ZEALAND
Port of Tauranga opened in New Zealand’s Bay of Plenty in 1988, introducing direct, operator-level
competition to New Zealand’s largest container port, Port of Auckland. This was possible because of
reforms to New Zealand’s regulatory model for ports, and because Tauranga is located around 230
kilometres from the Port of Auckland. The proximity of the ports, and transport links between the
areas, means there is a geographically overlapping area where they compete.
Since Tauranga opened, competition between the two ports has been intense, resulting in the
productivity of both ports continually increasing. Today, Tauranga is the most productive port in
New Zealand measured by shipping rates, with Auckland second. Tauranga is 59 per cent more
productive than the average of Australia’s five container ports based on shipping rates.
SOURCE: Port of Tauranga (2018), Port Strategy (2018)
αlphaβeta | 225. Improving liveability in Sydney by
reducing pressure on infrastructure,
congestion and pollution
Establishing a container terminal at Port of Newcastle would generate over $500 million savings by
2050 from avoided infrastructure, pollution and congestion in Sydney. It would relieve capacity
pressures on Port Botany and surrounding infrastructure by diverting up to a million container
13
movements each year to the Hunter Region and Northern NSW by 2050. Relieving pressure on
Sydney’s infrastructure, and thereby deferring infrastructure construction or upgrades, would
contribute $410 million of the savings.
Reduced congestion and pollution costs would contribute a further $110 million. Equivalent costs
are unlikely to be incurred in the Port of Newcastle area. As the site is in an industrial area, and the
terminal would predominantly use rail to transport freight, congestion and pollution impacts will be
minimal. In addition, the proposed site has an existing stock of rail infrastructure that can be
modified to serve a container terminal at relatively low cost. There is also significant latent capacity
within the existing rail network ‘to move freight from regional NSW to Newcastle without the need
14
for significant capital investment.’
Avoided infrastructure savings
Context to infrastructure upgrades and construction in Sydney
Freight traffic creates significant pressure on Sydney’s road and rail infrastructure. 80 per cent of
Port Botany related container traffic is carried by trucks on already congested roads, and heavy
15
vehicles account for approximately 10 per cent of Sydney vehicle-kilometres. This increasing level
of container freight traffic places pressure on road, rail and logistics infrastructure (such as
intermodal and distribution centre facilities) in Sydney, especially in the South and West of the city.
This traffic has contributed to the need for expensive infrastructure upgrades and created
congestion and pollution. This is most acute for infrastructure links connected directly to Port
Botany, as well as to main arterial links in Sydney which include main freight routes.
The NSW Government and Port Botany’s operators recognise the pressure that container freight
traffic places on Sydney’s roads. In response, they plan to increase the share of containers
transported by rail to achieve a target of 40 per cent rail mode share by 2045. This shift is being
16
supported by new investments in rail freight lines and intermodal terminals servicing Port Botany.
However, even with this multi-billion dollar investment and partial mode shift, container freight
traffic on Sydney’s roads will likely return to today’s levels within two decades.
13
A 1.2m-full-TEU-throughput Newcastle terminal would reduce Botany throughput by about 1 million TEUs,
because about five-sixths of the estimated Newcastle container terminal would otherwise be in Botany’s
catchment (and one-sixth in the catchment of Port of Brisbane).
14
AECOM (2018)
15
NTC Paygo model (2018). Adjusted for vehicle impact.
16
Transport for NSW, NSW Freight and Ports Plan 2018-2023 (2018)
αlphaβeta | 23Establishing a 1.2 million TEU container terminal at Port of Newcastle would relieve pressure on
Sydney’s road and rail networks by diverting a portion of Port Botany related freight traffic from the
Sydney to the Newcastle region. This would defer the need for future infrastructure upgrades or
new infrastructure to be constructed. Deferred investment is valuable to the community because
the cost of the avoided capital can be used for another purpose, such as allowing the NSW
Government to invest in alternative and more productive infrastructure. As Port of Newcastle is
already served by under-utilised rail and road infrastructure, moving container freight activity to Port
of Newcastle could be achieved without triggering substantial public infrastructure investments.
Two major transport routes would benefit from traffic diversion if some container freight activity
switched to Port of Newcastle from Port Botany. Firstly, fewer trips between Port Botany and the
Moorebank Intermodal Centre and distribution centres in Western Sydney would be needed, as the
total freight volume from Port Botany would reduce. Secondly, trips from the Moorebank
intermodal site and distribution centres to the Hunter Region and Northern NSW would decrease, as
these regions would be served directly from Port of Newcastle (see Exhibit 18). By 2050, up to
17
750,000 container truck trips through Sydney could be removed. Freight traffic on other routes,
such as freight traffic serving the Sydney market, would not be affected because no traffic would be
diverted from these routes unless Port of Newcastle began serving the Sydney market.
EXHIBIT 18
A Newcastle container terminal reduces rail and road journeys through
Sydney
Typical future Sydney freight movements addressable by a Newcastle container terminal
Hunter Region and
Northern NSW market
~40 km trips
across Sydney
Sydney
market
Intermodal terminals Port Botany
and distribution centres
• Chullora ~30 km trips
• Enfield
• Moorebank
• Villawood
• Yennora
SOURCE: Alphabeta analysis.
17
Assumes 2 TEUs per truck and 50 per cent utilization on return journey. This assumption is conservative given
the prevailing empty backhaul ratios (Lycopodium 2018).
αlphaβeta | 24Approach to calculating the value of deferred infrastructure investments in Sydney
Moving now to establish a container terminal at Port of Newcastle means that in 2035 to 2040,
Sydney can defer a new round of infrastructure investment related to growth in container freight
traffic at Port Botany.
We used a five-step method to estimate the value of this deferred investment. First, we identified
deferrable components of road, rail and logistics infrastructure related to Port Botany freight traffic
which would not be needed if activity switched to Port of Newcastle (that is, the routes shown in
Exhibit 18 above). We then estimated when new capacity would be required due to current or
planned capacity being exhausted.
Next, we developed multiple scenarios for building new capacity in Sydney, to account for
uncertainty about the nature of future upgrades. We identified two that were most likely, after
testing the scenarios in expert interviews. We estimated the cost of these. Finally, we pro-rated the
portion of the infrastructure cost reduction attributable to Port of Newcastle, as in many cases the
infrastructure is also used for other purposes and therefore the full cost may not be avoided solely
because of the switch of container freight activity to Newcastle. Appendix A: Methodology has
further detail.
Potential future infrastructure upgrades that could be avoided
The NSW Government is currently spending, or planning to spend, $50 billion on infrastructure
upgrades over the next ten years. Around $11 billion of this investment is related to container
freight traffic at Port Botany (see Exhibit 19), including rail and road infrastructure such as the
Sydney Gateway and Airport East Upgrades. Included projects were those listed on the 2018
Infrastructure Australia Priority List that can be used for freight, and other major infrastructure
projects intended to support freight activity, for example, the Airport East Upgrades, the Maldon-
Dombarton Railway Line, the Bells Line of Road Improvement, Bridges for the Bush, and
NorthConnex.
αlphaβeta | 25EXHIBIT 19
Infrastructure upgrades to support growing Port Botany container
freight traffic are a significant cost to the NSW Government
Estimated cost of current planned major transport infrastructure projects in NSW, which are suitable for freight use ($ billions)
Directly sensitive to container freight
at Port Botany where the project’s
Indirectly sensitive to Port Botany freight:
primary rationale is to address
where the project is motivated to serve multiple modes of
movements of PB freight. (not all
transport for both freight and passenger vehicles
capacity is absorbed by PB traffic)
$50
Includes: Includes:
• WestConnex • NorthConnex
Includes: • The Northern • F6 Extension $12
• Northern, Road Upgrade
Southern, and • M4 Upgrade $37
$1
Western freight $6
corridors
Includes: Includes:
• Bridges for • Inland Rail
Includes: the Bush • Maldon –
• Sydney $21 • M1 Pacific Dombarton
Gateway Motorway Railway Line
• Airport East Upgrades
Upgrades
$8
$2
Road improve- Rail freight Improved Improved road Total Other road Other rail Total trans-
ments near network in road capacity capacity in Sydney projects in projects in port infra-
Port Botany Sydney in Western Sydney's NSW NSW structure
Sydney North or South pipeline
SOURCE: Infrastructure Australia, Priority Projects List (2018), Transport for NSW, Current Projects
(2018), Deloitte Access Economics (2018)
Projects currently under construction, or well-advanced in the planning stage, are too far progressed
to be avoided. They will relieve capacity pressures from Port Botany container freight until the late
2030s (see Exhibit 20). However, by then, growth in the container freight market is likely to exhaust
the expected capacity of the rail link from Port Botany to the Moorebank Intermodal Terminal.
Container road freight from Port Botany is then likely to return to today’s level and trigger a new
18
round of infrastructure requirements.
18
The maximum rail capacity is assumed to be approximately 3 million TEU. Even if this rail capacity is fully
utilised, container road freight will return to today’s levels before 2040.
αlphaβeta | 26EXHIBIT 20
Current projects may only relieve capacity constraints until 2035-2040,
at which point a new round of infrastructure investment will be needed
Projected volume of road and rail freight import-export container TEUs to and from Port Botany
2020 Road Road TEU (w. new rail Rail TEU (w. new rail
TEU traffic network) network)
5,000
4,000
TEUs (thousands)
3,000
2,000
1,000 Road TEU traffic will exceed 2020
levels in about 2035-2040
0
2015 2020 2025 2030 2035 2040 2045 2050
SOURCE: TEU traffic projected based on BITRE (2017). Modal share informed by Transport for NSW
(2017). Additional capacity informed by Transport for NSW (2013), ARTC (2015), and NSW Ports
(2015), Ellicott (2018)
Opening a container terminal at Port of Newcastle with the capacity to serve its addressable market
(growing to 1.2 million full TEUs by 2050, and about 1.3 million total TEUs) would mean rail
construction and upgrades in Sydney that would otherwise likely be undertaken in the late 2030s
19
could be deferred for about five years (see Exhibit 21).
19
Addressable market for full containers only. Subsequent investments would also be deferred. We provide for
continuing reduction in road investment throughout the study period as result of lower road traffic. But we
assume that only one major round of rail investment is deferred in the study period, reflecting the lumpiness
and likely capacity of the largest single investment, discussed later in this section.
αlphaβeta | 27EXHIBIT 21
A PON container terminal delays the need for all successive investment
in Sydney’s rail infrastructure by 5 years from 2040
Projected volume of road freight import-export container TEUs to and from Port Botany
2020 Road Road TEU (w. new rail
TEU traffic network)
5,000 Road TEU
(w. new rail network
and PON)
4,000
Every future instance of Sydney
container-focused rail freight rail
TEUs (thousands)
3,000 capex can be delayed after this point
2,000
1,000
0
2015 2020 2025 2030 2035 2040 2045 2050
SOURCE: BITRE (2017), Transport for NSW (2017, 2013), ARTC (2015), Ellicott (2018)
As the nature of future infrastructure upgrades is uncertain, two scenarios were modelled to identify
the potential costs of deferring future Sydney infrastructure upgrades (see Exhibit 22), using the cost
and capacity of comparable projects that have recently been completed or costed.
Scenario One assumes that a future upgrade has similar requirements and costs per TEU to the
current upgrades and constructions related to Port Botany container freight traffic. The relevant
upgrades are to the rail line between Port Botany and Moorebank, the construction of the South
Sydney Freight line serving Moorebank and a road upgrade from a logistics hub to the edge of the
Sydney market. To calculate costs, we used official information on the actual or estimated cost of
20
the current infrastructure projects the scenario is based upon.
Scenario Two assumes that, in addition to rail and road infrastructure reaching capacity, the
Moorebank intermodal terminal and surrounds also reach capacity, and therefore more freight
needs to be sent to distribution centres in Western Sydney for unpacking. This would trigger a need
for the construction of the Western Sydney freight line.
20
As this showed that actual project costs were higher than originally forecast, for those projects yet to be
completed we added 14 per cent to their cost to allow for overruns, as this is the average overrun cost for major
Australian infrastructure projects
αlphaβeta | 28You can also read