Predicting Tie Strength With Social Media
←
→
Page content transcription
If your browser does not render page correctly, please read the page content below
Predicting Tie Strength With Social Media
                                                Eric Gilbert and Karrie Karahalios
                                              University of Illinois at Urbana-Champaign
                                                  [egilber2, kkarahal]@cs.uiuc.edu

ABSTRACT                                                                       friend generate creative ideas [4] or find a job [18]. They
Social media treats all users the same: trusted friend or total                also expedite the transfer of knowledge across workgroups
stranger, with little or nothing in between. In reality, rela-                 [20]. Trusted friends and family, called strong ties, can af-
tionships fall everywhere along this spectrum, a topic social                  fect emotional health [36] and often join together to lead
science has investigated for decades under the theme of tie                    organizations through times of crisis [24]. Despite many
strength. Our work bridges this gap between theory and                         compelling findings along this line of research, social me-
practice. In this paper, we present a predictive model that                    dia does not incorporate tie strength or its lessons. Instead,
maps social media data to tie strength. The model builds on                    all users are the same: friend or stranger, with little or noth-
a dataset of over 2,000 social media ties and performs quite                   ing in between. Most empirical work examining large-scale
well, distinguishing between strong and weak ties with over                    social phenomena follows suit. A link between actors either
85% accuracy. We complement these quantitative findings                        exists or not, with the relationship having few properties of
with interviews that unpack the relationships we could not                     its own [1, 2, 27].
predict. The paper concludes by illustrating how modeling
tie strength can improve social media design elements, in-                     This paper aims to bridge the gap, merging the theory be-
cluding privacy controls, message routing, friend introduc-                    hind tie strength with the data behind social media. We ad-
tions and information prioritization.                                          dress one central question. With theory as a guide, can so-
                                                                               cial media data predict tie strength? This is more than a
Author Keywords                                                                methodological or theoretical point; a model of tie strength
Social media, social networks, relationship modeling, ties,                    has the potential to significantly impact social media users.
sns, tie strength                                                              Consider automatically allowing the friends of strong ties to
ACM Classification Keywords                                                    access your profile. Or, as one participant cleverly sug-
H5.3. Group and Organization Interfaces; Asynchronous                          gested, remaking Facebook’s Newsfeed to get rid of “peo-
interaction; Web-based interaction.                                            ple from high school I don't give a crap about.” The model
                                                                               we present builds on a dataset of over 2,000 Facebook
INTRODUCTION                                                                   friendships, each assessed for tie strength and described by
Relationships make social media social. Yet, different rela-                   more than 70 numeric indicators. It performs with surpris-
tionships play different roles. Consider the recent practice                   ing accuracy, modeling tie strength to 10-point resolution
of substituting social media friends for traditional job refer-                and correctly classifying friends as strong or weak ties more
ences. As one hiring manager remarked, by using social                         than 85% of the time.
media “you’ve opened up your rolodex for the whole world
to see” [38]. To the dismay of applicants, employers some-                     We begin by reviewing the principles behind tie strength,
times cold call social media friends expecting a job refer-                    and then discuss its proposed dimensions. Using theory to
ence “only to find that you were just drinking buddies.”                       guide the selection of predictive variables, we next present
Although clearly not the norm, the story illustrates a basic                   the construction of our tie strength model. It performs well,
fact: not all relationships are created equal.                                 but not perfectly. To understand our model’s limitations, we
                                                                               also present the results of follow-up interviews about the
For decades, social science has made much the same case,                       friendships we had the most difficulty predicting. The paper
documenting how different types of relationships impact                        concludes by applying our findings toward implications for
individuals and organizations [16]. In this line of research,                  theory and practice.
relationships are measured in the currency of tie strength
                                                                               TIE STRENGTH
[17]. Loose acquaintances, known as weak ties, can help a
                                                                               Mark Granovetter introduced the concept of tie strength in
                                                                               his landmark 1973 paper “The Strength of Weak Ties” [17].
Permission to make digital or hard copies of all or part of this work for      In this section we review tie strength and the substantial
personal or classroom use is granted without fee provided that copies are      line of research into its characteristics. We then discuss four
not made or distributed for profit or commercial advantage and that copies     researchers’ proposals for the dimensions of tie strength,
bear this notice and the full citation on the first page. To copy otherwise,
or republish, to post on servers or to redistribute to lists, requires prior   laying a foundation for our treatment of it as a predictable
specific permission and/or a fee.                                              quantity. The section concludes by introducing the research
CHI 2009, April 4–9, 2009, Boston, Massachusetts, USA.                         questions that guide the rest of this paper.
Copyright 2009 ACM 978-1-60558-246-7/09/04...$5.00.
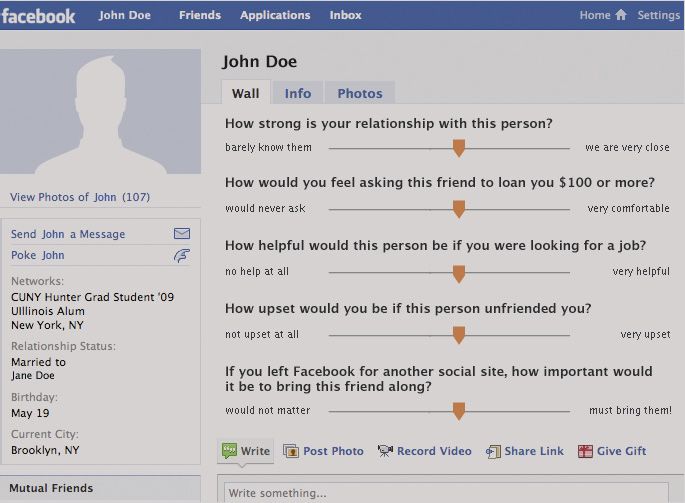
Figure 1. The questions used to assess tie strength, embedded into a friend’s profile as participants experienced them. An auto-
mated script guided participants through a random subset of their Facebook friends. As participants answered each question by
dragging a slider, the script collected data describing the friendship. The questions reflect a diversity of views on tie strength.

Definition and Impact                                               The Dimensions of Tie Strength
  The strength of a tie is a (probably linear) combination of the     At what point is a tie to be considered weak? This is not sim-
  amount of time, the emotional intensity, the intimacy (mutual       ply a question for the methodologically curious … the theory
  confiding), and the reciprocal services which characterize the      makes a curvilinear prediction. How do we know where we
  tie. [17]                                                           are on this theoretical curve? Do all four indicators count
                                                                      equally toward tie strength? [23]
While Granovetter left the precise definition of tie strength
to future work, he did characterize two types of ties, strong       Granovetter proposed four tie strength dimensions: amount
and weak. Strong ties are the people you really trust, people       of time, intimacy, intensity and reciprocal services. Subse-
whose social circles tightly overlap with your own. Often,          quent research has expanded the list. Ronald Burt proposed
they are also the people most like you. The young, the              that structural factors shape tie strength, factors like net-
highly educated and the metropolitan tend to have diverse           work topology and informal social circles [5]. Wellman and
networks of strong ties [31]. Weak ties, conversely, are            Wortley argue that providing emotional support, such as
merely acquaintances. Weak ties often provide access to             offering advice on family problems, indicates a stronger tie
novel information, information not circulating in the closely       [40]. Nan Lin, et al., show that social distance, embodied by
knit network of strong ties.                                        factors such as socioeconomic status, education level, po-
                                                                    litical affiliation, race and gender, influences tie strength
Many researchers have adopted tie strength as an analytic           [29].
framework for studying individuals and organizations [16].
(Google Scholar, for instance, claims that over 7,000 papers        In theory, tie strength has at least seven dimensions and
cite “The Strength of Weak Ties” [15].) The social support          many manifestations. In practice, relatively simple proxies
offered by strong ties can actually improve mental health           have substituted for it: communication reciprocity [11],
[36]. Banks that find the right mix of weak and strong ties         possessing at least one mutual friend [37], recency of com-
to other firms tend to get better financial deals [39]. It has      munication [28] and interaction frequency [13, 17]. In a
also been shown that weak ties, as opposed to strong ones,          1984 study, Peter Marsden used survey data from three met-
benefit job-seekers [18]. However, socioeconomic class              ropolitan areas to precisely unpack the predictors of tie
reverses this effect: job-seekers from lower socioeconomic          strength [33]. While quite useful, Marsden pointed out a
backgrounds often rely heavily on strong ties [16].                 key limitation of his work: the survey asked participants to
                                                                    recall only their three closest friends along with less than
Strong ties between employees from different organiza-              ten characteristics of the friendship.
tional subunits can help an organization withstand a time of
crisis [24]. Yet, strongly tied coworkers are also the ones         The present research can be seen as updating Marsden’s
likely to create crises by pushing for institutional change         work for the era of social media. Our work differs primarily
[23]. Employees who weakly tie themselves beyond organ-             in setting and scale. By leveraging social media, partici-
izational boundaries tend to receive better performance re-         pants no longer have to recall; we can take advantage of
views and generate more creative ideas [4]. Weak ties also          long friend lists and rich interaction histories. In this way,
act as a conduit for useful information in computer-                our work also overcomes the problem of retrospective in-
mediated communication [8]. However, weak ties often rely           formant accuracy [3, 30, 32]. In addition, a tie strength
on a few commonly available media [22], whereas strong              model built from social media has the potential to feed back
ties diversify, communicating through many channels [21].           into social media, in ways that benefit its users.
Research Questions Predictive Intensity Variables Distribution Max
The work above leads us to introduce two research ques-
Wall words exchanged 9549
tions that guide the remainder of this paper:
Participant-initiated wall posts 55
R1: The existing literature suggests seven dimensions of tie
strength: Intensity, Intimacy, Duration, Reciprocal Serv- Friend-initiated wall posts 47
ices, Structural, Emotional Support and Social Dis- Inbox messages exchanged 9
tance. As manifested in social media, can these dimen- Inbox thread depth 31
sions predict tie strength? In what combination?
Participant’s status updates 80
R2: What are the limitations of a tie strength model based
solely on social media? Friend’s status updates 200
METHOD Friend’s photo comments 1352
To answer our research questions, we recruited 35 partici-
Intimacy Variables
pants to rate the strength of their Facebook friendships. Our
goal was to collect data about the friendships that could act, Participant’s number of friends 729
in some combination, as a predictor for tie strength. Work- Friend’s number of friends 2050
ing in our lab, we used the Firefox extension Greasemonkey
[19] to guide participants through a randomly selected sub- Days since last communication 1115
set of their Facebook friends. (Randomly sampling partici- Wall intimacy words 148
pants’ friends guards against those with large networks Inbox intimacy words 137
dominating the results.) The Greasemonkey script injected
Appearances together in photo 73
five tie strength questions into each friend’s profile after the
page loaded in the browser. Figure 1 shows how a profile Participant’s appearances in photo 897
appeared to a participant. Participants answered the ques- Distance between hometowns (mi) 8182
tions for as many friends as possible during one 30-minute 6% engaged 32% married
Friend’s relationship status
session. On average, participants rated 62.4 friends ( = 30% single 30% in relationship
16.2), resulting in a dataset of 2,184 rated Facebook friend- Duration Variable
ships.
Days since first communication 1328
Social media experiments often employ completely auto-
mated data collection. We worked in the lab for two impor- Reciprocal Services Variables
tant reasons. First, we captured all data at the client side,
Links exchanged by wall post 688
after a page loaded at the user’s request. This allowed us to
stay within Facebook’s Terms of Service. More importantly, Applications in common 18
however, we asked participants to give us sensitive infor-
mation: their relationship strengths plus personal Facebook Structural Variables
data. We collected data in the lab to guard our participants’ Number of mutual friends 206
privacy and to increase the accuracy of their responses. Groups in common 12
Predictive Variables Norm. TF-IDF of interests and about 73
While participants responded to the tie strength questions,
our script automatically collected data about the participant, Emotional Support Variables
the friend and their interaction history. The tie strength lit-
erature reviewed in the previous section pointed to seven Wall & inbox positive emotion words 197
major dimensions of predictive variables. With these di- Wall & inbox negative emotion words 51
mensions as a guide, we identified 74 Facebook variables as
potential predictors of tie strength. Table 1 presents 32 of Social Distance Variables
these variables along with their distributions. In choosing Age difference (days) 5995
these predictive variables, we tried to take advantage of
Number of occupations difference 8
Facebook’s breadth while simultaneously selecting vari-
ables that could carry over to other social media. Below, we Educational difference (degrees) 3
clarify some variables listed in Table 1 and present those Overlapping words in religion 2
not included in the table. All predictive variables make an
Political difference (scale) 4
appearance either in the text or in Table 1.
Intensity Variables
Table 1. Thirty-two of over seventy variables used to predict
Each Facebook user has a Wall, a public communication tie strength, collected for each of the 2,184 friendships in our
channel often only accessible to a user’s friends. Wall words dataset. The distributions accompanying each variable begin
exchanged refers to the total number of words traded be- at zero and end at the adjacent maximum. Most variables are
tween the participant and the friend via Wall posting. Inbox not normally distributed. The Predictive Variables subsection
messages exchanged counts the number of appearances by a expands on some of these variables and presents those not
friend in a participant’s Facebook Inbox, a private commu- included in this table.nication channel. Inbox thread depth, on the other hand,
captures the number of individual Inbox messages sent be-
tween the pair. A helpful analogy for Inbox thread depth is
the number of messages in a newsgroup thread.
Intimacy Variables
To complement our aggregate measures, we used the Lin-
guistic Inquiry and Word Count (LIWC) dictionary to per-
form content analysis [34]. Our hypothesis was that friends
of different tie strengths would use different types of words Table 2. The five questions used to assess tie strength, accom-
when communicating. LIWC matches text against lists of panied by their distributions. The distributions present par-
word stems assembled into categories. Wall intimacy words ticipant responses mapped onto a continuous 0–1 scale. Our
refers to the number of Wall words matching at least one of model predicts these responses as a function of the variables
eleven LIWC categories: Family, Friends, Home, Sexual, presented in Table 1.
Swears, Work, Leisure, Money, Body, Religion and Health.
Similarly, Inbox intimacy words refers to the number of networks often map to universities, companies and geo-
Inbox words matching at least one of these categories. The graphic areas.
Home category, for example, includes words like backyard Emotional Support Variables
and roommate, while the Work category includes busy, In a way similar to the content analysis variables described
classes and commute. In total, the intimacy variables above, Wall & inbox positive emotion words is two vari-
checked for matches against 1,635 word stems. Although ables referring to matches against the LIWC category Posi-
not presented in Table 1, we also included each LIWC inti- tive Emotion. The Positive Emotion category includes
macy category as its own predictive variable. words like birthday, congrats and sweetheart. Similarly,
Days since last communication measures the recency of Wall & inbox negative emotion words is two variables
written communication in some Facebook channel (Wall, counting matches in the Negative Emotion category, includ-
Inbox, photo comments) from the day we collected data. ing words like dump, hate and useless. We also recorded the
number of gifts given between a participant and a friend. A
Duration Variable Facebook gift is a small icon often given to a friend to show
We did not have access to the date when two people became support. Gifts sometimes cost a small amount of money.
friends. Instead, Days since first communication is a proxy
for the length of the friendship. It measures time in the Social Distance Variables
same way as Days since last communication. We measured the difference in formal education between a
participant and a friend in terms of academic degrees. It is
Reciprocal Services Variables computed by searching for the letters BS, BA, MS, MA, JD,
Facebook friends have relatively few opportunities to ex- MD and PhD in the education profile field. Educational
change informational, social or economic goods. (These difference measures the numeric difference between a par-
practices clearly differ by social media; consider a LinkedIn ticipant and a friend along a scale: 0: None, 1: BS/BA, 2:
user who exploits his social capital by introducing business MS/MA, 3: JD/MD/PhD.
contacts to one another.) To capture Reciprocal Services on
Facebook, Links exchanged by wall post measures the 1,261 people in our dataset completed the politics profile
number of URLs passed between friends via the Wall, a field. Of those, 79% reported their political affiliation as
common Facebook practice. Similarly, Applications in very conservative, conservative, moderate, liberal or very
common refers to the number of Facebook applications a liberal. Assigning a scale in that order, Political difference
participant and friend share. Facebook applications usually measures the numeric difference between a participant and
provide a tightly scoped service (e.g., displaying a virtual a friend. While the education and politics scales do not
bookshelf on a profile) and often spread between friends by completely reflect the diversity of our sample, they do pro-
word of mouth. vide useful tools for assessing the importance of these vari-
ables for the majority of it.
Structural Variables
Facebook allows users to join groups organized around spe- Demographic and Usage Variables
cific topics and interests. Groups in common refers to the Finally, in addition to the variables described above, we
number of Facebook groups to which both the participant collected demographic and usage information on our par-
and the friend belong. Normalized TF-IDF of interests and ticipants and their friends: gender, number of applications
about measures the similarity between the free text interests installed, number of inbox messages, number of wall posts
and about profile fields. It does so by computing the dot and number of photo comments.
product between the TF-IDF vectors representing the text. Dependent Variables
TF-IDF is a standard information retrieval technique [10] Previous literature has proposed various manifestations of
that respects the baseline frequencies of different words in tie strength [17, 18, 21, 24]. To capture a diversity of views,
the English language. We also measured Number of over- we asked our participants to answer five tie strength ques-
lapping networks, the number of Facebook networks to tions. Participants moved a slider along a continuum to rate
which both the participant and the friend belong. Facebook a friend. Figure 1 shows how those questions were embed-ded into a friend’s profile. Table 2 illustrates the responses.
We chose a continuum instead of a discrete scale for three
reasons. First, Mark Granovetter conjectured that tie
strength may in fact be continuous [17]. The literature has
not resolved the issue, let alone specified how many dis-
crete tie strength levels exist. A continuum bypasses that
problem. Second, a continuum lends itself to standard mod-
eling techniques. Finally, applications can round a continu-
ous model’s predictions to discrete levels as appropriate.
Participants
Our 35 participants, primarily students and staff from the
University of Illinois community, came from more than 15
different academic departments. The sample consisted of 23
women (66%) and 12 men (34%) ranging between 21 and
41 years old, with a mean and median of 26. The minimum
number of Facebook friends was 25; the maximum was 729
(median of 153). In terms of age and number of friends,
previous empirical work suggests that our participants fall
within the mainstream of Facebook users [14, 35]. All par-
ticipants used Facebook regularly and had been members
for at least one year.
Statistical Methods
We modeled tie strength as a linear combination of the pre-
dictive variables, plus terms for dimension interactions and
network structure:
Figure 2. The model’s Adjusted R2 values for all five depend-
ent variables, broken down by the model’s three main terms.
Modeling interactions between tie strength dimensions results
in a substantial performance boost. The model performs best
on Loan $100? and How strong?, the most general question.
More complex models were explored, but a (mostly) linear friends: mean, median, variance, skew, kurtosis, minimum
model allows us to take advantage of the full dataset and and maximum. These terms belong to the Structural dimen-
explain the results once it is built. In the equations above, si sion. However, N(i) introduces a dependency: every tie
represents the tie strength of the ith friend. Ri stands for the strength now depends on other tie strengths. How can we
vector of 67 individual predictive variables. εi is the error incorporate the tie strengths of mutual friends when it is tie
term. Di represents the pairwise interactions between the strength we want to model in the first place? To solve this
dimensions presented in Table 1. Pairwise interactions are problem, we fit the equations above using an iterative varia-
commonly included in predictive models [12]; in this case, tion of OLS regression. In each iteration, the tie strengths
including all pairwise interactions would force more vari- from the previous round are substituted to calculate N(i),
ables than data points into the model. Instead, we nomi- with all si initially set to zero. (Note that N(i) is mostly lin-
nated variables with the fewest missing values to represent ear in the predictive variables.) Using this procedure, all si
each dimension. (Not every participant or friend contributes converged in nine iterations (0.001 average relative change
every variable.) Di represents all pairwise interactions be- threshold). This approach parallels other “neighborhood
tween the 13 variables with a 90% or greater completion effect” models [6].
rate. Choosing 90% as a threshold ensured that every di-
mension was represented. To the best of our knowledge, We did not standardize, or “ipsatize” [9], the dependent
exploring the interactions between the dimensions of tie variables. Because we employed network subsampling, we
strength is a novel approach. could not be sure participants saw the Facebook friend they
would rate highest or lowest. Furthermore, not all real-life
N(i) encodes network structure. It captures the idea that a friends have Facebook accounts. It is reasonable to assume
friendship’s tie strength not only depends on its history, but that some participants would reserve the ends of the spectra
also on the tie strengths of mutual friends. In other words, it for people our experiment would never turn up. Finally, to
models the idea that a friend who associates with your busi- account for the violations of normality exhibited by the
ness acquaintances is different than one who knows your distributions in Table 1, every variable is log-transformed.
mother, brother and sister. Since every friend has a poten-
tially unique set of mutual friends, the model uses seven
descriptors of the tie strength distribution over mutualTop 15 Predictive Variables β F p-value
Days since last communication -0.76 453 < 0.001
Days since first communication 0.755 7.55 < 0.001
Intimacy × Structural 0.4 12.37 < 0.001
Wall words exchanged 0.299 11.51 < 0.001
Mean strength of mutual friends 0.257 188.2 < 0.001
Educational difference -0.22 29.72 < 0.001
Structural × Structural 0.195 12.41 < 0.001
Reciprocal Serv. × Reciprocal Serv. -0.19 14.4 < 0.001
Participant-initiated wall posts 0.146 119.7 < 0.001
Inbox thread depth -0.14 1.09 0.29
Participant’s number of friends -0.14 30.34 < 0.001
Inbox positive emotion words 0.135 3.64 0.05
Social Distance × Structural 0.13 34 < 0.001
Figure 3. The predictive power of the seven tie strength dimen- Participant’s number of apps -0.12 2.32 0.12
sions, presented here as part of the How strong? model. A di-
mension’s weight is computed by summing the absolute values Wall intimacy words 0.111 18.15 < 0.001
of the coefficients belonging to it. The diagram also lists the
top three predictive variables for each dimension. On average, Table 3. The fifteen predictive variables with highest standard-
the model predicts tie strength within one-tenth of its true ized beta coefficients. The two Days since variables have large
value on a continuous 0–1 scale. coefficients because of the difference between never communi-
cating and communicating once. The utility distribution of the
RESULTS predictive variables forms a power-law distribution: with only
Because each participant rated more than one friend, obser- these fifteen variables, the model has over half of the informa-
vations within a participant were not independent. This is a tion it needs to predict tie strength.
common obstacle for ego-centric designs. To roughly adjust
for it, all of the results presented here cut the degrees of asking this friend to loan you $100 or more? However, it
freedom in half, a technique borrowed from the social net- does not fit the last three questions as well. The lower per-
works literature [33]. formance on these questions may have resulted from par-
ticipant fatigue. We considered randomizing the questions
On the first tie strength question, How strong is your rela- for each friend to account for ordering effects like fatigue,
tionship with this person?, the model fits the data very well: but we feared that randomizing would confuse and frustrate
Adj. R2 = 0.534, p < 0.001. It achieves a Mean Absolute Er- our participants, contributing to lower accuracy across the
ror of 0.0994 on a continuous 0–1 scale, where 0 is weakest board. Therefore, we chose to prioritize the first question,
and 1 is strongest. In other words, on average the model the most general of the five. With the exception of How
predicts tie strength within one-tenth of its true value. This helpful would this person be if you were looking for a job?,
error interval tightens near the ends of the continuum be- all dependent variable intercorrelations were above 0.5 (Ta-
cause predictions are capped between 0 and 1. In addition, ble 4).
we found strong evidence of four dimension interactions (p
< 0.001): Intimacy × Structural, F1,971 = 12.37; Social Dis- Figure 3 visualizes the predictive power of the seven tie
tance × Structural, F1,971 = 34; Reciprocal Services × Recip- strength dimensions as part of the How strong? model. The
rocal Services, F1,971 = 14.4; Structural × Structural, F1,971 = figure also includes each dimension’s top three contributing
12.41. As we demonstrate shortly, the Structural dimension variables. The weight of a dimension is calculated by sum-
plays a minor role as a linear factor. However, it has an im- ming the coefficients of the the variables belonging to it.
portant modulating role via these interactions. One way to Although not uniformly distributed, no one dimension has a
read this result is that individual relationships matter, but monopoly on tie strength.
they get filtered through a friend’s clique before impacting Table 3 presents the standardized beta coefficients of the
tie strength. top fifteen predictive variables. The F statistics signify a
Figure 2 summarizes the model’s performance on all five variable’s importance in the presence of the other variables.
tie strength questions, broken down by the model’s three The two Days since variables have such high coefficients
main terms. Modeling dimension interactions boosts per- due to friends that never communicated via Facebook.
formance significantly, with smaller gains associated with Those observations were assigned outlying values: zero in
modeling network structure. The model fits the second tie one case and twice the maximum in the other. In other
strength question as well as the first: How would you feel words, the simple act of communicating once leads to aCorrelations Strong Loan Job Un Bring
Strong 1 0.69 0.45 0.75 0.7
Loan 0.69 1 0.4 0.55 0.55
Job 0.45 0.4 1 0.5 0.46
Unfriend 0.75 0.55 0.5 1 0.74
Bring 0.7 0.55 0.46 0.74 1
Table 4. The intercorrelations of the five dependent variables.
With the exception of Job-Strong, Job-Loan and Bring-Job, the
dependent variables are well-correlated with one another.
We went to the same high school and have a few dozen
common friends. We've never interacted with each other on
Facebook aside from the friending.
rating: 0; prediction: 0.44
Notice how the participant recalls that “he friended me.”
Although these friends had communicated via Facebook
only twice (the participant mistakenly recalled “never”), the
friend’s clique confused the model. The friend came from a
group of relatively strong friends. As we mentioned earlier,
Figure 4. The model’s performance across all ties in our data- the model filters individual relationships through cliques,
set. There is a strong correlation, yet the model shows a slight leading to the high residual. Perhaps having deeper network
bias toward underestimation, represented as the larger cloud knowledge could help, such as how the mutual friends see
in the bottom-right of the figure. The gap in the center results this friend. But this is beyond our ego-centric design.
from participants’ inclination to move the slider from its start-
ing point, if only slightly. Asymmetric Friendships
Two participants rated a friend highly because of how the
friendship compared to others like it. In one case, a partici-
very large movement in tie strength. Educational difference
pant described a close bond with a professor:
plays a large role in determining tie strength, but that may
reflect the university community from which we sampled This is a professor from one of the classes I TA-ed. We have a
participants. Curiously, Inbox thread depth has a negative very good relationship, because in the past we have worked
effect on tie strength; the more messages friends exchange out a lot of difficult class problems. The professor still re-
members my name, which for some of my “friends” on Face-
on a single topic, the lower their tie strength. It is important book may not be true. But not only that, she also knows how
to note that Table 3 orders the variables by their weights, or things are going at school, and when we meet in a hallway we
β coefficients, not their p-values. The p-value for Inbox usually stop for a little chat, rather then exchanging casual
thread depth does not express confidence in its coefficient; “Hi! Hello!” conversation.
it expresses confidence in its utility relative to other vari- rating: 0.85; prediction: 0.41
ables. (The coefficient confidence is greater than 99.9%.) Educational difference and the directionality of the wall
For example, Inbox thread depth is highly correlated with posts pushed this prediction toward weak tie. Many people
Inbox intimacy words, resulting in a lower F statistic. would not remark that a close friend “remembers my
Figure 4 compares the model’s prediction to participant name.” However, in the context of this participant’s “net-
responses across the entire dataset. The figure illustrates a working” friends, the professor breaks the mold.
strong correlation and another view on the MAE presented Participants’ responses often revealed the complexity of
above. We discuss the practical significance of the findings real-life relationships, both online and offline. One partici-
illustrated in Figure 4, along with the discretization of tie pant grounded her rating not in the present, but in the hope
strength, in the next section. of reigniting a friendship:
Error Analysis Interviews Ah yes. This friend is an old ex. We haven't really spoken to
The model performs well, but not perfectly. To understand each other in about 6 years, but we ended up friending each
its limitations, we conducted ten follow-up interviews about other on Facebook when I first joined. But he's still important
the friendships we had the most difficulty predicting. After to me. We were best friends for seven years before we dated.
identifying the friends with the highest residuals, we asked So I rated it where I did (I was actually even thinking of rat-
participants to tell us about this particular friendship, in- ing it higher) because I am optimistically hoping we’ll re-
cluding anything that makes it special. For instance, one cover some of our “best friend”-ness after a while. Hasn't
happened yet, though.
participant described a “friend” he barely knew: rating: 0.6; prediction: 0.11
I don't know why he friended me. But I'm easy on Facebook,
because I feel like I'm somehow building (at least a miniscule
amount of) social capital, even when I don't know the person.Confounding the Medium is correspondingly above or below the mean in the partici-
As might be expected, Facebook friends do not only stick to pant dataset. The How strong? model classifies with 87.2%
Facebook. One participant described a close friendship with accuracy using this procedure, significantly outperforming
a diverse digital trail: the baseline, χ2(1, N = 4368) = 700.9, p < 0.001. (Note that
This friend is very special. He and I attended the same high this situation does not require more sophisticated evaluation
school, we interacted a lot over 3 years and we are very very techniques, like cross-validation, because the model is
close. We trust each other. My friend are I are still interacting highly constrained and the threshold is not learned.)
in ways other than Facebook such as IM, emails, phones.
Unfortunately, that friend and I rarely interact through Face- Some predictive variables surprised us. For instance, Inbox
book so I guess your predictor doesn't have enough informa- thread depth negatively (and strongly) affects tie strength.
tion to be accurate. This finding also clashes with existing work. In [41], Whit-
rating: 0.96; prediction: 0.47 taker, et al., report that familiarity between Usenet posters
increases thread depth. One way to resolve this disparity is
However, even friends that stick to Facebook sometimes do
to note that there may be a fundamental difference between
so in unexpected ways:
the completely private threads found on Facebook (essen-
We were neighbors for a few years. I babysat her child multi- tially a variant of email) and Usenet’s completely public
ple times. She comes over for parties. I'm pissed off at her ones. Common ground theory [7] would suggest that strong
right now, but it's still 0.8. ;) Her little son, now 3, also has
ties can communicate very efficiently because of their
an account on Facebook. We usually communicate with each
other on Facebook via her son's account. This is our “1 mu- shared understanding, perhaps manifesting as shorter Inbox
tual friend.” threads. Educational difference also strongly predicts tie
rating: 0.8; prediction: 0.28 strength, with tie strength diminishing as the difference
grows. This may have resulted from the university commu-
This playful use of Facebook clearly confused our model.
nity to which our participants belonged. On the other hand,
With the exception of the Social Distance dimension, all
the result may have something to do with Facebook itself, a
indicators pointed to a weak tie. In fact, it is hard to imagine
community that spread via universities. Some variables we
a system that could ever (or should ever) pick up on scenar-
suspected to impact tie strength did not. Number of over-
ios like this one.
lapping networks and Age difference, while intuitively good
DISCUSSION predictors, made little appreciable difference to tie strength.
Our results show that social media can predict tie strength. (β = 0.027, F1,971 = 3.08, p = 0.079 and β = -0.0034, F1,971 =
The How strong? model predicts tie strength within one- 10.50, p = 0.0012, respectively.)
tenth of its true value on a continuous 0–1 scale, a resolu-
tion probably acceptable for most applications. In other The error analysis interviews illustrate the inherent com-
words, discretizing our continuum onto a 10-point Likert plexity of some relationships. They also point the way to-
scale, the How strong? model would usually miss by at ward future research. A model may never, and perhaps
most one point. The Intimacy dimension makes the greatest should never, predict some relationships. Wanting to recon-
contribution to tie strength, accounting for 32.8% of the nect with an ex-boyfriend comes to mind. Relationships
model’s predictive capacity. This parallels Marsden’s find- like these have powerful emotions and histories at play.
ing that emotional closeness best reflects tie strength [33]. However, it may be possible to make better predictions
However, the Intensity dimension also contributes substan- about relationships like the professor-student one, a strong
tially to the model, contrasting with Marsden’s finding that relationship relative to others like it. Incorporating organ-
Intensity has significant drawbacks as a predictor. One way izational hierarchy may also improve a system’s ability to
to explain this discrepancy is that the sheer number of peo- reason about relationships like these. Merging deeper net-
ple available through social media strengthens Intensity as a work knowledge with data about who extended the friend
predictor. In other words, when you choose to interact with request also looks promising, as evidenced by the “he
someone over and over despite hundreds of people from friended me” interview.
which to choose, it significantly informs tie strength. The Practical Implications
number of variables representing each dimension also plays We foresee many opportunities to apply tie strength model-
a role in its overall impact. For example, Emotional Support ing in social media. Consider privacy controls that under-
might impact tie strength more if more variables repre- stand tie strength. When users make privacy choices, a sys-
sented it. (Emotional Support is particularly hard to quan- tem could make educated guesses about which friends fall
tify.) However, more variables does not always equal into trusted and untrusted categories. This might also de-
greater impact. As Duration illustrates, a single variable can pend on media type, with more sensitive media like photos
account for a large part of the model’s predictive capacity. requiring higher tie strengths. The approach would not help
users set privacy levels for brand new friends, ones with
Some applications will not need 10-point resolution; the
whom there is no interaction history. Yet, it has two main
coarse categories of strong and weak may suffice. In “The
advantages over the current state of the art: it adapts with
Strength of Weak Ties,” Granovetter himself performs his
time, and it establishes smart defaults for users setting ac-
analytic work with only these approximate distinctions. One
cess levels for hundreds of friends.
way to accomplish this is to use the model’s mean, classify-
ing all friends above it as strong and all below it as weak. Or, imagine a system that only wants to update friends with
Correct predictions are those where the participant’s rating novel information. Broadcasting to weak ties could solvethis problem. Consider a politician or company that wants analyses, perhaps even joining a social media model with
to broadcast a message through the network such that it real-world data, may enable novel conclusions about whole
only passes through trusted friends. Because strongly tied systems [26].
friends often reconcile their interests [17], a politician Limitations
might look for new supporters among the strong ties of an We purposely worked from theory to extend this research
existing one. Limiting the message’s audience in this way beyond just Facebook. The specific predictive variable co-
may increase the success rate relative to the effort ex- efficients may not move beyond Facebook, but the dimen-
pended. sion weights may. That being said, this work looks only at
Social media has recently started suggesting new friends to one social media site, at one time, using data available
users. However, sometimes we choose not to friend some- through the browser. We look forward to work evaluating
one with good reason. For instance, a strong tie of a strong the utility of “behind-the-scenes” data and to work contrast-
tie is not necessarily a friend at all: consider the beloved ing these findings with other social media.
cousin of a best friend. Granovetter writes, “if strong ties CONCLUSION
A–B and A–C exist, and if B and C are aware of one an- In this paper, we have revealed a specific mechanism by
other, anything short of a positive tie would introduce a which tie strength manifests itself in social media. Many
‘psychological strain’ into the situation” [17]. A system that paths open from here. Social media designers may find trac-
understands tie strength might avoid “strain” by steering tion fusing a tie strength model with a range of social media
clear of these delicate situations. In fact, weak ties of exist- design elements, including privacy controls and information
ing friends may make better friend candidates, as it is less prioritization. Our follow-up interviews suggest profitable
likely that users have already declined to friend them. More lines of future work. We hope that researchers in this field
broadly, systems that understand tie strength might apply it will find important new theoretical questions in this work,
to make better friend introductions, although deeper study as well as opportunities to use tie strength to make new
would need to uncover how best to use it in this context. conclusions about large-scale social phenomena.
Recent work suggests that the average number of social We believe this work addresses fundamental challenges for
media friends continues to grow, currently above 300 [25]. understanding users of socio-technical systems. How do
With users keeping so many friends, social media has users relate to one another in these spaces? Do the data left
started to consolidate friend activity into a single stream. behind tell a consistent story, a story from which we can
Facebook calls this the Newsfeed. However, the multiplica- infer something meaningful? We think this work takes a
tive nature of the types of friends crossed with the types of significant step toward definitively answering these ques-
updates, e.g., photos, status, new friends, comments, etc., tions.
presents a difficult design problem. A system that prioritizes
via tie strength, or allows users to tune parameters that in- ACKNOWLEDGMENTS
corporate tie strength, might provide more useful, timely This work was funded in part by NSF Grant 0643502 and
and enjoyable activity streams. by Microsoft. We thank Keith Hampton, Caroline Hay-
thornthwaite, Cliff Lampe, Scott Golder and the entire So-
Theoretical Implications cial Spaces group for early feedback on this work. We also
There is still more variance to understand. Certainly, more thank Carolyn Gilbert, who in no way helped this paper get
predictive variables could help, such as “behind-the-scenes” written, but is wonderful so she gets mentioned anyway.
data like who friended who. However, throwing more data
at the problem might not solve it; perhaps social media REFERENCES
needs novel indicators. This raises new questions for theory. 1. Adamic, L. A. and Adar, E. 2003. Friends and neighbors
When modeling tie strength exclusively from social media, on the Web. Social Networks, 25(3), 211–230.
do we necessarily miss important predictors? What is the 2. Albert, R. and Barabási, A. L. 2002. Statistical
upper limit of tie strength predictability? Mechanics of Complex Networks. Reviews of Modern
We believe our work makes three important contributions to Physics, 74(1).
existing theory. First, we defined the importance of the di- 3. Bernard, H. R., Killworth, P., et al. 1984. The Problem
mensions of tie strength as manifested in social media. This of Informant Accuracy: The Validity of Retrospective
is novel especially in light of the fact that these weights do Data. Annual Review of Anthropology, 13, 495–517.
not always align with prior work. Second, we showed that
4. Burt, R. S. 2004. Structural Holes and Good Ideas.
tie strength can be modeled as a continuous value. Third,
American Journal of Sociology, 110(2), 349–399.
our findings reveal how the Structural dimension modulates
other dimensions by filtering individual relationships 5. Burt, R. Structural Holes: The Social Structure of
through cliques. Previously, it was not well-understood how Competition. Harvard University Press, 1995.
or if tie strength dimensions interacted. 6. Chopra, S., Thampy, T., et al. Discovering the Hidden
Finally, we see a home for our results in social network Structure of House Prices with a Non-parametric Latent
analysis. Most work to date has assumed a present link or Manifold Model. Proc. KDD, 2007. 173–182.
an absent link, omitting properties of the link itself. Intro- 7. Clark, H. H. Arenas of Language Use. University Of
ducing a complete tie strength model into social network Chicago Press, 1993.8. Constant, D., Sproull, L., et al. 1996. The Kindness of 25. Lampe, C., Ellison, N., et al. Changes in Participation
Strangers: The Usefulness of Electronic Weak Ties for and Perception of Facebook. Proc. CSCW, 2008. 721–
Technical Advice. Organization Science, 7(2), 119–135. 730.
9. Cunningham, W. H., Cunningham, I. C., et al. 1977. 26. Laumann, E. O., Gagnon, J. H., et al. 1989. Monitoring
The Ipsative Process to Reduce Response Set Bias. the AIDS Epidemic in the United States: A Network
Public Opinion Quaterly, 41(3), 379–384. Approach. Science, 244(4909), 1186–1189.
10. Frakes, W. B. and Baeza-Yates, R. Information 27. Liben-Nowell, D. and Kleinberg, J. The Link Prediction
Retrieval: Data Structures and Algorithms. Prentice Problem for Social Networks. Proc. of the 12th
Hall, 1992. international conference on Information and knowledge
11. Friedkin, N. E. 1980. A Test of Structural Features of management, 2003. 556–559.
Granovetter's Strength of Weak Ties Theory. Social 28. Lin, N., Dayton, P. W., et al. 1978. Analyzing the
Networks, 2, 411–422. Instrumental Use of Relations in the Context of Social
12. Gergle, D., Kraut, R. E., et al. The Impact of Delayed Structure. Sociological Methods Research, 7(2), 149–
Visual Feedback on Collaborative Performance. Proc. 166.
CHI, 2006. 1303–1312. 29. Lin, N., Ensel, W. M., et al. 1981. Social Resources and
13. Gilbert, E., Karahalios, K., et al. The Network in the Strength of Ties: Structural Factors in Occupational
Garden: An Empirical Analysis of Social Media in Status Attainment. American Sociological Review,
Rural Life. Proc. CHI, 2008. 1603–1612. 46(4), 393–405.
14. Golder, S., Wilkinson, D. M., et al. Rhythms of Social 30. Marin, A. 1981. Are Respondents More Likely To List
Interaction: Messaging Within a Massive Online Alters with Certain Characteristics?: Implications for
Network. Proc. 3rd International Conference on Name Generator Data. Social Networks, 26(4), 289–
Communities and Technologies (CT2007), 2007. 307.
15. Google Scholar. 31. Marsden, P. V. 1981. Core Discussion Networks of
http://scholar.google.com/scholar?q=weak+ties. Americans. American Sociological Review, 52(1), 122–
Accessed September 16, 2008. 131.
16. Granovetter, M. 1983. The Strength of Weak Ties: A 32. Marsden, P. V. 1990. Network Data and Measurement.
Network Theory Revisited. Sociological Theory, 1, Annual Review of Sociology, 16(1), 435–463.
201–233. 33. Marsden, P. V. and Campbell, K. E. 1990. Measuring
17. Granovetter, M. S. 1973. The Strength of Weak Ties. Tie Strength. Social Forces, 63(2), 482–501.
The American Journal of Sociology, 78(6), 1360–1380. 34. Pennebaker, J. W. and Francis, M. E. Linguistic Inquiry
18. Granovetter, M. Getting a Job: A Study of Contacts and and Word Count. Lawrence Erlbaum, 1999.
Careers. University Of Chicago Press, 1974. 35. Rapleaf. RapLeaf Study of Social Network Users vs.
19. Greasemonkey. http://www.greasespot.net. Accessed Age. http://business.rapleaf.com/company_press_2008_
September 16, 2008. 06_18.html. Accessed September 16, 2008.
20. Hansen, M. T. 1999. The Search-Transfer Problem: 36. Schaefer, C., Coyne, J. C., et al. 1990. The
The Role of Weak Ties in Sharing Knowledge Across Health-related Functions of Social Support. Journal of
Organization Subunits. Administrative Science Behavioral Medicine, 4(4), 381–406.
Quarterly, 44(1), 82–111. 37. Shi, X., Adamic, L. A., et al. 2007. Networks of Strong
21. Haythornthwaite, C. 2002. Strong, Weak, and Latent Ties. Physica A: Statistical Mechanics and its
Ties and the Impact of New Media.. Information Applications, 378(1), 33–47.
Society, 18(5), 385–401. 38. Tahmincioglu, E. Facebook Friends As Job References?
22. Haythornthwaite, C. and Wellman, B. 1998. Work, http://www.msnbc.msn.com/id/26223330. Accessed
Friendship, and Media Use for Information Exchange in September 16, 2008.
a Networked Organization. J. Am. Soc. Inf. Sci., 49(12), 39. Uzzi, B. 1999. Embeddedness in the Making of
1101–1114. Financial Capital: How Social Relations and Networks
23. Krackhardt, D. The Strength of Strong Ties: The Benefit Firms Seeking Financing. American
Importance of Philos in Organizations. In N. Nohria and Sociological Review, 64(4), 481–505.
R. Eccles (Ed.), Networks and Organizations: Structure, 40. Wellman, B. and Wortley, S. 1990. Different Strokes
Form and Action (216–239). Boston, MA: Harvard from Different Folks: Community Ties and Social
Business School Press. Support. The American Journal of Sociology, 96(3),
24. Krackhardt, D. and Stern, R. N. 1988. Informal 558–588.
Networks and Organizational Crises: An Experimental 41. Whittaker, S., Terveen, L., et al. The Dynamics of Mass
Simulation. Social Psychology Quarterly, 51(2), 123– Interaction. Proc. CSCW, 1998. 257–264.
140.You can also read