Eight Existing Poverty Initiatives in NZ and the UK: A compilation - Working Paper 2017/04
←
→
Page content transcription
If your browser does not render page correctly, please read the page content below
Title page

 July 2017
 Working Paper 2017/04

 Eight Existing
 Poverty Initiatives
 in NZ and the UK:
 A compilation
Working Paper 2017/04

Fact Sheets on Existing
Initiatives: A compliation
July 2017
Title                     Working Paper 2017/04 – Eight Existing Poverty Initiatives in NZ and the UK:
                          A compilation

Published                 Copyright © McGuinness Institute, July 2017

                          ISBN 978-1-98-851842-8 (Paperback)
                          ISBN 978-1-98-851843-5 (PDF)

                          This document is available at www.mcguinnessinstitute.org and may be reproduced or
                          cited provided the source is acknowledged.

Prepared by               The McGuinness Institute, as part of the TacklingPovertyNZ project.

Authors                   Alexander Jones and Ali Bunge

Research team             Ella Reilly and Eleanor Merton

For further information   McGuinness Institute
                          Phone (04) 499 8888
                          Level 2, 5 Cable Street
                          PO Box 24222
                          Wellington 6142
                          New Zealand
                          www.mcguinnessinstitute.org

Disclaimer                The McGuinness Institute has taken reasonable care in collecting and presenting the
                          information provided in this publication. However, the Institute makes no representation
                          or endorsement that this resource will be relevant or appropriate for its readers’ purposes
                          and does not guarantee the accuracy of the information at any particular time for any
                          particular purpose. The Institute is not liable for any adverse consequences, whether
                          they be direct or indirect, arising from reliance on the content of this publication. Where
                          this publication contains links to any website or other source, such links are provided
                          solely for information purposes and the Institute is not liable for the content of any such
                          website or other source.

Publishing                This publication has been produced by companies applying sustainable practices within
                          their businesses. The body text and cover is printed on DNS paper, which is FSC certified.

                          The McGuinness Institute is grateful for the work of Creative Commons, which
                          inspired our approach to copyright. This work is available under a Creative Commons
                          Attribution-Noncommercial-Share Alike 3.0 New Zealand License.
                          To view a copy of this license visit:
                          www.creativecommons.org/licenses/by-nc-nd/3.0/nz
Contents Introduction_____________________________________________________________________________ 1 Fact Sheet A: Place-based initiatives (PBIs)_____________________________________________________ 2 Fact Sheet B: Whänau Ora _________________________________________________________________ 8 Fact Sheet C: Contract Mapping____________________________________________________________ 11 Fact Sheet D: Children’s Teams____________________________________________________________ 21 Fact Sheet E: Social Sector Trials___________________________________________________________ 24 Fact Sheet F: Regional Growth Programme__________________________________________________ 28 Fact Sheet G: The Greater Manchester Experiment (UK)_______________________________________ 32 Fact Sheet H: UK Estate Regeneration Fund__________________________________________________ 35
Introduction
This working paper brings together a compilation of fact sheets intended to explore the landscape
of existing initiatives that target poverty in New Zealand and the UK. Along with Working Paper
2017/01 – TacklingPovertyNZ 2016 Tour: Methodology, results and observations and Working Paper
2017/03 – Key Graphs on Poverty in New Zealand: A compilation, this working paper forms part of
the background research for the Institute’s Demarcation Zones for Public Policy Innovation proposal
and Project TacklingPovertyNZ. It is important to acknowledge the complexity of the issues that
TacklingPovertyNZ and the Demarcation Zones proposal are trying to address. It is because of this
complexity that the evidence-based research in the TacklingPovertyNZ working papers is so vital.

The fact sheets cover a variety of existing initiatives in New Zealand, such as placed-based initiatives,
Whänau Ora and Contract Mapping, as well as information on the Greater Manchester Experiment
and the UK Estate Regeneration Fund, which are experimental policy reforms in the UK. Each
fact sheet provides a broad outline of the initiative and attempts to analyse its successes and failures
where appropriate. It is our intention that this information will allow New Zealand to learn from
existing achievements and criticisms, applying knowledge to our own work where possible. Both the
Demarcation Zones for Public Policy Innovation and Project TacklingPovertyNZ seek to
change the way we think about poverty, and we acknowledge the importance of understanding
successes, both in New Zealand and internationally, in order to move forward.

More about the Demarcation Zones proposal

The Demarcation Zones proposal, presented to Prime Minister Bill English in late 2016, laid out
an experimental approach to public policy reform in regions with some of the highest levels of
deprivation and hardship in New Zealand. The proposed demarcation zones would be areas separated
out from existing governance and funding structures in order to allow policy reform tailored
to the specific needs of that region. The proposal was a response to the findings of the series of
TacklingPovertyNZ regional one-day workshops in 2016. One such finding was that the status quo
in the visited areas is not working. The other significant finding was that a one-size-fits-all approach
will not achieve satisfactory results; initiatives aimed at alleviating poverty must remain localised
and should allow for separate regions to experiment with policy that will work for their unique
community and its challenges.

More about Project TacklingPovertyNZ

Project TacklingPovertyNZ was originally launched in 2015 with a workshop that brought 36 young
New Zealanders together to discuss and formulate solutions for how to tackle poverty in
New Zealand. Participants found that ‘assuming that one solution will work for everyone indicates
a failure to address cultural disparities and injustices, and an ignorance of the diversity of our
population’.1 In 2016 the project expanded to include the nationwide series of workshops in which
the 2015 workshop cohort assisted the McGuinness Institute. The workshop series aimed to provide
a platform to better assess how poverty is understood within a multitude of different communities by
directly working with the locals in those communities.

1   TacklingPovertyNZ workshop participants. (2016). TacklingPovertyNZ: Exploring ways to reduce poverty in New Zealand, p. 7. Retrieved 10 July 2017
    from www.mcguinnessinstitute.org/wp-content/uploads/2017/02/20170227-TacklingPovertyNZ-publication-final-WEB.pdf.

                                                        WORKING PAPER 2017/04 | 1
                                                           MCGUINNESS INSTITUTE
Fact Sheet A: Place-based initiatives (PBIs)
WORKING PAPER 2017/04 | 2
MCGUINNESS INSTITUTEPlace-based initiatives (PBIs)
Overview
Three unique PBIs have been established in New Zealand to date. They are assisted by an agency-
neutral National Support Team and receive analytical and data support from the Social Investment
Unit. The PBIs all use a social investment approach to improve outcomes for at-risk children and
their families. Social investment involves using ‘the expert knowledge and judgement of local decision-
makers, in conjunction with national level data and analysis in order to gain a much improved
understanding of what the local needs are’.2 Social investment also involves putting at-risk children
and their families at the heart of service provision, and carefully evaluating results to ensure that local
needs are being met and outcomes are improving. The three regions for the PBIs were selected because
of their high numbers and high proportions of at-risk 0–24 year olds, and based on their local capacity
and capabilities. There are varying levels of local government involvement in each PBI; the Deputy
Mayor of Gisborne and District sits on the board of Manaaki Tairäwhiti and a council representative
sits on the South Auckland Social Investment Board. PBIs are working locally with the Regional
Economic Growth Programme, Whänau Ora and Children’s Teams.
2 Bennett, P. (2016). Social Investment Approach for Māngere Children. Retrieved 14 March 2017 from
www.beehive.govt.nz/release/social-investment-approach-m%C4%81ngere-children.
WORKING PAPER 2017/04 | 3
MCGUINNESS INSTITUTETable 1: Comparing three place-based initiatives
Kainga Ora Manaaki Tairāwhiti South Auckland Social
(Northland) (Gisborne and Wairoa) Investment Board (SIB)
Purpose Common purpose Common purpose Common purpose
Kainga Ora aims to Manaaki Tairāwhiti aims The South Auckland SIB
improve outcomes for to improve outcomes for aims to improve outcomes
at-risk children and their at-risk children and their for at-risk children and
families by giving local families by giving local their families by giving
leaders the flexibility and leaders the flexibility and local leaders the flexibility
support to collectively support to collectively and support to collectively
tailor responses to what tailor responses to what allocate public resources
works in their specific works in their specific and make local investment
communities. communities. (and disinvestment)
Specific purpose Specific purpose decisions based on what
It will support local agency It intends ‘to provide works in their specific
leaders in Northland to the sector with locally communities.
cultivate and build on focused united leadership Specific purpose
what is already working that enables whānau It will achieve material and
well, and to provide perspectives to shape measurable improvements
additional capacity for how services connect.’4 for 0–5 year olds and their
these agencies to offer families by using analytics,
integrated services to improving the sharing
0–24 year olds who are of information between
at risk of poor outcomes, agencies, considering
as well as their family and interventions, building
whānau.3 workforce capability,
engaging with stakeholders
and the community and
evaluating results.5
Initial target In the first year, Kainga Ora 50 at-risk and hard to The first area of focus for
population will focus on 570 children engage with families. the South Auckland SIB
and young people, will be approximately
including their whānau, 1480 at-risk Māngere
in Otangarei, Kaitaia 0–5 year olds and their
and Kaikohe. Eventually, whānau/families.
however, the initiative will
expand to co-ordinate
and commission services
across Northland for an
estimated 6000 at-risk
children and youth from
0–24 years old over five
years.6
Business case Deloitte worked for the Selwyn Parata, Chair of Te Counties Manukau District
Ministry of Education Runanganui o Ngati Porou Health Board (CM DHB)
(MoE) to produce the Trust Board, prepared prepared the social
social investment business the social investment investment business case
case after Northland was business case presented presented to the State
selected as a site for a to the Ministry of Social Services Commission
PBI (based on the criteria Development (MSD). (SSC).
of high numbers and
proportions of at-risk
0–24 year olds and on an
assessment of their local
capacities, capabilities
and willingness).
3 Parata, H. (2016). Initiative to help Northland’s most at-risk kids. Retrieved 14 March 2017 from www.beehive.govt.nz/release/initiative-help-
northland%E2%80%99s-most-risk-kids.
4 Jackson, L. (Email correspondence, 10 March 2017). Please note that as at of June 2017 Manaaki Tairāwhiti has not yet launched its website.
5 Nicholas, D. (Email correspondence, 31 March 2017). South Auckland Social Investment Plan for the year to June 2017.
6 Chamberlain, N. (2016). From the Chief Executive. PreScribe: Northland District Health Board Staff Magazine 2016(3), p. 2. Retrieved 24 February
2017 from www.northlanddhb.org.nz/Portals/0/Communications/Publications/1666%20NDHB%20PreScribe%20Magazine%20Q3-2016%20-%20
EMAIL.pdf.
WORKING PAPER 2017/04 | 4
MCGUINNESS INSTITUTEKainga Ora Manaaki Tairāwhiti South Auckland Social
(Northland) (Gisborne and Wairoa) Investment Board (SIB)
Governance Lead minister Lead minister Lead minister
structure Louise Upston (Associate Anne Tolley (Minister of Paula Bennett (Minister of
Minister of Education), Social Development) State Services)
previously Hekia Parata
(Minister of Education)
Lead government agency Lead government agency Lead government agency
MoE MSD SSC
Independent Chair Independent Chairs Independent Chair
öö Harry Burkhardt öö Ronald Nepe (Chief öö Sandra Alofivae
(Chairman of Ngāti Kuri Executive of Te Rūnanga (barrister, board
Trust Board) o Tūranganui a Kiwa) member of Housing
öö Herewini Te Koha New Zealand [HNZ] and
(Chief Executive of Te Fonua Ola [Pacific Social
Rūnanganui o Ngāti Service Network])8
Porou)7
Local PBI Governance Local PBI Governance Local PBI Governance
Group Group Group
Kainga Ora was formed A new governance South Auckland SIB, which
from the Social Wellbeing group made up of is hosted on behalf of
Governance Group, which iwi, government and member agencies by the
was established in 2013 to community leaders from CM DHB. As well as Sandra
address the rate of youth the consolidated groups. Alofivae,
suicide in the Northland As well as Ronald Nepe members are
region. As well as Harry and Herewini Te Koha, öö Alastair Riach (Assistant
Burkhardt, members are members are Regional Commissioner
öö Nick Chamberlain öö Rehette Stoltz (Deputy Northern Region, DoC),
(CEO, Northland DHB), Mayor, Gisborne öö Di Grennell (Deputy
öö Hira Gage (Director of District Council), Chief Executive –
Education for Tai öö Annie Aranui (Regional Regional Partnerships,
Tokerau, MoE), Commissioner, MSD), TPK),
öö Eru Lyndon (Regional öö Jim Green (Chief öö Eru Lyndon (Acting
Commissioner, MSD), Executive, Gisborne DHB), Regional Commissioner
öö John Langley (Regional öö Mere Pohatu (Regional Auckland [& Northland],
Director, CYF), Manager, TPK), MSD),
öö Nicole Devereux öö Roy Sye (Regional öö Geraint Martin (CEO,
(Regional Manager, Director, MoE), CM DHB),
MSD), öö Sandra Venables öö Greg Groufsky (Deputy
öö Tui Marsh (Regional (Superintendent/District Chief Executive, HNZ),
Manager, TPK), Commander, Eastern öö Hamiora Bowkett
öö Haami Piripi (Chair, Te NZ Police) and (Chief Strategy &
Rarawa) and öö Rangi Manuel (Chief Policy Officer, Ministry
Executive, Te Whare of Health),
öö Russell Le Prou
(District Commander, Maire O Tapuwae). öö Isabel Evans (Director of
NZ Police). Education, Auckland,
MoE),
öö Superintendent John
Tims (District
Commander Counties
Manukau, NZ Police),
öö Karl Cummins
(Director Auckland
Strategy, MoJ),
öö Ken Allen (Regional
Manager Community
Investment, MSD),
7 (2016, September 30). Manaaki Tairāwhiti programme to help whānau. Gisborne Herald. Retrieved 14 March 2017 www.gisborneherald.co.nz/
localnews/2491732-135/manaaki-tairawhiti-programme-to-help-whanau.
8 Bennett, P. (2016). Social Investment Approach for Māngere Children. Retrieved 14 March 2017 from www.beehive.govt.nz/release/social-
investment-approach-m%C4%81ngere-children.
WORKING PAPER 2017/04 | 5
MCGUINNESS INSTITUTEKainga Ora Manaaki Tairāwhiti South Auckland Social
(Northland) (Gisborne and Wairoa) Investment Board (SIB)
Governance öö Patricia Reade
structure cont. (Transformation Director,
Auckland Council) and
öö Seti Talamaivao
(Northern Regional
Manager, MPP).
Annual Funding of about $1.6m MSD will fund Manaaki $1.5 million is allocated
funding9 per annum for two years Tairāwhiti $376,000 for for 2016/2017. This is
has been allocated project management and made up of $0.5 million
through Vote Education administrative backing.11 SIB running costs and $1
as seed funding and to million for interventions for
support staff.10 children and their families.
Approach and Kainga Ora will partner Manaaki Tairāwhiti has The SIB will seek three
priority actions with communities, initially focused on key outcomes for the first
government agencies, bringing together 12 group of 0–5 year olds in
NGOs, iwi and community local governance groups Māngere:
leaders to co-design to form a transparent öö Reduce substantiated
responses for at-risk oversight group that physical child abuse,
groups. This will ensure will strengthen social öö Reduce hospitalisations,
that wise investments are sector collaboration and and
being made to support reshape services. These öö Increase ECE
the Northland community groups include Safe
participation.
while promoting a self- Tairāwhiti Community
sustainable environment.12 Trust, Tairāwhiti Disability
Priority actions for Kainga Working Group, Violence
Ora are Free Tairāwhiti, Prisoner
öö Completing 570 Integration Network, Ruia
profiles of children and Project, SST and Youth
Service Level Alliance
young people;
Team.13
öö Creating Community The Manaaki Tairāwhiti
Action Plans for Kaitaia, group will develop
Kaikohe and Otangarei; community-led action
öö Initiating integrated plans and will have the
agency responses as ability to better tailor
children are identified; social services to the
and specific needs of their
recipients.
öö Testing where there are
Priority actions for
gaps in agency service
Manaaki Tairāwhiti are
provision.
öö Beginning 50 families
project to identify
service and practice
improvements to
deliver better results
from existing services
and
öö Implementing a
cross-agency triage
process for Whangaia
Nga Pa Harakeke, the
Children’s Team, and a
Health initiative: E Tipu
E Rea.
Results to date Too early to ascertain. Too early to ascertain. Too early to ascertain.
Concerns Too early to ascertain. Too early to ascertain. Too early to ascertain.
raised
9 Please note: appropriations are held by the lead ministries for each PBI, as the PBIs are not yet set up as legal entities.
10 Ministry of Education. (2017). Briefing for the Associate Minister of Education Hon Louise Upston, para 90, p. 18. Retrieved 20 March 2017 from
www.education.govt.nz/assets/Documents/Ministry/Publications/Briefings-to-Incoming-Ministers/Upston-BIM.pdf.
11 Please note: the designated time frame for this funding is unknown.
12 Parata, H. (2016). Initiative to help Northland’s most at-risk kids. Retrieved 14 March 2017 from www.beehive.govt.nz/release/initiative-help-
northland%E2%80%99s-most-risk-kids.
13 Jackson, L. (Email correspondence, 10 March 2017). Please note: as at June 2017 Manaaki Tairāwhiti has not yet launched its website.
WORKING PAPER 2017/04 | 6
MCGUINNESS INSTITUTEFact Sheet B: Whānau Ora
WORKING PAPER 2017/04 | 7
MCGUINNESS INSTITUTEWhānau Ora
Purpose
Whänau Ora is a nationwide initiative.
The Outcomes Framework confirms that Whānau Ora is achieved when Whānau are:
öö self-managing
öö living healthy lifestyles
öö participating fully in society
öö confidently participating in te ao Māori
öö economically secure and involved in wealth creation
öö cohesive, resilient and nurturing
öö responsible stewards of their natural and living environments14
In 2009 the Minister for the Community and Voluntary Sector, then Tariana Turia, set up the
Taskforce on Whänau-Centred initiatives. In 2010 the taskforce reported their findings to the
Government in Whänau Ora: Report of the Taskforce on Whänau-Centred Initiatives.15 The taskforce’s
outcome framework acts as the central purpose statement of Whänau Ora.
Implementation of Whänau Ora has required two phases. Phase One from 2010–2014 involved re-
orienting the way service providers operate by putting whänau at the centre. Phase Two, which is
currently underway, involves moving decision-making powers to the commissioning agencies.16
Target population
As of 2015 the three commissioning agencies had provided services for 9408 whänau. In total, this
equates to 49,625 people.17
Currently around 35% of families receiving support from Whänau Ora are from non-Mäori
ethnic groups.18
Governance structure
Whänau Ora is led by TPK in partnership with MSD and MoH. Strategic oversight is provided by
the Whänau Ora Partnership Group, established in 2015 and ‘made up of six Iwi Chairs Forum
representatives and the Ministers of Finance, Education, Health, Social Development and Economic
Development’.19 The Partnership reports to the Minister for Whänau Ora, Te Ururoa Flavell, who
sets Whänau Ora priorities. TPK then contracts three non-government commissioning agencies:
Te Pou Matakana for North Island whänau, Te Pütahitanga o Te Waipounamu for South Island
whänau and Pasifika Futures for Pasifika families.20 The commissioning agencies work with provider
collectives in their respective regions. Providers in these collectives can be NGOs or government
organisations; any existing provider can apply to work under Whänau Ora but has to gain consent
from the commissioning agency in that region before becoming official. These regions are TPK’s
ten regions of service delivery and each region also has a Regional Leadership Group. Each group
comprises community representatives, an official from TPK and a representative from a district health
board.21 On the final level of governance are Whänau Ora navigators (Kaiärahi) who personally work
with whänau to deliver results.
Annual funding
TPK formally administers funding for Whänau Ora by delegating funding to the commissioning
agencies in order to invest in communities.
14 Te Puni Kōkiri. (2016). The Whānau Ora Outcomes Framework: Empowering whānau into the future, p. 1. Retrieved 24 February 2017 from
www.tpk.govt.nz/docs/tpk-wo-outcomesframework-aug2016.pdf.
15 Ministry of Social Development. (2009). Whānau Ora: Report of the Taskforce on Whānau-Centred Initiatives. Retrieved 24 February 2017 from
www.msd.govt.nz/documents/about-msd-and-our-work/publications-resources/planning-strategy/whanau-ora/whanau-ora-taskforce-report.pdf.
16 Te Puni Kōkiri. (2017). About Whānau Ora. Retrieved 13 March 2017 from www.tpk.govt.nz/en/whakamahia/whanau-ora/about-whanau-ora.
17 Te Puni Kōkiri. (2015). Frequently Asked Questions. Retrieved 13 March 2017 from www.tpk.govt.nz/en/whakamahia/whanau-ora-old2/
frequently-asked-questions.
18 See Footnote 17.
19 See Footnote 16.
20 See Footnote 16.
21 Controller and Auditor-General. (2015). Whānau Ora: The first four years, p. 13. Retrieved 24 February 2017 from www.oag.govt.nz/2015/whanau-ora/
docs/whanau-ora.pdf.
WORKING PAPER 2017/04 | 8
MCGUINNESS INSTITUTEEach commissioning agency must submit annual investment plans to TPK that detail the programmes
to be commissioned and the results sought by those activities.22
Whänau Ora providers receive different funding according to the region they are active within.23 Until
2015 nearly a third of funding was spent on administration costs, which included research
and evaluation.24
As at June 2016, total funding for Whänau Ora commissioning activity was set to be $68,981,000 for
the 2016/17 financial year.25
Approach and priority actions
Whänau Ora uses a model of delegation among multiple groups and agencies to carry out their
programme. Rather than focusing on individuals and their problems, Whänau Ora improves
individual wellbeing by supporting the whole whänau. This is achieved primarily in the relationships
between whänau and the navigators. The navigators support whänau to make plans based on their
specific needs and aspirations and then connect them with the relevant networks of service providers.
The success of Whänau Ora is measured against the outcomes in the purpose section of this fact sheet.
Results to date
Statistics from Phase One of Whänau Ora indicate that collectives and navigators were generally
achieving more than 50% of their goals.26 The percentage of whänau reporting improvements in long-
term outcomes was greatest in education/training (62%) and healthy eating/exercise (48%).27
Concerns raised
öö Critics of the initiative question its accountability and capacity for success. However, these claims
can be countered by the results presented in the publicly available reports on the performance of
Whänau Ora.28
öö Nearly a third of total spending on Whänau Ora in the first four years was spent on
administrational costs and the Auditor-General believed that ‘Te Puni Kökiri could have spent a
greater proportion of funds on those people – whänau and providers – who Whänau Ora was
meant to help’.29
öö The inconsistent explanations of the aims of the initiatives in the Whänau Ora programme also
came into question in the Auditor-General’s report.30
22 Te Puni Kōkiri. (2015). Frequently Asked Questions. Retrieved 13 March 2017 from www.tpk.govt.nz/en/whakamahia/whanau-ora-old2/
frequently-asked-questions.
23 Controller and Auditor-General. (2015). Whānau Ora: The first four years, p. 24. Retrieved 24 February 2017 from www.oag.govt.nz/2015/
whanau-ora/docs/whanau-ora.pdf.
24 Controller and Auditor-General. (2015). Whānau Ora: The first four years, pp. 4–5. Retrieved 3 March 2017 from www.oag.govt.nz/2015/whanau-ora/
docs/whanau-ora.pdf.
25 Te Puni Kōkiri. (2016). Annual Report for year ended 30 June 2016, p. 26. Retrieved 3 March 2017 from www.tpk.govt.nz/documents/download/1505/
tpk%20annualreport-30june-2016.pdf.
26 Te Puni Kōkiri. (2015). Whānau Ora Annual Summary Report: 1 July 2014 – 30 June 2015, p. 26. Retrieved 24 February 2017 from www.tpk.
govt.nz/documents/download/1665/tpk-whanau-ora-annual-summary-report-2014-2015.pdf.
27 Te Puni Kōkiri. (2015). Whānau Ora Annual Summary Report: 1 July 2014 – 30 June 2015, p. 27. Retrieved 24 February 2017 from www.tpk.
govt.nz/documents/download/1665/tpk-whanau-ora-annual-summary-report-2014-2015.pdf.
28 Waatea News. (2016). Whānau Ora critics get it wrong. Retrieved 14 March 2017 from www.waateanews.com/waateanews/x_story_id/
MTM5NjQ=/Whanau-Ora-critics-get-it-wrong.
29 Controller and Auditor-General. (2015). Whānau Ora: The first four years, p. 5. Retrieved 3 March 2017 from www.oag.govt.nz/2015/whanau-ora/
docs/whanau-ora.pdf.
30 Thomas, G. (2015). Watchdog criticises Whānau Ora. Radio New Zealand. Retrieved 14 March 2017 from www.radionz.co.nz/news/te-
manu-korihi/272910/watchdog-criticises-whanau-ora.
WORKING PAPER 2017/04 | 9
MCGUINNESS INSTITUTEFact Sheet C: Contract Mapping
WORKING PAPER 2017/04 | 10
MCGUINNESS INSTITUTEContract Mapping
Overview
‘Contract Mapping: Mapping community services’ is a website administered by MSD.31 The website
aims to provide easy, open and transparent access to information about the social services that the
government funds throughout New Zealand to improve government accountability and to help
communities address their needs. The website is still a work in progress. It currently collates data from
MoH and MSD and, in time, will include agency data from MoJ, TPK and MoE.
The information on this website, particularly if it was more widely contributed to by other agencies,
would be a useful tool for developing a stocktake of service providers with a view to tackling poverty
and empowering communities under the demarcation zone proposal.
Using the maps
öö Selecting the ‘view data’ tab on the contract mapping website will take you to the national view
in which a map of New Zealand is shown divided into 14 regions. From this view you can click
on a region. The region is then divided into territorial authorities. Clicking on a territorial
authority from the regional view, the map will then show you the territorial authority (local
council) area divided into area units. Selecting an area unit will take you to the smallest area view
possible. This is the first time you can see service provider information.
öö The locations of the service providers are shown by different coloured pins on the map. A green
pin indicates a provider that matches your filter choices. An orange pin shows that there is
a provider in that location, but they do not match your filter choices. If you choose not to filter
the data, all data will be displayed. MSD offices are shown on the site as teal coloured pins.
öö Links to population information for the areas are available at the top of the panel on the left in
territorial authority view. In area unit view, this panel also shows the providers that receive
funding for services in that area unit.
Specific note
öö The service group ‘trialling new approaches to social sector change’ is not defined on the website,
but the New Zealand Treasury briefly defines this by saying: ‘This appropriation is limited to the
delivery of social sector services as part of the Social Sector Trials in specified locations and, in
those locations where that delivery is led by Non-Government Organisations, to the
administration of that delivery’.32 These appropriations are also ‘intended to achieve innovative
cross-agency responses to tackle social issues among targeted groups in specified locations’.33
Concerns raised
öö As noted earlier, MoJ, TPK and MoE are yet to provide data to the website.
öö The website notes: ‘The total of the contracted funding a provider receives is apportioned to the
area unit. Services may not be directly located in that area unit, but the provider has been
contracted to deliver services across an area that includes the area unit. The total amount of the
contract has been apportioned to all the area units within the provider’s contracted area.’ This
means the allocation of funds represents where the services are contracted to deliver, not where
the services are directly located.
öö The data is from the 2017 Financial Year and is updated each month. The website notes: ‘This
allows us to make changes to show any new contracts signed in the month, contracts that have
come to an end, and variations to contracts.’ On this basis we understand that completed contracts
will be omitted as the data is updated.
öö While there are definitions for the filter criteria ‘national contracts’ and ‘non-departmental
operating expenditure’, there is no definition for ‘sector support providers’. There are also
no definitions for some of the service groups such as ‘An Unrelenting Focus on Work’.
31 The site can be found at www.contractmapping.govt.nz. See the glossary at www.contractmapping.govt.nz/about-the-data/glossary.html for terminology
and further background information.
32 New Zealand Treasury. (2015). The Estimates of Appropriations 2015/16 – Social Development and Housing Sector B.5 Vol. 10, p. 133.
Retrieved 27 February 2016 from www.treasury.govt.nz/budget/2015/estimates/v10/est15-v10-socdev.pdf.
33 New Zealand Treasury. (2015). The Estimates of Appropriations 2015/16 – Social Development and Housing Sector B.5 Vol. 10, p. 88.
Retrieved 27 February 2016 from www.treasury.govt.nz/budget/2015/estimates/v10/est15-v10-socdev.pdf.
WORKING PAPER 2017/04 | 11
MCGUINNESS INSTITUTEöö The colour coding of the pins is not clear. Orange pins are described as showing that there is
a ‘provider in that location but they do not match your filter choices’. This is confusing because a
significant number of pins display as orange even when there are no filters selected. More
information provided as to why this is, what kind of filters would apply to these providers and
why they have been included would be useful.
öö There is no information regarding whether contract mapping includes the costs of pure benefits
per region (e.g. the jobseeker benefit). Information regarding the mean financial figure
appropriated to service providers in each region/district would also be helpful if included.
Specific regions
The following three sections outline funding allocations for the 2017 Financial Year in the Far North
District, the Gisborne District and the Rotorua District. They include only contract funding data.
There is some variation in the data because the agencies themselves vary in the detail of their contracts
and employ different systems of contracting.
The information for each district is reported by (A) area units, (B) service groups, (C) funders and (D)
examples of geographical maps.
For the area units we have highlighted the highest (dark orange) and lowest (light orange) per capita
funds to illustrate the extent of the variation between areas. Area units denote the regions within each
district, while service groups are the types of services that have been provided in each district. These
service providers have been grouped into nine groups within each funding agency. Funders indicate the
government departments that contribute financially to each district and respective service groups.
Table 2: Contract mapping in the Far North District34
(A) Far North area Number of Apportioned Per capita ($) Average Population per
units providers amount ($) apportioned area unit
amount per
provider ($)
North Cape 328 179,600 358.51 548 501
Houhora 329 377,100 447.29 1,146 843
Motutangi- 328 933,400 532.77 2,846 1752
Kareponia
Taipa Bay- 328 545,800 348.55 1,664 1566
Mangonui
Inlet-Whangaroa 327 3,300 218.23 10 15
Harbour
Awanui 329 138,100 393.31 420 351
Karikari Peninsula- 328 3,253,600 770.82 9,920 4221
Maungataniwha
Mangapa-Matauri 326 1,582,100 596.57 4,853 2652
Bay
Kaitaia East 328 1,188,200 611.22 3,623 1944
Kaeo 328 192,900 387.43 588 498
Kaitaia West 328 2,494,500 769.92 7,605 3240
Kapiro 326 1,006,000 410.97 3,086 2448
Ahipara 328 439,000 389.15 1,338 1128
34 Retrieved 24 February 2017 from map.contractmapping.govt.nz. See interactive Far North District Contract Mapping:
map.contractmapping.govt.nz/#ta_1.
WORKING PAPER 2017/04 | 12
MCGUINNESS INSTITUTETable 2 cont.
(A) Far North area Number of Apportioned Per capita ($) Average Population per
units providers amount ($) apportioned area unit
amount per
provider ($)
(i) (ii) (iii) (iv) (v) (vi)
Herekino 328 1,352,200 694.50 4,123 1947
Bay of Islands 327 6,500 308.95 20 21
Kerikeri 327 3,570,000 609.32 10,917 5859
Waitangi 326 315,800 397.25 969 795
Russell 326 280,900 343.00 862 819
Haruru Falls 329 246,200 313.21 748 786
Waihou Valley- 329 2,182,700 739.38 6,634 2952
Hupara
Inlet-Bay of islands 325 700 226.97 2 3
Paihia 326 787,700 445.02 2,416 1770
Hokianga North 327 1,620,200 829.57 4,955 1953
Opua West 326 75,400 292.06 231 258
Opua East 325 116,400 326.04 358 357
Okaihau 327 258,000 358.39 789 720
Ohaewai 327 329,100 462.89 1,006 711
Kohukohu 332 71,200 383.03 214 186
Kawakawa 325 660,900 488.46 2,034 1353
Moerewa 325 964,500 627.93 2,968 1536
Rawene 330 207,100 469.56 628 441
Kaikohe 328 3,074,500 746.41 9373 4119
Pokere-Waihaha 324 2,443,200 975.32 7,541 2505
Ngapuhi-Kaikou 327 2,231,500 887.63 6,824 2514
Hokianga South 327 2,095,000 802.67 6,407 2610
Omapere and 328 135,000 281.24 412 480
Opononi
Total 35,358,200 633.05 3002 55,854
(B) Far North service groups Apportioned amount ($) Per capita ($)
An Unrelenting Focus on Work 4,598,700 82.33
Communities Getting on with it 607,800 10.88
Health 20,995,800 375.91
Opportunities for Youth 1,651,600 29.57
Other 1,240,200 22.20
Protecting Our Children 6,069,200 108.66
Reducing long term welfare dependence 119,600 2.14
Trialling new approaches to social 75,400 1.35
sector change
Total 35,358,200 633.05
WORKING PAPER 2017/04 | 13
MCGUINNESS INSTITUTETable 2 cont.
(C) Far North funders Apportioned Per capita ($)
amount ($)
Ministry of Health (59%) 20,995,800 375.91
Ministry of Social Development (41%) 14,363,400 257.14
Total 35,358,200 633.05
(D) Examples of geographical maps
Figure 1: Service providers in Kaikohe, Far North
Figure 2: Service providers in Kaitaia, Far North
WORKING PAPER 2017/04 | 14
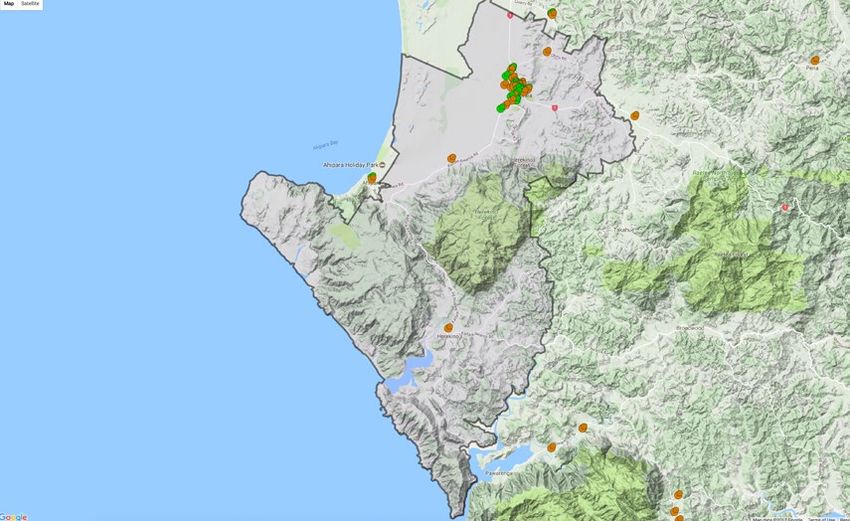
MCGUINNESS INSTITUTETable 3: Contract mapping in the Gisborne District35
(A) Area units Number of Apportioned Per capita ($) Average Population per
providers amount ($) apportioned area unit
amount per
provider ($)
East Cape 301 2,943,500 1,093.82 9,779 2691
Ruatoria 301 215,200 286.92 715 750
Tokomaru Bay 301 114,400 254.21 380 450
Tarndale- 314 1,228,500 740.49 3,912 1659
Rakauroa
Tolaga Bay 314 275,600 332.80 878 828
Wharekaka 314 1,181,500 616.31 3,763 1917
Te Karaka 315 157,000 289.19 498 543
Matokitoki 314 150,600 321.90 480 468
Patutahi 315 100,300 267.38 318 375
Makaraka 314 391,900 376.42 1,248 1041
Riverdale 314 537,100 332.80 1,711 1614
Mangapapa 314 2,527,200 594.50 8,048 4251
Te Hapara 315 2,539,700 594.50 8,063 4272
Whataupoko 314 2,074,700 561.79 6,607 3693
Gisborne 314 2,658,900 855.51 8,468 3108
Central
Gisborne 314 1,356,600 496.36 4,320 2733
Airport
Kaiti North 305 631,700 309.64 2,071 2040
Outer Kaiti 305 950,400 364.16 3,116 2610
Wainui 305 515,600 342.35 1,690 1506
Kaiti South 305 1,407,800 495.01 4,616 2844
Tamarau 305 761,700 331.44 2,497 2298
Manutuke 314 211,700 354.61 674 597
Tiniroto 314 1,297,900 616.31 4,133 2106
Total 24,229,400 545.78 3391 44,394
35 Retrieved 24 February 2017 from map.contractmapping.govt.nz. See interactive Gisborne District Contract Mapping:
map.contractmapping.govt.nz/#ta_28.
WORKING PAPER 2017/04 | 15
MCGUINNESS INSTITUTETable 3 cont.
(B) Service groups Apportioned amount ($) Per capita ($)
An Unrelenting Focus on Work 2,616,200 58.93
Communities Getting on with it 356,300 8.03
Health 14,373,400 323.77
Opportunities for Youth 1,367,000 30.79
Other 89,500 2.02
Protecting Our Children 5,312,100 119.66
Reducing long term welfare dependence 100,000 2.25
Trialling new approaches to social sector change 15,000 0.34
Total 24,229,400 545.78
(C) Gisborne funders Apportioned amount ($) Per capita ($)
Ministry of Health (59%) 14,373,400 323.77
Ministry of Social Development (41%) 9,856,000 222.01
Total 24,229,400 545.78
(D) Example of a geographical map
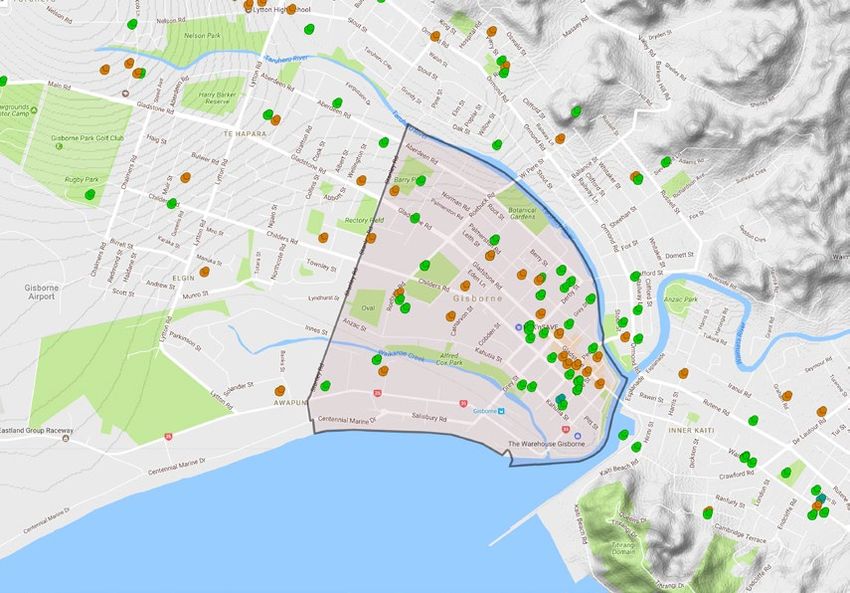
Figure 3: Service providers in Gisborne Central, Gisborne
WORKING PAPER 2017/04 | 16
MCGUINNESS INSTITUTETable 4: Contract mapping in the Rotorua District36
(A) Area units Number of Apportioned Per capita ($) Average Population per
providers amount ($) apportioned area unit
amount per
provider ($)
Hamurana 361 1,118,400 467.77 3,098 2391
Tikitere 362 2,506,400 882.21 6,924 2841
Ngongotaha 359 2,267,800 790.74 6,317 2868
North
Mamaku 359 217,500 297.09 606 732
Ngongotaha 359 460,000 415.56 1,281 1107
South
Kawaha Point 359 392,700 239.29 1,094 1641
Fairy Springs 359 1,035,300 514.29 2,884 2013
Arahiwi 360 41,600 277.34 116 150
Selwyn Heights 359 425,300 376.07 1,185 1131
Koutu 359 1,090,900 573.53 3,039 1902
Owhata West 359 1,944,900 542.51 5,418 3585
Western 359 2,795,800 731.50 7,788 3822
Heights
Ohinemutu 360 72,600 257.60 202 282
Owhata East 359 1,219,900 573.53 3,398 2127
Mangakakahi 359 1,792,900 731.50 4,994 2451
Pukehangi 359 1,042,700 474.80 2,904 2196
North
Kuirau 359 1,091,000 988.20 3,039 1104
Poets Corner 360 58,900 218.10 163 270
Pukehangi 359 1,306,500 467.77 3,639 2793
South
Fordlands 359 979,700 514.29 2,729 1905
Utuhina 359 611,200 435.31 1,703 1404
Owhata South 360 150,700 257.60 419 585
Victoria 360 963,200 585.89 2,676 1644
Waiwhero 359 333,300 474.80 928 702
Sunnybrook 359 807,900 415.56 2,250 1944
Hillcrest 359 825,400 514.29 2,299 1605
Glenholme 359 1,238,600 542.52 3,450 2283
West
Glenholme 359 1,140,800 573.53 3,178 1989
East
Fenton 359 529,400 380.31 1,475 1392
36 Retrieved 24 February 2017 from map.contractmapping.govt.nz. See interactive Rotorua District Contract Mapping:
map.contractmapping.govt.nz/#ta_24.
WORKING PAPER 2017/04 | 17
MCGUINNESS INSTITUTETable 4 cont.
(A) Area units Number of Apportioned Per capita ($) Average Population per
providers amount ($) apportioned area unit
amount per
provider ($)
Lynmore 359 1,637,300 522.77 4,561 3132
Pomare 359 435,100 290.06 1,212 1500
Springfield 359 3,307,600 770.99 9,213 4290
Whaka 360 99,800 297.09 277 336
Ngapuna 359 203,100 395.82 566 513
Tarawera 359 1,103,100 790.74 3,073 1395
Ngakuru 359 1,016,800 593.57 2,832 1713
Kaingaroa 360 144,400 297.09 401 486
Forest
Reporoa 360 132,300 277.34 368 477
Golden 359 776,000 594.61 2,162 1305
Springs
Total 37,316,500 565.35 2663 66,006
(B) Service groups Apportioned amount ($) Per capita ($)
An Unrelenting Focus on Work 3,763,500 57.02
Communities Getting on with it 566,700 8.59
Health 25,349,800 384.05
Opportunities for Youth 1,402,300 21.24
Other 484,000 7.33
Protecting Our Children 5,683300 86.10
Reducing long term welfare dependence 67,100 1.02
Trialling new approaches to social sector No funding mentioned No information
change
Total 37,316,500 565.35
(C) Rotorua funders Apportioned amount ($) Per capita ($)
Ministry of Health (68%) 25,349,800 384.05
Ministry of Social Development (32%) 11,966,700 181.30
Total 37,316,500 565.35
WORKING PAPER 2017/04 | 18
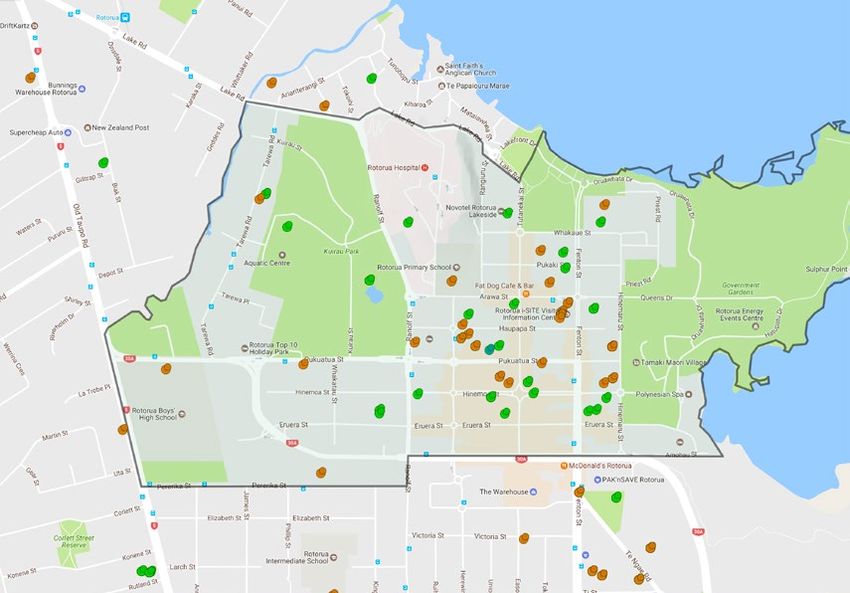
MCGUINNESS INSTITUTE(D) Example of a geographical map
Figure 4: Service providers in Kuirau, Rotorua
WORKING PAPER 2017/04 | 19
MCGUINNESS INSTITUTEFact Sheet D: Children’s Teams
WORKING PAPER 2017/04 | 20
MCGUINNESS INSTITUTEChildren’s Teams
Introduction
Children’s Teams are not service providers. They instead represent a different approach, working
with whänau to ‘create safer lives for at-risk children’.37 The Teams bring together agencies, NGOs
and communities to share information and create a plan for each child. They promote ‘accountability
at every level – from chief executives of government agencies in Wellington to front-line workers
interacting directly with children and their families’. The Teams were developed as a response to the
White and Green Paper for Vulnerable Children, which set out a programme to address weaknesses in
service provision to children and their families. ‘This community-led approach builds on what already
exists and responds to the unique needs of each community’.38 There are currently ten Children’s
Teams operating around New Zealand in
öö Rotorua,
öö Whangarei,
öö Horowhenua/Ötaki,
öö Marlborough,
öö Hamilton,
öö Tairäwhiti,
öö Eastern Bay of Plenty,
öö Whanganui,
öö Canterbury and
öö Counties Manukau.
Target population
The Teams focus on children and young people aged 18 and under who are not involved in care
and protection services but ‘who are vulnerable to maltreatment and at risk of significant harm to
their wellbeing’.39
This includes, but is not limited to:
öö children living in homes where family violence is present
öö children who have difficulty attending school or engaging when present
öö children with social or behavioural problems
öö children with unaddressed health issues
öö whānau struggling with social or economic issues who have dependent children
öö whānau with dependent children where parenting capacity needs to be strengthened
öö whānau with dependent children for whom a statutory intervention may be required if
concerns and risk factors are not addressed.
Stucture
Lead professionals
Children’s Teams assign a lead professional who then brings others together to form a Child’s Action
Network. The lead professional acts as a single point of contact for the child and their whänau,
37 Oranga Tamariki. (2017). Children’s Teams. Retrieved 30 May 2017 from www.mvcot.govt.nz/working-with-children/childrens-teams.
Unless indicated otherwise, all quotes and information in this fact sheet are extracted or adapted from this source: the Oranga Tamariki Children’s Teams
website under ‘The approach’ tab or the ‘How they work’ tab.
38 Children’s Action Plan. (n.d.). Children’s Teams. Retrieved 30 May 2017 from www.childmatters.org.nz/file/Diploma-Readings/Block-6/Child-
Advocacy-Issues/cap-factsheet.pdf.
39 See Footnote 37.
WORKING PAPER 2017/04 | 21
MCGUINNESS INSTITUTEproviding support and guidance through the system. They ‘coordinate the network around the
child’ in order to reduce inconsistencies and overlaps in services. They also complete any assessments
and reviews, and ensure the child receives appropriate, effective and timely interventions. Lead
professionals are supervised by managers.
Child’s Action Networks
Child’s Action Networks centre the child or young person and link them to a flexible network of
others. The network improves coordination and access to resources and, depending on their needs,
includes the child’s parents and caregivers and various practitioners and professionals.
For each child, network members are responsible for:
öö providing evidence and analysis to support their contribution to the common assessment
öö contributing actively to solving problems or resolving difficulties
öö delivering the activities in the child’s plan
öö keeping other members of the team informed about progress in their area of responsibility
öö supporting the lead professional by keeping them informed, providing updates promptly
when requested and attending meetings
öö supporting the lead professional by sharing information, offering guidance and advice.40
Children’s Team Panel
The Panel brings together professionals from the community with expertise in the social, education,
health, police and justice sectors. The Panel
öö makes decisions on referrals to the Children’s Team
öö shares information and provides insight from their home agency or organisation
öö reviews the progress of assessments, plans and reviews of children and whānau involved with
the team
öö provides advice and guidance to lead professionals
öö embeds the approach within their home agency or organisations
öö ensures there are no barriers to accessing their own agency’s services.41
Approach
The Children’s Teams complete assessments of children’s needs and then develop plans to support
the children with the services and resources available within the local community. The Teams are
responsible for keeping the plans on track and are responsible for the safety and wellbeing of every
child they oversee. The process of involvement with a Children’s Team begins with a referral,
which is then reviewed by the Children’s Team Panel. If the Children’s Team approach is deemed
appropriate and the child or young person and their family all agree to participate, they are assigned
a lead professional. Child Youth and Family then work together to identify needs, plan and set
goals and work towards improving their wellbeing. They are steered by their lead professional, who
prepares an assessment, and are supported by their Child’s Action Network, which is established
by the lead professional. The Child’s Action Network then analyses the assessment and establishes
aims for the plan. Once the assessment and plan have been approved by the Panel, the Child’s Action
Network implements the plan and reviews the results. When the child and their family no longer
require the intensive coordinated support of the Children’s Teams, they are able to be supported
within their community.
Funding
Children’s Teams’ parent agency Oranga Tamariki have been allocated $434.1 million in funding over
five years. This includes ‘$9.7 million over the next two years to support the 10 Children’s Teams’.42
40 See Footnote 37.
41 See Footnote 37.
42 Tolley, A. (25 May 2017). $434.1 million to support young people in care. Retrieved 30 May 2017 from 2017.budget.govt.nz/budget/2017/releases/r32-
tolley-434-1m-to-support-young-people-in-care.htm.
WORKING PAPER 2017/04 | 22
MCGUINNESS INSTITUTEFact Sheet E: Social Sector Trials
WORKING PAPER 2017/04 | 23
MCGUINNESS INSTITUTESocial Sector Trials
Introduction
The Social Sector Trials (SSTs) [were] a community-based approach aimed at improving the way
government plans, funds, and delivers social services.
They involve[d] transferring the control of resources including funding, decision-making authority,
and accountability for results from government agencies to a Trial lead in the local community.43
The SSTs are no longer administered by central government. Some were discontinued, while 11
were transitioned to a fully community-led model to build on what was learnt. Social Development
Minister Anne Tolley said the SSTs ‘provided good information to help design community-led
models for better social service results’ and ‘were most successful where there was good co-ordination
from those involved’.44 Minister Tolley emphasised that the SSTs had led to improved knowledge of
effectiveness in social service provision and that this knowledge would be used to drive future
policy innovations.45
Target issues
SSTs were primarily focused on four areas of concern in young people:
öö Levels of offending,
öö alcohol and substance abuse,
öö truancy and
öö participation in education, training or employment.
The target age range was initially set at 12–18 years but was broadened to 5–18 years in the
first trials.46
Approach and priority actions
The process of implementing SSTs began with the establishment of a local advisory group and
nomination of a Trial Lead (an NGO or a committed individual from the community). The Lead
was then transferred the control of resources, decision-making and accountability, with the broad
intention of the local community gaining more control.47 The process also involved a stocktake
of currently operating services and statistical analysis of current relevant activity. This then led to
the development of action plans for each area that would enable improved coordination of existing
services as well as the introduction of new initiatives. The process also required evaluation, with a
cross-agency approach taken for the first two years and evaluation results made available on the MSD
website.48 Evaluations identified barriers to implementation and the delivery of results for young
people.49
Governance structure
The SSTs were a joint project of MoE, MoH, MoJ, MSD and the New Zealand Police. The Chief
Executives of each of these ministries and the Commissioner of Police together comprised a Joint
Venture Board responsible for overseeing an evaluation of the implementation and management.
Complemented by a ministerial group, the Joint Venture Board included local stakeholders and
agency representatives to allow joint accountability. Actual implementation and ongoing management
of the SSTs was handled by a Director, who provided six-monthly progress reports to the Ministers.50
The SSTs used a ‘community-influenced model’. Successful SSTs were indicated as appropriate for
transition to a fully community-led model with a broader focus for service delivery.
43 Ministry of Health. (2017). Social Sector Trials. Retrieved 6 June 2017 from www.health.govt.nz/our-work/preventative-health-wellness/social-sector-trials.
44 Tolley, A. (2017). Social Sector Trials move to local-led models. Retrieved 6 June 2017 from www.beehive.govt.nz/release/social-sector-trials-move-local-led-
models.
45 See Footnote 44.
46 New Zealand Police. (n.d.). Social Sector Trials. Retrieved 6 June 2017 from www.police.govt.nz/about-us/programmes-and-initiatives/social-sector-trials.
47 See Footnote 46.
48 Crafer, C. (2014). Social Sector Trials: March 2011 – June 2015. Retrieved 6 June 2017 from www.auditnz.govt.nz/publications-resources/
information-updates/2014/social-sector-trials.pdf.
49 Ministry of Social Development. (n.d.). Leadership. Retrieved from 6 June 2017 www.msd.govt.nz/about-msd-and-our-work/publications-resources/
corporate/annual-report/2010-11/leadership.html.
50 See Footnote 49.
WORKING PAPER 2017/04 | 24
MCGUINNESS INSTITUTELocations
The SSTs were first piloted in March 2011.51 The initial locations were
öö Tokoroa/South Waikato (NGO Lead),
öö Levin/Horowhenua (NGO Lead),
öö Gore (NGO Lead),
öö Kawerau (committed individual Lead),
öö Te Kuiti/Waitomo (committed individual Lead) and
öö Taumarunui (committed individual Lead).52
SSTs introduced in 2013 in the following locations were discontinued in 2016 after varying results:
öö Whakatane,
öö Rotorua (0–18 years, education focus),
öö Waikato,
öö South Taranaki and
öö Wairarapa.53
SSTs operational as at 5 May 2016 were
öö Tokoroa/South Waikato,
öö Gisborne,
öö Kaikohe,
öö Waitomo,
öö Taumarunui,
öö Kawerau,
öö Horowhenua,
öö Porirua (0–74 years, health focus),
öö South Dunedin and
öö Gore.
Results to date
The results of the trials can be considered in terms of soft outcomes, hard outcomes and examples of
new activity. Some examples of soft outcomes observed in 2014 were
öö Stocktake of youth activities, a forum for discussion on youth issues, Action Plans developed (all
for the first time)
öö Communities feeling more connected
öö Young people feeling more connected to each other (through events, programmes in
schools/communities)
öö The development of a culture of care for children and young people
51 Ministry of Health. (2017). Social Sector Trials. Retrieved 6 June 2017 from www.health.govt.nz/our-work/preventative-health-wellness/social-sector-trials.
52 Ministry of Social Development. (n.d.). Leadership. Retrieved 6 June 2017 from www.msd.govt.nz/about-msd-and-our-work/publications-resources/
corporate/annual-report/2010-11/leadership.html and New Zealand Police. (n.d.). Social Sector Trials. Retrieved 6 June 2017 from www.police.govt.nz/
about-us/programmes-and-initiatives/social-sector-trials.
53 Jones, N. (2016). 5 ‘social sector trials’ to be abandoned. New Zealand Herald. Retrieved 6 June 2017 from www.nzherald.co.nz/nicholas-jones/news/
article.cfm?a_id=715&objectid=11634223.
WORKING PAPER 2017/04 | 25
MCGUINNESS INSTITUTEöö Agencies (government and non-government) working collaboratively to deliver programmes
and services
öö Evidence of Trials leads [sic] influencing practice (e.g. one Trial lead has provided advice to local
Police regarding their approach to youth violence)
öö Agencies in Wellington applying learning from the Trials in policy decisions/direction54
Hard outcomes included
öö measurable increases in transition from secondary to tertiary education (from 18% in 2010 to 55%
in 2013 in Te Kuiti),
öö measurable increases in attainment of NCEA Level 2 qualifications (65% in 2011 to 78% in 2012 in
Taumarunui), and
öö measurable reduction in truancy (30% reduction in Kawerau between 2011 and 2013 and a 35%
reduction in Gore between 2012 and 2013).55
Examples of new activity included
öö development of an education strategy in Kawerau,
öö a youth hub resourced by the community and partner agencies in Waitomo,
öö introduction of Kick-Start breakfast clubs supported by Fonterra and Sanitarium in Taumarunui,
öö a comprehensive anti-truancy campaign and a youth radio station in South Waikato,
öö youth coordinators and an interagency motivation and fitness programme in Horowhenua, and
öö development of the Hokonui Tertiary High School to improve transition into education, training
or employment in Gore.
Annual funding
By December 2012, 61% of total resources for the SSTs were leveraged locally. Resources included
öö In-kind resources: such as agency/NGO/Council staff or office space provision
öö Donations: Fonterra supplying milk for a breakfast club or New World donating food for a youth
activities day
öö Cash and other financial resources: DHB contract for a full time Drug and Alcohol Counsellor,
business donation for youth mentor56
Concerns raised
As a result of the first six SSTs, a number of barriers were noted. These included variations in the
recording of truancies, different operating boundaries between agencies, the difficulties of recording
accurate and useful data in rural and provincial communities, a proliferation of NGOs and a lack of
vision or strategy in service providers for the communities they work in.57
54 Crafer, C. (2014). Social Sector Trials: March 2011 – June 2015. Retrieved 6 June 2017 from www.auditnz.govt.nz/publications-resources/
information-updates/2014/social-sector-trials.pdf.
55 See Footnote 54.
56 See Footnote 54.
57 See Footnote 54.
WORKING PAPER 2017/04 | 26
MCGUINNESS INSTITUTEYou can also read