Asian Development Bank Institute - PUBLIC-PRIVATE PARTNERSHIPS IN GEORGIA AND IMPACT ASSESSMENT OF INFRASTRUCTURE
←
→
Page content transcription
If your browser does not render page correctly, please read the page content below

ADBI Working Paper Series

PUBLIC–PRIVATE PARTNERSHIPS
IN GEORGIA AND IMPACT
ASSESSMENT OF INFRASTRUCTURE

Nestan Devidze

No. 1162
July 2020

Asian Development Bank Institute
Nestan Devidze is an impact investments manager for South Asia and Southeast Asia
 based in Bangkok, Thailand.
 The views expressed in this paper are the views of the author and do not necessarily reflect
 the views or policies of ADBI, ADB, its Board of Directors, or the governments they
 represent. ADBI does not guarantee the accuracy of the data included in this paper and
 accepts no responsibility for any consequences of their use. Terminology used may not
 necessarily be consistent with ADB official terms.
 Working papers are subject to formal revision and correction before they are finalized and
 considered published.

The Working Paper series is a continuation of the formerly named Discussion Paper series;
the numbering of the papers continued without interruption or change. ADBI’s working papers
reflect initial ideas on a topic and are posted online for discussion. Some working papers may
develop into other forms of publication.

Suggested citation:

Devidze, N. 2020. Public–Private Partnerships in Georgia and Impact Assessment of
Infrastructure. ADBI Working Paper 1162. Tokyo: Asian Development Bank Institute.
Available: https://www.adb.org/publications/ppp-georgia-impact-assessment-infrastructure

Please contact the authors for information about this paper.

Email: nestandevidze@gmail.com

Asian Development Bank Institute
Kasumigaseki Building, 8th Floor
3-2-5 Kasumigaseki, Chiyoda-ku
Tokyo 100-6008, Japan

Tel: +81-3-3593-5500
Fax: +81-3-3593-5571
URL: www.adbi.org
E-mail: info@adbi.org

© 2020 Asian Development Bank Institute
ADBI Working Paper 1162 N. Devidze

Abstract

This research study aimed to assesses the impact of infrastructure based on the evaluation of
infrastructure provision’s effect on public finance, presenting the case of Kutaisi International
Airport in Georgia. In the case, we assessed the impact of the airport on the public finances
of the region in which is located and its spillover effects on the related regions. For the
assessment, we obtained regional quarterly tax data for the years 2011–17 from the Ministry
of Finance of Georgia. We differentiated between three groups of taxes: total taxes, business
taxes, and property taxes. We utilized the data to exploit the difference-in-difference (DiD)
approach, assessing the impact of the airport on tax revenues for the group of affected regions
relative to a control group of unaffected regions. We further distinguished effects for the short
term (2013), medium term (2014–15), and long term (2016–17). We found statistically
significant increases in the growth rates of all three groups of tax revenues in at least one
phase, with the magnitude of the increase being up to 29 percentage points relative to the
group of control regions. The results of the empirical study suggest that the reconstruction of
the airport had a positive impact on the tax revenues of the state. The paper further discusses
the current state of infrastructure financing in Georgia and outlines the importance of greater
involvement of the private sector in infrastructure financing through public–private
partnerships (PPPs). Consequently, the paper assesses the recent developments in the PPP
policy of Georgia and benchmarks it against internationally recognized best practices. It
defines the challenges faced by PPPs and provides recommendations for further improvement
of the PPP-friendly environment in the country. Finally, the paper discusses the development
of the approach to enable the government to use the incremental tax revenues to fill the
viability gap for infrastructure projects by increasing the rate of return for private investors.

Keywords: public–private partnerships, transportation investment, infrastructure, public
infrastructure, state revenue

JEL Classification: L33, E6, H54, H71, O22, R42
ADBI Working Paper 1162 N. Devidze

Contents

1. INTRODUCTION............................................................................................................1

 1.1 The Increasing Need for Private Investments in Infrastructure ....................... 1
 1.2 The Scope of the Study .....................................................................................2

2. EVALUATION OF THE EFFECT OF INFRASTRUCTURE ON PUBLIC FINANCE:
 THE CASE OF KUTAISI INTERNATIONAL AIRPORT IN GEORGIA ......................... 2

 2.1 Kutaisi International Airport................................................................................3
 2.2 The Difference-in-Difference Approach (DiD) ................................................... 5
 2.3 Data ....................................................................................................................9
 2.4 Empirical Results ...............................................................................................9

3. CURRENT STATE OF INFRASTRUCTURE FINANCING IN GEORGIA .................. 12

 3.1 Major Sources of Infrastructure Financing ...................................................... 12
 3.2 A Favorable Climate for Infrastructure Investments in Georgia...................... 14

4. CURRENT STATE OF PPPs WITH ASSOCIATED CHALLENGES
 AND PROSPECTS ......................................................................................................16

 4.1 Historical Evidence of PPPs in Georgia .......................................................... 16
 4.2 Recent Developments of the PPP Policy ........................................................ 18
 4.3 The Main Challenges that the Country Faces in Developing
 PPPs Successfully ...........................................................................................24
 4.4 Recommendations for the Successful Promotion of PPPs in Georgia ........... 26

5. CONCLUSION AND POLICY IMPLICATIONS ........................................................... 28

REFERENCES ........................................................................................................................30
ADBI Working Paper 1162 N. Devidze

1. INTRODUCTION
1.1 The Increasing Need for Private Investments
 in Infrastructure
Georgia’s strategic location and ample natural resources create huge possibilities for its
economic development, yet the country’s economic growth cannot keep pace with its
growth ambitions. The average annual GDP growth during the last three years, 2015–7,
fell to 3.5%, while the average growth in the years 2010–4 was 5.6% (Ministry of Finance
of Georgia (MoF) 2018), the decline being mainly due to external factors. However,
according to the Global Competitiveness Report 2017–2018 (World Economic Forum
(WEF) 2018), an inadequate supply of infrastructure is one of the main factors hindering
economic growth. Georgia scored 4.2 out of 7 for the “adequate supply of infrastructure”
and ranked 69th among 137 economies (WEF 2018). Although the ranking had improved
from 75th since the preceding year, the country still faces substantial challenges due to
the insufficient level of infrastructure. For instance, the lack of adequate roads blocks
opportunities for one of the most rapidly growing sectors in the country—tourism.
Likewise, access to a water supply in rural areas demolishes opportunities for agricultural
development.
During previous years, Georgia has taken steps to improve its business environment.
Considerable changes took place in the local regulatory framework in various areas in
2016–17, including a tax reform that placed Georgia high on the list of the countries with
the most liberal tax policies. Nevertheless, proper infrastructure is one of the most
important conditions to make the country attractive to investors and to utilize its full
economic potential. To bring the infrastructure to the desired level of development, one
of the most challenging factors is financing. The main sources for infrastructure project
financing have been donor financing and concessional lending. However, the shrinking
fiscal gap creates a need for the active involvement of the private sector in infrastructure
financing.
The Government of Georgia (GoG) has outlined the importance of greater inclusion of
the private sector in infrastructure financing and expressed its intention to promote
infrastructure financing through public–private partnerships (PPPs). For the successful
development of PPPs, it is crucial to ensure that the government has the capability to
procure and manage such projects and to create a clear and transparent regulatory
framework.
The GoG has taken considerable measures to create a PPP-friendly environment. With
the support of multilateral development banks (MDBs), it has established a PPP
regulatory framework, which it has followed with a PPP law and extensive secondary
legislation. A dedicated PPP unit is in the process of formation. Despite these important
developments, the country still faces numerous challenges to bring PPPs to the desired
scale. One of the main constraints hindering private investors from investing in
infrastructure is the low rate of return of infrastructure projects; this is not only a national
but a global problem. The major source of income for most infrastructure projects is fees
from the users. At the same time, the fact that infrastructure has to be accessible to the
public sets bounds to the tariffs, therefore limiting the return to private investors. To
address the problem, Yoshino and Abidhadjaev (2016) presented an approach to
measure the impact of infrastructure on public finance, based on which the government
can decide to implement an incremental increase of the tax revenues to inject viability
gap funding into the infrastructure investors.

 1
ADBI Working Paper 1162 N. Devidze

1.2 The Scope of the Study
The research study therefore sought to explore and investigate the following. Section 2
presents the case study measuring the impact of Kutaisi International Airport on the tax
revenues of the surrounding regions—Imereti and two other regions in West Georgia that
have received treatment from the airport. We use a modified difference-in-difference
method to measure the increase in the revenues derived from the total taxes and then
break the revenues down into business taxes and property taxes. Furthermore, we
discuss a potential way for the government to return the incremental revenue to the
infrastructure investors. Section 3 analyzes the major points related to infrastructure
financing in Georgia: the current state of infrastructure financing, barriers, incentives, and
legislative framework. Section 4 provides a detailed overview of the state of PPPs in
Georgia with the following aims:
 • To analyze the current state of PPPs in infrastructure provision, including a
 review of ongoing PPP projects and the challenges and opportunities facing
 PPPs.
 • To assess the newly established PPP law together with subsequent secondary
 legislation.
 • To provide policy recommendations for further promoting PPPs for infrastructure
 projects with the aim of achieving a pipeline of sustainable and effective projects.
The final section provides a concluding statement.

2. EVALUATION OF THE EFFECT OF
 INFRASTRUCTURE ON PUBLIC FINANCE:
 THE CASE OF KUTAISI INTERNATIONAL AIRPORT
 IN GEORGIA
Georgia is highly reliant on transportation for two reasons: it is a transit country and
tourism has been one of the main contributors to the growth of the economy in previous
years. Therefore, it is crucial for the country to have the proper infrastructure for
transportation and logistics.
While focusing on the development of innovative methods to fill the infrastructure gap,
the need to assess the achievement of development outcomes has become essential for
multiple reasons. For developing countries like Georgia, the budget constraints on
infrastructure spending are especially tight. Considering the underdeveloped capital
market, the government has to ask multilateral development banks (MDBs) or donor
organizations for support. To evaluate and present the future impact of the proposed
infrastructure project, the government needs to prepare itself with the tools to assess the
impact accurately (Yoshino and Pontines 2015). However, due to the shrinking fiscal
gap, many countries, including Georgia, are not able to increase their public debt; hence,
the GoG has emphasized the need for greater involvement of the private sector in
infrastructure financing through PPPs. One of the major challenges to attract private
investment in infrastructure is the low rate of return of public infrastructure projects
(Yoshino and Abidhadjaev 2017). The instrument for the government to fill the viability
gap is an additional return that it can guarantee to the private sector in the form of capital
grants or various types of subsidy. For the government to make a sensible decision
regarding viability gap funding (VGF), it requires tools and methodologies to assess the
impact of infrastructure provisioning on public finance.

 2
ADBI Working Paper 1162 N. Devidze

The revenues that infrastructure projects generate are not limited to their operational
revenues. An upgraded infrastructure stimulates the economy and creates new
employment and new opportunities for local enterprises. After accurately measuring the
spillover effects of the infrastructure, the government may take the decision to return part
of the tax revenue to private investors. This kind of approach will raise the rate of return
and make infrastructure investments more attractive to private investors (Yoshino and
Abidhadjaev 2017).
Below, we present a microeconomic case study that examined the impact of Kutaisi
International Airport on the public finance of the region in which it is located and two
neighboring regions. The expectation is that the provision of the new infrastructure in the
form of an international airport has increased the flow of the tourists, prompting an
improvement in economic performance. After the opening of the airport, the number of
tourists visiting Kutaisi and its surrounding areas increased significantly. Consequently,
it stimulated the overall economic activity. The activity of hotels, restaurants, and shops
has experienced high growth. The revenues of the local tourist attractions have grown
as well; furthermore, the increased demand for transportation has created new
employment opportunities for locals.
We used a modified difference-in-difference method to measure the increase in the
revenues derived from the total taxes and then broke the revenues down into business
taxes and property taxes.

2.1 Kutaisi International Airport
Kutaisi International Airport is the first international airport in the region of Imereti
and the second international airport in West Georgia. The airport underwent rebuilding
in 2012, after which it started to attract a growing number of flights. The airport is
fully owned by the state-owned United Georgian Airports (UAG), and the state fully
financed the project of renovating the airport. The total cost of the project amounted
to nearly USD 26.5 million, and the state budget financed it entirely. The focus of Kutaisi
International Airport is on offering cost-efficient airline services. Its strategic location
makes it an alternative airport for the region. Kutaisi International Airport is located within
200 kilometers from Tbilisi and is connected to Armenia, Azerbaijan, the Russian
Federation, and Turkey within a radius of 300 km. As of 2017, the airport has served
more than 400,000 passengers, and the number of passengers has increased rapidly
since its reopening in 2012. Currently the airport serves five airlines with
18 destinations and has high growth prospects with the support of the ongoing project of
the new terminal. The majority of the passengers served (54% as of October 2018) has
consisted of foreign visitors. After the opening of Kutaisi International Airport, the number
of tourists visiting the surrounding regions increased, together with the revenues from
international tourism receipts that the region generates. The overall effect of the
infrastructure has been an increase in economic activity, which has led to increased tax
revenue for the government. Figure 1 and Figure 2 show the number of flights that Kutaisi
International Airport has hosted and the number of passengers whom it has served since
its reopening.

 3
ADBI Working Paper 1162 N. Devidze

 Figure 1: Number of Flights Kutaisi International Airport Has Hosted

 Source: Authors’ own based on data from Kutaisi international Airport. Statistics.
 http://www.kutaisi.aero/Statistics?year=-1 (accessed September 2018).

 Figure 2: Number of Passengers Kutaisi International Airport Has Served

 Source: Authors’ own based on data from Kutaisi international Airport. Statistics.
 http://www.kutaisi.aero/Statistics?year=-1 (accessed September 2018).

Figure 3 reflects the increase in value added for the hospitality sector in the region of
Imereti, where Kutaisi International Airport is located.

Figure 3: Value Added for the Hospitality Sector in Imereti for the Years 2010–16

 Numbers in millions of USD.
 Source: Authors’ own based on data from the National Statistics Office of Georgia.

 4
ADBI Working Paper 1162 N. Devidze

2.2 The Difference-in-Difference Approach (DiD)
The difference-in-difference (DiD) approach enabled us to see the effect of a particular
infrastructure project by computing the difference over time (before and after
intervention) and across different regions. The key DiD method assumption is that,
without the policy or the project, the changes in outcomes (i.e., trends) between the
beneficiaries, or the affected group, and the non-beneficiaries, or the non-affected group,
are the same over time (Yoshino and Abidhadjaev 2017).

2.2.1 Our Modified DID Model
The DiD approach helped us to measure the difference between the “actual” outcome
and the alternative outcome. For this purpose, we divided the data into control and
treated groups on the basis of geography and time. The result should reflect the
difference between pre-intervention and post-intervention data. After observing the
changes in both groups over time, the DID coefficient could be calculated, which served
as a measure of the impact. The DiD coefficient indicated the additional quarterly growth
rate in tax revenues (compared with the same quarter in the previous year) relative to
non-treated regions. From the total of 11 regions in Georgia, we selected three regions
as the beneficiaries of the treatment; the selection criteria were not straightforward and
took several factors into account. The first and most important criterion was geography;
we estimated that the presence of the airport increased
the flow of tourists to the neighboring areas. Another criterion for selection was the
presence of tourism attractions in the region. Even though it might easy to access
geographically, the region should also be attractive to foreign visitors to affect their
decision making. Lastly, we excluded the region of Adjara. It met both criteria; however,
it is served by Batumi International Airport and this makes it hard to distinguish the impact
of the two airports. The regions included in the treatment group are as follows:
 • Imereti—the region where the airport is located. Imereti is attractive to tourists
 due to its natural, ancient, and religious sites. The tourism sector has been
 experiencing a rise in the region recently, and we estimated that one of the
 reasons for this could be better connectivity.
 • Racha-Lechkhumi, Kvemo Svaneti—a mountainous region in West Georgia,
 neighboring Imereti. Racha has high tourism potential and a trend of growing
 tourism. A local airport opened in Ambrolauri, the administrative center of the
 region, in January 2017. The airport has received a very limited number flights
 until now, and most passengers reach it by road. The distance to Ambrolauri from
 Kutaisi International Airport is 94 kilometers, so it is easily accessible by car or
 public transport.
 • Samegrelo-Zemo Svaneti—a region in North-West Georgia, where the tourism
 sector has experienced high growth recently. The region is accessible only by
 road and a local airport, which receives flights from Kutaisi International Airport
 and the local airport in Natakhtari. Kutaisi International airport is the nearest
 airport to the region, at a distance of 219 kilometers from Mestia, the town that is
 the most popular tourist destination in the region.
As a control group, we used the group of three other regions. We selected three regions
in East Georgia that international or local airports do not serve. All of them have tourism
potential; however, in most of the areas, the lack of tourism infrastructure and poor
connectivity may hinder the growth. Tourists mainly access the regions by
the road from Tbilisi. We estimated that they do not receive treatment from Kutaisi

 5
ADBI Working Paper 1162 N. Devidze

International Airport. However, the overall growth in the tourist flow to the country might
affect it, and that is hard to measure.
 • Kakheti—a region in East Georgia with a high tourist flow but accessibility only
 by road. The nearest airport to the region is Tbilisi International Airport, and
 the distance from the central town to Tbilisi International Airport is around
 85 kilometers. Kutaisi International Airport, 300 kilometers away, is reachable.
 The airport currently does not serve the region itself.
 • Shida Kartli—a region in East Georgia with religious and historic sites. The region
 already receives a growing flow of tourism, mostly arriving through Tbilisi. The
 distance from Kutaisi International Airport to the center of the region is 160
 kilometers.
 • Kvemo Kartli—a region in East Georgia with a relatively small tourism sector and
 infrastructure. However, it has high tourism potential due to the presence
 of ancient sites. The region has poor road connectivity, and the airport
 does not serve it. The distance from Kutaisi International Airport is around
 300 kilometers. The region is mainly accessible from East Georgia, and we
 believe that it does not receive treatment from Kutaisi International Airport.
We observed the trends in the selected regions to ensure that the parallel trend
assumption holds. The figure below presents the growth in revenues from the three types
of taxes in the observed regions. We can see that the growth of the taxes in
the regions followed similar trends in the pre-intervention period. Figure 4 reflects the
trends for all six selected regions.

 Figure 4: Total Taxes for the Observed Regions for the Years 2011–17
 (In GEL)

 Source: Authors’ own based on data from the MoF.

 6
ADBI Working Paper 1162 N. Devidze

 Figure 5: Business Taxes for the Observed Regions for the Years 2011–17
 (in GEL)

 Source: Authors’ own based on data from the MoF.

The Tax Code of Georgia envisions six types of taxes within two groups: state
and local.
The government imposes five taxes at the state/national level: corporate income tax,
personal income tax, value-added tax, excise tax, and customs tax. It levies property tax
at the local level under normative acts of local self-governance bodies.
For our analysis, we included in the business taxes corporate income tax, personal
income tax, value-added tax, excise tax, and customs tax, which registered entities
collect, excluding government entities, NGOs, diplomatic entities, and political
organizations.

 Figure 6: Property Taxes for the Observed Regions for the Years 2011–17
 (in GEL)

 Source: Authors’ own based on data from the MoF.

 7
ADBI Working Paper 1162 N. Devidze

We further differentiated between three time periods as we wanted to see the effect
on the different phases after the completion of the project. Since the number of
passengers served has been increasing gradually over time, we differentiated between
short-term, medium-term, and long-term effects:

 Figure 7: Phases for the DID Analysis

A number of different factors might have affected the level of economic activity in the
sector. For this reason, we included the macro-level control variables that could have
affected the economic outcomes of the region. Based on the estimated effect and on the
availability of the data, we selected the following macro-level control variables in the
observed regions: the total labor force, foreign direct investments (FDIs), and bank
lending (total outstanding portfolio). Finally, we specified three equations for the
three groups of taxes: total taxes, business taxes, and property taxes. The equations are
as follows:
Model 1 (the dependent variable is total tax)

 = + ′ ∗ + 1 ∗ + 2 ∗ + 3 ∗ D13 + 4 ∗ D14−15 + 5 ∗ D16−17 +

Model 2 (the dependent variable is business tax)

 = + ′ ∗ + 1 ∗ + 2 ∗ + 3 ∗ D13 + 4 ∗ D14−15 + 5 ∗ D16−17 +

Model 3 (the dependent variable is property tax)

 = + ′ ∗ + 1 ∗ + 2 ∗ + 3 ∗ D13 + 4 ∗ D14−15 + 5 ∗ D16−17 +

Gt, Gb, and Gp are dependent variables representing quarterly growth relative to the
previous year’s same quarter with the following meanings: Gt is the growth rate of total
tax; Gb is the growth rate of business tax; and Gp is the growth rate of property tax. X’
includes three independent variables: the quarterly growth rate of FDI, the quarterly
growth rate of loans outstanding in GEL, and the quarterly growth rate of the labor force.
T is a binary independent variable that takes the value of 1 if the quarter of observation
falls after the opening of the airport (quarter 4 of 2012) and the value of 0 if it belongs to
the previous period. R is a treatment binary variable that takes the value of 1 for regions
in the treatment group and the value of 0 for the control regions. D is a difference-in-
difference binary variable, indicating whether the observation belongs to the treated
regions and the respective time periods.

 8
ADBI Working Paper 1162 N. Devidze

2.3 Data
We compiled a panel data set of tax revenues encompassing six regions of Georgia for
the 9-year period between 2009 and 2017. To ensure better accuracy of the statistical
model, we used quarterly tax data. For the independent variables, we were able to obtain
annual data, which we converted into quarterly data based on the assumption that each
quarter contributed equally to the year-end results.
As the main purpose of the study was to assess the impact of Kutaisi International Airport
on public finance, we obtained quarterly data for the different types of the tax from the
Revenue Service Department of the Ministry of Finance (MoF) of Georgia. We collected
regional-level data on revenues from total taxes, business taxes, and property taxes. For
the control variables, we included data from the National Statistics Office of Georgia
regarding the total labor force and FDI. From the National Bank of Georgia (NBG), we
obtained data indicating outstanding lending from banks in the observed regions.
Table 1 contains descriptive statistics for the dependent and macro control variables for
the five selected regions, divided into two groups: the treated region and the group of
four control regions.
From the data, we observed that the average growth in total taxes and business taxes
was higher for the group of control regions than for the treated regions. However, the
growth had accelerated compared with the pre-treatment period.
The data deployed have two important limitations. The major limitation is that the
data obtained are regional-level data. For a more accurate analysis, we would have
preferred to use district-level data as broad regional data allow other unrelated factors to
influence the results. However, district-level data are not available from the database of
the Revenue Service Department of the MoF. The other limitation of the model is that we
obtained the tax data on a quarterly basis while the data for the control variables were
only available on an annual basis. We had to convert the annual data manually into
quarterly indicators.

2.4 Empirical Results
We constructed the model with robust estimations that enabled us to gain more accurate
outcomes and avoid biased results. To estimate the coefficients in the model, we used
linear regression and the difference-in-difference technique. Based on
our data, we tried to build models using random-effect and fixed-effect regressions.
Afterwards, we performed the Hausman test (Hausman 1978) to determine which
method provides greater efficiency. The Hausman test indicated that the unit-specific
heterogeneity is uncorrelated with all the regressors in the model, the individual
effects are random and follow a normal distribution, and the difference in coefficients
is not systematic. Accordingly, we decided to rely on the results provided by the random-
effect model.

 9
ADBI Working Paper 1162 N. Devidze

 Table 1: Descriptive Statistics for the Dependent and Control Variables
 in our Modified Did Model
 Sample Std
 Variable Name Size Mean Deviation Min. Max.
 All regions
 Total taxes (GEL ’000) 210 35,907.81 25,395.59 1,748.16 94,449.90
 Business taxes (GEL ’000) 210 28,513.87 21,113.30 779.92 87,725.23
 Property taxes (GEL ’000) 210 3,584.56 4,164.43 9.99 26,957.78
 FDI (GEL ’000) 195 14,268.30 30,523.61 –126,719.40 151,343.00
 Labor force (’000) 210 180.71 87.77 16.90 320.70
 Loans outstanding (GEL ’000) 210 182,423.90 159,411.70 427.54 822,581.40
 Growth rates
 Total taxes 186 4.5% 22.1% –75.5% 70.5%
 Business taxes 186 4.7% 26.6% –79.5% 89.1%
 Property taxes 186 18.8% 72.9% –96.3% 322.2%
 FDI 171 91.9% 3,089.9% –4,301.3% 39,400.6%
 Labor force 186 –0.6% 2.5% –5.0% 6.9%
 Loans outstanding 186 38.5% 33.3% –13.4% 268.4%
 Treatment regions: Imereti, Samegrelo Zemo Svaneti, and Racha-Lechkhumi Qvemo
 Svaneti
 Total taxes (GEL ’000) 105 36,872.49 27,241.37 1,748.16 94,449.90
 Business taxes (GEL ’000) 105 30,423.22 23,836.20 779.92 87,725.23
 Property taxes (GEL ’000) 105 3,327.72 3,760.04 9.99 20,254.09
 FDI (GEL ’000) 90 19,284.97 36,469.57 –126,719.40 151,343.00
 Labor force (’000) 105 175.49 120.04 16.90 320.70
 Loans outstanding (GEL ’000) 105 178,369.10 189,571.30 427.54 822,581.40
 Growth rates
 Total taxes 93 1.1% 25.4% –75.5% 70.5%
 Business taxes 93 1.1% 31.1% –79.5% 83.0%
 Property taxes 93 15.9% 79.8% –96.3% 322.2%
 FDI 78 –119.4% 652.9% –4,301.3% 1,360.9%
 Labor force 93 –1.6% 1.5% –5.0% 2.4%
 Loan outstanding 93 39.7% 39.3% –4.0% 268.4%
 Control regions: Kakheti, Shida Kartli, and Kvemo Kartli
 Total taxes (GEL ’000) 105 34,943.14 23,496.85 11,243.63 89,337.00
 Business taxes (GEL ’000) 105 26,604.52 17,897.02 7,666.13 66,135.61
 Property taxes (GEL ’000) 105 3,841.41 4,536.59 231.01 26,957.78
 FDI (GEL ’000) 105 9,968.30 23,649.88 –66,111.67 114,774.10
 Labor force 105 185.92 31.91 133.90 242.20
 Loans outstanding (GEL ’000) 105 186,478.80 122,874.20 25,217.44 497,496.60
 Growth rates
 Total taxes 93 8.0% 17.7% –48.8% 65.0%
 Business taxes 93 8.4% 20.7% –43.5% 89.1%
 Property taxes 93 21.8% 65.7% –85.3% 296.4%
 FDI 93 269.0% 4,149.1% –3,304.4% 39,400.6%
 Labor force 93 0.4% 2.8% –4.6% 6.9%
 Loans outstanding 93 37.3% 26.2% –13.4% 94.1%
Source: Author’s calculations. 1 2

1 The data on the labor force in Imereti region were originally merged with those on the neighboring region
 of Racha-Lechkhumi. Using the ratio of the labor force to the total population and the data on the total
 population for both regions, we were able to separate the numbers for the labor force into the two regions.
 We removed the outlier in the total tax revenue for Imereti in the first quarter of 2011.
2 We translated the FDI data from USD into GEL with the average official exchange rate for each quarter.

 10
ADBI Working Paper 1162 N. Devidze

 Table 2: Hausman Test Results
 Sqrt
 Fixed Effect Random Effect Difference (Diag(V_b-
 Coefficients (b) (B) (b-B) V_B))
 FDI 0.00 0.00 0.00 0.00
 Labor force –0.74 –0.95 0.21 0.28
 Loans outstanding 0.08 0.10 –0.02 0.02
 Time –0.04 –0.04 0.00 0.01
 DiD13 0.26 0.25 0.00 0.01
 Did14_15 0.18 0.18 0.00 0.03
 DiD16_17 0.05 0.05 0.00 0.02
Test: The difference in coefficients is not systematic.
chi2 = (b-B)’[V_b-V_B)^(–1)](b-B) = 1.16.
Prob > chi2 = 0.9919.
Source: Author’s calculations.

The model provided the following results. We could see relatively high quarterly growth
in all types of taxes for at least one phase in the treated regions compared with
the group of control regions in the given time period. The impact on total taxes and
business taxes was statistically significant for the first two brackets of time: the short and
medium terms. The impact was insignificant for both types of taxes for the
long-term period, which might be a result of the change on the national level in the
method of tax accounting that occurred in 2016. From the results, we could conclude
that, after the provision of infrastructure, the rate of the growth in taxes accelerated. The
effect was the strongest in the short term. For the property taxes, we observed a
significant positive effect only in the medium term.
The only significant macro control variable that the analysis revealed was FDI, which
showed a negative effect on the growth of total taxes. We estimated that this might be a
time lag effect as investments might not immediately affect economic activity. The labor
force and outstanding amount of bank loans showed an insignificant effect; we assumed
that this is the result of the data limitation that section 1.4 mentioned. We obtained tax
data on a quarterly basis but data for the control variables were available only on an
annual basis. We manually converted annual data into quarterly indicators, which might
have resulted in inconsistent quarterly data for the control variables.
The highest relative growth for total taxes and business taxes manifested in the
short term with a growth magnitude of 25 and 28 percentage points, respectively.
Property taxes displayed the highest coefficient in the medium term, with growth of
29 percentage points.
Table 3 presents a summary of the DiD analysis, including the estimated DiD
coefficients:

 11
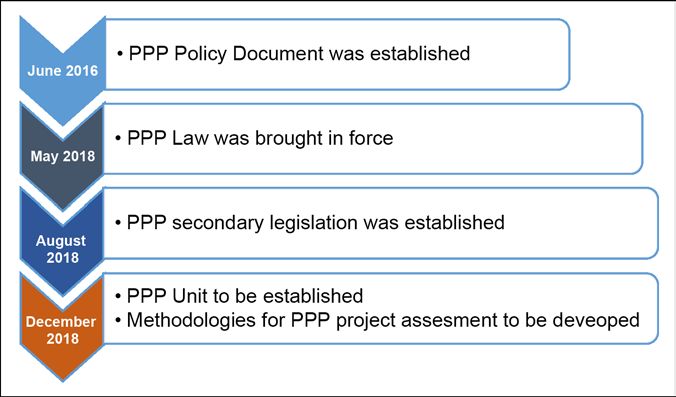
ADBI Working Paper 1162 N. Devidze

 Table 3: Results of the Did Estimations
 Random-Effect GLS Number of Obs. = 171
 Regression Number of Groups = 6
 Estimated Estimated Estimated
 Coefficient for the Coefficient for the Coefficient for the
 Growth Rate of Growth Rate of Growth Rate of
 Total Taxes Business Taxes Property Taxes
 Growth rate of FDI –0.0009*** (0.00) –0.0005*** (0.00) 0.0059*** (0.00)
 Growth rate of labor force –0.95 (1.04) –0.41 (0.93) 2.65 (0.57)
 Growth rate of loans 0.10 (0.1) 0.16 (0.10) –1.06 (0.52)
 outstanding in GEL
 Time –0.04 (0.03) –0.08 (0.03) –0.59* (0.13)
 Treated –0.18*** (0.05) –0.19*** (0.04) –0.23** (0.08)
 DiD13 0.25*** (0.04) 0.28*** (0.05) 0.08 (0.09)
 DiD14_15 0.18*** (0.05) 0.21*** (0.04) 0.29** (0.08)
 DiD16_17 0.05 (0.11) 0.11 (0.11) 0.38 (0.26)
 Constant 0.07 (0.06) 0.00 0.06 0.98*** (0.26)
 R-sq.:
 Within 0.05 0.05 0.28
 Between 0.48 0.65 0.28
 Overall 0.07 0.07 0.28
Significance level: *** p < 0.01; ** p < 0.05; * p < 0.1.
Note: Standard errors are in parentheses.
Source: Author’s calculations.

3. CURRENT STATE OF INFRASTRUCTURE
 FINANCING IN GEORGIA
3.1 Major Sources of Infrastructure Financing
Historically, the major sources of infrastructure financing in Georgia have been donor
financing and concessional loans. However, state budget resources and privatization
have played an important role in infrastructure financing, particularly in the last decade.
This paper briefly reviews the current state of infrastructure financing through different
sources and presents the current regulatory framework for public spending.

3.1.1 External Debt and Donor Financing
The major sources of financing for infrastructure projects in the past have been donor
financing and concessional loans. About 60% of public debt funds infrastructure projects
(United Nations Economic and Social Commission for Asia and the Pacific (UNESCAP)
2017). Of the multilateral lenders, the World Bank followed by ADB have provided the
largest amount of public debt, specifically 60% of the total government external debt as
of August 2018 (MOF 2018). The largest bilateral support has come from Germany-
Kreditanstalt für Wiederaufbau (KFW), followed by Japan International Cooperation
Agency (JICA) and France. The European Bank for Reconstruction and Development
(EBRD) and International Finance Corporation (IFC) have invested heavily in Georgian
infrastructure, mostly in the private sector. As for the donor funds, according to the MoF,
USAID and the EU have provided the greatest support (UNESCAP 2017).

 12
ADBI Working Paper 1162 N. Devidze

Figure 8 shows the external public debt statistics by the share of each lender as of
September 2018.

Figure 8: External Public Debt Statistics: By the Lenders’ Share in the Total Debt

 Source: Authors’ own based on data from the MoF (2018).

3.1.2 State Budget Resources
The 2017 revenues for the general government amounted to 28.7% of the GDP. The tax
revenue was equal to 25.7% of the GDP, while the current expenditure amounted to
29.6% of the GDP, and the government allocated 13.5% of the total budget outlays to
the regional development, infrastructure, and tourism sectors in 2016 (MoF 2018). This
rate will increase; according to a plan that the Government of Georgia has set out, it will
direct 19.9% of the total expenditures of 2018 to the above-mentioned sectors in the
future. Figure 9 presents the sectoral share of the state budget outlays in 2016.

 Figure 9: State Budget Outlays by Purpose

 Source: Authors’ own based on data from the MoF.

 13
ADBI Working Paper 1162 N. Devidze

3.1.3 Privatization
One of the key reforms of the last decade was the privatization of state-owned
enterprises. We can consider the process in Georgia as complete to a large extent.
However, privatization, optimization, liquidation, the development of bankruptcy
procedures, and an increase in transparency remain goals for the state to accomplish.
In 2017, the revenue from the privatization of SOEs and public property amounted to
USD 39.4 million.
The state-owned JSC partnership fund (PF) played a major role in the reform of SOEs.
The government created the PF in 2011, consolidating the ownership of large Georgian
SOEs operating in the transportation and energy sectors. The purpose of the PF was to
promote investments in Georgia by providing co-financing (equity, mezzanine, etc.) in
projects at their initial stage of development (UNESCAP 2017).

3.1.4 Eurobonds
In 2008, the Government of Georgia issued its first USD-denominated Eurobonds on the
London Stock Exchange. In 2011, it refinanced its Eurobonds maturing in 2013 with the
issuance of 10-year Eurobonds. Despite high interest from investors in the new
issuances, the government is reluctant to attract further financing from international
markets as it has access to concessional borrowing from international financial
institutions (IFIs). However, it may return to the market to refinance the Eurobonds
maturing in 2021 (UNESCAP 2017).

3.1.5 Legislative Framework
In 2011, Georgia adopted the Economic Liberty Act (ELA), which came into force in 2014.
The ELA sets the following upper limits:
 • State debt—60% of the GDP;
 • Budget deficit—3% of the GDP;
 • Expenditures—30% of the GDP (the ratio of expenditures plus the increase
 in non-financial assets of the consolidated budget to the GDP should not exceed
 30%).
Since Georgia signed an Association Agreement with the EU in 2014, the fiscal
rule framework should consider the EU fiscal governance framework. A technical
assistance report from the IMF (2018) outlined some fields that need improvement in
fiscal reporting. The overall intention is to move gradually toward the European standards
of fiscal governance.

3.2 A Favorable Climate for Infrastructure Investments
 in Georgia
3.2.1 A Business-Friendly Environment as a Major Incentive
 for the Private Sector to Invest in Georgia
 • Ease of doing business. Georgia occupies the ninth position in the global
 ranking of the ease of doing business, according to Deutsche Bank 2018 data. It
 takes fourth place in the ranking of starting a business. In 2016–17, Georgia
 undertook a reform that improved the protection of minority investors, the ease
 of obtaining electricity, and the resolving of insolvency.

 14
ADBI Working Paper 1162 N. Devidze

 • Liberal tax policy. Following the tax reform that the government approved in
 2017, Georgia occupies the 22nd place in the global ranking of the World Bank
 (WB). According to the WB, Georgia made it easier to pay taxes by abolishing
 the additional annex to corporate income tax returns and by improving the
 efficiency of the online system used for filing VAT returns.
 • Corruption-free government. Georgia is the 46th least corrupt nation out of 175
 countries, according to the 2017 Corruption Perceptions Index of Transparency
 International. The corruption rank in Georgia averaged 76.06 from 1999 until
 2017, reaching an all-time high of 133 in 2004 (Transparency International 2018).
 • Free capital and profit repatriation. Georgia has no restrictions on the
 conversion and repatriation of capital and profit.
Figure 10 presents the global ranking for areas of doing business for Georgia:

 Figure 10: Global Ranking of Doing Business in Georgia

Source: Author’s own based on data from World Bank Group (2018).

3.2.2 Potential to Develop a Logistical Hub
The Government of Georgia has been discussing ambitious infrastructure projects that
will transform the country into a logistical hub for the Chinese-led New Silk Road project.
The Chinese Government expects traffic of USD 24 trillion worth of commodities by 2030
and is engaged in an infrastructural effort allocating almost a billion dollars as of today
to developing the infrastructures necessary to activate the various corridors. The “One
Belt and Road Forum,” which took place in November 2017 in Tbilisi, discussed the
expansion plan of this huge logistics network.
In 2016, the government launched a four-item spatial plan that expects investment of 3.5
billion dollars to develop transit connections through Georgia. According to the plan, the
government aims to construct two logistics centers near the two largest cities of Georgia,
Tbilisi and Kutaisi, to upgrade 550 km of motorways, and to establish a railway network
that will connect the center of the country with the Black Sea coast, where it will develop
the new deep-sea port of Anaklia.

 15
ADBI Working Paper 1162 N. Devidze

3.2.3 Free Trade Agreements (FTAs) Promoting Trade
To date, Georgia has signed FTAs with Commonwealth of Independent States (CIS)
countries and the Association Agreement (“AA”) with the EU, which it signed and ratified
in 2014, including the Deep and Comprehensive Free Trade Agreement (“DCFTA”).
Additionally, on 27 June 2016, Georgia signed an FTA with European Free Trade
Association (EFTA) countries, giving Georgian products duty-free access to the markets
of Iceland, Liechtenstein, Norway, and Switzerland. It has also applied for General
Schemes of Preference for Georgia with the US, Canada, and Japan, resulting in lower
tariffs on 3,400 goods exported from Georgia. (Invest in Georgia, 2018).
In May 2017, the government signed a Free Trade Agreement between Georgia and the
People’s Republic of China (PRC). From 1 January 2018, Georgia can export a number
of products to the PRC with zero tariffs, no additional customs fees, and no transition
period.

3.2.4 Growing Free Industrial Zones
Four free industrial zones (FIZs) are currently operational in Georgia. Private companies
operate all the FIZs. Businesses that have registered in free industrial zones benefit from
certain tax exemptions:
 • If a company produces goods for export in an FIZ, it is exempt from all taxes
 except personal income tax (20%), which it pays from employees’ salaries.
 • If a company imports products from an FIZ to another territory of Georgia, in
 addition to personal income tax, it has to pay VAT and 4% of its revenue from
 national sales.
The Anaklia Development Consortium is working on the master plan to develop a special
economic zone (SEZ) as a complement to the Anaklia deep sea water port. The
consortium foresees the building of a city on 2,000 hectares of the territory, to which the
Constitution of Georgia will give special regulatory status.

4. CURRENT STATE OF PPPS WITH ASSOCIATED
 CHALLENGES AND PROSPECTS
4.1 Historical Evidence of PPPs in Georgia
In 2016, the GoG emphasized the importance of greater inclusion of the private sector
in infrastructure financing and expressed its intention to promote infrastructure financing
through PPPs. In the PPP law (GoG 2018), which it published in May 2018, the GoG
recognized the benefits that PPPs can bring to the state.
Despite the fact that the term PPP became prevalent only recently in Georgia, during the
last decades, the country has run several projects that fit the definition of a PPP. Although
there is no database for the accounting of PPP projects on the national level, to combine
the information from the different sources, 14 PPP projects are currently in progress.
Most of these are in the energy sector, followed by the transport sector, which includes
ports, airports, and so on. The previous partnerships have used different PPP schemes.
Table 4 lists the active PPPs in Georgia, while Figure 11 breaks down the total values of
the ongoing PPP projects by sectoral share.

 Table 4: List of Active PPP Projects in Georgia

 16
ADBI Working Paper 1162 N. Devidze

 Financia
 l
 Closure Value in USD
 Year Project Sector (Million)
 2017 New Deep Sea Water Port of Anaklia Ports 2,500
 2017 Mestiachala 1 and 2 HEPPs Electricity 65
 2017 Gardabani Wastewater Treatment Plant and Water and 25
 Water Supply Infrastructure Rehabilitation Sewerage
 2016 Tbilisi Cluster Healthcare Transformation Project Health 500
 2015 Shuakhevi 187MW Hydropower Plant Electricity 417
 2011 Anadolu Paravani HPP Electricity 157
 2011 Georgia Urban Enerji Ltd. Electricity 157
 2007 Batumi International Airport Airports 29
 2006 Batumi Seaport Ports 92
 2006 Tbilisi International Airport Airports 77
 2004 Khador Hydro Electric Project Electricity 27
 1993 Egrisi Information and 12
 Communications
 Technology ICT
Source: Author’s own based on data from the PPP knowledgelab, InfraPPP, October 2018).

 Figure 11: Breakdown of the Total Value of Ongoing PPP Projects by Sector

 Source: Author’s own based on data from PPP knowledgelab, InfraPPP.

Georgia only outlined the importance of PPPs as an alternative way of financing
infrastructure in 2013. Before 2016, no policy or legal framework defined the rules for
procuring and managing PPPs; accordingly, the public sector followed no formal
procedures. In all cases, the government provided final approval; however, the
identification, announcement, and procurement of the projects did not follow any
universal framework. Until today, there has been no public entity dedicated to PPP
development, and there were generally no requirements for the research and
socioeconomic analysis of the projects until June 2016.
Despite the non-existence of a universal legal framework, for certain fields that have
implemented a number of PPP projects, the government has adopted framework
resolutions providing rules applying to PPP projects in those particular fields only. There
was no principle regulatory body for PPPs; in practice, the Government of Georgia

 17
ADBI Working Paper 1162 N. Devidze

cooperated with the respective ministries for particular PPP cases (Çakmak Publishing
2016).

4.2 Recent Developments of the PPP Policy
According to the Organisation for Economic Co-operation and Development (OECD
2012), one of the most important factors that investors consider when deciding to allocate
resources to infrastructure in a given country are a clear institutional framework,
transparent bidding and awarding procedures, a robust rule of law, and the absence of
political interference. Remarkably, private investors are not comfortable with investing in
projects with greater public intervention with financial support that typically triggers a
higher probability of political interference in project management and contract
renegotiation.
Following the government’s decision to promote PPPs, it initiated the process of
implementing specific legislative framework in 2014. In 2015, the Ministry of Economy
and Sustainable Development of Georgia (MOESD), with technical assistance from ADB
and EBRD, started work on the PPP law. Figure 5 presents the timeline of developments
since 2016.

 Figure 12: Recent Developments of the PPP Policy of Georgia

 Source: Author’s own based on data from the GoG.

4.2.1 PPP Policy Document
The Ministry of Economic and Sustainable Development of Georgia introduced a new
framework in June 2016, with technical assistance from ADB and EBRD. The PPP
assessment factors that the policy outlined were the following:
 • Transparency—publicly available information about possibilities for PPPs and
 ongoing projects
 • Foreseeability—clear and predictable rules
 • Non-discrimination—fair and equal treatment of all foreign and domestic entities
 • Value for money—ensuring maximal efficiency to reach the goals set through the
 evaluation of the balance between expected revenues and expenditures

 18
ADBI Working Paper 1162 N. Devidze

 • Assessment and allocation of risks—adequate distribution of responsibilities and
 risks between parties
 • Fiscal affordability—setting financial responsibilities in a way that does not create
 fiscal risk
The framework outlined well the priority sectors for PPPs (GoG 2016):
 • Transport
 • Social infrastructure (health care, education, etc.)
 • Communal services (energy, water, waste management, etc.)
 • Other sectors (tourism, sport infrastructure, IT, etc.)

4.2.2 PPP Law
The PPP law represents a comprehensive document that creates legislation for
procuring and managing PPPs. The law covers both concession and non-concession
agreements. The document clarifies the definition of a PPP and presents eligibility
criteria. It further describes each phase of a PPP project and defines relevant bodies for
preparing, approving, procuring, and management PPP projects:
The procuring authority of a PPP project can be any relevant ministry or public entity.
It is the authority that is the main body in the initiation and management of the PPP
projects.
The Ministry of Finance (MoF), according to the law, acts as the fiscal authority. The
analysis that the MoF conducts includes fiscal affordability assessment, value-for-money
analysis, and fiscal risk assessment. Based on this analysis, the MoF will provide its
recommendations to the GoG, which should further include these in the process of
preparation of the agreement or in the case of any modifications to the agreement
throughout the life cycle of the project (GoG 2018a).

4.2.3 PPP Unit
According to the law, the PPP unit had to be operational by December 2018. The PPP
unit needs to be the independent public entity that will be under the direct supervision of
the prime minister. Initially, the unit will comprise up to ten people from different fields of
expertise: finance, legal, and procurement. The focus is on bringing in staff from the
private sector who are skilled in financing/structuring long-term infrastructure projects.
The main responsibilities of the PPP unit are the following:
 • Consulting the procuring authority with legal documentation of the tender and the
 project itself.
 • In the case of need, the recruitment, hiring, and monitoring of a consultant for the
 PPP project.
 • Monitoring of the project.
 • Capacity building for a procuring authority.
 • Creation and management of the PPP database.
 • Development of the standards of PPP agreements.

 19
ADBI Working Paper 1162 N. Devidze

The PPP unit does not have the power to initiate a project; however, the government will
encourage it to identify possible projects that the respective body can later initiate (GoG
2018a).

4.2.4 Secondary Legislation
The secondary legislation is a government decree, which it prepared in accordance with
the PPP law. The document aimed to define the rules for implementing each phase of a
PPP. It identified the following stages of a PPP project and provided comprehensive
guidelines for managing every phase:
 • Inception and identification of the project
 • Preparation
 • Finding the private counterparty
 • Project implementation
 • Post appraisal of the project (GoG 2018b)

4.2.5 Methodological Guidelines for Leading PPPs
The MoF in conjunction with the PPP unit aims to establish methodological guidelines,
which will act as guidance for a procuring authority in each phase of the project
implementation. The guidelines will be in accordance with international best practices
and based on the “Legislative Guide on Privately Financed Infrastructure Projects” by
the United Nations Commission on International Trade Law (UNCITRAL 2001).
The concept of the methodologies is in place by this time. However, it is important that
the PPP unit reviews the draft and makes any necessary inputs. Accordingly, the process
will conclude only after the PPP unit becomes active.

4.26 Assessment of the Current Policy by Benchmarking It against
 International Good Practices
In June 2018, the World Bank published a comprehensive study report, “Procuring
Infrastructure Public–Private Partnerships.” It designed the report to help governments
improve their PPP regulatory quality. By benchmarking the regulatory frameworks of
economies around the world against internationally recognized good practices in
procuring PPPs, the assessment identified areas for improvement in the preparation,
procurement, and management of PPPs (WB 2018a).
The study involved 135 economies that had at least one PPP practice. Georgia was part
of the study. The second column of Table 5 presents the WB’s assessment. Considering
that a number of reforms have taken place since it published the report, we decided to
reassess the policy according to the benchmarked criteria that the WB established. Table
5, Table 6, Table 7, and Table 8 present a summary of indicators against the
benchmarked practices learned from the study for the management of the different
stages of PPPs. Columns 3 and 4 provide the reassessment together with comments.
It is notable that, since the policies have experienced important upgrades only recently,
we are not able to make conclusions based on real cases. The assessment relies purely
on what the law defines and respective public documents.

 20
ADBI Working Paper 1162 N. Devidze

 Table 5: Summary of Indicators for Georgia against the Benchmarked Practices
 in the Preparation Phase of PPPs
 Phase 1: Preparation of 2016 According
 PPPs to the WB (2018) Sep. 2018 Comment
 Central budgetary Yes Yes Before and after tendering. Before the
 authority's approval new legislation, the MoF as a
 budgetary authority was involved only
 before tendering. With the updated
 law, the MoF provides the
 recommendation after tendering as
 well, before the GoG makes its final
 decision.
 Fiscal treatment of PPPs No Yes
 PPPs’ prioritization Yes Yes
 consistent with public
 investment prioritization
 Economic analysis Yes Yes
 assessment
 Fiscal affordability Yes Yes
 assessment
 Risk identification Yes Yes
 Comparative assessment Yes Yes
 (value for money analysis)
 Financial viability or Yes Yes
 bankability assessment
 Market sounding and/or Yes Yes The document mentions that the
 assessment project will gain acceptance only if
 there are opportunities for the private
 sector to attract funding. However,
 there is no defined procedure for
 market sounding.
 Environmental impact Yes Yes
 analysis
 Assessments included in No No
 the RFP and/or tender
 documents
 Draft PPP contract included No Yes The secondary legislation requires the
 in the RFP RFP to include a sample of the
 agreement.
 Standardized PPP model No No None of the new policy documents
 contracts and/or transaction mention standardized PPP models.
 documents The reason behind this is to leave
 flexibility around the models or types
 of PPP.
Source: Author’s own based on data from “Procuring Infrastructure Public–Private Partnerships” (WB 2018a) and the
author’s research.

 21
You can also read