Northern Hemisphere continental winter warming following the 1991 Mt. Pinatubo eruption: reconciling models and observations - Atmos. Chem. Phys
←
→
Page content transcription
If your browser does not render page correctly, please read the page content below
Atmos. Chem. Phys., 19, 6351–6366, 2019
https://doi.org/10.5194/acp-19-6351-2019
© Author(s) 2019. This work is distributed under
the Creative Commons Attribution 4.0 License.

Northern Hemisphere continental winter warming following the
1991 Mt. Pinatubo eruption: reconciling models and observations
Lorenzo M. Polvani1,2 , Antara Banerjee1 , and Anja Schmidt3,4
1 Department of Applied Physics and Applied Mathematics and Department of Earth and Environmental Sciences,
Columbia University, New York, NY 10027, USA
2 Lamont-Doherty Earth Observatory, Columbia University, Palisades, NY 10964, USA
3 Department of Chemistry, University of Cambridge, Lensfield Road, Cambridge CB2 1EW, UK
4 Department of Geography, University of Cambridge, Downing Place, Cambridge CB2 3EN, UK

Correspondence: Lorenzo M. Polvani (lmp@columbia.edu)

Received: 29 March 2018 – Discussion started: 31 May 2018
Revised: 2 April 2019 – Accepted: 17 April 2019 – Published: 15 May 2019

Abstract. It has been suggested, and is widely believed, that   pret as the simple fact that the volcanic impact on continental
the anomalous surface warming observed over the North-          winter temperatures is tiny compared to internal variability.
ern Hemisphere continents in the winter following the 1991         We also carefully examine the stratospheric pathway in
eruption of Mt. Pinatubo was, in fact, caused by that erup-     our models and, again confirming previous work, show
tion, via a stratospheric pathway that involves a strength-     that any strengthening of the polar vortex caused by the
ening of the polar vortex. However, most studies that have      Mt. Pinatubo eruption is very small (of the order of a few
examined multiple, state-of-the-art, coupled climate models     meters per second at best). Such minuscule anomalies of the
report that, in the ensemble mean, the models do not show       stratospheric circulation are completely overwhelmed by the
winter warming after the Mt. Pinatubo eruption. This lack       tropospheric variability at midlatitudes, which is known to be
of surface warming in the multi-model mean, concomitant         very large: this explains the lack of surface winter warming
with a frequent lack of strengthening of the polar vortex, is   in the ensemble means.
often interpreted as a failure of the models to reproduce the      In summary, our analysis and interpretation offer com-
observations. In this paper we show that this interpretation    pelling new evidence that the observed warming of the
is erroneous, as averaging many simulations from different      Northern Hemisphere continents in the winter 1991–1992
models, or from the same model, is not expected to yield        was very likely unrelated to the 1991 Mt. Pinatubo eruption.
surface anomalies similar to the observed ones, even if the
models were highly accurate, owing to the presence of strong
internal variability.
   We here analyze three large ensembles of state-of-the-       1   Introduction
art, coupled climate model simulations and show that, in all
three, many individual ensemble members are able to pro-        Large, low-latitude volcanic eruptions produce considerable,
duce post-Pinatubo surface warming in winter that is com-       albeit short-lived, natural perturbations to the radiative forc-
parable to the observed one. This establishes that current-     ing of the Earth’s climate, and thus offer unique opportuni-
generation climate models are perfectly capable of repro-       ties to probe its dynamics. With an estimated peak aerosol
ducing the observed surface post-eruption warming. We also      loading of 30 Tg (McCormick and Veiga, 1992), the eruption
confirm the bulk of previous studies, and show that the sur-    of Mt. Pinatubo in June 1991 was the largest to occur since
face anomaly is not statistically different from zero when      the advent of satellite observation and, in fact, the second
averaged across ensembles of simulations, which we inter-       largest over the entire 20th century (after the 1912 Novarupta
                                                                eruption). Moreover, in terms of dust veil index (Robock,
                                                                2000) and stratospheric optical depth (Sato et al., 1993) it

Published by Copernicus Publications on behalf of the European Geosciences Union.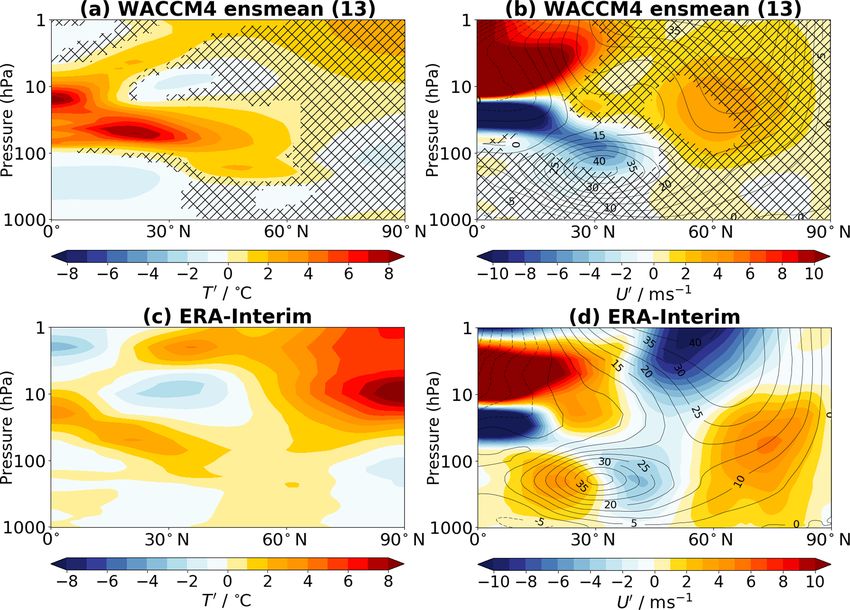
6352                 L. M. Polvani et al.: Post-Pinatubo warming of the Northern continents: Merely internal variability?

stands unrivaled all the way back to the historic eruption of               Part of the widespread belief in the existence of a causal
Mt. Krakatau in 1883, and is therefore the premier candidate            link between low-latitude volcanic eruptions and winter
for understanding how volcanic aerosols affect the climate              warming over the NH continents stems from the fact that
system.                                                                 a mechanism has been proposed to explain that link. Graf
   After the initial cataclysmic eruption of 14–15 June 1991,           et al. (1993), on the basis of highly1 idealized numerical ex-
the aerosol cloud from Mt. Pinatubo spread rapidly and encir-           periments, followed by the observational studies of Kodera
cled the globe in a mere 22 d (Bluth et al., 1992), filling the         (1994) and Perlwitz and Graf (1995), and further numerical
entire tropical belt, both north and south of the Equator, in           studies by Kirchner et al. (1999), Stenchikov et al. (2002)
a couple of months (McCormick and Veiga, 1992) and then                 and many others thereafter, have advocated for the existence
spreading to higher latitudes in subsequent months (Long and            of what we will refer to as a “stratospheric pathway” causally
Stowe, 1994). Since volcanic aerosols are strong scatterers of          linking low-latitude eruptions in summer with midlatitude
incoming solar radiation, they act to cool the troposphere and          surface warming the following winter. The starting point for
the Earth’s surface. By September 1992, the global lower tro-           this mechanism is the well-known fact that sulfate aerosols
posphere had cooled by −0.5 ◦ C (Dutton and Christy, 1992),             of volcanic origin are also strong absorbers of infrared ra-
with an even larger cooling of −0.7 ◦ C in the Northern Hemi-           diation: hence powerful, low-latitude eruptions that are able
sphere (NH). Such large cooling values are comparable to                to penetrate sufficiently high into the atmosphere can cause a
the estimates for the epochal Tambora eruption of 1815 (Mc-             strong warming of the tropical lower stratosphere, in addition
Cormick et al., 1995).                                                  to the tropospheric and surface cooling mentioned above. In
   In the context of such widespread cooling, the surface tem-          the case of Mt. Pinatubo a 2–3 ◦ C warming2 of the tropi-
perature over the NH continents happened to be anomalously              cal lower stratosphere was seen in radiosonde observations
warm in the winter immediately following the Mt. Pinatubo               (Randel, 2010), in agreement with multiple reanalyses (Fuji-
eruption (Robock, 2002). In a series of papers, Groisman                wara et al., 2015). Such a perturbation increases the Equator-
(1992), Robock and Mao (1992), and later Robock and Mao                 to-pole temperature gradient in the stratosphere, notably in
(1995) and Kelly et al. (1996), argued that continental win-            winter, and induces a strengthening of the stratospheric polar
ter warming also occurred following several other eruptions             vortex. The stronger polar vortex, it is claimed, then causes a
since 1850, and suggested that the winter NH warming was                positive phase of the North Atlantic Oscillation (or the North-
actually caused by the volcanic eruptions. Further observa-             ern Annual Mode), which finally results in warmer surface
tional evidence was offered by Shindell et al. (2004), who              temperatures over the NH continents, notably over Eurasia.
expanded the set to a dozen large, low-latitude eruptions, go-              In spite of its simplicity, this proposed mechanism re-
ing back to the year 1600. Their additional evidence, how-              mains unconvincing because it has yet to be properly quan-
ever, includes some perplexing facts. For instance, they show           tified. For instance, one could ask how large is the polar
that the continental winter warming following both the 1883             vortex acceleration caused by an eruption comparable to the
Krakatau and the 1815 Mt. Tambora eruptions is, apparently,             one of Mt. Pinatubo in 1991? A recent study (Bittner et al.,
much smaller than that following the 1982 El Chichón erup-              2016), using a very large ensemble of runs with a well-tested
tion (see Fig. 1 of Shindell et al., 2004): this is difficult to rec-   stratosphere-resolving model, reports a polar vortex acceler-
oncile with the narrative that volcanoes are the major cause of         ation of 3–4 m s−1 at 10 hPa around 60◦ N, but also reports
the NH continental winter warming, since those two earlier              that an ensemble size of 15–20 members is needed to es-
eruptions are larger in magnitude than the later one. Finally,          tablish that fact at the 95 % confidence level (and twice that
after analyzing European climate reconstructions over the               size is needed for a 99 % significance; see their Fig. 2a). But,
last half millennium, Fischer et al. (2007) report the some-            more importantly, Bittner (2015) shows that such a polar vor-
what puzzling result that the wintertime surface tempera-               tex acceleration (of a few meters per second) does not result
ture anomalies following low-latitude eruptions appear to be            in a statistically significant wintertime continental warming,
stronger the second post-eruption year than in the first (recall        even with 100 members. This should not be surprising, as
that only a small fraction of the volcanic aerosols are left in         the internal variability associated with the North Atlantic Os-
the stratosphere in the second winter after an eruption).               cillation can easily overwhelm the surface effects of such
                                                                        a small stratospheric perturbation, as it even confounds the
                                                                        forced signal from increasing greenhouse gases over an en-
                                                                        tire 50-year period (see, for instance, Deser et al., 2017).

                                                                           1 Their model was run in perpetual January configuration, with
                                                                        prescribed sea surface temperatures and sea ice concentrations,
                                                                        forced with an “externally computed” heating rate, but without in-
                                                                        teractive aerosols or ozone chemistry modules.
                                                                            2 At levels close to 20 km, taking the 1-year mean after the erup-
                                                                        tion minus the mean of the preceding 3 years.

Atmos. Chem. Phys., 19, 6351–6366, 2019                                                    www.atmos-chem-phys.net/19/6351/2019/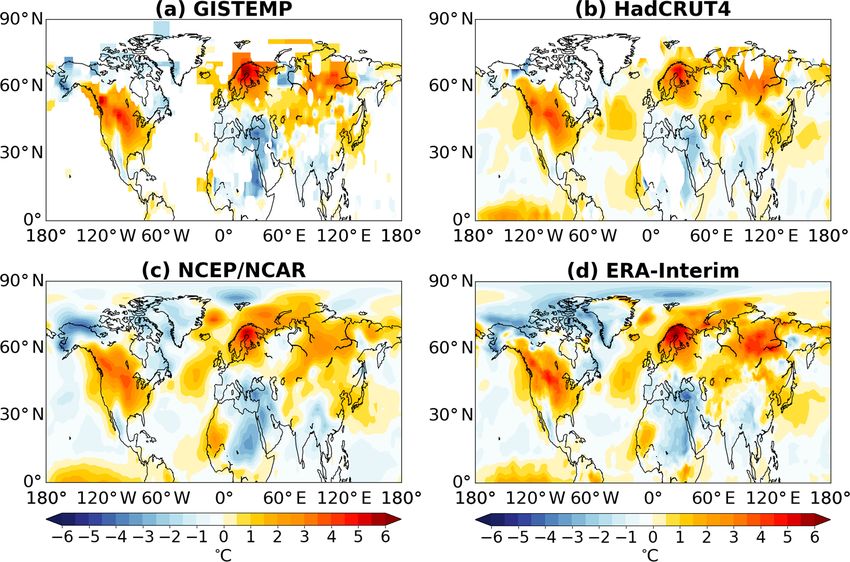
L. M. Polvani et al.: Post-Pinatubo warming of the Northern continents: Merely internal variability?                           6353

   In fact, the original stratospheric pathway mechanism has     in the forced response of the polar vortex in the winter fol-
been called into question, even by its original proponents.      lowing volcanic eruptions.
Stenchikov et al. (2002) suggested that the stratospheric           And lastly, Zambri and Robock (2016) reanalyzed the
pathway may be part of a more complex mechanism and, on          CMIP5 models using a different methodology. Averaging
the basis of results from a single model, proposed that an ad-   only the largest eruptions, and only the first winter after those
ditional tropospheric pathway may be equally important. In       eruptions, they concluded that “most models do produce a
addition, Graf et al. (2007) reported that observations actu-    winter warming signal, with warmer temperatures over NH
ally show increased planetary wave activity in the winter fol-   continents and a stronger polar vortex in the lower strato-
lowing the Mt. Pinatubo eruption, which is at odds with the      sphere,” directly contradicting Driscoll et al. (2012).
claim that an anomalously strong polar vortex would cause           It is in the context of such multiple inconsistent claims that
NH surface warming that winter, and completely invalidates       our paper aims to answer two questions:
the original mechanism. Thus, they suggest “that the climate
effects of volcanic eruptions are not being explained by the         1. Are current-generation climate models able to simulate
excitation of inherent zonal mean variability modes such as             the continental winter warming in the NH following the
the strong polar vortex or Northern Annular Mode, but rather            1991 Mt. Pinatubo eruption?
is another mode that possibly reflects upon the North Atlantic       2. If so, does the stratospheric pathway proposed by
Oscillation” (Graf et al., 2007).                                       Robock and Mao (1992) and Graf et al. (1993) play any
   Furthermore, one can find in the literature many model-              role in simulating that warming?
ing studies whose findings are often diametrically opposite to
each other. We will not exhaustively cite all previous papers,   Analyzing large ensembles of model integrations from three
but simply limit ourselves to highlighting a few key stud-       different state-of-the-art coupled climate models over the his-
ies to illustrate the contradictory claims that can be found     torical period, we show below that (1) models are perfectly
in the peer-reviewed literature. Let us start by summarizing     capable of simulating NH continental warming in the winter
the findings of Driscoll et al. (2012), who analyzed 13 mod-     following the Mt. Pinatubo eruption, but (2) the stratospheric
els from the Climate Model Intercomparison Project, Phase        pathway – and, more importantly, the Mt. Pinatubo eruption
5 (CMIP5). These models were specifically selected so as         itself – very likely played no significant role in the occur-
to have at least two ensemble members available. Compar-         rence of that warming.
ing the average across all the models, as well as the averages
across all the members of the each model, they concluded
                                                                 2     Methods
that “none of the models manage to simulate a sufficiently
strong dynamical response,” given the absence of NH con-         2.1    The models
tinental warming following the Mt. Pinatubo eruption in the
model averages. Their study confirms the earlier conclusion      Three large ensembles of integrations with state-of-the-art,
reached with the CMIP3 models (Stenchikov et al., 2006),         comprehensive climate models are analyzed in this paper.
and many other studies (e.g., Thomas et al., 2009; Marshall      All our models include atmosphere, land, ocean and sea ice
et al., 2009; Bittner, 2015; Wunderlich and Mitchell, 2017).     components, fully coupled 3 to accurately simulate the cli-
   Against this body of evidence, analyzing two versions of      mate system response to the Mt. Pinatubo eruption. Here are,
the NASA/GISS model, Shindell et al. (2004) have claimed         in brief, the specifications of our three models: WACCM4,
that “driven by solar heating induced by the stratospheric       CAM5-LE and CanESM2.
aerosols, these models produce enhanced westerlies from the
lower stratosphere all the way to the surface” and a signifi-        – WACCM4 is the Whole Atmosphere Community Cli-
cant wintertime warming over the NH continents, in agree-              mate Model, version 4, developed by the Community
ment with Graf et al. (1993) and Kirchner et al. (1999), who           Earth System Model (CESM) project. WACCM4 is a
also claimed that climate models are able to simulate the con-         high-top model, with a lid at 140 km and 66 vertical
tinental winter warming following the Mt. Pinatubo eruption            levels and a horizontal resolution of ∼ 2◦ . Its climate
via the stratospheric pathway. In fact, Shindell et al. (2004)         over the 20th century has been thoroughly evaluated by
concluded that their results “provide a further strong indi-           Marsh et al. (2013), who present further details about
cation of the critical role of the stratosphere in the dynamic         this model. We emphasize that WACCM4 also includes
response to external forcing,” with a suggestion that a well-          interactive stratosphere ozone chemistry and, therefore,
resolved stratosphere is crucial for capturing the NH winter           has the most realistic representation of stratospheric
warming that would be caused by volcanic eruptions. That               dynamics and chemistry of the three models analyzed
suggestion, however, would seem soundly refuted by the ev-             here.
idence presented in Charlton-Perez et al. (2013), who sep-           3 Note that was mostly not the case in the earlier studies. Graf
arately analyzed models with and without a well-resolved         et al. (1993), Kirchner et al. (1999), Stenchikov et al. (2002) and
stratosphere, and showed no difference between the two sets      Shindell et al. (2004) did not use fully coupled climate models.

www.atmos-chem-phys.net/19/6351/2019/                                              Atmos. Chem. Phys., 19, 6351–6366, 2019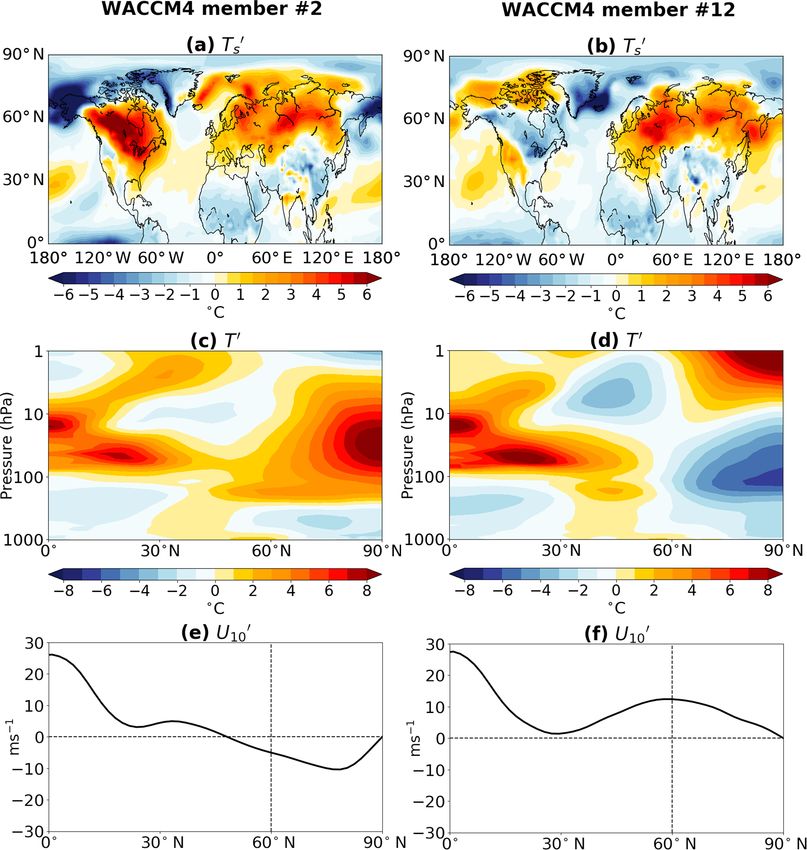
6354                  L. M. Polvani et al.: Post-Pinatubo warming of the Northern continents: Merely internal variability?

  – CAM5-LE was also developed under the CESM project,                of Mt. Pinatubo end, in view of the following. First,
    with ocean and sea ice components similar to those                as already noted, that eruption is the best observed of
    of WACCM4. However, the atmospheric component                     all known eruptions, and thus offers the best opportu-
    of CAM5-LE is very different: it is a low-top model               nity to contrasting models and observations. Second,
    with only 30 vertical levels but with a higher horizon-           one can easily argue that every eruption is unique: for
    tal resolution (∼ 1◦ ) and, most importantly, employs             instance, while the aerosol cloud from Pinatubo spread
    very different physical parameterizations than those in           out in both hemispheres, the cloud of Mt. Agung spread
    WACCM4 (Neale et al., 2010) and, in fact, has a con-              primarily into the Southern Hemisphere (Viebrock and
    siderably different climate sensitivity (Gettelman et al.,        Flowers, 1968). So, combining these seems inappropri-
    2013). CAM5-LE has been at the heart of the CESM                  ate. Third, and most importantly, since we are seeking
    Large Ensemble Project (see Kay et al., 2015, for de-             to isolate and quantify the forced response to volcanic
    tails) and its performance, therefore, has been thor-             eruptions, it makes no sense to average eruptions of dif-
    oughly tested in dozens of studies which have analyzed            ferent magnitudes. This would be tantamount to trying
    its output.                                                       to estimate the Earth’s climate sensitivity by averaging
                                                                      together 2×CO2 and 4×CO2 model runs. And we do
  – CanESM2 is the second-generation Canadian Earth
                                                                      not know whether the forced response varies linearly
    System Model, developed at the Canadian Centre for
                                                                      with the magnitude of an eruption. Other recent studies
    Climate Modelling and Analysis (CCCma). The atmo-
                                                                      have also argued against averaging stronger and weaker
    spheric component of CanESM2 is a spectral model
                                                                      eruptions when seeking to isolate their climatic impacts
    with an approximate horizontal resolution of 2.8◦ and
                                                                      (Bittner et al., 2016; Zambri and Robock, 2016).
    with 35 unevenly spaced vertical levels and a model top
    near 0.1 hPa. For more details the reader may consult
                                                                   2. Choice of winters. We will here analyze only the first
    von Salzen et al. (2013). Again, this is a well-tested
                                                                      winter following the June 1991 eruption, i.e., the 3-
    model which has contributed a whole suite of runs to
                                                                      month period from December 1991 to February 1992.
    the CMIP5 project, and it has been widely used in many
                                                                      Many (if not most) of the earlier studies assumed that
    climate studies (e.g., Swart et al., 2015).
                                                                      the effect of volcanic eruptions can be felt for several
We note that all three models were previously used to study           years, and averaged together the first and second win-
the climatic effects of volcanic eruptions (English et al.,           ters after each eruption. We see no cogent reason for
2013; Lehner et al., 2016; Gagné et al., 2017). More im-              doing so: the Mt. Pinatubo volcanic aerosols were re-
portantly, for all three models we have available a large             moved from the atmosphere with an e-folding timescale
ensemble of integrations which cover the second half of               of about 12 months (Barnes and Hofmann, 1997), so
the 20th century. For these integrations, the models include          that the aerosol optical depth in January 1993 is much
all known natural and anthropogenic forcings, as per the              smaller than in January 1992 (see also Long and Stowe,
so-called “historical” specifications of the CMIP5 protocol           1994). Furthermore, if indeed the stratospheric pathway
(Taylor et al., 2012). Specifically, we have analyzed 13 runs         is crucial to carrying the response down to the surface at
with WACCM4, 42 runs with CAM5-LE, and 50 runs with                   higher latitudes, it is difficult to imagine what memory
CanESM2. We stress that the model forcings are identical for          the stratosphere would posses in the winter of 1993 of
all members of the same ensemble. The differences among               an eruption that occurred in June 1991. The recent study
members of the same ensemble arise uniquely from minus-               of Zambri and Robock (2016) also argues that only the
cule perturbations imposed on the models’ atmospheric ini-            first winter should be used since “averaging the first two
tial conditions: the differences allow us to explore the inter-       winters after each eruption may have had a damping ef-
nal variability of the system which, in many cases, can be            fect.”
much larger than the response to an external forcing, be it
natural or anthropogenic. The reader is referred to Deser et al.   3. Choice of reference period. Here we follow the method-
(2012) for the seminal exposition of this methodology.                ology of Stenchikov et al. (2006) and Driscoll et al.
                                                                      (2012), and define the wintertime anomalies after
2.2    The analysis                                                   the Mt. Pinatubo eruption as the difference between
                                                                      1991/1992 winter and the mean of the winters in the
We here discuss three key methodological choices we made
                                                                      1985–1990 reference period. While this need not be the
in designing the best strategy to determine whether current-
                                                                      best way to quantify the post-eruption anomalies, we
generation climate models are able to capture the wintertime
                                                                      nonetheless adopt it in order to be consistent with re-
NH continental warming following volcanic eruptions.
                                                                      cent studies that analyzed models similar to ours (Bit-
 1. Choice of eruption. Although the model runs available             tner et al., 2016; Zambri and Robock, 2016). As we will
    to us cover the 1963 Agung and 1982 El Chichón erup-              show below, our conclusions differ significantly from
    tion, we will here focus solely on the 1991 eruption              those of previous studies, and we want to make it clear

Atmos. Chem. Phys., 19, 6351–6366, 2019                                           www.atmos-chem-phys.net/19/6351/2019/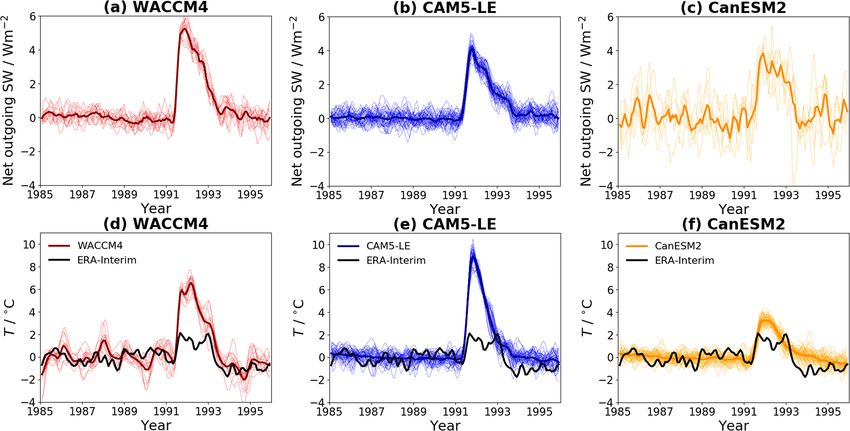
L. M. Polvani et al.: Post-Pinatubo warming of the Northern continents: Merely internal variability?                            6355

     that the choice of reference period is not at the root of       can be turned to our advantage: as will become clear below,
     those differences.                                              the fact that models simulate an unrealistically strong warm-
                                                                     ing of the tropical lower stratosphere after the Mt. Pinatubo
   In summary, for all quantities in all figures below (except
                                                                     eruption greatly strengthens our interpretation and conclu-
Fig. 2) we will be showing and discussing anomalies de-
                                                                     sion.
fined as the difference between the first winter following the
                                                                        With this in mind, we now proceed to examine the sur-
June 1991 Mt. Pinatubo eruption and the reference period
                                                                     face temperature anomalies simulated by our three models
defined in Driscoll et al. (2012). We will refer to these as the
                                                                     following the Mt. Pinatubo eruption, shown in Fig. 3. It is
“post-Pinatubo anomalies,” or just “the anomalies” for short,
                                                                     important to keep in mind that for each ensemble member
and, for simplicity, denote them with a prime (e.g., Ts0 for the
                                                                     the post-Pinatubo anomalies arise from two distinct sources:
surface temperature anomalies).
                                                                     the external forcing and internal variability. The former is
                                                                     computed by averaging together all the members of each en-
3   Can climate models simulate the observed NH                      semble, as that procedure nearly eliminates the internal vari-
    continental warming following the 1991                           ability. For WACCM4, CAM5-LE and CanESM2, Fig. 3a, d
    Mt. Pinatubo eruption?                                           and g show that forced response. In the winter following the
                                                                     Mt. Pinatubo eruption, all three models show no statistically
It is useful to start by recalling what the observed winter-         significant response in NH continental surface temperatures.
time, post-Pinatubo, surface temperature anomalies over the             We stress that this result is in agreement with most of
NH continents actually look like. They are shown in Fig. 1,          the literature on this subject, notably the multi-model stud-
from four different datasets: two observational ones, GIS-           ies with the CMIP3 and CMIP5 models (Stenchikov et al.,
TEMP (Hansen et al., 2010) and HadCRUT4 (Morice et al.,              2006; Driscoll et al., 2012; Wunderlich and Mitchell, 2017),
2012), and two reanalyses, NCEP/NCAR (Kalnay et al.,                 which have shown that the forced post-Pinatubo anomalies
1996) and ERA-Interim (Dee et al., 2011). Note the excellent         in those models are not statistically significant. Moreover, it
agreement between these four data products, which all show           has been validated with an even larger ensemble size: Bit-
warming over both North America and the Eurasian conti-              tner (2015), employing a fully coupled stratosphere resolv-
nent. The fact that both continental masses were anomalously         ing model, concluded that after Mt. Pinatubo “the continental
warm is of relevance for the stratospheric pathway mecha-            winter warming over Northern Europe and Siberia is not sig-
nism to be discussed in the next section. These anomalies            nificantly different from zero even with 100 ensemble mem-
are also in excellent agreement with the lower tropospheric          bers” (as shown in Fig. 6.4 of that doctoral dissertation).
temperature anomalies from the Microwave Sounding Unit,                 However, and this is perhaps the key point of our pa-
Channel 2 (MSU2) satellite observations shown by Robock              per, from the fact that the ensemble mean (i.e., the forced)
(2002), albeit for a slightly different reference period.            anomalies are not significant, it is erroneous to conclude that
   We now turn to analyzing the models. Before showing the           the models are unable to simulate the NH continental win-
simulated surface temperatures, however, we wish to illus-           ter warming following the eruption. Recall that the observed
trate the models’ response to the Mt. Pinatubo eruption in           anomalies are not expected to resemble the ensemble mean
the stratosphere, as the warming of the tropical stratosphere        of any set of simulation, as internal variability is superim-
is an essential component of the stratospheric pathway mech-         posed on any forced response in the observations. The correct
anism. The global top-of-the-atmosphere (TOA) net outgo-             question to ask is do any individual simulations resemble the
ing shortwave radiation anomalies are shown in Fig. 2a, b,           observations? Or, more precisely, do the observed anoma-
c, for WACCM4, CAM5-LE and CanESM2, from left to                     lies fall within the range, over the ensemble, of the simulated
right. These panels may be contrasted directly with Fig. 2           anomalies? The answer to that question is a resounding yes,
of Driscoll et al. (2012), as they demonstrate that our three        as we show next.
models are comparable to most CMIP5 models.                             Since that answer crucially depends on the range of
   The resulting warming of the tropical lower stratosphere          anomalies that any one model is able to simulate, we start
(30◦ S–30◦ N) is shown in Fig. 2d, e, f. The ERA-Interim             by illustrating that range. In Fig. 3b, e, h we show the ex-
reanalyses are also shown for comparison (black curves in            treme members, i.e., the members with the largest warming
each panel). While the CanESM2 model appears to be in                anomalies, for each of the three models we have analyzed.
good agreement with the observations, both WACCM4 and                Noting that the color bar is identical to the one in Fig. 1, it
CAM5-LE greatly overestimate the post-eruption warming               is clear that the models are able to simulate much stronger
in the lower stratosphere. Reanalyses show an anomaly of             warming anomalies than the observed ones. Even more, dif-
roughly 2 ◦ C, but those models show ensemble mean anoma-            ferent ensemble members of the same models, with an identi-
lies closer to 6 and 9 ◦ C, respectively. This is not exceptional,   cal volcanic forcing, are able to simulate equally strong cool-
as Driscoll et al. (2012) reports that most CMIP5 models sim-        ing over the northern continents, as shown in Fig. 3c, f, i,
ulate a much stronger anomaly than was observed (see their           where the coldest members can be seen. The point of this
Fig. 3). The interesting point, however, is that this model bias     figure is to illustrate how large the internal variability is (in

www.atmos-chem-phys.net/19/6351/2019/                                                 Atmos. Chem. Phys., 19, 6351–6366, 2019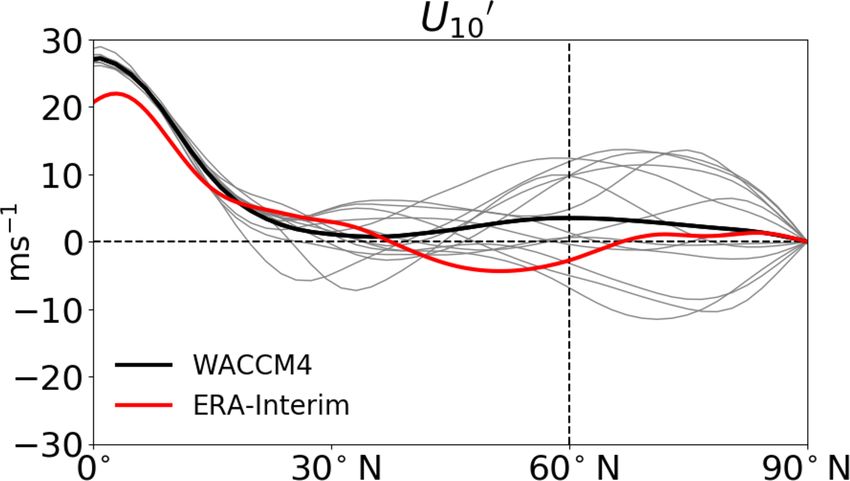
6356                 L. M. Polvani et al.: Post-Pinatubo warming of the Northern continents: Merely internal variability?

Figure 1. Surface air temperature anomalies (◦ C) for the post-Pinatubo winter of 1991–1992 relative to the reference period (1985–1990) in
observations (a) GISTEMP and (b) HadCRUT4 and in reanalyses (c) NCEP/NCAR and (d) ERA-Interim.

Figure 2. (a, b, c) Globally averaged, deseasonalized, net, outgoing SW radiation at the top of the atmosphere (W m−2 ). (d, e, f) Tropically
averaged (30◦ S–30◦ N), deseasonalized temperature (◦ C) at 50 hPa. (a, d) WACCM4 (red lines). (b, e) CAM5-LE-LE (blue lines). (c, f)
CanESM2 (yellow lines). In each panel, the time series for each ensemble member (thin lines) and for the ensemble mean (bold line) are
shown. In the bottom row, ERA-Interim values are also shown for comparison (black). All time series are anomalies from the 1985–1990
mean, and are smoothed with a 3-month running average, for direct comparison with Figs. 2 and 3 of Driscoll et al. (2012).

these models) and how tiny the forced response is in compar-             anomaly averaged over the landmasses in the region (40–
ison. For completeness, the surface temperature anomalies                70◦ N, 0–150◦ W), roughly corresponding to the Eurasian
for each member of each ensemble are shown in Figs. S1–S5                continent. First note that the mean of each ensemble is very
in the Supplement.                                                       near zero (a few tens of degrees at most, and not statistically
   We quantify the relative magnitude of the forced response             significant), confirming the results of many previous studies
and the internal variability in Fig. 4 with box-and-whisker              that the forced response in the NH midlatitudes in the winter
plots for the quantity Ts0 , defined as the surface temperature          following the Mt. Pinatubo eruption is basically nonexistent

Atmos. Chem. Phys., 19, 6351–6366, 2019                                                    www.atmos-chem-phys.net/19/6351/2019/
L. M. Polvani et al.: Post-Pinatubo warming of the Northern continents: Merely internal variability? 6357
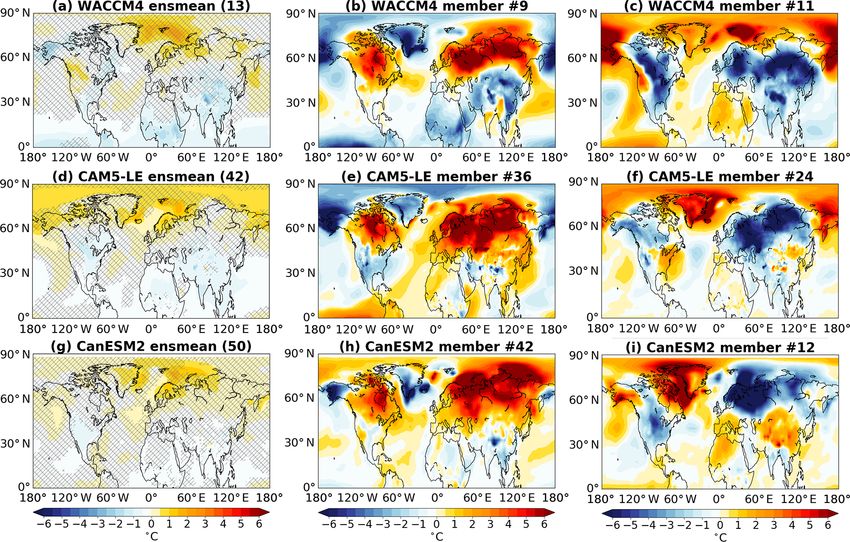
Figure 3. Wintertime surface air temperature anomalies (◦ C) as simulated by WACCM4 (a, b, c), CAM5-LE (d, e, f) and CanESM2 (g,
h, i) following the 1991 Mt. Pinatubo eruption. (a, d, g) The ensemble mean for each model (with the number of ensemble members
in parentheses), and hatching over areas where the anomalies not significant at the 95 % confidence level. (b, e, h) Individual members
exhibiting extreme warming over the NH continents for each model. (c, f, i) Individual members exhibiting extreme cooling.
in the models. Second, the models are in reasonably good model, as the other two do not have an accurate representa-
agreement about the internal variability, showing a warming– tion of the stratosphere and, more importantly, of its variabil-
cooling range of 2 to 4 ◦ C on each side of zero, which is much ity. We recognize that 13 members may perhaps not qualify
larger than the forced response. Third, and most importantly, as a “large” ensemble but, as we will show, the results pre-
the reanalysis (red dot) falls well within the simulated range, sented below are in excellent agreement with those of Bittner
indicating that the models are perfectly capable of capturing et al. (2016), who analyzed a much larger4 100-member en-
the post-Pinatubo winter anomalies in the NH. semble.
Now, to quantify the strength of the polar vortex we com-
pute the quantity U10 0 , defined as the anomaly in the zonal
4 Does the stratospheric pathway play a role in mean, zonal wind at 10 hPa and 60◦ N. This quantity is
simulating the NH winter warming following the widely used for the detection of stratospheric sudden warm-
Pinatubo eruption? ings (see, e.g., Charlton and Polvani, 2007; Butler and Ger-
ber, 2018). To quantify the meridional lower stratospheric
Having established that our three models are able to simulate temperature gradient we compute the quantity ∇T50 0 , de-
the observed NH continental warming after the Mt. Pinatubo fined as the difference in zonal mean temperature between
eruption, we now turn to examining the stratospheric path-
way mechanism proposed by Robock and Mao (1992),
4 The WACCM4 simulations analyzed here are a lot more com-
Graf et al. (1993), and others. In a nutshell, that mecha-
nism involves two steps: (1) a strengthening of the strato- putationally expensive those in Bittner et al. (2016), as they involve
interactive ozone chemistry. In fact, we are aware of no other study
spheric polar vortex caused by the enhanced Equator-to-
with a coupled atmosphere–ocean–chemistry model which has an-
pole lower stratospheric temperature gradient following the alyzed ensembles with more than a handful of members. Just to
Mt. Pinatubo eruption, which, in turn, causes (2) an anoma- cite a few recent studies, McLandress et al. (2011) analyze three
lous atmospheric circulation resulting in a warming anomaly members, Solomon et al. (2015) six members and Li et al. (2018)
over the Eurasian continent. four members. So, we maintain that a 13-member ensemble with
To carefully investigate the existence of a possible strato- interactive chemistry, and coupled ocean and sea ice components,
spheric pathway, we will limit ourselves to the WACCM4 represents a substantial step forward.
www.atmos-chem-phys.net/19/6351/2019/ Atmos. Chem. Phys., 19, 6351–6366, 20196358 L. M. Polvani et al.: Post-Pinatubo warming of the Northern continents: Merely internal variability?
With this in mind, we now proceed to examining the sec-
ond step of the proposed mechanism, the relationship be-
tween the polar vortex anomaly U10 0 and the Eurasian sur-
0
face temperature anomaly Ts . We find no meaningful cor-
relation between the two, as evident from Fig. 5b (the r 2
value is 0.06), the ensemble mean temperature anomaly is
indistinguishable from zero. It is widely appreciated that the
variability of the midlatitude tropospheric circulation is very
large, so that it can easily overwhelm polar vortex anomalies
of tens of meters per second. In fact, even stratospheric sud-
den warmings – which correspond to massive perturbations
of the stratospheric polar vortex and result in a wind rever-
sal at 10 hPa, from westerlies to easterlies – are not always
able to produce a significant surface signal (see the sudden
warming compendium; Butler et al., 2017).
Figure 4. Box-and-whisker plots of simulated surface temperature
Another way of illustrating the weakness of the connection
anomaly (◦ C) over Eurasia (40–70◦ N, 0–150◦ W) in the first post-
Pinatubo winter (1991–1992) relative to the reference period (1985– between polar vortex strength and Eurasian surface tempera-
1990). The horizontal line inside each box denotes the ensemble ture anomalies is to contrast two WACCM4 ensemble mem-
mean; the lower and upper limits of each box denote the 25th and bers – specifically no. 2 and no. 12 – for which Ts0 is shown
75th percentile values, respectively; the whiskers span the full range in Fig. 6a, b. We have chosen these two particular mem-
of the ensemble members. For comparison, the red circles denote bers as they simulate very similar Eurasian surface warming
the value calculated from the ERA-Interim reanalyses. anomalies, not unlike the ones in the observations. In spite
of those surface similarities, the corresponding stratospheric
temperature gradients are completely different (see Fig. 6c,
the tropics (30◦ S–30◦ N) and the polar cap (60–90◦ N) at d). The tropical lower stratosphere is anomalously warm in
50 hPa: that level is chosen so as to capture the maximum both members, owing to the direct radiative effect of the vol-
amplitude of the stratospheric warming from Mt. Pinatubo at canic aerosols, which is robust. In contrast the polar strato-
low latitudes. The relationship between the U10 0 and ∇T 0 is
50 sphere is anomalously warm for one case (no. 2) but cold
shown in Fig. 5a: their correlation is exceedingly high (with for the other (no. 12). The corresponding temperature gradi-
an r 2 value of 0.89). From the ensemble mean value (black ents ∇T500 are thus of opposite sign and, predictably, the polar
dot) one can see that, indeed, a warming of the tropical lower vortex is anomalously weak for the former and strong for the
stratosphere by a potent low-latitude eruption does result in latter member, as seen in Fig. 6e, f, where we show the zonal
a stronger5 wintertime polar vortex in our model. mean zonal wind at 10 hPa. Note that these opposite-signed
The key question, however, is, how much stronger? In the polar vortex anomalies have an amplitude of about 10 m s−1 ,
case of the Mt. Pinatubo eruption, this is given by the black which is 3 times larger than the forced response documented
circles in Fig. 5a, which indicate the ensemble mean value of above. In spite of such large and opposite-signed polar vortex
3.5 m s−1 for our WACCM4 simulation. This is in excellent anomalies, both members exhibit very similar surface tem-
agreement with the findings of Bittner et al. (2016), who also perature anomalies over Eurasia, as seen in the top row: this
reported 3–4 m s−1 acceleration of the polar vortex follow- demonstrates that polar vortex anomalies do not necessarily
ing large low-latitude eruptions, and emphasized that 15–20 determine the surface anomalies.
ensemble members are need to establish this result in a sta- For completeness, the full vertical structure of the ensem-
tistically significant way (at 95 %). One cannot overempha- ble mean temperature anomalies for the WACCM4 model is
size how minuscule this forced response is when contrasted shown in Fig. 7a. The only statistically significant signal is
with the unforced, internal variability of the wintertime polar found in the tropics, where WACCM4 greatly overestimates
vortex, whose strength can vary by many tens of meters per the post-Pinatubo warming, yielding a temperature gradient
second over a period as short as a week (e.g., during a strato- in the lower stratosphere that is considerably larger than the
spheric sudden warming event, which occurs roughly every observed one: as seen in Fig. 5a, the ensemble-mean sim-
other year; see Charlton and Polvani, 2007). ulated value of ∇T50 0 is 5.3 ◦ C, whereas the observed value
◦
is 0.4 C. In spite of a much larger temperature gradient
5 Although we do not believe that it is appropriate to analyze the
CAM5-LE and CanESM models for possible evidence of a strato-
anomaly than the observed one, we find little statistically sig-
spheric pathway – as those are low-top models with a poorly re- nificant response in the polar stratospheric winds, as seen in
solved stratosphere and thus unrealistic stratospheric variability – Fig. 7b. There is an overall acceleration of the polar vortex, as
we nonetheless include in Fig. S6 the same scatter plots as in Fig. 5, one might expect, but the area of significance is quite small,
to satisfy the request of one anonymous referee. The reader can see and the grid point at 10 hPa and 60◦ N (the canonical metric
that those two other models confirm the WACCM results. for the polar vortex strength) is not statistically significant.
Atmos. Chem. Phys., 19, 6351–6366, 2019 www.atmos-chem-phys.net/19/6351/2019/L. M. Polvani et al.: Post-Pinatubo warming of the Northern continents: Merely internal variability? 6359
Figure 5. Scatter plots showing the relationship between U100 , the anomalies in the zonal mean zonal wind at 10 hPa and 60◦ N (m s−1 )
and the anomalies in (a) the NH meridional temperature gradient ∇T50 0 between the tropics (30◦ S–30◦ N) and the pole (60–90◦ N) (◦ ), and
0 ◦
(b) the Eurasian surface air temperature Ts ( C). Crosses show individual ensemble members, and the black dot shows the ensemble mean
value. The red dot shows the ERA-Interim reanalysis.
This conclusion does not contradict the findings of Bittner between 10 and 1 hPa, and between 50 and 60◦ N, where the
et al. (2016), who reported a statistically significant response climatological polar vortex is located. So we conclude by
of the stratospheric polar vortex after the Mt. Pinatubo erup- asking, how can the stratospheric pathway mechanism be in-
tion in their model. We have only 13 members at our disposal voked as an explanation for the observed warming over the
here, and this is why we are unable to establish clear signif- NH continents, as one can read in Robock (2002), if the polar
icance with WACCM4. To appreciate how difficult it is to stratosphere was actually warmer and the polar vortex was
obtain a statistically significant response in the polar vortex, actually weaker in the winter that followed the 1991 eruption
we show the U10 0 anomalies for each of the 13 members in of Mt. Pinatubo?
Fig. 8: there is a wide scatter across the 13 members, yielding
an ensemble mean which is much smaller than most individ-
ual members. Nonetheless, the fact that only four members 5 Summary and discussion
show a vortex weakening and the remaining nine show a vor-
tex strengthening is suggestive of polar vortex acceleration. The aim of this paper has been to understand the cause of
Using a different high-top model, Bittner et al. (2016) found the warm anomalies that were observed over the NH con-
that 15–20 ensemble members were needed to obtain a statis- tinents following the Mt. Pinatubo eruption in June 1991.
tically significant strengthening of the polar vortex, and our More specifically, referring back to the introduction, we have
ensemble size is not too far below that threshold. addressed two related but distinct questions: the ability of the
More important, however, is the red line in Fig. 8, show- models to simulate the observations and the importance of
ing the ERA-Interim anomalies: it indicates that the polar the stratospheric pathway.
vortex was, actually, anomalously weak in the winter fol- First, we have demonstrated that the current generation
lowing the Mt. Pinatubo eruption. For clarity, we show the of coupled climate models is eminently capable of simulat-
entire latitude–pressure profiles of the ERA-Interim temper- ing such anomalies. Unlike previous studies, our conclusion
ature and wind anomalies in Fig. 7c, d. Amazingly6 enough, follows from comparing the observed anomalies to individ-
the polar stratosphere was anomalously warm (not cold) af- ual model simulations, not to the average of multiple sim-
ter the eruption (panel c), and the polar vortex was anomalous ulations. We have shown that climate models, when forced
weak (not strong): note, in panel d, the negative zonal wind with an identical volcanic perturbation, can actually simulate
a much larger surface warming than observed and, in fact,
6 This crucial fact seems to have gone largely unnoticed in the lit-
an equally large cooling. Furthermore, confirming many pre-
erature. It is reported in the doctoral dissertation of Thomas (2008, vious studies, we have shown that averaging across model
see her Figs. 4.16 and 4.17), and tangentially noted by Mitchell
simulations results in statistically insignificant surface tem-
et al. (2011, see their Fig. 8, and the accompanying text), who
employed so-called “elliptical” diagnostics for the polar vortex. It
perature anomalies in the NH following the eruption. Taken
is also briefly discussed in Toohey et al. (2014, see their Fig. 1), together, and assuming climate models are not fundamentally
who argue that wintertime stratospheric state in the first winter after flawed, these facts are here interpreted as follows: the internal
Mt. Pinatubo may be not be representative of the “pure response” to variability of the climate system in the NH in wintertime is
the volcanic aerosols owing to confounding factors (e.g., the Quasi- much larger than any impact from the Mt. Pinatubo eruption.
Biennial Oscillation). As a consequence, it is hard to imagine that any substantial
www.atmos-chem-phys.net/19/6351/2019/ Atmos. Chem. Phys., 19, 6351–6366, 20196360 L. M. Polvani et al.: Post-Pinatubo warming of the Northern continents: Merely internal variability?
0 anomalies for
Figure 6. The surface temperature Ts0 (a, b), the zonal mean temperature T 0 (c, d) and 10h hPa zonal mean zonal wind U10
WACCM4 member no. 2 (a, c, e) and member no. 12 (b, d, f).
fraction of the observed warming anomalies in the NH during ical lower stratosphere (see Figs. 2d and 7a, b), which im-
the 1991–1992 winter were caused by that volcanic eruption. plies an unrealistically strong acceleration of the polar vor-
Second, we have examined in detail the potential role of tex. Even so, that acceleration is actually not statistically sig-
an often invoked stratospheric pathway mechanism, which nificant in our 13-member WACCM4 ensemble. This is in
would allegedly mediate the signal from a low-latitude erup- total agreement with the recent study of Bittner et al. (2016),
tion to the higher-latitude continents by accelerating the polar who reported that 15–20 members are needed to detect a
vortex, and subsequently causing a positive phase of North significant acceleration of the polar vortex of 3–4 m s−1 in
Atlantic Oscillation (or the annular mode). Analyzing the the winter following a large-magnitude low-latitude eruption.
WACCM4 model, which is a stratosphere-resolving model This, in and of itself, is clear evidence that the forced po-
with interactive stratospheric ozone chemistry, we find the lar vortex response is very small compared to the internal
polar vortex acceleration accompanying the increased lower stratospheric variability in wintertime, where wind pertur-
stratospheric temperature gradient after the Mt. Pinatubo bations of many tens of meters per second are not unusual.
eruption to be no larger than a few meters per second at best. And ultimately, in terms of affecting the tropospheric circula-
And, we wish to emphasize, the WACCM4 model (like most tion and surface temperature, such small polar vortex anoma-
others) produces an unrealistically large warming of the trop- lies are completely dwarfed by the internal tropospheric vari-
Atmos. Chem. Phys., 19, 6351–6366, 2019 www.atmos-chem-phys.net/19/6351/2019/L. M. Polvani et al.: Post-Pinatubo warming of the Northern continents: Merely internal variability? 6361
Figure 7. Latitude–pressure anomalies for the winter following the 1991 Mt. Pinatubo eruption. (a, c) Zonal mean temperature (T 0 ). (b, d)
Zonal mean zonal wind U 0 , with the climatology in black contours. (a, b) The ensemble mean of the WACCM simulations, with hatching
for values that are not significant at the 95 % confidence level. (c, d) Corresponding anomalies in the ERA-Interim reanalysis.
tion of the stratosphere and, more crucially, of its variability,
and this resulted in an overestimate of the forced response to
the volcanic eruption. For instance, the model employed in
Graf et al. (1993) had a mere 19 vertical levels in the verti-
cal direction, with the model top at only 10 hPa. The same
applies to the study of Kirchner et al. (1999), who improved
the horizontal resolution but retained the same deficient ver-
tical structure of their model. A severe lack of vertical reso-
lution is also evident in the AMIP models analyzed in Mao
and Robock (1998), all of which (with only one exception)
have between 10 and 20 vertical levels (see Table 2 of Gates,
1992). The same goes for the study of Collins (2003): 19 ver-
0 ) vs. lat-
Figure 8. Zonal mean zonal wind anomalies at 10 hPa (U10 tical levels. As for Shindell et al. (2004), the two models used
itude, for the individual WACCM4 simulations (gray), for the en- in that study have only 20 and 23 vertical levels, and the lat-
semble mean (black) and for the ERA-Interim reanalysis (red). ter has a very coarse horizontal resolution as well (8◦ latitude
× 10◦ longitude): that model was, in fact, evaluated for its
ability to simulate stratospheric sudden warmings, and was
found to greatly underestimate their frequency (see Fig. 3c
ability; this is why no statistically significant anomalies are
of Charlton et al., 2007, under the item GISS23). The reader
found when averaging over many model simulations.
may want to contrast that model with the WACCM4 model
One might now ask how such evidence can be reconciled
used here, with 66 vertical levels, a model top at ∼ 140 km
with several influential early modeling studies, which have
and an excellent simulation of the frequency of stratospheric
argued for the key role of the stratospheric pathway in caus-
sudden warmings (see Fig. 3a of Marsh et al., 2013).
ing the NH continental surface warming in the winter fol-
A note is also in order regarding the recent study of Zambri
lowing the Mt. Pinatubo eruption. We suggest the following:
and Robock (2016). They reanalyzed a larger set of CMIP5
most of those early models simply lacked a good representa-
www.atmos-chem-phys.net/19/6351/2019/ Atmos. Chem. Phys., 19, 6351–6366, 20196362 L. M. Polvani et al.: Post-Pinatubo warming of the Northern continents: Merely internal variability?
models than those in Driscoll et al. (2012), and considered canic signal at the surface. And our findings simply corrobo-
only the anomalies in the first winter after the eruptions. rate those of Bittner (2015, see his Fig. 6.4, specifically), who
From the multi-model average anomalies following the two showed that even 100 identically forced, large, low-latitude
largest eruptions since the preindustrial era they concluded eruptions are insufficient to yield a statistically significant
that “the observed surface temperature anomalies are related surface winter warming at high northern latitudes.
to changes in the winter circulation caused by the volcanic It is not impossible, we concede, that an extraordinarily
eruptions” (emphasis added), a claim obviously at odds with large eruption (e.g., Tambora) may be capable of causing sig-
much of the previous literature, and with the results presented nificant winter warming over the NH continents. But a ques-
here. However, as their conclusion was drawn by averaging tion then arises: how many such eruptions are actually avail-
anomalies from the 1883 Krakatau eruption with those from able in the record for which reliable observations of winter
the 1991 Mt. Pinatubo eruption, it is not immediately obvi- surface temperatures at high latitude also exist? As of this
ous how to disentangle the forced response to Mt. Pinatubo writing, the most compelling observational evidence for a
alone, which is the primary goal of the present study. We volcanically forced surface winter warming at high latitudes
plan to carefully examine other volcanic eruptions in future is found in the study of Fischer et al. (2007). They averaged
studies. 15 large, low-latitude eruptions extending back to the middle
Nonetheless, we have briefly analyzed other recent7 erup- of the last millennium, and carefully separated the first and
tions simulated by the three models described in Sect. 2.1. second winter anomalies in temperature (and precipitation)
Of particular interest is the 1982 eruption of El Chichón over Europe. Notably, they found that the warmer (and wet-
(Robock, 1983), which was also followed by anomalous win- ter) winter anomalies are found in the second winter follow-
tertime warming over the Northern Hemisphere continent ing the eruption, not the first winter. This result was obtained
(as shown in Fig. S7). As for the 1991 Mt. Pinatubo erup- from a single proxy reconstruction, and warrants indepen-
tion, all three models produce (1) a statistically insignificant dent validation with one or more different reconstructions.
forced response and (2) both warm and cold anomalies with In addition, if the largest European surface anomalies are in-
identical volcanic forcing (see Fig. S8), indicating that the deed found in the second winter, the stratospheric-pathway
observed continental winter warming following the 1982 El mechanism proposed by Robock and Mao (1992), Graf et al.
Chichón eruption was also, very likely, a simple manifesta- (1993), Kodera (1994), and others appears implausible. Little
tion of internal variability. Of course, the validity of our in- volcanic aerosol is left in the stratosphere 12–15 months af-
terpretation is dependent on the models’ ability to accurately ter an eruption, and we can think of no physical mechanism
simulate the internal variability of the climate system. in the stratosphere that would allow an anomaly to survive
Still, leaving models – and their possible biases – aside, into a second year. Nonetheless, in climate models, volcanic
one could nonetheless argue that several studies have signals have been shown to propagate through the ocean on
“demonstrated”, on the basis of various temperature recon- decadal timescales (Gleckler et al., 2006). This suggests the
structions, that many low-latitude volcanic eruptions have possibility, at least in theory, of an oceanic pathway. It re-
been followed by NH continental warming in wintertime. mains to be demonstrated, however, whether oceanic anoma-
Whether those demonstrations are truly convincing depends, lies are indeed capable of affecting the Northern Annular
crucially, on the quality of the surface temperature recon- Mode and, ultimately, Eurasian surface temperatures.
structions and on the soundness of the methodology em- In any case, coming back to the most recent large eruption
ployed. The early claim of Robock and Mao (1992) was of Mt. Pinatubo, the fact remains that from December 1991
based on the analysis of a single temperature dataset for to February 1992, the observed surface temperatures were
12 eruptions, half of which occurred at latitudes outside anomalously warm over North America and Eurasia, and that
30◦ S–30◦ N, averaging together larger and smaller events, fact may deserve an explanation. Our analysis indicates that
and commingling anomalies from the first or second winters the continental warming that occurred in the first winter fol-
(depending on the eruption). Similar commingling is found lowing the 1991 eruption was most likely a simple manifes-
in the study of Shindell et al. (2004), who analyzed 18 erup- tation of internal atmospheric variability, and was completely
tions, of which only a dozen were at low latitudes. Ignoring unrelated to the eruption itself. So, the next question is sim-
the possible errors introduced by commingling of first and ply, what might be the source of variability that resulted in
second winters, and of high-latitude and low-latitude erup- the NH continental warming? An obvious candidate would
tions, our work shows that a dozen eruptions may be far from be the El Niño–Southern Oscillation (ENSO) phenomenon,
sufficient to demonstrate the existence of a significant vol- since it is well known that the eruption of Mt. Pinatubo corre-
sponded with an El Niño event (see, e.g., Lehner et al., 2016),
7 After the 1963 eruption of Mt. Agung, the volcanic aerosol which is believed to influence the North Atlantic and Eura-
cloud spread primarily into the Southern Hemisphere (Viebrock and sia in winter (Brönnimann, 2007; Rodríguez-Fonseca et al.,
Flowers, 1968): that eruption is thus not the best candidate for ex- 2016). Unfortunately, El Niño conditions are typically asso-
ploring the causal link between low-latitude eruptions and anoma- ciated with a contraction of the tropical belt (Lu et al., 2008)
lies over the Northern Hemisphere continents. and a negative phase of the North Atlantic Oscillation (Li and
Atmos. Chem. Phys., 19, 6351–6366, 2019 www.atmos-chem-phys.net/19/6351/2019/L. M. Polvani et al.: Post-Pinatubo warming of the Northern continents: Merely internal variability? 6363
Lau, 2012), which is typically accompanied by cold anoma- Competing interests. The authors declare that they have no conflict
lies over Eurasia. It is, therefore, difficult to argue that the of interest.
observed post-Pinatubo continental warming was caused by
El Niño. In fact, there is some good modeling evidence con-
firming this. First, Thomas et al. (2009) reported a “very Acknowledgements. Lorenzo M. Polvani and Antara Banerjee are
strong” response to El Niño in their model that “can mask grateful for the support of the US National Science Foundation
the effects due to volcanic warming”. Second, analyzing so- (USNSF), and wish to express their gratitude to Ryan Neely for
performing and making available some of the WACCM4 model
called pacemaker8 simulations with the CAM5-LE model,
integrations. Computing resources for WACCM4 and CAM5-LE
McGraw et al. (2016) show a large forced signal in the tro- were provided by the Computational and Information Systems
pospheric circulation from El Niño in the Northern Hemi- Laboratory (CISL) at the National Center for Atmospheric Re-
sphere, which greatly resembles a negative annular mode search (NCAR). We also acknowledge the National Oceanic and
(see their Fig. 11f); they do not show surface temperatures, Atmospheric Administration (NOAA) Research and Development
but one would easily expect cold anomalies over the NH con- High Performance Computing Program, for providing computing
tinents in those simulations. If, then, El Niño needs to be and storage resources for some of the WACCM4 runs, and wish
ruled out, we may just have to admit that the intrinsic vari- to thank Henry LeRoy Miller for his assistance with NOAA’s
ability of the high-latitude tropospheric circulation, which is high-performance computing facilities. The CESM Large Ensem-
known to be very large (Shepherd, 2014), might have to suf- ble Project and supercomputing resources were provided by the
fice as an explanation. USNSF and NCAR/CISL. We also acknowledge Environment and
Climate Change Canada’s Canadian Centre for Climate Modelling
and Analysis for executing and making available the CanESM2
large ensemble simulations used in this study, and the Canadian Sea
Data availability. Observational data. The datasets used in this
Ice and Snow Evolution Network for proposing the simulations.
study can be downloaded from their respective web servers,
provided by the GISTEMP team at the NASA Goddard In-
stitute for Space Studies for GISTEMP (https://data.giss.nasa.
gov/gistemp/, last access: 9 May 2019), the Climate Research Financial support. This research has been supported by the US Na-
Unit (CRU) for HadCRUT4 (https://crudata.uea.ac.uk/cru/data/ tional Science Foundation (grant nos. AGS 14-02931 and AGS13-
temperature/, last access: 9 May 2019), NOAA ESRL PSD 22449).
FOR NCEP/NCAR (https://www.esrl.noaa.gov/psd/data/gridded/
data.ncep.reanalysis.pressure.html, last access: 9 May 2019),
and the European Centre for Medium-Range Weather Fore- Review statement. This paper was edited by Rolf Müller and re-
casts (ECMWF) for ERA-I (https://apps.ecmwf.int/datasets/data/ viewed by Georgiy Stenchikov and three anonymous referees.
interim-full-daily/levtype=sfc/, last access: 9 May 2019).
Modeling data. The CAM5-LE large ensemble data are pub-
licly available via the Earth System Grid: http://www.cesm.
ucar.edu/projects/community-projects/LENS/data-sets.html (last References
access: 9 May 2019). The CanESM2 data are available at
http://climate-modelling.canada.ca/climatemodeldata/cgcm4/ Barnes, J. E. and Hofmann, D. J.: Lidar measurements of strato-
CanESM2/index.shtml (last access: 9 May 2019). The WACCM4 spheric aerosol over Mauna Loa Observatory, Geophys. Res.
data are stored on the High Performance Storage System at the Lett., 24, 1923–1926, 1997.
National Center for Atmospheric Research, in Boulder, Colorado, Bittner, M.: On the discrepancy between observed and simulated
and are available upon request. dynamical responses of Northern Hemisphere winter climate to
large tropical volcanic eruptions, Ph.D. thesis, Univerisity of
Hamburg, Reports on Earth System Science, no. 173, 2015.
Supplement. The supplement related to this article is available Bittner, M., Schmidt, H., Timmreck, C., and Sienz, F.: Using a
online at: https://doi.org/10.5194/acp-19-6351-2019-supplement. large ensemble of simulations to assess the Northern Hemisphere
stratospheric dynamical response to tropical volcanic eruptions
and its uncertainty, Geophys. Res. Lett., 43, 9324–9332, 2016.
Author contributions. LMP originally conceived of the study and Bluth, G. J., Doiron, S. D., Schnetzler, C. C., Krueger, A. J., and
designed it together with AB, in consultation with AS. AB per- Walter, L. S.: Global tracking of the SO2 clouds from the June,
formed the analysis of the model output and drafted the figures. 1991 Mount Pinatubo eruptions, Geophys. Res. Lett., 19, 151–
LMP wrote the paper, with input from AB and AS. All authors con- 154, 1992.
tributed to the interpretation of the results. Brönnimann, S.: Impact of El Niño–Southern Oscillation on Euro-
pean climate, Rev. Geophys., 45, 1–28, 2007.
Butler, A. H. and Gerber, E. P.: Optimizing the definition of a sud-
8 In these simulations a fully coupled atmosphere–ocean is em- den stratospheric warming, J. Climate, 31, 2337–2344, 2018.
ployed, but sea surface temperature anomalies in the eastern tropi- Butler, A. H., Sjoberg, J. P., Seidel, D. J., and Rosenlof, K. H.:
cal Pacific are nudged to observations, so as to faithfully simulate A sudden stratospheric warming compendium, Earth Syst. Sci.
El Niño events. Data, 9, 63–76, https://doi.org/10.5194/essd-9-63-2017, 2017.
www.atmos-chem-phys.net/19/6351/2019/ Atmos. Chem. Phys., 19, 6351–6366, 2019You can also read