Greater decision uncertainty characterizes a transdiagnostic patient sample during approach-avoidance conflict: a computational modelling approach
←
→
Page content transcription
If your browser does not render page correctly, please read the page content below
Research Paper

                Greater decision uncertainty characterizes
                 a transdiagnostic patient sample during
               approach-avoidance conflict: a computational
                           modelling approach
       Ryan Smith, PhD; Namik Kirlic, PhD; Jennifer L. Stewart, PhD; James Touthang, BS;
            Rayus Kuplicki, PhD; Sahib S. Khalsa, MD, PhD; Justin Feinstein, PhD;
                        Martin P. Paulus, MD; Robin L. Aupperle, PhD

   Background: Imbalances in approach-avoidance conflict (AAC) decision-making (e.g., sacrificing rewards to avoid negative outcomes)
   are considered central to multiple psychiatric disorders. We used computational modelling to examine 2 factors that are often not distin-
   guished in descriptive analyses of AAC: decision uncertainty and sensitivity to negative outcomes versus rewards (emotional conflict).
   Methods: A previously validated AAC task was completed by 478 participants, including healthy controls (n = 59), people with substance
   use disorders (n = 159) and people with depression and/or anxiety disorders who did not have substance use disorders (n = 260). Using
   an active inference model, we estimated individual-level values for a model parameter that reflected decision uncertainty and another
   that reflected emotional conflict. We also repeated analyses in a subsample (59 healthy controls, 161 people with depression and/or anx-
   iety disorders, 56 people with substance use disorders) that was propensity-matched for age and general intelligence. Results: The
   model showed high accuracy (72%). As further validation, parameters correlated with reaction times and self-reported task motivations in
   expected directions. The emotional conflict parameter further correlated with self-reported anxiety during the task (r = 0.32, p < 0.001),
   and the decision uncertainty parameter correlated with self-reported difficulty making decisions (r = 0.45, p < 0.001). Compared to
   healthy controls, people with depression and/or anxiety disorders and people with substance use disorders showed higher decision un-
   certainty in the propensity-matched sample (t = 2.16, p = 0.03, and t = 2.88, p = 0.005, respectively), with analogous results in the full
   sample; people with substance use disorders also showed lower emotional conflict in the full sample (t = 3.17, p = 0.002). Limitations:
   This study was limited by heterogeneity of the clinical sample and an inability to examine learning. Conclusion: These results suggest
   that reduced confidence in how to act, rather than increased emotional conflict, may explain maladaptive approach-avoidance behav-
   iours in people with psychiatric disorders.

Introduction                                                               conflict between reward and punishment (reviewed in Ekhtiari
                                                                           and colleagues3 and Guttman and colleagues4). A better under-
Imbalances in the decision to approach or avoid when both pos-             standing of the underlying factors that contribute to avoidance-
itive and negative consequences are expected (i.e., approach-              based decision-making may improve our understanding of
avoidance conflict; AAC) is often problematic in people with               these mental health conditions and inform the development of
mental health conditions.1 For example, people with depres-                treatments that target the distinct factors that are relevant for
sion and anxiety may choose to sacrifice participation in re-              individual patients.5
warding activities because they believe such activities will also             Several paradigms are used to study AAC (for a review, see
lead to negative consequences (e.g., judgment, embarrass-                  Kirlic and colleagues6), most of which create conflict between
ment2). People with substance use disorders also engage in                 receiving monetary rewards and either monetary punish-
costly drug-taking behaviours to avoid negative affect and                 ments (monetary-based conflict7,8), pain (pain-based conflict9)
show impairment during decision-making in tasks that involve               or aversive affective stimuli (affect-based conflict 10–13).

Correspondence to: R. Smith, Laureate Institute for Brain Research, 6655 S. Yale Ave., Tulsa, OK 74136, USA; rsmith@laureateinstitute.org
Submitted Feb. 13, 2020; Revised May 15, 2020; Accepted Jun. 22, 2020; Early-released Oct. 29, 2020
DOI: 10.1503/jpn.200032

© 2021 Joule Inc. or its licensors

 E74                                                J Psychiatry Neurosci 2021;46(1)
Active inference and approach-avoidance conflict
lthough AAC is often analyzed using more traditional be-
A Methods
havioural measures, computational modelling has emerged as
a promising new approach for analysis.14–19 Modelling allows Participants
for precise quantification of distinct information-processing
mechanisms that contribute to decision-making. For example, We identified participants for this analysis from the first 500
in a monetary-based conflict study,20 variations in a model participants in the Tulsa 1000 (T1000),31 a naturalistic longi
parameter that reflected relative sensitivity to reward versus tudinal study that recruited participants based on the dimen-
punishment accounted for sex differences in avoidance sional National Institute of Mental Health Research Domain
(greater avoidance behaviour in females), whereas greater Criteria framework.32 The T1000 study included a community-
sensitivity to punishment overall better accounted for the in- based sample of approximately 1000 people recruited through
creased avoidance behaviour observed in those with an inhib- radio, electronic media, treatment centre referrals and word of
ited temperament. In a pain-based conflict study,9 computa- mouth (this sample size was planned a priori; see Victor and
tional modelling also showed that sensitivity to reward-based colleagues31 for a detailed justification based on the aims of the
benefits became increasingly attenuated as pain-based costs larger study). Participants were 18 to 55 years of age and
increased in aversiveness. screened on the basis of dimensional psychopathology scores:
Computational modelling has not yet been applied to affect- Patient Health Questionnaire (PHQ-933) score ≥ 10; Overall
based conflict. Doing so may add clinical value, because antici- Anxiety Severity and Impairment Scale (OASIS34) score ≥ 8;
pation of negative affect may be particularly important for and/or Drug Abuse Screening Test (DAST-1035) score > 2. The
understanding the factors that contribute to psychiatric disor- healthy controls showed no elevated symptoms or psychiatric
ders. To be clear, the distinction made here between affect- diagnoses. Participants were excluded if they tested positive
based conflict and pain- or monetary-based conflict is not for drugs of abuse; met the criteria for a psychotic disorder, bi-
meant to suggest that losing money or feeling the unpleasant polar disorder or obsessive–compulsive disorder; reported
sensation of pain do not involve affective responses.21 The dis- a history of a moderate to severe traumatic brain injury, a
tinction motivating the use of affect-based tasks is one of maxi- neurologic disorder or a severe or unstable medical condi-
mizing ecological validity: affective disorders more often tion; reported an active suicidal intent or plan; or reported a
involve avoidance of the more complex “emotional pain” in- change in medication dose within 6 weeks of participation
duced by socio-emotional cues (e.g., social rejection, losing a in the study. Full inclusion and exclusion criteria are de-
job, death). The visual/auditory stimuli used in affect-based scribed in Victor and colleagues.31 The study was approved
AAC tasks are designed to more closely match such cues (e.g., by the Western Institutional Review Board. All participants
by depicting social interactions mirroring some of those cues) provided written informed consent before they completed
and the emotionally painful responses they evoke. the study protocol, in accordance with the Declaration of
In this study, we applied a computational modelling ap- Helsinki, and they were compensated for participation
proach22,23 to study affect-based conflict. We demonstrated (ClinicalTrials.gov identifier NCT02450240). A number of
how this approach could separate 2 underlying components previous papers have been published from the larger T1000
of conflict that have not been thoroughly distinguished in tra- data set,36–46 but none of these papers has included analyses
ditional descriptive analyses: decision uncertainty and rela- or data from the AAC task.
tive sensitivity to negative affective stimuli versus reward Given the heterogeneous clinical sample in the T1000 and
(emotional conflict). Both uncertainty and emotional conflict its explicitly transdiagnostic focus, we divided participants
have potential relevance for psychiatric disorders. For exam- into 3 groups: healthy controls; people with substance use
ple, poor decision-making in people with anxiety has been disorders; and people with depression and/or anxiety who
associated with high intolerance of uncertainty and risk aver- did not have substance use disorders. Participants were
sion,24,25 whereas suboptimal decision-making in depression grouped based on DSM-IV or DSM-5 diagnosis using the
appears to be driven more by attenuated responses to re- Mini International Neuropsychiatric Inventory,47 and analy-
ward.26,27 Substance use disorders have also been associated ses focused on groups of participants with major depressive
with intolerance of uncertainty28 and a reduced ability to in- and/or anxiety disorders (social anxiety, generalized anxiety,
corporate uncertainty into reward learning during decision- panic and/or posttraumatic stress disorder; n = 260); sub-
making tasks.29 However, the distinct contributions of uncer- stance use disorders (recreational drugs excluding alcohol
tainty versus emotional conflict (threat/reward sensitivity) to and nicotine, with or without comorbid depression and/or
avoidance behaviour have not been fully delineated. anxiety disorders; n = 159); and healthy controls with no
Using a relatively large sample comprising healthy con- mental health diagnoses (n = 59).
trols without psychiatric symptomatology and a transdiag- As further described in Victor and colleagues,31 the T1000
nostic sample of patients with depression, anxiety and/or a study was built around the National Institute of Mental
substance use disorder, we estimated model parameters that Health Research Domain Criteria framework, which de-
reflected decision uncertainty and emotional conflict using scribes dimensions of pathology.32 Thus, the T1000 study spe-
an affect-based AAC task.11,12,30 We hypothesized that rela- cifically focused in advance on recruiting participants with
tive to healthy controls, both psychiatric groups would these symptom profiles, with the aim of identifying trans
exhibit greater uncertainty and greater emotional conflict in diagnostic behavioural and neural phenotypes that were re-
the AAC task. lated to threat/reward processing, interoceptive processing
J Psychiatry Neurosci 2021;46(1) E75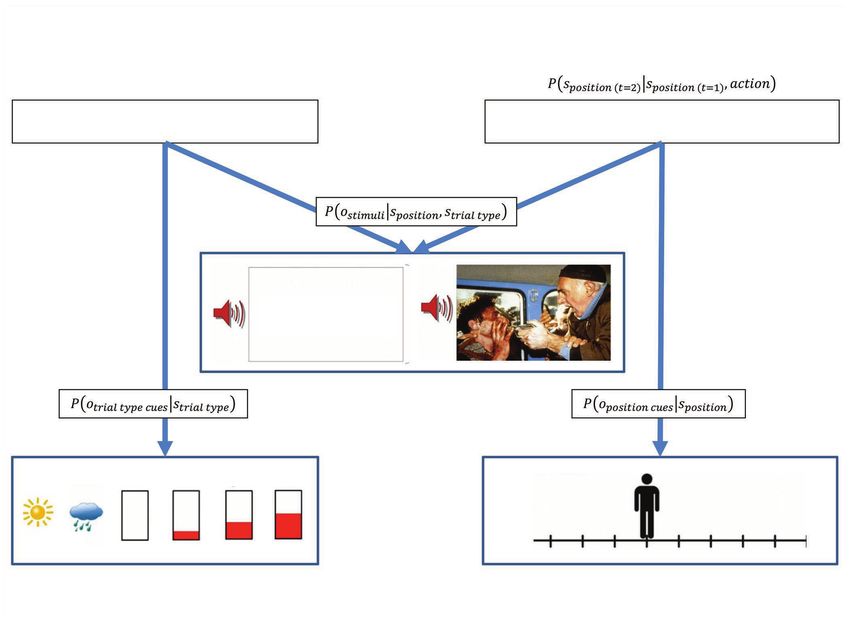
Smith et al.
and cognitive functioning. Although symptoms can be ob- functioning. From this assessment, we acquired several direct
served dimensionally, as in the case of symptom scales, we and derived variables, only some of which were used in the
also sought to categorize participants according to diagnoses. present analyses. The complete list of assessments and
These categories were developed before the current analyses references supporting their validity and reliability are
and discussed in a previous paper.36 The T1000 also included provided in Victor and colleagues.31
people with eating disorders, but we excluded them from the
present study because of small sample sizes. We also categor Approach-avoidance conflict task
ized mood and anxiety disorders together for our analyses
because of the high rates of overlap in these diagnoses and be- The AAC task (Fig. 1)11,30 is described more extensively in
cause the sample size for anxiety alone would have been very Appendix 1, available at jpn.ca/200032-a1. Before performing
small (n = 19) if separated. We included a lower number of the task, participants received detailed instructions (provided
healthy controls to maximize our ability to detect dimensional in Appendix 2, available at jpn.ca/200032-a2) and completed
effects in patient populations in other planned analyses (in 4 practice trials to ensure sufficient understanding. In each
consideration of the total sample size that could be collected). trial, a runway was shown with a picture of an avatar in a
starting position above the runway. Pictures were also shown
Data collection procedure on each side of the runway, indicating the types of stimuli
(i.e., affective image–sound combinations and reward points)
Participants underwent an intensive assessment for that could be presented at the end of the trial depending on
demographic, clinical and psychiatric features, with a main participants’ choices. Specifically, a sun or a cloud repre-
focus on negative and positive affect, arousal and cognitive sented potential positive or negative affective stimuli,
Approach-avoidance conflict task
Example trial Trial types
Time
1) Avoid-threat
Decision phase
Maximum of 4 seconds
2) Approach-reward
Affective stimulus phase
6 seconds 3) Conflict: 2-point
You made 2 points!! Reward phase 4) Conflict: 4-point
Total = 8 2 seconds
5) Conflict: 6-point
Intertrial fixation
1–11 seconds
(mean = 6 seconds)
90 80 70 60 50 60 70 80 90
% Chance of the closest potential outcome occurring if avatar
ends at each specific position
Fig. 1: Left: Sample trial in the approach-avoidance conflict task, in which the negative stimulus and 2 points were presented based on the
probabilities associated with the chosen runway position. Right: The 5 trial types. The sun indicates a positive stimulus, the cloud indicates a
negative stimulus and the higher the red bar is filled the more points may be received.
E76 J Psychiatry Neurosci 2021;46(1)
Active inference and approach-avoidance conflict
respectively, and the height of red fill in a rectangle signified that paradigms involving non-monetary or monetary re-
the number of points that would be received in addition to the wards elicit similar neural activation patterns in reward-
presentation of those stimuli. In each trial, participants could sensitive brain regions, 50,51 which could suggest similar
press the left or right arrow keys to move the avatar from its motivational influences. Behavioural variables consisted of
starting position to any other position (9 possible locations) on the chosen avatar position and the reaction time (i.e., time to
the runway, and they were asked to choose a single ending po- initial button press) in each trial. Participants were also
sition in each trial. They were told that each ending position asked to fill out a questionnaire that asked about their
corresponded to a specific probability of observing different experiences during the task.
stimuli at the end of the trial. These stimuli included a positive
or negative affective image–sound combination (indicated by Computational modelling
the sun or the cloud, respectively), and a certain level of reward
points (indicated by the height of the red fill in the rectangle, as To model behaviour on the AAC task described above, we
noted above). The ending position of the avatar determined the adopted a Markov decision process model under the active
probability that each of these outcomes would occur. inference framework; for more details about the structure and
Before they started the task, participants were told the spe- mathematics of this class of models, see Friston and col-
cific probabilities of observing each stimulus for each runway leagues,23,52 Parr and Friston53 and Appendix 1. We chose this
position, and that these probabilities were stable across the model because it is well suited for modelling decision-making
task. Thus, there was no learning in this task, and no measure under uncertainty and was designed to model inference and
of better or worse performance; participants simply indicated planning processes, both with and without learning. This was
their preferred location on the runway (based on the prob appropriate here because the AAC task did not involve learn-
abilities of each outcome) in each trial. The probabilities ing (i.e., participants were explicitly told the probabilities of
given to the participants were based on the distance from stimuli/points given each runway position before the task
each stimulus (e.g., being closer to the sun image indicated a began), which made other common learning-based modelling
higher probability of observing the positive stimulus). From approaches (e.g., reinforcement learning) less appropriate.
left to right on the runway, the probabilities were as follows: This was similar to other previously used behavioural tasks
0.9/0.1, 0.8/0.2, 0.7/0.3, 0.6/0.4, 0.5/0.5, 0.4/0.6, 0.3/0.7, (e.g., the urn or beads task54–56) that rely on probabilistic infer-
0.2/0.8, 0.1/0.9. The starting position of the avatar (middle, ence as opposed to learning, and therefore call for some form
left end or right end) was counterbalanced across trials (for of Bayes optimality assumptions (under the complete class
each trial type; see below) to control for its potential influence theorem; see Huq and colleagues55). Furthermore, because the
on participants’ choices. outcomes of decisions in the AAC task were probabilistic and
The affective image–sound combinations were gathered participants were explicitly informed about these probabilities
from the International Affective Picture System,48 the Interna- when making their choices, a model that explicitly incorpor
tional Affective Digitized Sounds49 and other freely available ated action–outcome probabilities appeared to be most appro-
audio files (see further descriptions in previous reports using priate for capturing the cognitive processes that underlie par-
this task: Aupperle and colleagues11 and Chrysikou and col- ticipants’ behaviour.
leagues30). The “reward” included 0, 2, 4 or 6 points, pre- Briefly, this approach required creating a model with spe-
sented along with a trumpet sound. There were 5 trial types cific sets of observable stimuli (o) and beliefs about states of the
(Fig. 1), which were indicated to participants by the images task (s), as well as beliefs about the sequences of actions that
shown on each side of the runway on each trial. Each trial can be chosen (policies; π). For this study, observations in-
type was named in reference to the behavioural motivation cluded runway position, trial-type cues and positive/negative
presumably elicited by the negative or positive affective stimuli + number of points; task states included beliefs about
stimuli and/or the reward points: “avoid-threat” (AV), in the trial type and position on the runway; and policies in-
which 0 points were offered for both possible stimulus out- cluded transitions to each possible location on the runway. The
comes, so the only explicit motivation was to avoid the nega- relationships between these variables at a time (t) were de-
tive affective stimulus; “approach-reward”(APP), in which 2 scribed by a set of matrices. The A matrix encoded the way
or 0 points were offered, each with positive affective stimuli, that task states were related to observations, P (ot|st). This in-
so the only explicit motivation was to approach the rewarded cluded (1) the probability of observing each set of trial-type
outcome; and 3 trial types with different levels of “conflict,” cues given a particular trial type (specified as an identity ma-
in which the negative affective stimulus was presented in trix); (2) the probability of observing the avatar in a given loca-
a ddition to receiving either 2 (CONF2), 4 (CONF4) or tion given a particular runway position (specified as an iden-
6 (CONF6) points (0 points were offered for the other possi- tity matrix); and (3) the probability of observing different
ble outcome, in which a positive affective stimulus would be outcome stimuli given each position on the runway (specified
presented). The task consisted of a total of 60 trials: 12 of each based on the stated task probabilities). The B matrix encoded
of the 5 trial types. the probability that one task state would transition into an-
After task completion, a screen appeared displaying the other depending on selected policies, P (st + 1| st, π ); in this
total points received and an award ribbon. As in previous study, this specified that trial type was stable across a trial
administrations of the task,11,12 points did not correspond to (identity matrix) and that the participant would determinis
a monetary reward. Notably, previous research has shown tically transition from the start state to different runway
J Psychiatry Neurosci 2021;46(1) E77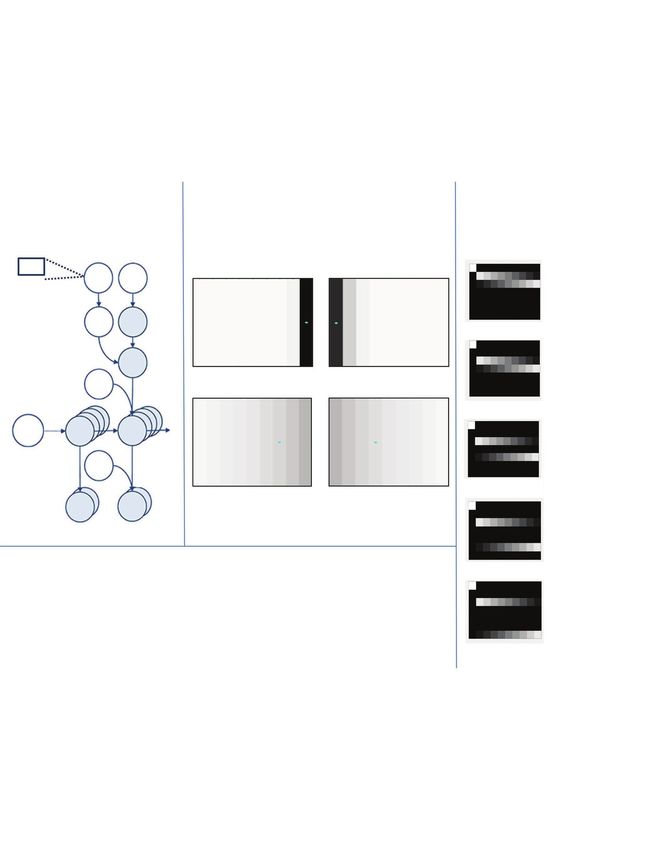
Smith et al.
osition states given the selection of different policies. The
p the positive affective stimulus, the negative affective stimulus
value of an observation was encoded as a log probability and each point that could be won. The positive affective
within a matrix referred to as the C matrix (implementation in stimulus was fixed at an “anchor” value of lnP(o) = 0, and the
the present model described further below). Policies were value of each point was lnP(o) = 1 (e.g., lnP[o] = 2 when win-
selected based on beliefs about the probability that each possi- ning 2 points). We then estimated the relative value (subjec-
ble policy would produce preferred observations (i.e., for- tive aversiveness) of the negative affective stimulus. This par
mally, those with the highest prior probability), modulated by ameter indicated the “emotional conflict” (EC) — that is, the
an expected precision term (γ) that encoded decision uncer- expected aversiveness of the affective stimuli relative to the
tainty. See Table 1 and Appendix 1 for further details about reward value assigned to each point. We also estimated a
how observations, states, policies and associated matrices were prior policy precision parameter (β), which was the inverse of
defined to model the AAC task. the expected precision term γ and acted as an index of an in-
Each trial consisted of 2 epochs. In the first epoch, the par- dividual’s a priori belief-based uncertainty related to making
ticipant was in a “start” state and was presented with the av- optimal decisions. Higher decision uncertainty in the model
atar and trial-type cues (observations indicating AV, APP, or (a higher β value) led to less consistent (more variable)
CONF2, 4 or 6). Based on the selected policy, on the second choices over trials, because of less precise beliefs about the
epoch the participant then transitioned to the chosen runway best policy (i.e., less confidence in which action would lead to
position (indicated by movement of the avatar) and observed the most preferred outcomes).
the outcome stimuli (i.e., image–sound type + number of Based on these values, the model inferred a probability dis-
points) based on the probabilities associated with the chosen tribution over possible actions (i.e., transitions to different
runway position. Figure 2 depicts the Markov decision pro- possible runway positions) and sampled actions from this
cess structure, A-matrices for the task and sample simula- distribution on each trial, where higher action probabilities
tions under different parameter values. Figure 3 provides a formally corresponded to lower values of a quantity called
visual depiction of the model structure of the AAC task. expected free energy (G; described more thoroughly in Ap-
The C matrix was specified such that the expected value pendix 1). Briefly, in this context a lower expected free energy
assigned to each possible stimulus was determined by 3 par corresponded to a smaller (Kullback–Leibler) divergence be-
ameters corresponding to the subjective value of observing tween the distribution reflecting the preferred observations
Table 1: Markov decision process model of the approach-avoidance conflict task
Model variable General definition Model-specific specification
ot Observable outcomes at time t Outcome modalities:
1. Observed position on the runway (10 possible observations,
including a “starting” position and the 9 final positions one could
choose)
2. Cues indicating trial type (5 possible observations, corresponding
to the 5 trial types)
3. Stimuli observed at the end of each trial. This included 7 possible
observations corresponding to a “starting” observation, the
positive stimulus with 0 or 2 points, and the negative affective
stimulus with 0, 2, 4 or 6 points
st Hidden states at time t Hidden state factors:
1. Beliefs about position on the runway (10 possible belief states with
an identity mapping to the observations in outcome modality 1)
2. Beliefs about the trial type (corresponding to the 5 trial types)
π A distribution over action policies encoding the expectation that a Allowable policies included the decision to transition from the starting
particular policy is most likely to generate preferred outcomes state to each of the 9 possible positions on the runway
β The prior on expected policy precision (β) is the “rate” parameter When β is high (reflecting low confidence about the best decision),
of a γ distribution, which is a standard distribution to use as a policy selection becomes less deteriministic. Higher β values
prior for expected precision. This latter term modulates the therefore encode participants’ decision uncertainty during the task
influence of expected free energy on policy selection (similar to the temperature parameter in a conventional softmax
response function)
A matrix A matrix encoding beliefs about the relationship between hidden Encodes beliefs about the relationship between position on the
P(ot | st) states and observable outcomes (i.e., the likelihood that specific runway and the probability of observing each outcome, conditional on
outcomes will be observed given specific hidden states) beliefs about the task condition
B matrix A matrix encoding beliefs about how hidden states will evolve Encodes beliefs about the way participants could choose to move the
P(st + 1 | st) over time (transition probabilities) avatar, as well as the belief that the task condition will not change
within a trial
C matrix A matrix encoding the degree to which some observed outcomes Encodes stronger positive preferences for receiving higher numbers
InP(ot) are preferred over others (technically modelled as prior of points, and negative preferences for the aversive stimuli (both
expectations over outcomes) relative to an anchor value of 0 for the “safe” positive stimulus). The
emotional conflict (EC) parameter in our model encoded the value of
participants’ preferences against observing the aversive stimuli
D matrix A matrix encoding beliefs about (a probability distribution over) The simulated agent always began in an initial starting state, and
P(s1) initial hidden states believed each task condition was stable across each trial
E78 J Psychiatry Neurosci 2021;46(1)Active inference and approach-avoidance conflict
(i.e., the combined negative + positive values of images, ability of observing the overall most preferred combination
sounds and points) and the distribution reflecting the obser- of stimuli/points if that action were chosen.
vations expected under each choice of runway position Our computational phenotyping approach used Bayesian
(given knowledge of the associated probabilities). Lower ex- inference at 2 levels.58 First, each participant’s responses
pected free energy of an action thus indicated a higher prob were modelled under ideal Bayesian assumptions, using the
Graphical model Example simulations A matrices
Trial type = conflict + 2 points (CONF2) Columns = runway positions
Rows = outcomes
Trial type = AV
EC β = 1, EC = 1 β = 1, EC = 3
C β Negative stimulus
Positive stimulus
G γ
Trial type = APP
π Positive stimulus
Positive stimulus + 2
B β = 6, EC = 1 β = 6, EC = 3
Trial type = CONF2
D I
St St
I
Positive stimulus
Negative stimulus + 2
A
Avoid Approach Avoid Approach Trial type = CONF4
I I
Ot Ot
Selected runway position (blue) and action value Positive stimulus
distributions (darker = higher value)
Negative stimulus + 4
Emotional conflict (EC) =
Trial type = CONF6
expected aversiveness of negative stimuli
relative to potential reward (higher
indicates greater expected aversiveness) Positive stimulus
β=
decision uncertainty
(higher indicates greater uncertainty in decision-making) Negative stimulus + 6
Lighter = higher probabilities
Fig. 2: Computational model. Top left: The Markov decision process used to model the approach-avoidance conflict task. The generative
model is depicted graphically, such that arrows indicate dependencies between variables. Observations (o) depend on hidden states (s;
this relationship is specified by the A matrix), and those states depend on both previous states (as specified by the B matrix or the initial
states specified by the D matrix) and the sequences of actions/policies (π) selected by the agent. The probability of selecting a particular
policy in turn depends on the expected free energy (G) of each policy with respect to the preferences (C) of the decision-maker being mod-
elled. The degree to which expected free energy influences policy selection is also modulated by an expected precision term (γ), which is in
turn dependent on a prior policy precision parameter (β), where higher values of β promote greater decision uncertainty (i.e., less influence
of the differences in expected free energy across policies). For more details on the associated mathematics, see Friston and colleagues52,57
and Appendix 1, available at jpn.ca/200032-a1. In our model, the observations were cues indicating the trial type, cues indicating the posi-
tion of the avatar, and the outcome stimuli. The hidden states included beliefs about trial type and avatar position, and the policies included
the choice to move the avatar to any other position on the runway. Right: The A matrices in the right panel show the mapping between
states and observations for outcome stimuli. Here, the rows correspond to the stimuli (first row is the “start” observation), and the columns
correspond to the avatar position states (column 1 corresponds to the “start” state, and columns 2 to 10 correspond to choosing each of the
9 runway positions). Lighter colours in these A matrices indicate higher probabilities. Trial types: AV = avoid; APP = approach; CONF2,
CONF4 and CONF6 = conflict + 2, 4 or 6 points, respectively. Bottom left: The model parameters corresponded to the degree to which the
negative stimulus was dyspreferred relative to the degree to which the points were preferred in the C matrix (“emotional conflict”; EC), as
well as the prior policy precision parameter β, which reflected decision uncertainty. Top middle: Example simulations of action selection
under different parameter values during the CONF2 trial type. Blue dots indicate chosen actions, and darker colours indicate higher action
values in the model.
J Psychiatry Neurosci 2021;46(1) E79Smith et al.
Markov decision process formulation of choice behaviour This posterior distribution over behavioural responses can
described previously. Based on the trial-by-trial task stimuli then be used to assess the likelihood of responses under dif-
observed by each participant and their trial-by-trial deci- ferent prior beliefs. We optimized these preferences (and
sions, we then used variational Bayes to estimate each par- precision of posterior beliefs about policies) using this likeli-
ticipant’s prior beliefs that maximized the likelihood of their hood and standard variational Laplace.60 Having estimated
responses, as described in Schwartenbeck and Friston.18 In each participant’s preferences (and precision), we then used
other words, the observation model for estimating subject- classical inference to test for the effects of group, using a
specific preferences and precision was based on the assump- standard summary statistics-based approach.
tion that subjects were using (active) Bayesian inference. In As described in more detail in Appendix 1, we also con
this setting, active inference can be seen as a generalization sidered 2 other models: a simpler 1-parameter model includ-
of Bayesian decision theory that replaces the expected value ing no decision uncertainty term (estimating EC only), and a
or utility with expected log evidence or marginal likelihood more complex 3-parameter model that fit separate terms for
for a generative model of the task.18,59 This means that sub- the subjective value of the negative affective stimuli and the
jective responses are sampled from posterior beliefs about subjective value of the points (i.e., in place of the EC param
the best course of action, where these posterior beliefs de- eter). Initial simulations indicated that parameter estimates
pend on their prior preferences about the consequences of a for the 3-parameter model were dependent on prior values
decision and the information gain afforded by their actions. (and therefore not recoverable), because only the relative
Generative model of Actions
approach-avoidance conflict task Allowable transitions to each runway position
State factor: beliefs about trial types State factor: beliefs about runway position
(AV, APP, CONF2, CONF4, CONF6) (Positions: 1 to 9)
Observation modality
Outcome stimuli
Observation modality Observation modality
Trial-type cues Runway-position cues
Fig. 3: Simplified visual depiction of relevant dependencies in the computational (generative) model of the approach-avoidance conflict task.
Beliefs about trial type and beliefs about runway positions were generated by (and inferred based on) trial-type cues and runway-position
cues, respectively. Observed outcome stimuli were probabilistically generated by an interaction between trial type and runway position. Beliefs
about this interaction were used to infer the action (state transition) most likely to produce the most preferred outcome stimuli. Trial types:
AV = avoid; APP = approach; CONF2, CONF4 and CONF6 = conflict + 2, 4 or 6 points, respectively.
E80 J Psychiatry Neurosci 2021;46(1)Active inference and approach-avoidance conflict
value of the negative stimuli versus points ultimately influ- has been done in previous work on the T1000 data set,73 to
enced behaviour. Therefore, we did not use this model. In more rigorously assess group differences we used the
contrast, estimates from the simpler 1-parameter model did fullmatch function in the optmatch R package (www.
appear recoverable. However, Bayesian model comparison rdocumentation.org/packages/optmatch/versions/0.9-10/
(based on Rigoux and colleagues 61 and Stephan and col- topics/fullmatch) to propensity-match groups based on age
leagues62) showed that this model performed worse than the and WRAT scores (propensity-matching was not effective
2-parameter model (protected exceedance probability = 1). when including sex, given the differences between groups).
We implemented all model simulations using standard Propensity-matching led to sample sizes of 59 healthy con-
routines (spm_MDP_VB_X.m) that are available as Matlab trols, 161 participants with depression and/or anxiety and
code in the latest version of SPM academic software (www. 56 participants with substance use disorders ) for the matched
fil.ion.ucl.ac.uk/spm/). Matlab code specifying the genera- samples. We then performed the analyses described above
tive model of the AAC task is included in Appendix 3, avail- with the propensity-matched groups, with sex and group ×
able at jpn.ca/200032-a3 (AAC_model.m). sex interaction as independent variables in the model.
The T1000 study — of which the AAC task analyzed here
Statistical analysis is a part — was designed explicitly in an exploratory/
confirmatory framework; the first 500 participants were des-
We conducted statistical analyses using the R statistical ignated as exploratory, and the second 500 participants were
package (2018; www.R-project.org/). To assess face valid- reserved for confirmatory analyses based on the results of the
ity, we calculated a model accuracy score that reflected the exploratory analyses. As such, the analyses reported here
average percentage of trials during which the action with should be considered exploratory. Confirmatory analyses
the highest probability in the model matched the action will be carried out in planned future work.
chosen by participants (i.e., under the parameter values
estimated for each participant) and we examined correla- Results
tions between model parameters and reaction times (i.e.,
time to initial button press, both across the whole task and Descriptive statistics for demographic and clinical measures
within each condition) with the expectation that valid are shown in Table 2. The descriptive statistics for each of
computational measures of greater emotional conflict (EC) the parameters were as follows (mean ± standard deviation):
and decision uncertainty (β) would both be associated β = 4.77 ± 4.69; EC = 2.70 ± 2.72. For further information
with slower reaction times. We then conducted further about the relationship between model parameters and de-
correlation analyses to examine whether each parameter mographic variables, see Appendix 1. The EC and β param
could predict subsequent self-reports on the post-task eters were correlated at r = 0.26 and p < 0.001. Because the
Likert scale questions. The validity of EC would be sup- parameters were not normally distributed, they were log-
ported by positive associations with self-reported avoid- transformed for all subsequent analyses using the R package
ance motivation and anxiety, and the validity of β would optLog (https://github.com/kforthman/optLog) to find the
be supported by self-reported difficulty making decisions optimal log-transform that minimized skew. This package
and self-reported avoidance motivation. was originally developed by researchers at the Laureate In-
We used R statistical software to conduct analyses of stitute for Brain Research. Parameter distributions before
covariance to identify possible group differences in each par and after transformation are shown in Appendix 1.
ameter while accounting for individual differences in age,
sex, the Wide Range Achievement Test reading score Face validity: task-related self-report and behaviour
(WRAT; a common measure of premorbid IQ63) and the inter-
action between group and each of these factors. We used Averaging across participants, the model was accurate at
WRAT scores to ensure that differences in task behaviour predicting behaviour in 72% (standard error = 1%) of trials
could not be accounted for by differences in general intelli- (note: chance accuracy is 1/9 = 11%). Participants with
gence. Results were Bonferroni-corrected for multiple com- longer reaction times across all trials also exhibited greater
parisons with 2 parameters (α = 0.05, p < 0.025). To assess EC (r = 0.24, p < 0.001) and higher β values (r = 0.59, p <
group differences in approach-avoidance behaviour, we also 0.001). Analyses of reaction times within specific trial
conducted similar analyses of covariance with standard de- types showed similar results (see Appendix 1). Relation-
scriptive task variables as the dependent variables, including ships between model parameters and self-reports on the
mean chosen runway positions during the AV, APP and post-AAC questionnaire items are shown in Table 3. Nota-
CONF trial types (higher values indicated stronger approach bly, EC correlated most strongly with self-reported moti-
behaviour toward the points; in the AV condition, higher val- vations to move toward reward (r = −0.74, p < 0.001) and
ues indicated positions closer to the positive stimulus). away from negative outcomes (r = 0.67, p < 0.001). Higher
The groups showed significant differences in age, sex and EC also corresponded to higher self-reported anxiety dur-
WRAT scores, which prevented strong conclusions when try- ing the task (r = 0.32, p < 0.001); β correlated most strongly
ing to control for the effects of these variables.64 This con- with self-reported difficulty making decisions on the task
firmed the group differences anticipated based on the repre- (r = 0.45, p < 0.001) and (reduced) motivations to move to-
sentative demographics of these clinical populations.65–72 As ward reward (r = −0.48, p < 0.001).
J Psychiatry Neurosci 2021;46(1) E81Smith et al.
Clinical validity: diagnostic effects trend effect of group in the full sample (F2,466 = 3.30, p = 0.04),
reflecting greater EC in healthy controls than in those with
Group difference results for the propensity-matched sample substance use disorders (t92 = 3.17, p = 0.002, d = 0.51; see
are shown in Figure 4. For analogous results in the full Appendix 1 for full results).
sample, see Appendix 1. Results in the full sample showed a In Appendix 1, we have also presented these analyses sepa-
highly similar pattern, as we note more specifically below. rately for males and females; the pattern of findings for the EC
We found a main effect of group on β (F2,270 = 4.15, p = 0.017), parameter remained significant only in females, and the pat-
reflecting lower values in healthy controls than in those with tern of findings for the β parameter remained significant only
depression and/or anxiety (t128 = 2.16, p = 0.03, d = 0.30) or sub- in males.
stance use disorders (t102 = 2.88, p = 0.005, d = 0.53); effects of
sex and the group × sex interaction were nonsignificant. We Standard descriptive analyses
observed a similar pattern in the full sample (Appendix 1).
We found a main effect of sex on EC (F1,270 = 11.17, p < Descriptive statistics for task-related self-report and tradi-
0.001; higher in females), but the effects of group and the tional performance variables (reaction time, approach behav-
group × sex interaction were nonsignificant. We did find a iour) are provided in Appendix 1. Average reaction times
Table 2: Summary statistics and group differences for demographic and clinical measures
Sample Healthy controls Depression/anxiety Substance use disorders p value
Full sample n = 59 n = 260 n = 159
Age, yr 32.14 ± 11.13 35.89 ± 11.30 33.93 ± 9.09 0.024
Male, n (%) 28 (48) 70 (27) 74 (47) < 0.001
PHQ score 0.90 ± 1.36 12.63 ± 5.14 6.50 ± 5.66 < 0.001
OASIS score 1.27 ± 1.88 9.80 ± 3.42 5.78 ± 4.66 < 0.001
DAST-10 score 0.12 ± 0.38 0.67 ± 1.41 7.48 ± 2.20 < 0.001
WRAT score 62.37 ± 5.06 63.53 ± 4.76 58.49 ± 5.65 < 0.001
Propensity-matched sample n = 59 n = 161 n = 56
Age, yr 32.14 ± 11.13 35.11 ± 10.84 32.67 ± 10.26 0.12
Male, n (%) 28 (48) 41 (25) 35 (63) < 0.001
PHQ score 0.90 ± 1.36 12.64 ± 5.38 7.95 ± 6.50 < 0.001
OASIS score 1.27 ± 1.88 9.78 ± 3.42 6.80 ± 5.15 < 0.001
DAST-10 score 0.12 ± 0.38 0.62 ± 1.26 7.45 ± 2.65 < 0.001
WRAT score 63.53 ± 4.76 62.58 ± 4.53 61.89 ± 4.43 0.15
DAST-10 = Drug Abuse Screening Test; OASIS = Overall Anxiety Severity and Impairment Scale; PHQ = Patient Health Questionnaire; WRAT =
Wide Range Achievement Test.
Unless otherwise indicated, findings are mean ± standard deviation.
Table 3: Post-task self-report questionnaire items and Pearson correlations with the computational model parameters*
Pearson correlations
Question† Mean ± SD Emotional conflict (EC) Decision uncertainty (β)
1. I found the POSITIVE pictures enjoyable 5.05 ± 1.68 0.07 0.02
2. The NEGATIVE pictures made me feel anxious or uncomfortable 4.43 ± 1.99 0.32‡ 0.06
3. I often found it difficult to decide which outcome I wanted 2.51 ± 1.73 0.10§ 0.45‡
4. I always tried to move ALL THE WAY TOWARD the outcome with the LARGEST 4.76 ± 2.30 −0.74‡ −0.48‡
REWARD POINTS
5. I always tried to move ALL THE WAY AWAY FROM the outcome with the 2.98 ± 2.17 0.67‡ 0.37‡
NEGATIVE PICTURE/SOUNDS
6. When a NEGATIVE picture and sound were displayed, I kept my eyes open and 5.5 ± 1.83 −0.37‡ −0.17‡
looked at the picture
7. When a NEGATIVE picture and sound were displayed, I tried to think about 2.96 ± 1.94 0.29‡ 0.11§
something unrelated to the picture to distract myself
8. When a NEGATIVE picture and sound were displayed, I tried other strategies to 3.26 ± 1.99 0.32‡ 0.05
manage emotions triggered by the pictures
SD = standard deviation.
*Full sample; n = 478.
†Answers provided on a Likert scale (1 = not at all; 7 = very much).
‡p < 0.001.
§p < 0.05.
E82 J Psychiatry Neurosci 2021;46(1)Active inference and approach-avoidance conflict
across trial types were not significantly different between (t203 = 3.41, p < 0.001, d = 0.38) and those with substance use
groups; we found no effect of sex or group × sex interaction. disorders (t81 = 3.67, p < 0.001, d = 0.69). We found somewhat
However, in Appendix 1 we present some significant group similar results in the full sample (Appendix 1).
differences in specific trial types, reflecting slower reaction Although decision uncertainty was not analyzed in previ-
times in the clinical groups relative to the healthy controls. ous studies of this AAC task, our results for this parameter
We observed similar results in the full sample (Appendix 1). suggested the presence of differences in within-subject deci-
Within conflict trials (CONF2, CONF4, CONF6), we ob- sion variability. See Appendix 1 for additional analyses that
served a main effect of sex on chosen runway position (F1, 270 = confirm these differences (most strongly in the AV, APP and
7.53, p = 0.006; less avoidance in males). Within AV trials, we CONF6 trial types) and also show the expected positive cor-
observed a main effect of sex (F1, 270 = 5.29, p = 0.02; less avoid- relations between within-subject variability and β values
ance of the negative image in males) and group (F2, 270 = 13.36, across all trial types.
p < 0.001) on chosen runway position. Further inspection in-
dicated that healthy controls showed greater avoidance of the Discussion
negative image in this condition than those with depression
and/or anxiety (t177 = 2.42, p = 0.016, d = 0.29) or those with Using a novel active inference modelling approach in a large
substance use disorders (t72 = 4.90, p < 0.001, d = 0.93). Those community sample, this study uncovered separable influ-
with substance use disorders also showed less avoidance than ences of 2 factors on approach-avoidance behaviour: expected
those with depression and/or anxiety (t75 = 3.59, p < 0.001, d = outcome aversiveness relative to expected reward (EC) and
0.65). Within APP trials, we observed a main effect of group decision uncertainty (β). The model showed high accuracy in
on chosen runway position (F2,270 = 5.04, p = 0.007), reflecting predicting behaviour (72%; i.e., relative to chance accuracy =
greater approach behaviour (i.e., toward the points) in 11%) and was further validated by the fact that parameter
healthy controls than in those with depression and/or anxiety estimates showed strong relationships with reaction times,
Group differences Group differences
(propensity-matched sample) (full sample)
Emotion conflict (EC) Decision uncertainty (β) Emotion conflict (EC) Decision uncertainty (β)
15 20
15 20
10 10
10 10
5 5
0 0 0 0
5 8 5 8
4 4
6 6
3 3
4 4
2 2
2 2
1 1
0 0 0 0
Healthy Depression/ Substance use Healthy Depression/ Substance use Healthy Depression/ Substance use Healthy Depression/ Substance use
controls anxiety disorders controls anxiety disorders controls anxiety disorders controls anxiety disorders
Fig. 4: Raincloud plots (distributions, box plots and individual data points) and bar plots (means and standard errors) showing differences be-
tween healthy controls and clinical groups in emotional conflict (EC; expected aversiveness of negative stimuli relative to reward) and decision
uncertainty (β; expected policy precision) in the active inference model of the approach-avoidance conflict task. Left: Propensity-matched sam-
ple. Right: Full sample. Data displayed are before log-transformation.
J Psychiatry Neurosci 2021;46(1) E83Smith et al. participants’ self-reported feelings/motivations during the depression and/or anxiety focus on either threat (i.e., exposure- task and self-reported approach-avoidance motivations, all in based therapy) or reward reactivity (i.e., behavioural activation the expected directions. Further, EC was uniquely associated approaches), but it is possible that these or other treatment with self-reported anxiety on the task, while β was uniquely strategies (e.g., cognitive restructuring or problem-solving) may associated with self-reported difficulty making decisions on in fact target decision uncertainty. Investigations into the rela- the task. Crucially, EC and β were not highly correlated, with tionships between decision uncertainty and response to these distinct relationships to psychopathology. treatments is important for further delineating clinical implica- The computational approach used here may have pro- tions. However, the source of the greater uncertainty in the clin- vided advantages over previous descriptive analyses of task ical groups is unclear. Based on previous work,42 one possibility behaviour, because it could disentangle the effects of conflict could be that psychopathology involves difficulty in separating and uncertainty.11,30 Although previous analyses have fo- “signal from noise” when observing the outcomes of actions cused mainly on relative approach-avoidance drives (i.e., (i.e., did the outcome of my previous action come about by captured by chosen runway position) and reaction times, our chance, or would the same outcome happen again?). However, approach uncovered a unique pattern of differences in deci- this interpretation (among other possible interpretations) will sion uncertainty that may have been missed in previous stud- need to be tested in future work. ies. Specifically, our results showed that patients with de- Contrary to our initial hypothesis, the model did not offer evi- pression, anxiety and substance use disorders exhibited dence that the clinical groups had higher EC. In contrast, we greater uncertainty in decision-making relative to healthy found suggestive evidence for lower emotional conflict in sub- controls, and that those with substance use disorders tended stance use disorders than in healthy controls. Because this find- toward lower emotional conflict (although this latter finding ing occurred only in the full sample, we do not offer strong in- was marginal). Standard descriptive analyses of reaction terpretations here. However, we briefly note that it may be times and chosen runway position did not pick up on this consistent with previous studies suggesting a general blunting difference, and, contrary to expectation, did not show evi- of brain and behavioural responses to affective stimuli in people dence of greater avoidance in the clinical groups. Instead, the with cocaine and methamphetamine use disorders,74,75 and with clinical groups showed no behavioural differences on conflict studies that have linked lower self-reported sensitivity to pun- trials and showed less of the expected approach and avoid- ishment with both methamphetamine and marijuana use,76,77 ance drives in the 2 non-conflict conditions. Post-hoc analyses which could relate to continued drug use because of an insensi- of within-subject choice variability that were motivated by tivity to its negative consequences (for recent computational our decision uncertainty results (which has not been exam- modelling evidence supporting this possibility, see Smith and ined in previous studies) also showed greater choice variabil- colleagues78). This finding could also relate to previous work ity in the clinical groups in these non-conflict conditions (as demonstrating that cognitive bias modification methods that well as in the CONF6 condition; see Appendix 1), suggesting train increased avoidance in response to alcohol cues is benefi- that a mix of separable approach and avoidance drive abnor- cial to recovery in an inpatient sample of people with alcohol- malities may contribute to maladaptive behaviour during ism.79 Interestingly, our supplementary analyses suggested that AAC. Thus, our model-based findings uncovered a pattern of this result was stronger in females, which bore some similarity decision uncertainty that might be more clinically relevant to to previous results suggesting that reduced reward motivation avoidance behaviour in real-world settings. plays a larger role in avoidance behaviour in females.12 The finding that both clinical groups showed greater β val- Our results may also have implications for the active infer- ues relative to healthy controls suggests reduced confidence in ence literature. For example, previous proposals have suggested their internal model of how to act, and a resulting inconsis- a link between state anxiety and the β parameter (or related tency in choice behaviour. This is because, formally, the β par computational parameters associated with emotion and uncer- ameter in active inference models reflects prior expectations tainty),80–86 where higher uncertainty is suggested to underpin about one’s ability to select the best action. This is consistent higher anxiety. However, we found that higher EC, but not with the correlation we observed between slower reaction higher β, was associated with higher self-reported anxiety dur- times and higher β values. Thus, at least in some situations, ing the task (on the post-task Likert scale questionnaire). Our maladaptive approach-avoidance behaviour in substance use results therefore linked state anxiety to the preference distribu- disorders, depression and anxiety could relate more to deci- tion in the model, suggesting that some people with strong anx sion uncertainty than to increased emotional conflict (e.g., iety responses may have found the stimuli quite aversive, and avoidance motivation, threat sensitivity) per se. It is also worth yet were highly confident and consistent in their avoidant strat- noting that our supplementary analyses suggested this effect egy. Future empirical work in active inference research should was stronger in males, which could relate to previous work therefore disentangle the circumstances in which negative affect suggesting that higher anxiety sensitivity more strongly drives is associated with uncertainty versus avoidance drives in these avoidance behaviour in males than females,12 a finding that models. A second implication for active inference stems from could have important treatment implications (e.g., that differ- previous work linking fluctuations (updates) in β values to ent interventions may be necessary in males and females). phasic dopamine responses.87–90 Because substance use has been It is useful to consider whether current or novel interventions linked to dopaminergic system dysfunction (e.g., Huys and aimed at modifying decision uncertainty may have potential colleagues91 and Koob and Volkow92), this model/task could be for improving mental health. Many current interventions for used during neuroimaging to simulate predicted individual E84 J Psychiatry Neurosci 2021;46(1)
Active inference and approach-avoidance conflict
ifferences in dopaminergic dynamics (associated with dif
d Content licence: This is an Open Access article distributed in accor-
dance with the terms of the Creative Commons Attribution (CC BY-
ferences in β90) and perhaps shed further light on the potential
NC-ND 4.0) licence, which permits use, distribution and reproduc-
role of dopamine and its relation to decision uncertainty in tion in any medium, provided that the original publication is
contributing to symptoms and/or treatment response (e.g., the properly cited, the use is non-commercial (i.e. research or educa-
potential role of dopaminergic medications in altering decision tional use), and no modifications or adaptations are made. See:
uncertainty). https://creativecommons.org/licenses/by-nc-nd/4.0/
Limitations References
This was the first study to integrate an active inference model 1. Aupperle RL, Paulus M. Neural systems underlying approach and
avoidance in anxiety disorders. Dialogues Clin Neurosci 2010;12:517.
with an affect-based AAC paradigm in a large, transdiagnostic,
2. Barlow DH, Allen L, Choate M. Toward a unified treatment for
community-based clinical sample. Although the validity of the emotional disorders—republished article. Behav Ther 2016;47:838-53.
model parameters was supported by the model’s high accuracy 3. Ekhtiari H, Victor TA, Paulus MP. Aberrant decision-making and
in predicting behaviour and by the parameters’ expected rela- drug addiction—how strong is the evidence? Curr Opin Behav Sci
tionships to standard task measures, there are important limita- 2017;13:25-33.
tions to consider. As is inevitable when performing model- 4. Guttman Z, Moeller SJ, London ED. Neural underpinnings of mal-
based analyses, we were required to make certain choices about adaptive decision-making in addictions. Pharmacol Biochem Behav
2018;164:84-98.
fixed parameter values. We also chose to use a Bayesian model-
5. Paulus MP. Evidence-based pragmatic psychiatry—a call to action.
ling approach because of the probabilistic nature of the AAC JAMA Psychiatry 2017;74:1185-6.
task, but other modelling approaches could have been con 6. Kirlic N, Young J, Aupperle RL. Animal to human translational
sidered. Still, our model comparison results and the correlations paradigms relevant for approach avoidance conflict decision mak-
observed between model parameters and other self-report/ ing. Behav Res Ther 2017;96:14-29.
behavioural measures suggest that these choices were reason- 7. Lejuez CW, Read J, Kahler C, et al. Evaluation of a behavioral measure
able. Second, the AAC task used in this study was not designed of risk taking: the Balloon Analogue Risk Task (BART). J Exp Psychol
Appl 2002;8:75-84.
in advance with modelling explicitly in mind. Future work
8. Bechara A, Damasio H, Tranel D, et al. Deciding advantageously
should investigate potential task modifications that could fur- before knowing the advantageous strategy. Science 1997;275:1293-5.
ther disentangle distinct computational influences on approach- 9. Talmi D, Dayan P, Kiebel SJ, et al. How humans integrate the pros-
avoidance behaviour. Because this study was exploratory, our pects of pain and reward during choice. J Neurosci 2009;29:14617-26.
results will also need to be replicated by other researchers, as 10. Schlund MW, Brewer AT, Magee SK, et al. The tipping point:
well as in our planned confirmatory analyses on participants value differences and parallel dorsal-ventral frontal circuits gating
sampled from the second 500 participants of the T1000 data set. human approach-avoidance behavior. Neuroimage 2016;136:94-105.
11. Aupperle RL, Melrose AJ, Francisco A, et al. Neural substrates of
approach-avoidance conflict decision-making. Hum Brain Mapp
Conclusion 2015;36:449-62.
12. Aupperle RL, Sullivan S, Melrose AJ, et al. A reverse translational
Our results demonstrate a novel method of modelling affect- approach to quantify approach-avoidance conflict in humans. Behav
based AAC behaviour that was able to differentiate distinct Brain Res 2011;225:455-63.
components of conflict. Relative to healthy controls, trans 13. Rinck M, Becker ES. Approach and avoidance in fear of spiders.
diagnostic behavioural differences during AAC were better J Behav Ther Exp Psychiatry 2007;38:105-20.
accounted for by greater decision uncertainty, as opposed to 14. Friston KJ, Stephan K, Montague R, et al. Computational psychiatry:
the brain as a phantastic organ. Lancet Psychiatry 2014;1:148-58.
greater sensitivity to negative affective stimuli. Future re-
15. Huys QJ, Maia T, Frank M. Computational psychiatry as a bridge
search should replicate these findings and further investigate from neuroscience to clinical applications. Nat Neurosci 2016;19:
their potential clinical relevance. 404-13.
16. Montague PR, Dolan R, Friston K, et al. Computational psychiatry.
Affiliations: From the Laureate Institute for Brain Research, Tulsa, OK, Trends Cogn Sci 2012;16:72-80.
USA (Smith, Kirlic, Stewart, Touthang, Kuplicki, Khalsa, Feinstein, 17. Petzschner FH, Weber L, Gard T, et al. Computational psychoso-
Paulus, Aupperle); and the Oxley College of Health Sciences, Univer- matics and computational psychiatry: toward a joint framework for
sity of Tulsa, Tulsa, OK, USA (Stewart, Khalsa, Paulus, Aupperle). differential diagnosis. Biol Psychiatry 2017;82:421-30.
Competing interests: None declared. 18. Schwartenbeck P, Friston K. Computational phenotyping in psych
iatry: a worked example. eNeuro 2016;3:ENEURO.0049-16.2016.
Funding: This work was funded by the NIGMS (P20 GM121312; 19. Krypotos AM, Beckers T, Kindt M, et al. A Bayesian hierarchical
PI:MPP), the NIMH (K23-MH108707; PI: RLA), and the William diffusion model decomposition of performance in approach-
K. Warren Foundation. avoidance tasks. Cogn Emot 2015;29:1424-44.
Contributors: R. Smith, R. Kuplicki, J. Feinstein, M. Paulus and 20. Sheynin J, Moustafa AA, Beck KD, et al. Testing the role of reward
R. Aupperle designed the study. J. Touthang, R. Kuplicki and and punishment sensitivity in avoidance behavior: a computa-
M. Paulus acquired the data, which R. Smith, N. Kirlic, J. Stewart, tional modeling approach. Behav Brain Res 2015;283:121-38.
J. Touthang, R. Kuplicki, S. Khalsa, M. Paulus and R. Aupperle ana- 21. Kirlic N, Aupperle RL, Rhudy JL, et al. Latent variable analysis of
lyzed. R. Smith, N. Kirlic, J. Stewart, M. Paulus and R. Aupperle negative affect and its contributions to neural responses during
wrote the article, which all authors reviewed. All authors approved the shock anticipation. Neuropsychopharmacology 2019;44:695-702.
final version to be published and can certify that no other individuals 22. Friston K, FitzGerald T, Rigoli F, et al. Active inference and learn-
not listed as authors have made substantial contributions to the paper. ing. Neurosci Biobehav Rev 2016;68:862-79.
J Psychiatry Neurosci 2021;46(1) E85You can also read