Reducing effort in the U.S. American lobster (Homarus americanus) fishery to prevent North Atlantic right whale (Eubalaena glacialis) ...
←
→
Page content transcription
If your browser does not render page correctly, please read the page content below
Reducing effort in the U.S. American lobster (Homarus americanus) fishery to
prevent North Atlantic right whale (Eubalaena glacialis) entanglements may
support higher profits and long-term sustainability
Hannah J. Myers1, 2, 3 and Michael J. Moore1
1
  Biology Department, Woods Hole Oceanographic Institution, Woods Hole, MA 02543 U.S.A.
2
  International Fund for Animal Welfare, Yarmouth Port, MA 02674 U.S.A.
3
  College of Fisheries and Ocean Sciences, University of Alaska Fairbanks, Fairbanks, AK 99775
U.S.A.
Abstract
North Atlantic right whales (Eubalaena glacialis) feed and migrate in areas of the inshore and
offshore trap fishery for American lobster (Homarus americanus) in the Northeast U.S. In
addition to a recent increase in lethal and sub-lethal interactions with Canadian snow crab gear,
entanglement in both Canadian and U.S. lobster trap gear threatens the continued existence of
this endangered species. The U.S. National Marine Fisheries Service is considering a number of
measures to prevent right whale entanglement bycatch that could impact lobster fishing effort.
The U.S. lobster fishery in Maine expends approximately 7.5 times as much effort as the
Canadian fishery in Lobster Fishing Area 34, where fishers catch about 3.7 times more lobster
per trap than Maine fishers. From 2007 to 2013 in Maine, lobster landings doubled as the number
of traps fell 10.5 percent and landings per trap increased by about 125 percent. The state of
Massachusetts has achieved record high landings since trap/pot seasonal closures have been
implemented to protect right whales, especially within the Statistical Reporting Areas most
affected by the closures. Therefore, a negative economic impact should not be assumed with
effort reduction. In fact, reducing effort may serve to increase fishing profits while supporting
the protection of endangered North Atlantic right whales and the long-term sustainability of the
lobster fishery.
Keywords: bycatch, fisheries management, North Atlantic right whales, overfishing, fishing
technology, ropeless fishing
1. Background
The United States’ National Marine Fisheries Service (NMFS) is preparing significant new
regulations designed to reduce bycatch of endangered North Atlantic right whales (Eubalaena
glacialis) in the American lobster (Homarus americanus) fishery. Entanglement in fixed fishing
gear, which, in U.S. waters, is dominated by gear from the American lobster fishery, is the
leading cause of mortality among North Atlantic right whales (Pettis et al. 2018; Sharp et al.
2019) and has important sublethal impacts on the species’ ability to recover (van der Hoop et al.
2017). Many of the measures NMFS is considering could lead to a reduction in fishing effort.
Myers et al. (2007) showed how reducing effort would benefit both the U.S. lobster industry and
the North Atlantic right whale. Here we extend that concept by exploring how overcapacity and
effort reduction are connected to American lobster landings and revenue in the U.S. fishery.
1A. The U.S. American lobster fishery

1
The American lobster fishery is the United States’ most valuable fishery, bringing in over US
$670 million in landings revenue in 2016 (NMFS Annual Commercial Landings Statistics). It is
based in the Northeast, especially the states of Maine, Massachusetts, New Hampshire, and
Rhode Island, and is fished using fixed trap/pot fishing gear. Trap/pot fishing gear consists of a
baited trap or string of traps (referred to as a trawl) on the seafloor connected to a surface buoy
with a vertical buoyline or “endline.” The surface buoy and endline serve to mark the location of
the trap or trawl for the owner and other fixed and mobile fishing gear (i.e. scallop dredge and
bottom trawl) operators operating in the area, as well as to allow the traps to be hauled up
through the water column. The rope connecting traps in a trawl is referred to as “groundline.”
Since 2007, NMFS has required fishers in most areas to use sinking or neutrally buoyant
groundline due to the potential for floating groundline to entangle North Atlantic right whales
(NMFS 2007).
However, North Atlantic right whales and other protected species—including humpback, fin, sei,
and minke whales and loggerhead and leatherback sea turtles—are known to become entangled
in trap/pot endlines (Hayes et al. 2018b; NMFS 2014) [Figure 1]. The U.S. American lobster
fishery employs an estimated 912,300 vertical endlines during peak fishing months—many of
which are within the North Atlantic right whale’s designated Critical Habitat Area (NMFS 2016;
NMFS co-occurrence model 2019) [Figures 2, 3]. The rope used for endlines has become
significantly stronger over recent decades as manufacturing techniques have evolved, likely
contributing to an increase in right whale entanglement severity and mortality as whales are less
able to break free of entangling line and gear (Knowlton et al. 2016).

Figure 1: Illustration of a North Atlantic right whale entangled in vertical endline, showing the surface buoy,
endline, and string of traps or “trawl” connected by sinking groundline. Credit: Natalie Renier, Woods Hole
Oceanographic Institution

2
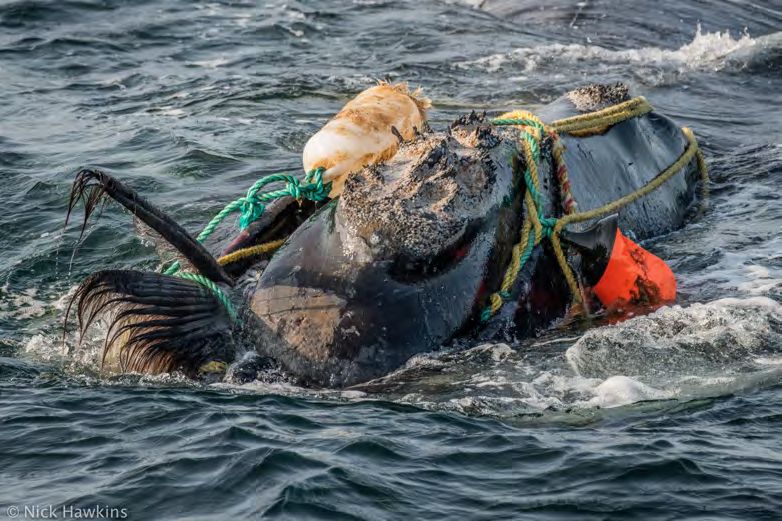
Figure 2 (left): Map of estimated commercial trap/pot endline
                                                  density (number of endlines per 100 square nautical miles) in
                                                  September in the Northeast U.S. using 2016 and 2017 fisheries
                                                  data. The total number of commercial trap/pot endlines in use in
                                                  the Northeast region in September is estimated to be 920,500,
                                                  912,300 of which are used to catch lobster. Source: NMFS co-
                                                  occurrence model 2019,
                                                  https://www.greateratlantic.fisheries.noaa.gov/protected/whaletrp/
                                                  trt/meetings/April%202019/apr_16_risk_reduction_decision_tool
_webinar_full_slide_deck.pdf
Figure 3 (right): Map of North Atlantic right whale designated critical habitat area in the Northeast U.S. Source:
NMFS 2016, available at https://www.fisheries.noaa.gov/resource/map/north-atlantic-right-whale-critical-habitat-
map-and-gis-data.

The Atlantic States Marine Fisheries Commission (ASMFC) has divided the U.S. lobster stock
into three biological areas: the Gulf of Maine, Georges Bank, and southern New England.
According to the most recent stock assessment from 2015, the Gulf of Maine and Georges Bank
stocks are not depleted and overfishing is not occurring, but the southern New England stock is
severely depleted (ASMFC 2015). Climate change and associated disease and poor recruitment
may be at least partly responsible for the collapse of the southern New England stock (ASMFC
2015). The Gulf of Maine stock accounts for more than 90 percent of U.S. landings (ASMFC
2015). The Gulf of Maine and Georges Banks stocks are heavily fished, especially in the fall, but
stock abundance is also high (ASMFC 2015). However, in the most recent stock assessment
from 2015, three of the five young of year indicators—which help indicate future sustainability
of the stock—were low, which may suggest potential declines in recruitment in future years
(ASMFC 2015). Using an annual larval settlement index and local bottom temperature and
disease prevalence indicators, Oppenheim et al. (2019) predict that Gulf of Maine lobster
landings will decline to near-historical levels within the next decade as the lobster population
continues to recede poleward in a warming ocean.
The U.S. American lobster fishery has experienced robust growth in recent decades, with peak
landings in 2016 of over 72,000 metric tons (nearly 160 million pounds) valued at more than
$670 million (NMFS Annual Commercial Landings Statistics). Landings value has also shown
consistent growth. Total U.S. American lobster landings weight increased by 2.78 times from
1992 to 2016, while landings value increased by 2.24 times when adjusted for inflation (4.03
times nominal value) [Figure 4].

3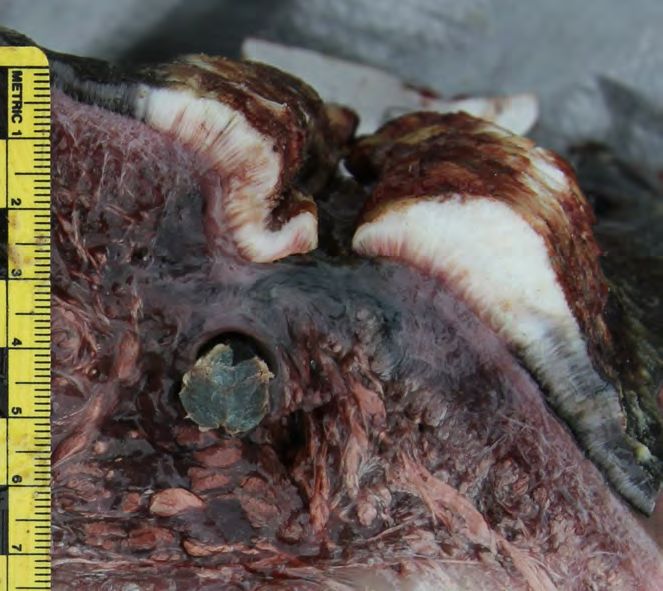
U.S. annual American lobster landings
                                     700
    Landings, millions USD and lbs

                                     600

                                     500

                                     400

                                     300

                                     200

                                     100

                                      0
                                       6

                                              8

                                                     0

                                                            2

                                                                   4

                                                                          6

                                                                                 8

                                                                                        0

                                                                                               2

                                                                                                      4

                                                                                                             6

                                                                                                                    8

                                                                                                                           0

                                                                                                                                  2

                                                                                                                                         4

                                                                                                                                                6
                                        8

                                               8

                                                      9

                                                             9

                                                                    9

                                                                           9

                                                                                  9

                                                                                         0

                                                                                                0

                                                                                                       0

                                                                                                              0

                                                                                                                     0

                                                                                                                            1

                                                                                                                                   1

                                                                                                                                          1

                                                                                                                                                 1
                                     19

                                            19

                                                   19

                                                          19

                                                                 19

                                                                        19

                                                                               19

                                                                                      20

                                                                                             20

                                                                                                    20

                                                                                                           20

                                                                                                                  20

                                                                                                                         20

                                                                                                                                20

                                                                                                                                       20

                                                                                                                                              20
                                                                                      Year
                                                    Landings value (USD)
                                                    Landings value adjusted for inflation (USD)
                                                    Landings weight (lbs)

Figure 4: U.S. annual commercial lobster landings weight and value (nominal and adjusted for inflation) from 1986
to 2017. Inflation adjustment was made using the Producer Price Index (PPI) for Unprocessed Shellfish indexed to
December 1991 (PPI not available for 1986 to 1991). Landings data from National Marine Fisheries Service
(NMFS) Annual Commercial Landing Statistics 2019, PPI from U.S. Bureau of Labor Statistics.

This growth in landings has not been driven by a rise in the number of individuals fishing; the
total number of participants in the fishery has fallen from an estimated 13,000 in 1997 to 8,485
in 2019 (NMFS 1997; NMFS 2019b). There are currently about 2,000 fishers actively operating
with a federal commercial trap/pot license (GARFO American Lobster 2019); states issue the
majority of licenses. NMFS issued a moratorium on new federal licenses in 1999 (NMFS 1999).
Fewer fishers are bringing in significantly more revenue, although costs (especially fuel and bait)
have not remained stagnant. The fishery is dominated by small owner-operated businesses.
1B. North Atlantic right whales
Once numbering in the tens of thousands (Monsarrat et al. 2015), as of 2018 there were an
estimated 411 North Atlantic right whales remaining (Pace et al. 2017; Pettis et al. 2018). The
population grew slowly from a low of approximately 270 animals in 1990 to 482 in 2010, but has
since declined rapidly (Pace et al. 2017) [Figure 5]. Only approximately 90 reproductive-aged
females remain in the population (Pace et al. 2017; Hayes et al. 2018a). With continued high
rates of anthropogenic mortality, the population could be functionally extinct within several
decades (Meyer-Gutbrod and Greene 2018). North Atlantic right whales are protected under the
U.S.’s Endangered Species Act (ESA) and Marine Mammal Protection Act (MMPA) and
Canada’s Species at Risk Act.

4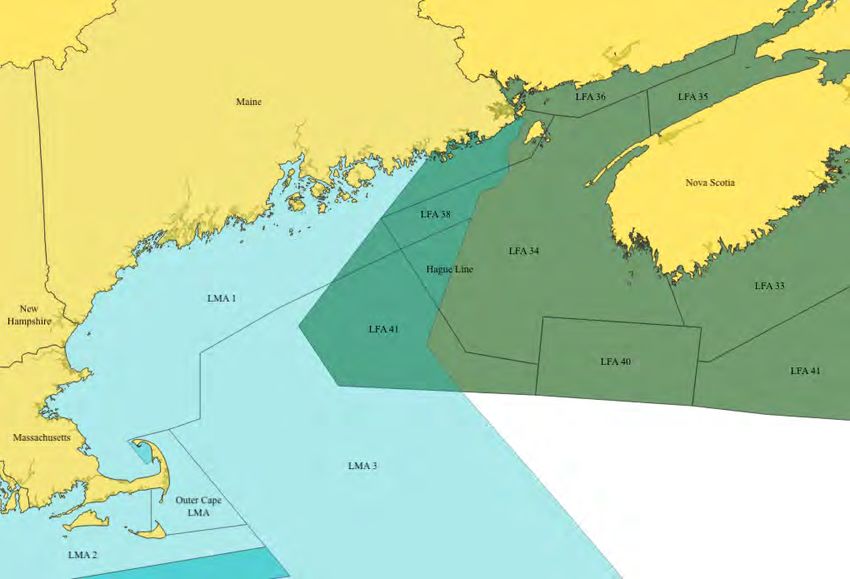
North Atlantic right whale population, calves, and number and cause of
                                                                     observed mortalities and serious injuries
                                                45                                                                                              600
Number of calves and observed mortalities and

                                                40
                                                                                                                                                500
                                                35

                                                                                                                                                      Estimated population
                                                30                                                                                              400
              serious injuries

                                                25
                                                                                                                                                300
                                                20

                                                15                                                                                              200

                                                10
                                                                                                                                                100
                                                5

                                                0                                                                                               0
                                                90

                                                     92

                                                           94

                                                                 96

                                                                       98

                                                                                00

                                                                                     02

                                                                                          04

                                                                                               06

                                                                                                     08

                                                                                                            10

                                                                                                                   12

                                                                                                                         14

                                                                                                                                16

                                                                                                                                       18
                                            19

                                                     19

                                                          19

                                                                19

                                                                      19

                                                                            20

                                                                                     20

                                                                                          20

                                                                                               20

                                                                                                    20

                                                                                                          20

                                                                                                                 20

                                                                                                                        20

                                                                                                                              20

                                                                                                                                     20
                                                                                           Year
                                                      Calves                                        Diagnosed vessel strikes
                                                      Diagnosed entanglements                       Observed mortalities and serious injuries
                                                      Population

Figure 5: Estimated North Atlantic right whale population, number of calves, observed mortalities and serious
injuries, and diagnosed cause of death or serious injury. Diagnosed entanglements have increased significantly since
the population has been in decline. Data from Waring et al. 1997, Kraus et al. 2001, Waring et al. 2002, Moore et al.
2004, Waring et al. 2015, Pace et al. 2017, Pettis et al. 2018, Hayes et al. 2018b, and NOAA Northeast Fisheries
Science Center (unpublished).

In addition to the legal imperative to conserve this species, large whales such as right whales are
increasingly recognized for their important role in sequestering carbon from the atmosphere into
the deep sea and in mixing and transporting nutrients to support primary productivity in marine
ecosystems (Lavery et al. 2010; Pershing et al. 2010; Roman et al. 2014). A recent estimate
placed the value of an average individual large whale at over US $2 million in terms of carbon
sequestration, fisheries productivity enhancement, and ecotourism (Chami et al. 2019).
Entanglement in fishing gear and vessel strikes are responsible for all diagnosed adult North
Atlantic right whale mortalities since 1970; no adults are known to have died of natural causes in
almost fifty years (though many mortalities are not observed or diagnosed) (Moore et al. 2004;
Sharp et al. 2019). Entanglement was the cause of death in 72 percent of diagnosed adult
mortalities since the population has been in decline (from 2010 to 2018), but only 35 percent
from 2000 to 2009 (Moore et al. 2004; Sharp et al. 2019).
North Atlantic right whales can be found off the coast of New England and Canada in areas
likely to overlap with trap/pot fisheries throughout the year (Davis et al. 2017) [Figure 6]. Rope
taken off entangled whales has been tracked to fisheries throughout these areas (Hayes et al.
2018a) [Figure 7].

5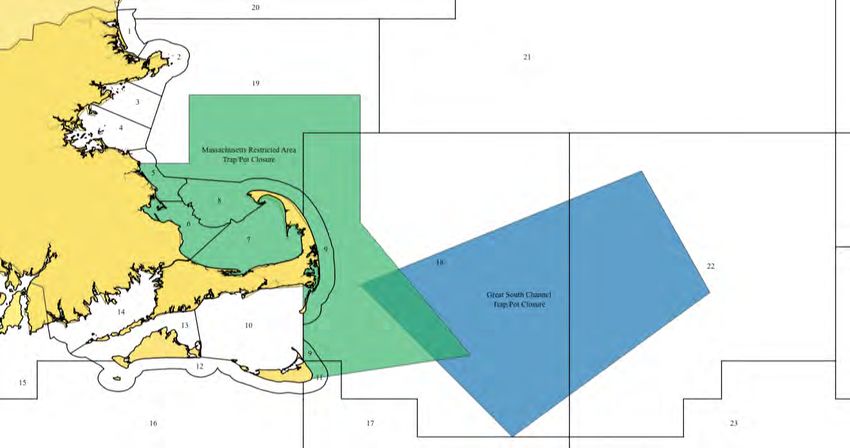
Figure 6 (left): Number of days by season with
                                                           confirmed North Atlantic right whale acoustic
                                                           detections from 2004 to 2014, summarized from all
                                                           available acoustic recording locations. Source: Davis et
                                                           al. 2017
                                                           Figure 7 (right): Map of North Atlantic right whale
entanglements from 1997 to 2017 for which the set location and gear type are known and gear was recovered from a
whale. Source: Hayes et al. 2018a

NMFS has calculated Potential Biological Removal (PBR) for North Atlantic right whales at 0.9,
meaning that less than one animal can be killed each year due to human activity while still
allowing the population to recover (Hayes et al. 2018b). Right whale serious injuries and
mortalities in U.S. waters from entanglement alone—excluding entanglements known to be
caused by Canadian gear—have exceeded PBR every year except for two since 2000 (Morin et
al. 2018b). In their most recent ESA Section 7 consultation on the impacts of the American
lobster fishery, NMFS stated that U.S. lobster fishing gear is likely to kill 3.25 animals annually
(NMFS 2014). Entanglement is very common among North Atlantic right whales: in a 2012
study, 83 percent of right whales showed scars from entanglements and an estimated 26
percent—or approximately 100 animals—are entangled each year (Knowlton et al. 2012).
In addition to mortalities, entanglement has serious sublethal impacts on North Atlantic right
whales that likely inhibit the species’ ability to recover (van der Hoop et al. 2017). Right whales
can produce up to an estimated 8,000lbs of force with a single stroke of their flukes (Arthur et al.
2015), so they will often continue to swim while entangled in rope and/or associated traps and
buoys. Entangling gear creates substantial drag for a swimming animal, and the energetic
demands of an entanglement are comparable to or exceed those of other major life history events
such as migration and pregnancy (van der Hoop et al. 2016; van der Hoop et al. 2017).
For reproductive females, the energetic costs of entanglement can extend the amount of time
needed to recover fat stores following pregnancy, calving and lactation, potentially delaying the
female’s ability to become pregnant (van der Hoop et al. 2017). In recent years, the average
calving interval for reproductive females has stretched from three to ten years (Pettis et al. 2018).
Females have about a five percent chance of not becoming entangled during that ten-year period
(Hayes et al. 2018a).

6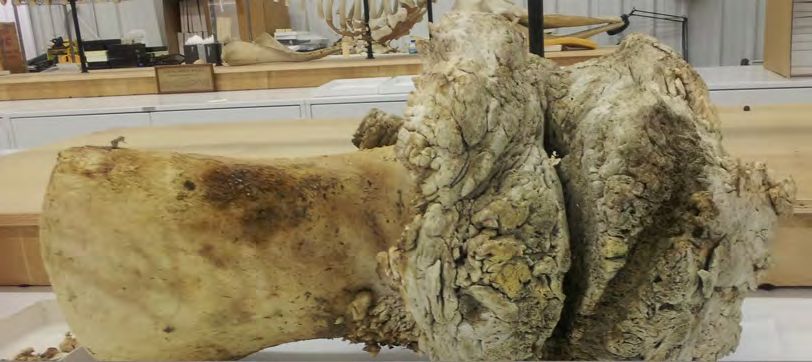
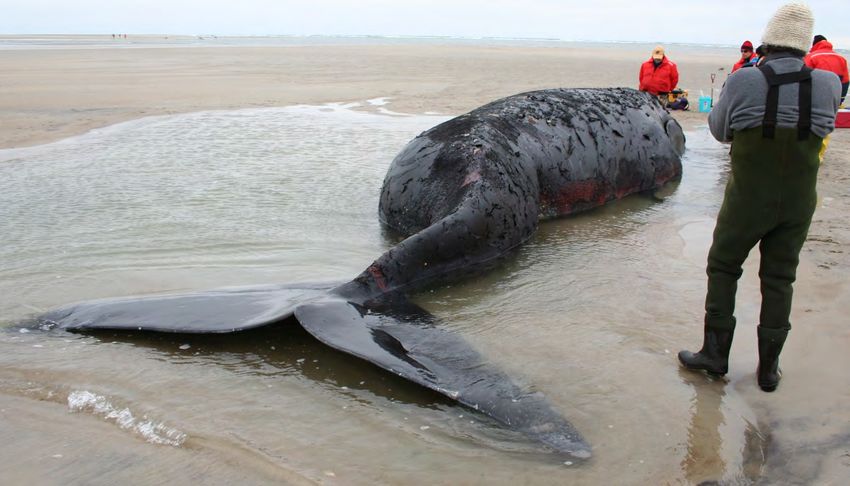
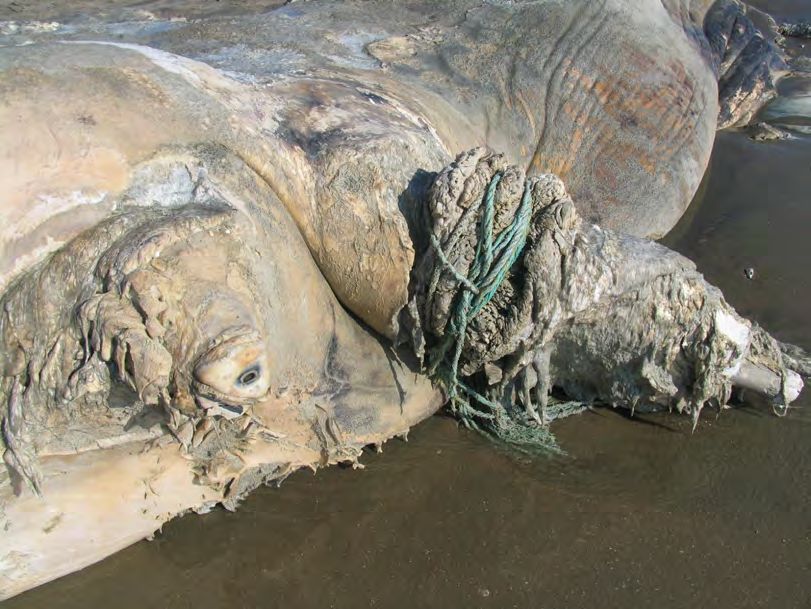
Entanglement also poses a serious animal welfare concern. Beyond preventing the take of marine
mammals, including North Atlantic right whales, at unsustainable levels, the MMPA also
specifies that takes must be humane—wherein the term “humane” means “that method of taking
which involves the least possible degree of pain and suffering practicable to the mammal
involved” (MMPA 1972). When a right whale becomes entangled, the line and gear can wrap
around the animal’s body, flukes, flippers and mouth [Figure 8]—impeding swimming and
feeding, causing chronic infection, emaciation, and damage to blubber, muscle, and bone (Moore
et al. 2006; Moore and van der Hoop 2012; Moore 2013; Dolman and Moore 2017; Sharp et al.
2019) [Figure 9]. It can take months to years for a North Atlantic right whale to die of
entanglement, during which time it experiences extreme pain and debilitation (Moore et al. 2006;
Moore and van der Hoop 2012; Moore 2013; Moore 2014; Dolman and Moore 2017). For
example, entanglement is known to have caused fatal scoliosis in a juvenile whale due to the
strain of dragging fishing gear as a young animal [Figure 10] and nearly severed flippers on
multiple animals swimming in up to 30 to 50 wraps of constricting rope [Figure 11] (Sharp et al.
2019).

Figure 8: A live entangled North Atlantic right whale showing fishing line wraps over the blowhole and through the
mouth, damaging baleen plates. Credit: Nick Hawkins

7
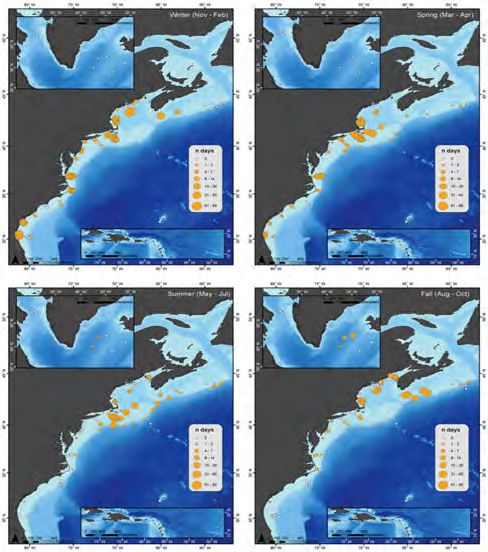
Figure 9: Fishing rope furrowed into the lip of Bayla, North Atlantic right whale #3911. Credit: Michael Moore,
NMFS Permit 932-1905-00/MA-009526

Figure 10: North Atlantic right whale (CALO0901, 3710) with debilitating abnormal curvature of the spine
(scoliosis) caused by an entanglement. This injury caused chronic damage to the spine, which ultimately led to the
young animal’s death. Image credit: University of North Carolina Wilmington; NMFS Permit No. 932-1489.

8
a

        b

Figure 11a (top): North Atlantic right whale (SC118) with 13 constricting wraps of fishing line around a pectoral
flipper that caused a partial amputation.
Figure 11b (bottom): Deep furrow created by fishing line sawing into the humerus of the same whale over time, and
the bone’s unsuccessful attempt to repair this injury. Image credit: NOAA National Ocean Service Center for
Coastal Environmental Health and Biomolecular Research Coastal Marine Mammal Strandings and Assessments
Project; NMFS Permit No. 932-1905

1C. Regulatory processes concerning the U.S. American lobster fishery and North Atlantic
right whales
The U.S. American lobster fishery is cooperatively managed by the states (0-3 miles from shore)
and NMFS (3+ miles from shore) under the framework of the ASMFC. State waters regulations
are promulgated by the respective government agencies, i.e. the Maine Department of Marine
Resources and Massachusetts Division of Marine Fisheries, while complementary federal water

9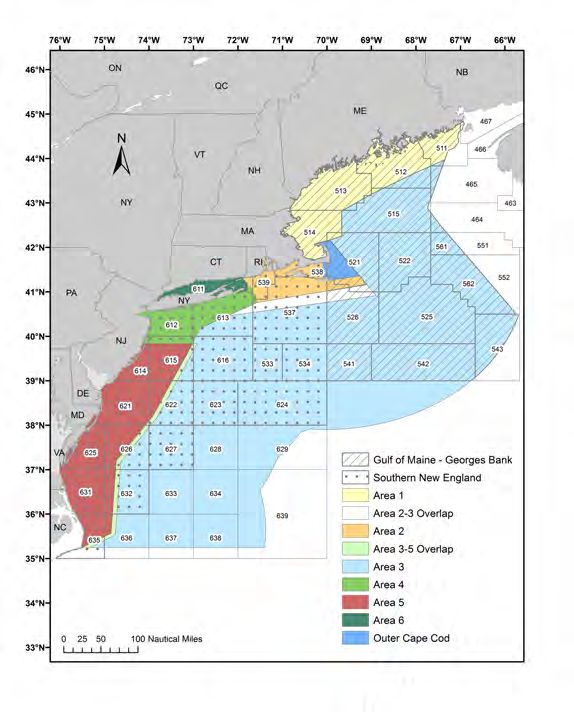
regulations are promulgated by NMFS. The ASMFC assesses the fishery according to seven
Lobster Management Areas (LMAs) [Figure 12], of which LMA 1 is the most productive, with
92.5 percent of total catch in 2012 (the most recent year for which landings by LMA are
available) (ASMFC 2018b). Many fishers are licensed to operate in both state and federal waters;
for example, 27 percent of fishers with Massachusetts state licenses also have federal licenses
(Massachusetts DMF unpublished data). In cases where state and federal regulations differ, the
most restrictive rule applies.
                                                       Figure 12: Map of Lobster Management Areas
                                                       showing Gulf of Maine - Georges Bank and
                                                       southern New England lobster stock areas, and
                                                       NMFS Statistical Reporting Areas. Source: Atlantic
                                                       States Marine Fisheries Commission, Map of Stock
                                                       Assessment and Management Areas, available at
                                                       http://www.asmfc.org/uploads/file//58f8cd9aLobste
                                                       rManagement_StockArea_Map_Nov2016.JPG

                                                        The Atlantic Large Whale Take Reduction
                                                        Team (ALWTRT), a group of fishers,
                                                        scientists, conservationists, and state and
                                                        federal officials, was created in 1996 as
                                                        mandated by the Marine Mammal
                                                        Protection Act to advise NMFS on steps to
                                                        reduce incidental take (or killing) of large
                                                        whales in Atlantic fixed gear (trap/pot and
                                                        gillnet) fisheries to a level below PBR
                                                        (NMFS 1997). Although the ALWTRT is
                                                        mandated to reduce take of all large whale
                                                        species affected by the fisheries, in recent
                                                        years the ALWTRT has focused on North
                                                        Atlantic right whales due to the urgency of
                                                        the right whale entanglement crisis and the
potential for this species to become extinct in the near future.
Since 1997, NMFS has taken a series of management actions, some of which were recommended
by the ALWTRT, to identify and reduce North Atlantic right whale bycatch (Hayes 2018a).
These include gear marking requirements, surface weak links, sinking groundlines, trap limits,
minimum numbers of traps per endline, and seasonal fishery closures (Hayes et al. 2018a).
However, right whale entanglement mortalities and serious injuries have increased substantially
over the same period and the population trajectory has reversed from modest growth to rapid
decline. Though a number of factors have likely contributed to the rising entanglement mortality
rate, including stronger fishing rope (Knowlton et al. 2016) and climate change-related shifts in
right whale distribution (Record et al. 2019), protective measures to date have failed to
demonstrably reduce total right whale entanglement risk and mortalities.
Between June 2017 and September 2019, 30 North Atlantic right whales were found dead in U.S.
and Canadian waters in an Unusual Mortality Event (UME) (NOAA 2019). This UME has
brought renewed urgency to the ALWTRT and NMFS rulemaking processes.

10
At the April 2019 ALWTRT meeting, NMFS indicated an intent to develop and implement new
rules to reduce North Atlantic right whale bycatch by 60 to 80 percent and asked Team members
to generate proposals to meet that risk reduction target (NMFS correspondence 2019). At the end
of the meeting, the Team reached near-consensus agreement on a suite of measures implemented
by state and federal management area (NMFS Key Outcomes Memorandum 2019). The primary
risk reduction measures agreed upon were:
1. Reductions in the number of endlines fished by 18 to 50 percent
2. Use of reduced breaking strength (less than 1,700lbs force) endlines
There were notable differences in the recommendations from different caucus groups within the
ALWTRT. The fishing industry and state management representatives focused on endline
reductions and reduced breaking strength rope, while the conservation non-governmental
organization (NGOs) members also recommended:
3. Additional time/area fishery closures in North Atlantic right whale aggregation areas
4. Rapid research using and steps toward implementation of ropeless fishing gear
(defined as gear that does not use endlines prior to gear retrieval)
Additional seasonal closures and ropeless gear testing and/or implementation were not included
in the near-consensus recommendations (NMFS Key Outcomes Memorandum 2019), but are
likely to be continually considered as part of ongoing efforts to reduce large whale bycatch in the
fishery.
The ALWTRT’s near-consensus subsequently withered on August 20th, 2019 when the Maine
Lobstermen’s Association withdrew their support (Maine Lobstermen’s Association 2019).
However, the purpose of the ALWTRT is to make consensus-based recommendations to NMFS,
and under the MMPA NMFS is responsible for implementing measures to reduce serious injuries
and mortalities to below PBR regardless of whether the Team reaches consensus (MMPA 1972).
NMFS therefore subsequently indicated their intent to move forward with regulations (Oliver
2019). In August 2019, NMFS published a notice of intent to prepare an environmental impact
statement and a request for public comments on proposed modifications to the Atlantic Large
Whale Take Reduction Plan, which was based on the ALWTRT’s risk reduction framework
(NMFS 2019a). NMFS is tentatively expected to release a proposed rule including the
ALWTRT’s recommendations by early 2020, with a final rule expected thereafter.
2. Potential impacts of proposed regulations on fishing effort
Each of the major management measures NMFS is considering to reduce right whale bycatch
could have an impact on fishing effort, described here by the number of traps or trap days used,
as explained below. If the lobster fishery is operating efficiently, then a reduction in effort would
likely lead to reduced landings and potentially lower revenue (depending on the extent to which
price rises in response to a contraction of supply). In contrast, if the exploitation rate in the
lobster fishery is above optimum efficiency, reducing effort would likely allow lobster biomass
to build up so that catch rates remain high with substantially reduced operating costs (Myers et
al. 2007; Worm et al. 2009). Understanding how effort reduction could impact the fishery is
important for federal and state regulators, the fishing industry, and conservation interests.
1. Reductions in the number of endlines fished
11There are multiple ways in which an endline reduction can be implemented: (1) directly, such as through a vertical endline cap that could be administered similar to trap tags, and (2) indirectly, such as through a trap limit reduction combined with a set minimum number of traps per trawl. In either case, it is imperative that a vertical endline reduction be implemented as a reduction from the actual number of endlines fished, not from the amount currently allowed under regulations, for such a measure to have the expected entanglement risk reduction benefit for right whales. This is because in many areas of the fishery actual effort is lower than regulations allow. If, for example, the trap limit was reduced from 800 to 600 traps in an area where fishers use 550 traps on average, the measure would have significantly less than a 25 percent entanglement risk reduction benefit. If a direct endline cap were to be pursued, the endline reduction would not necessarily lead to an equivalent reduction in the number of traps fished, because many fishers can add traps to trawls in order to continue fishing their standard number of traps. However, vessel and other equipment constraints would likely limit some individuals from fishing their full trap allocation.1 For example, fishers operating offshore in LMA3 often already fish long trawls of 20 or more traps and may have a limited ability to add more traps per endline. Fishers who operate on small vessels inshore may not have sufficient mechanical hauling strength to fish longer trawls. Therefore, we expect an endline cap to lead to a reduction in effort that is greater than zero but less than the amount of the endline reduction (for example, a 50 percent endline reduction will lead to a trap reduction between 0 and 50 percent). In contrast, an indirect endline reduction implemented through a trap reduction and minimum number of traps per trawl would have a direct impact on effort, provided that the reduction is from actual number of traps fished. 2. Use of reduced breaking strength (less than 1,700lbs force) endlines Of the proposed measures, the use of reduced breaking strength endlines has the least clear impact on effort, and may not lead to an appreciable reduction in the number of traps fished. If fishers find that 1,700lb breaking strength rope cannot adequately handle their trawls as currently configured, they may consider reducing the number of traps per trawl so as to reduce the load on the endline when hauling (although there are also requirements on the minimum number of trap per trawl). However, other reconfigurations, such as lengthening the groundline between the first and second traps in a trawl, may similarly reduce the load on the endline without reducing the number of traps per trawl. 3. Additional time/area fishery closures in North Atlantic right whale aggregation areas Seasonal closures would have a direct impact on fishing effort by requiring complete removal of fishing gear from an area for a period of time. The extent to which seasonal closures will impact fishing effort depends on the duration of the closure, season, and area fished. Although fishers are currently allowed to harvest American lobster year-round other than within specific seasonal closures, there are significant differences in effort and landings by season. For example, in many areas landings are highest in the fall, while late winter and early spring bring in a significantly lower harvest (ASMFC 2015). However, some fishers keep their gear in the water even when 1 Most fishers in the U.S. lobster fishery are licensed to use up to 800 traps, though there are important differences by area, especially in LMA3 where fishers may use up to 1,945 traps (GARFO American Lobster Commercial Fishing Regulations 2019). 12
harvest is minimal,2 and endlines pose the same whale bycatch threat regardless of how much
lobster is being harvested.
Neither fishing effort nor right whales are evenly distributed across the fishery; seasonal closures
aim to identify areas and periods of highest risk. One particular area of concern discussed at the
April 2019 ALWTRT meeting is south of Martha’s Vineyard and Nantucket in NMFS Statistical
Reporting Area 537 (NMFS Key Outcomes Memorandum 2019). Right whales have maintained
a near-constant presence in Area 537 over the last three years and have frequently been observed
aggregating in large numbers—sometimes more than 100 individuals (NOAA Right Whale
Sightings Advisory System, NMFS Key Outcomes Memorandum 2019). Their presence has
triggered NMFS to implement a number of successive Dynamic Management Areas, where
mariners are asked (but not required) to avoid the area or reduce vessel speed to 10 knots or less
(NMFS Office of Protected Resources 2019). Effort in this area is relatively low, but the offshore
lobster industry operating there uses heavy fishing gear (NMFS co-occurrence model 2019;
NMFS Key Outcomes Memorandum 2019).
4. Use of ropeless fishing gear
Instead of leaving an endline in the water continuously, ropeless fishing gear releases a buoy and
endline or inflates a lift bag to come to the surface when a fisher sends an acoustic command to
retrieve their trawl (Myers et al. 2019) [Figure 13]. Alternatively, many fishers already use a
customized hook to catch the groundline between traps and haul their gear to the surface—called
grappling—when the permanent buoy or endline go missing (Myers et al. 2019). Both acoustic-
release ropeless fishing and grappling have the potential to substantially reduce or eliminate
entanglement in endlines. Entanglement involvement with endlines is the most commonly
identified interaction since the sinking groundline rule went into effect (D. Morin personal
communication); since 2007, line consistent with endlines has been recovered from entangled
whales about ten times more often than line consistent with groundline (Morin et al. 2018a).

Figure 13: Illustration of acoustic-release ropeless fishing gear. Upon receiving an acoustic trigger, a buoy and

2
 Marine mammal regulations require that lobster traps be hauled back only once every 30 days (GARFO American
Lobster Commercial Fishing Regulations 2019).

13
endline attached to a trap at the end of a trawl deploys for retrieval or a lift bag inflates and brings the attached trap
and trawl to the surface. Endlines are only used during gear retrieval, or not at all if a lift bag is used. A virtual trap
marker visible on a screen in the vessel would replace the marker buoy. Credit: Natalie Renier, Woods Hole
Oceanographic Institution

Ropeless fishing gear may take longer to retrieve than traditional methods due to the added time
needed to triangulate on gear position using acoustic signals and/or the time needed to grapple
(Myers et al. 2019). This may be particularly relevant for early adopters of ropeless gear; time
costs may go down as fishers become accustomed to different retrieval methods and technologies
are iteratively improved. If fishers are not able to haul as many trawls per day when fishing
ropeless, ropeless fishing could effectively cause a reduction in effort. Additionally, the upfront
costs of transitioning to ropeless fishing gear may be too high for fishers to replace all of their
endlines at once. Combining a transition to ropeless fishing gear with an endline or trap
reduction could make the upfront investment more feasible.
On the other hand, ropeless fishing could offer a solution for fishers facing an endline reduction:
if allowed by federal and/or state regulations,3 fishers could replace some of their endlines with
ropeless retrieval units to meet endline reduction requirements. Therefore, the overall impact of
ropeless fishing on effort depends on implementation.
3. Overcapacity and effort reduction in the U.S. lobster fishery
We examined three case studies to describe how fishing effort has correlated with landings in the
U.S. lobster fishery:
         A. Comparison of lobster fishing effort on the U.S. (Maine) and Canadian (Lobster
            Fishing Area 34) sides of the Gulf of Maine in terms of number of traps and season
            days
         B. State of Maine landings and number of traps over time
         C. Landings within the Massachusetts Restricted Area seasonal trap/pot closure and
            Massachusetts statewide landings since the closure was implemented
We used publicly available4 landings data, price indices, and trap and license counts and the
longest available time series up to 1986 in order to show decadal trends.
3A. Effort and landings in the Gulf of Maine: Maine compared to Lobster Fishing Area 34
We employ a comparison of the lobster fishery on the U.S. and Canadian sides of the Hague
Line, the North Atlantic boundary between U.S. and Canadian fishing waters, in 2016 and 2017.5

3
  Current federal and state regulations require the use of surface marking systems that use endlines in the American
lobster fishery (GARFO American Lobster Commercial Fishing Regulations 2019). However, NMFS and some state
agencies have demonstrated interest in supporting ropeless gear development and use.
4
  Some data sets used are not publicly published but are available upon request to the relevant state or federal
agency.
5
  Myers et al. (2007) also employed a comparison of the U.S. and Canadian lobster fisheries across the Hague Line
and found that U.S. effort was about 13 times higher than Canadian. However, Myers et al. (2007) compared
landings and traps in the U.S.’s Lobster Management Area 1 and Canada’s Lobster Fishing Area 34 and calculated
effort using different assumptions. We chose to compare the state of Maine and LFA 34 because more recent and
complete landings and effort data were available. Therefore, these two studies should not be directly compared,

14
U.S. landings are from Maine state- and federally licensed landings from the Gulf of Maine; Canadian landings are from Lobster Fishing Area (LFA) 34 [Figure 14]. These two areas share similar biological characteristics and have both experienced record landings in recent years following four decades of landings growth (Myers et al. 2007; DFO Seafisheries Landings; NMFS Annual Commercial Landings Statistics). However, the Maine lobster fishery has a much higher trap limit and is allowed to fish year round, whereas LFA 34 is restricted to about one half of the trap limit for most Maine fishers and fishing is restricted to a winter season from the last Monday in November to May 31st (GARFO American Lobster Commercial Fishing Regulations; DFO Integrated Fisheries Management Plan 2019). Figure 14: Map of U.S. Lobster Management Areas (LMAs) and Canadian Lobster Fishing Areas (LFAs) in the Gulf of Maine divided by the Hague Line. Maine landings and effort (primarily from LMA1 and LMA3) are compared to landings and effort in LFA 34. This map shows the U.S. definition of the Hague Line. Map created in QGIS using shapefiles from NMFS Greater Atlantic Regional Fisheries Office (Lobster Management Areas) and Free 2017 (Atlantic Coast: Lobster Fishing Areas). To compare effort in Maine and LFA 34, we compared lobster landings, number of traps, and season days in each area in 2016 and 2017, the two most recent years for which data are available [Table 1]. LFA 34 data are provided by fishing season; in this analysis 2016 refers to the 2015/2016 fishing season and 2017 refers to the 2016/2017 fishing season. For the state of Maine, the number of traps is the number of trap tags sold, as published by the state of Maine Department of Marine Resources (Maine DMR 2019). For LFA 34, we calculated the number of although the conclusion that the U.S. Gulf of Maine fishery is operating at substantial overcapacity holds in both assessments. 15
traps as the trap limit (3836) multiplied by the number of licenses (979) (DFO 2019). We
calculate overcapacity in Maine compared to LFA 34 as:
                                      Overcapacity in Maine versus LFA 34 =
                                     (number of traps x season days) / landings

        Lobster Fishing Effort in Maine versus Lobster Fishing Area 34, 2016
                               Maine                LFA 34                Maine/LFA 34

        Landings (metric              60,175                      29,151                      2.06
        tons)
        Number of traps               2,946,000                   375,000                     7.86

        Season days                   365                         184                         1.98
        Overcapacity in                                                                       7.55
        Maine versus LFA
        34
Table 1A: Landings, number of traps, and season days in Maine versus Lobster Fishing Area (LFA) 34 in 2016
(LFA 34’s 2015/2016 fishing season). Maine fishers used approximately 7.55 times as much effort as fishers in LFA
34 to harvest the same amount of lobster. Maine landings data from National Marine Fisheries Service Annual
Commercial Landings Statistics and number of traps from Maine Department of Marine Resources Historical Maine
Lobster Landings. LFA 34 landings, number of licenses, trap limits, and season days from Fisheries and Oceans
Canada March 2019 update to the Integrated Fisheries Management Plan for LFAs 27-38.

        Lobster Fishing Effort in Maine versus Lobster Fishing Area 34, 2017
                               Maine                LFA 34                Maine/LFA 34

        Landings (metric              48,983                      22,679                      2.16
        tons)
        Number of traps               2,954,000                   375,000                     7.88

        Season days                   365                         185                         1.97
        Overcapacity in                                                                       7.20
        Maine versus LFA
        34
Table 1B: Landings, number of traps, and season days in Maine versus Lobster Fishing Area (LFA) 34 in 2017
(LFA 34’s 2016/2017 fishing season). Maine fishers used approximately 7.20 times as much effort as fishers in LFA
34 to harvest the same amount of lobster. Maine landings data from National Marine Fisheries Service Annual
Commercial Landings Statistics and number of traps from Maine Department of Marine Resources Historical Maine
Lobster Landings. LFA 34 landings, number of licenses, trap limits, and season days from Fisheries and Oceans
Canada March 2019 update to the Integrated Fisheries Management Plan for LFAs 27-38.

In Maine, fishers use nearly eight times as many traps to catch about twice as much lobster as
fishers in LFA 34 [Table 1]. Since the lobster fishing season in Maine is almost twice as long as
that in LFA 34, we calculate that effort in Maine is approximately 7.5 times higher than that in

6
 The trap limit in LFA 34 is 375 for approximately two thirds of the season and 400 for one third of the season
(DFO 2019). We therefore used a scaled trap multiplier of 383.

16
LFA 34 to harvest the same amount of landings. Results were comparable from 2016 to 2017, as
both areas experienced a drop in landings of about 20 percent.
It is important to note that many Maine fishers do not actively fish during the full 365-day
season, and commonly remove gear for part of the year. However, even if we estimate that
Maine fishers use 75 percent of available fishing days (292 days), capacity in Maine is still about
5.5 times that in LFA 34. Additionally, the number of trap tags sold in Maine does not fully
account for latent effort; some fishers likely do not use all of the trap tags they purchase.
However, the number of trap tags sold is markedly lower than the full trap limit. In 2016 and
2017, the number of trap tags sold averaged 490 and 493 per fisher, respectively (Maine DMR
2019), whereas the trap limit is 800 in most areas. This indicates that the number of trap tags sold
is a better indicator for actual effort than the number of licenses multiplied by the trap limit in
Maine. In contrast, the number of traps for LFA 34 calculated here represents the upper bound
for this area and assumes all license holders fish the full trap limit.7
Even if latent effort in Maine is approximately 20 percent of the number of trap tags sold and
Maine fishers actively fish 75 percent of the year, overcapacity in Maine compared to LFA 34 is
4.5 times.8 Even a much lower overcapacity estimate would indicate that effort reduction
measures currently under consideration by NMFS (i.e. an endline and possible trap reduction of
up to 50 percent) would likely benefit the fishery.
Next, we calculated landings per trap in Maine compared to LFA 34 [Table 2]. Total landings
indicate a fisher’s revenue (when multiplied by ex-vessel price), and does not account for cost. In
contrast, landings per trap is a stronger proxy for profit than total landings because it partially
accounts for costs by standardizing to effort. Bait and fuel are frequently the most significant
input costs to harvest lobster, and are closely related to the number of traps used (i.e. each trap is
baited, and fishers likely travel farther and use more fuel to haul more traps). To calculate
landings per trap, we divided total annual landings by the number of traps from Table 1.
Landings per trap in Maine versus Lobster Fishing Area 34
Maine landings per LFA 34 landings LFA 34/ Maine
trap (lbs) per trap (lbs)
2016 45 171 3.8
2017 37 133 3.6
Table 2: Landings per trap in Maine compared to Lobster Fishing Area (LFA) 34 in 2016 and 2017 (LFA 34’s
2015/2016 and 2016/2017 fishing seasons, respectively). LFA 34 fishers harvested about 3.7 times as much lobster
per trap as Maine fishers. Maine landings data from National Marine Fisheries Service Annual Commercial
Landings Statistics and number of traps from Maine Department of Marine Resources Historical Maine Lobster
Landings. LFA 34 landings, number of licenses, trap limits, and season days from Fisheries and Oceans Canada
March 2019 update to the Integrated Fisheries Management Plan for LFAs 27-38.
In 2016 and 2017, LFA 34 fishers brought in about 3.7 times as much lobster per trap than Maine
fishers (3.8 times in 2016 and 3.6 times in 2017). This calculation of landings per trap does not
take season days into account. Again, if latent effort in Maine is approximately 20 percent of the
7
LFA 34 license holders are issued a yearly set of trap tags which matches the trap limit, they do not select a
number of trap tags to purchase each year (Fisheries and Oceans Canada March 2019 update to the Integrated
Fisheries Management Plan for LFAs 27-38).
8
7.5 x .80 x .75 = 4.5 times overcapacity in Maine compared to Lobster Fishing Area 34
17number of trap tags sold, LFA 34 landings per trap are still three times higher than in Maine,
assuming all LFA 34 fishers use the full trap limit.
LFA 34 did not achieve high landings in recent years by increasing effort; the number of lobster
licenses and trap limit has remained consistent over time [Figure 14] (Myers et al. 2007; DFO
2011; DFO Atlantic Region Licenses). Therefore, landings per trap (a proxy for profit) in LFA
34 mirrored growth in total landings [Figure 15]. In contrast, the number of traps in Maine
increased for much of the last three decades [Figure 14] (Maine DMR 2019), likely indicating
comparably higher costs and lower profits during a similar period of landings growth [Figure
15]. We compared the number of lobster traps in Nova Scotia Maritimes and Maine from 1990 to
2017 to illustrate this concept. Here we switch to Nova Scotia Maritimes because a more
consistent time series of the number of licenses is available (DFO Atlantic Region Licenses).
LFA 34 is the most significant contributor to total Nova Scotia Maritimes landings. The number
of traps in Nova Scotia Maritimes was calculated by multiplying the annual number of licenses
by the proportion of licenses per LFA, category, and LFA restrictions from the most recent
Integrated Fisheries Management Plan from 2011 (DFO 2011).
Number of lobster traps in Maine and Nova Scotia Maritimes
3,500
Approximate number of traps
3,000
2,500
(thousands)
2,000
1,500
1,000
500
0
90
92
94
96
98
00
02
04
06
08
10
12
14
16
19
19
19
19
19
20
20
20
20
20
20
20
20
20
Year
NS Maritimes number of traps Maine number of traps
Figure 14: Estimated number of lobster traps in Maine versus Nova Scotia (NS) Maritimes from 1990 to 2017.
Maine number of traps showed uneven growth until reaching a peak of 3.283 million traps in 2006 and has since
tapered off slightly, while NS Maritimes number of traps has remained relatively consistent at approximately
900,000 traps. Data from Maine Department of Marine Resources Historical Maine Lobster Landings, DFO
Integrated Fisheries Management Plan for LFAs 27-38 (2011), and DFO Atlantic Region Licenses.
18Lobster landings and landings per trap in Maine and Nova
140
Scotia Maritimes 70
Landings, metric tons (thousands)
120 60
Landings per trap, lbs
100 50
80 40
60 30
40 20
20 10
0 0
90
92
94
96
98
00
02
04
06
08
10
12
14
16
19
19
19
19
19
20
20
20
20
20
20
20
20
20
Year
NS (Maritimes) landings per trap (lbs) ME landings per trap (lbs)
NS (Maritimes) landings, metric tons ME landings, metric tons
Figure 15: Maine and Nova Scotia (NS) Maritimes lobster landings and landings per trap from 1990 to 2017. While
NS Maritimes landings per trap mirrored landings growth, Maine landings per trap remained relatively stagnant for
the majority of this period. Data from DFO Seafisheries Landings, DFO Atlantic Region Licences, DFO Integrated
Fisheries Management Plan for LFAs 27-38 (2011), NMFS Annual Commercial Landings Statistics, and Maine
Department of Marine Resources Historical Maine Lobster Landings.
Landings per trap is especially relevant as per trap harvesting costs, especially bait, are expected
to rise in the near future. For example, from 2018 to 2019 the U.S. Atlantic herring quota was cut
by 80 percent and is expected to remain low in coming years (NMFS 2019c). Because herring
has been the most important American lobster bait, the reduced quota could cause bait shortages
and higher prices in the near-term, increasing per trap lobster harvesting costs (though other bait
alternatives may mitigate higher costs) (NMFS 2019c).
3B. Maine landings and number of traps over time
Maine is the largest contributor to the American lobster fishery, with fishers in the state bringing
in 83.3 percent of total U.S. catch in 2016 (NMFS Annual Commercial Landings Statistics). The
Maine Department of Marine Resources maintains a database of historical Maine lobster
landings that details the number of traps in the fishery (Maine DMR 2019).9 The number of traps
used by Maine lobster fishers grew through the late 1980s and 90s to reach a high in 2006 of
3.283 million traps, and has since tapered off [Figure 16]. Landings have shown strong growth
throughout, driving the overall growth in the U.S. lobster fishery despite the collapse of the
southern New England stock since the late 1990s [Figure 16] (ASMFC 2015).
9
From 1981 to 1995, DMR calculated the number of traps used by estimating the number of active boats and mean
traps per harvester. From 1996 to 2016 the number of traps was taken from the number of trap tags sold.
19Maine landings per trap, number of traps, and total landings
140 3.5
Landings weight (millions of lbs) and
120 3
Number of traps (millions)
landings per trap (lbs)
100 2.5
80 2
60 1.5
40 1
20 0.5
0 0
86
88
90
92
94
96
98
00
02
04
06
08
10
12
14
16
19
19
19
19
19
19
19
20
20
20
20
20
20
20
20
20
Year
Total landings weight Landings per trap Number of traps
Figure 16: Maine lobster landings per trap, number of traps (an upper bound indicated by the number of trap tags
sold), and total landings weight from 1986 to 2017. Landings per trap were relatively stagnant except from 2007 to
2013, when landings per trap increased substantially year on year, correlating with a decrease in the number of traps
and faster rate of growth in total landings. Data from National Marine Fisheries Service Annual Commercial
Landings and Maine Department of Marine Resources Historical Maine Lobster Landings.
Although many factors impact landings, historically a reduction in number of traps has not been
connected to reduced landings in Maine. Landings per trap have been relatively stagnant in
Maine for most of the last three decades, except for a period from 2007 to 2013 when landings
per trap grew rapidly year on year. During this period, landings per trap grew 124 percent from
19.6lbs to 43.8lbs. This growth in landings per trap correlates with a 10.5 percent decrease in
number of traps and a doubling in landings (100.2 percent increase). As discussed above (section
3A), landings per trap is a better proxy for fishing profit than landings alone. The rate of growth
of total landings weight was also faster after trap numbers began to fall: from 2007 to 2016
Maine landings grew by 207 percent, whereas from 1997 to 2006 landings grew by 160 percent,
and landings grew by 183 percent in the decade prior. Such a correlation between reduced effort
and increased landings is characteristic of an overexploited fishery.
3C. Massachusetts landings before and after implementation of the Massachusetts
Restricted Area trap/pot seasonal closure
In 2015, NMFS expanded trap/pot seasonal closures in the Massachusetts Restricted Area and
the Great South Channel to protect significant aggregations of North Atlantic right whales
known to feed in these areas each year [Figure 17] (NMFS 2014b). The Massachusetts Restricted
Area is closed to trap/pot fishing from February 1st to April 30th and the Great South Channel is
closed to trap/pot fishing from April 1st to June 30th (NMFS 2014b). In 2017, 2018, and 2019,
the Massachusetts Division of Marine Fisheries extended the closure in Cape Cod Bay by up to
14 days due to the continued presence of endangered right whales (Massachusetts DMF 2017;
2018; 2019). We focus on the Massachusetts Restricted Area closure in this study because it
fully covers multiple Statistical Reporting Areas, making it more feasible to discern the change
20in landings since the closure was implemented, and because the Massachusetts Restricted Area contributes a greater portion of total statewide landings. Figure 17: Map showing the Massachusetts Restricted Area (green) and Great South Channel (blue) Trap/Pot Closures and Massachusetts lobster harvesting Statistical Reporting Areas (SRAs). The Massachusetts Restricted Area closure includes all of SRAs 6, 7, 8, and 9 and most of SRA 5, as well as portions of SRA 18 and 19. The Great South Channel is located within SRAs 18 and 19. Map created in QGIS using shapefiles from NMFS Greater Atlantic Regional Fisheries Office (Great South Channel Restricted Trap/Pot Area and Massachusetts Restriced Area) and MassGIS Bureau of Geographic Information (Lobster Harvest Zones, State Outline, and New England). These Massachusetts Restricted Area closure primarily impacts Massachusetts-based fishers, especially those fishing Massachusetts’ south shore, Cape Cod Bay, and the outer Cape, though the exact number of fishers affected is unclear. In an amendment to the final rule establishing the trap/pot fishery closure published in 2014, NMFS estimated that “slightly more than” 125 fishers would be affected by the Massachusetts Restricted Area closure (NMFS 2014b). The Massachusetts Division of Marine Fisheries (DMF) has identified 172 individuals who previously fished in Statistical Reporting Areas that fall within the Massachusetts Restricted Area during February, March, and April who can no longer do so (Massachusetts DMF unpublished data). Representatives of the fishing industry have recently estimated that 250 fishers are affected (Casoni 2018). In 2017, there were 1,018 commercial lobster permits licensed in Massachusetts, of which approximately 780 are actively fished (Massachusetts DMF unpublished data). Therefore, according to these estimates the Massachusetts Restricted Area closure affects between 16 and 32 percent of Massachusetts’ active lobster fishers. Since the seasonal closures last at least three months, fishers who are impacted often publicly state that they lose at least one quarter of their income each year due to the closures (Abel 2019a; Abel 2019b). Some fishers claim that the three-month closure effectively becomes five months, causing them to lose closer to 40 percent of their annual income because it takes about one month to remove their traps before the February 1st start date and another month to replace them once the fishery reopens (Abel 2019a; Abel 2019b; Casoni 2019). However, in the three years 21
for which Vessel Trip Report data are available since the closure was implemented (2015, 2016,
and 2017), lobster landings in the Statistical Reporting Areas (SRAs) covered by the closures
have continued to grow to record highs [Figure 18] (Massachusetts DMF unpublished data).
Vessel Trip Reports are collected for all commercial vessels fishing in Massachusetts waters
(ASMFC 2018a).

                                           Lobster landings in Massachusetts Statistical Reporting Areas 5 to 9
                            4,500,000

                            4,000,000

                            3,500,000
     Annual landings, lbs

                            3,000,000

                            2,500,000

                            2,000,000

                            1,500,000

                            1,000,000

                             500,000

                                   0
                                   90

                                           92

                                                 94

                                                        96

                                                             98

                                                                   00

                                                                          02

                                                                               04

                                                                                      06

                                                                                           08

                                                                                                  10

                                                                                                        12

                                                                                                             14

                                                                                                                  16
                                  19

                                        19

                                                19

                                                       19

                                                             19

                                                                  20

                                                                          20

                                                                               20

                                                                                      20

                                                                                           20

                                                                                                20

                                                                                                        20

                                                                                                             20

                                                                                                                  20
                                                                               Year
                                   SRA 5             SRA 6        SRA 7         SRA 8           SRA 9        Total MRA

Figure 18: Annual lobster landings weight, in millions of pounds, for Massachusetts Statistical Reporting Areas
(SRAs) 5, 6, 7, 8, and 9 from 1990 to 2017. Vertical line indicates the start of the Massachusetts Restricted Area
Trap/Pot Closure in 2015. The Massachusetts Restricted Area Trap/Pot Closure includes all of SRAs 6, 7, 8, and 9,
as well as most of SRA 5 and small portions of SRAs 18 and 19. Data from the Massachusetts Division of Marine
Fisheries (unpublished).

The growth in landings in the Massachusetts Restricted Area is consistent with statewide trends:
Massachusetts state landings value reached record highs for all three years for which data are
available since the closure was implemented (2015, 2016, and 2017) [Figure 19] (NMFS Annual
Commercial Landings Statistics). Massachusetts’ landings weight also reached an all-time high
in 2016, and 2015 and 2017 were the fifth and third highest years on record, respectively [Figure
19] (NMFS Annual Commercial Landings Statistics).

22
Massachusetts lobster landings
20 90
Massachusetts landings value (millions USD)
Massachusetts landings (millions lbs)
18 80
16 70
14
60
12
50
10
40
8
Feb. 1, 2015: Massachusetts Restricted 30
6 Area seasonal closure went into effect
4 April 1, 2015: Great South Channel 20
2 seasonal closure went into effect 10
0 0
86
88
90
92
94
96
98
00
02
04
06
08
10
12
14
16
19
19
19
19
19
19
19
20
20
20
20
20
20
20
20
20
Year
MA landings (lbs) MA landings (value, USD)
Figure 19: Massachusetts state landings by weight and value from 1986 to 2017. The Massachusetts Restricted Area
and Great South Channel seasonal trap/pot closures took effect in 2015. Data from National Marine Fisheries
Service Annual Commercial Landings Statistics.
Standardizing landings weight to 1990 in the primary SRAs covered by the Massachusetts
Restricted Area and the rest of Massachusetts shows that commercial lobster fishers in SRAs 5 to
9 have experienced stronger growth than those in the rest of the state since the closure was
implemented. Landings growth in SRAs 5 to 9 continued consistently since the seasonal closure
was implemented on February 1st, 2015, but was inconsistent elsewhere [Figure 20]. Notably,
landings weight in SRAs 5 to 9 did not drop from 2016 to 2017, in contrast to the rest of
Massachusetts and most of the Northeast U.S. When compared to neighboring areas (SRAs 1 to
4 to the north of the Massachusetts Restricted Area and SRAs 10 to 14 to the south), the SRAs
covered by the closure have also shown stronger relative growth [Figure 21].
23American lobster landings weight in the Statistical Reporting
Areas covered by the Massachusetts Restricted Area closure and
the rest of Massachusetts
3
Landings weight, standardized to 1990
2
1
0
1990 1992 1994 1996 1998 2000 2002 2004 2006 2008 2010 2012 2014 2016
-1
-2
-3
-4
Year
Massachusetts Restricted Area Rest of Massachusetts
Figure 20: American lobster commercial landings weight standardized to 1990 landings in the primary Statistical
Reporting Areas (SRAs) covered by the Massachusetts Restricted Area (SRAs 5, 6, 7, 8, and 9) and the rest of the
state of Massachusetts. The Massachusetts Restricted Area seasonal trap/pot fishery closure took place on February
1st, 2015. Data from Massachusetts Division of Marine Fisheries (unpublished) and National Marine Fisheries
Service Annual Commercial Landings Statistics.
Lobster landings in Statistical Reporting Areas covered by the
Massachusetts Restricted Area closure and neighboring areas
9
Landings weight, millions of pounds
8
7
6
5
4
3
2
1
0
90
92
94
96
98
00
02
04
06
08
10
12
14
16
19
19
19
19
19
20
20
20
20
20
20
20
20
20
Year
SRAs 1-4 SRAs 5-9 SRAs 10-14
Figure 21: Lobster landings weight in the Statistical Reporting Areas (SRAs) covered by the Massachusetts
Restricted Area (5-9) and to the north (1-4) and south (10-14) from 1990 to 2017. Relative growth in landings in
SRAs 5 to 9 was stronger than in neighboring areas since the closure was implemented. Vertical line indicates the
start of the three-month closure in 2015. Data from Massachusetts Division of Marine Fisheries (unpublished).
24Lobster is not harvested evenly throughout the year, but rather landings are typically low in
February, March, and April. This was a significant part of the rationale for amending the
Massachusetts Restricted Area closure start date from January 1st to February 1st, which NMFS
did before the closure was enacted in 2015 (NMFS 2014b). Although landings during the closure
period have historically been very low across the state, low weight is in part compensated for by
higher price per pound [Figure 22] (Atlantic Coastal Cooperative Statistics Program). Fishers
who previously may have harvested during the closure months could have experienced a
negative economic impact even if they were able to harvest more weight later on, since they
would be selling it for a lower price.
Massachusetts monthly lobster landings weight and ex-vessel price
4 10
9
Landings weight (millions lbs)
3.5
8
Price per pound (USD)
3
7
2.5 6
2 5
1.5 4
3
1
2
0.5 1
0 0
Jun-07
Apr-08
Dec-09
May-10
Oct-10
Mar-11
Jun-12
Apr-13
Dec-14
May-15
Oct-15
Mar-16
Jun-17
Apr-18
Jan-07
Nov-07
Sep-08
Feb-09
Jul-09
Aug-11
Jan-12
Nov-12
Sep-13
Feb-14
Jul-14
Aug-16
Jan-17
Nov-17
Sep-18
Month
Landings weight Price
Figure 22: Massachusetts monthly lobster landings weight and ex-vessel price per pound, January 2007 to
December 2018. Price is nominal and not adjusted for inflation. Data from Atlantic Coastal Cooperative Statistics
Program.
However, average lobster landings from February, March, and April in SRAs 5 to 9 changed by
only 19,450 pounds from the four-year period immediately before the Massachusetts Restricted
Area closure was implemented (2011 to 2014) to the four-year period immediately after (2015 to
2018) (Massachusetts DMF unpublished data). When monthly landings weight is multiplied by
the average price per pound in Massachusetts for each month, we find that this 19,450 pound
difference is equivalent to a change in revenue of about $94,000 for all of SRAs 5 to 9
(Massachusetts DMF unpublished data) [Figure 23]. Since the closure was implemented, SRAs 5
to 9 have landed an average of 4.16 million pounds of lobster worth about $19.41 million
annually10 (Massachusetts DMF unpublished data; NMFS Annual Commercial Landings
Statistics). The change in landings during the closure months is therefore worth only about 0.5
percent of annual landings from these areas. On the other hand, annual landings from SRAs 5 to
9 have gone up about 587,800 pounds since the closure was implemented (Massachusetts DMF
unpublished data), an overall increase approximately 30 times greater than the amount lost
10
This value was calculated by multiplying the average annual portion of statewide landings from SRAs 5 to 9
(0.2396) by the average landings value for the state of Massachusetts ($80,991,600) from 2015 to 2017.
25You can also read