An Adaptive Whale Optimization Algorithm Guided Smart City Big Data Feature Identification for Fair Resource Utilization - IJITEE
←
→
Page content transcription
If your browser does not render page correctly, please read the page content below
International Journal of Innovative Technology and Exploring Engineering (IJITEE)
ISSN: 2278-3075, Volume-8, Issue-12, October 2019
An Adaptive Whale Optimization Algorithm
Guided Smart City Big Data Feature
Identification for Fair Resource Utilization
Kapil Sharma, Sandeep Tayal
to finish the learning norms and necessities of the
Abstract: World improvement is the development of every employments of the savvy city by understanding the essential
single province of the world. Smart city implies changed hardware keen condition characteristics [6]. The smart city abuses
to adjusted individuals. Smart cities have the most indispensable preferred standpoint of rising advancements, for instance,
part in altering distinctive regions of human life, touching
wireless sensor network (WSN), to limit asset utilization and
segments like transportation, wellbeing, vitality, and instruction.
Productively to make measurements to improve distinctive smart cost [7]. The rising advancements among one with the
city benefits huge information frameworks are put away, enormous probable to improve smart city administrations are
prepared, and mined in smart cities. For the change and course of huge information investigation [8]. At the exhibit, a great deal
action of huge information applications for smart cities, different of information is being made from different information
difficulties are faces. In this paper, we propose a wrapper display sources like PCs, advanced mobile phones, cameras, sensors,
based ideal element recognizable proof calculation for ideal use of
assets given highlight subset age. Nine component determination interpersonal interaction destinations, worldwide situating
techniques used for compelling element extraction. At last, which frameworks, diversions and business exchanges [9]. The
includes best add to the ideal usage of assets got by means of a dataset made in the current world of digitizing creates,
novel element recognizable proof calculation made by the powerful information stockpiling and handling offices have
application out of a Whale Optimization Algorithm with Adaptive presented challenges on the logical stages and traditional
Multi-Population (WOA-AMP) system as inquiry process in a
information mining [10] [11]. The use of huge information in
wrapper display driven by the notable relapse demonstrate
regression model Random Forest with Support Vector Machine a smart city has numerous points of interest and difficulties,
(RF-SVM). Our proposed calculation gives the exact method to together with the openness of substantial mathematical and
choose the most agreeable feature blend, which prompts ideal storerooms to practice floods of information delivered inside
asset usage. a brilliant city condition [11][12].
Keywords: Feature selection, Whale Optimization Algorithm Data Computation and Processing Phase (DCPP) takes
(WOA), Adaptive Multi-Population (AMP), Random forest, Smart
city. after nine element feature techniques for successful
component extraction. They are DIA affiliation factor, Chi
I. INTRODUCTION measurement, Information Gain, Document Frequency,
OCFS, DPFS, Comprehensive Measurement Feature
As another sort of reasonable improvement, the thought Selection, Mutual Information, and enhanced Gini record
"Smart City" knows a tremendous expansion among the [13],[14],[15]. The huge test here is we need to distinguish
current years [1]. The little and substantial regions are which technique is appropriate for particularly recognizing
proposing another city display, called "the smart city," which the highlights.[38] To defeat this test, we have required a
speaks to a gathering of normal innovation estimate, alluring viable approach in light of recognized highlights for ideal
and secure, agreeable, interconnected and doable [2]. The usage of assets.[37]
innovative Internet of Things (IoT) solutions is empowering The upcoming sections of the research paper contains,
Smart City practices the overall world. It empowers to control section 1 contains the introduction of the smart city feature
contraptions and manage, remotely screen, and to make novel selection, section 2 has the recent related techniques as a
encounters and important information from huge surges of literature survey, section 3 contains the proposed Whale
steady data [3]. The basic characteristics of a brilliant city join optimization with Adaptive Multi-Population (WOA-AMP),
an irregular condition of information development section 4 represents the results of the anticipated system and
compromise and an expansive usage of information resources section 5 provides the conclusion of the proposed method.
[4]. The fundamental parts of urban change for a splendid city
should fuse shrewd industry, keen development, keen II. RELATED WORKS
organization, wise life and splendid organizations [5].
Each part of an economy of nations is changed by using Yintong Wang et al. [16] proposed a proficient
smart city big data. Such change engages urban communities Semi-administered Representatives Feature Selection
calculation given data hypothesis (SRFS).
Revised Manuscript Received on October 10, 2019
* Correspondence Author
*Kapil Sharma, Delhi Technological University, Delhi, India.
Email: kapil@ieee.org
Sandeep Tayal, Delhi Technological University, Delhi, India.
Email: tayal.mait@gmail.com
Retrieval Number L37631081219/2019©BEIESP Published By:
DOI: 10.35940/ijitee.L3763.1081219 Blue Eyes Intelligence Engineering
271 & Sciences Publication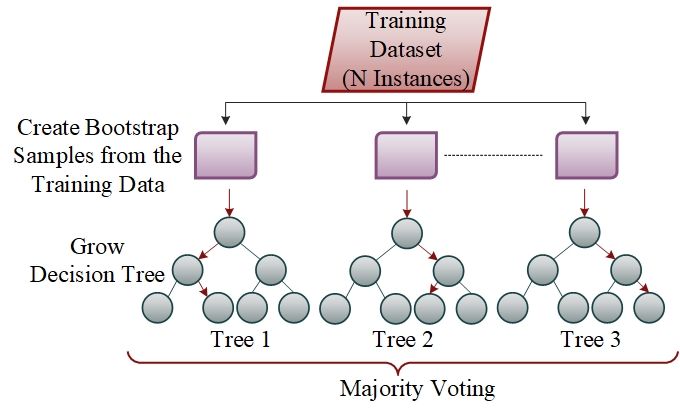
An Adaptive Whale Optimization Algorithm Guided Smart City Big Data Feature Identification for Fair
Resource Utilization
SRFS has a place with channel approaches and has performed combinatorial blast is tended to utilized swarm seek approach
especially well in evacuating the unimportant highlights and connected incrementally. This approach likewise fits better
bunching the excess highlights. At first, they built up with genuine applications where their information land in
importance pick up the system through which the pertinence streams.[36] What's more, an incremental information mining
of highlights can estimate in the unlabelled information. approach is probably going to take care of the demand for
Promote they presented the parcel of the guided non-cyclic enormous information issue in benefit registering.
diagram to group the repetitive highlights. At long last, they
expanded the current Markov blanket calculations to abuse III. FEATURE SELECTION BASED WHALE
the extra data entropy contained in the unlabelled OPTIMIZATION USING WRAPPER BASED
information. Also, they found, pertinence picks up measure is METHOD
an essential advance to investigate the data of unlabelled The way toward disposing of the insignificant features and
information, and lessening the time unpredictability. excess features from the database is known as features choice,
Ahamad Tajudin Khader and Laith Mohammad Abualigah et which is used to improve the learning algorithm. The two
al. [17] exhibited a mixture of PS (particle swarm) criteria, named as assessment and search criteria feature
improvement calculation through administrators of genetic collection approaches arranged. By utilizing the wrapper and
for the component feature issue. The adequacy of the got channel approaches the chose feature subsets assessed.
highlights subsets assessed by using the k-means bunching. Algorithm of Learning is utilized as a part of the wrapper
The element choice issue is defined as an improvement issue strategy in the determination procedure [21].
to locate an ideal subset of useful content highlights. Besides, Big data smart cities [34]reasonable usage of assets is the
it dispenses with uninformative highlights. The outcomes fundamental goal of our proposed strategy. For this activity,
demonstrated that the proposed technique diminishes the numerous improvement strategies are utilized. In our
number of uninformative highlights as well as essentially proposed article, whale enhancement technique is used to get
improves the execution of the content clustering calculation; the reasonable used ideal list of capabilities.[35] By utilizing
the accomplished outcomes are similarly superior to the this ideal technique list of capabilities to be chosen and
aggressive strategies. decrease the computational period; additionally, the forecast
Kuan-Cheng Lin et al. [18] proposed a Feature choice institution of metrics has the preferred qualities over the
[39]strategy in light of an enhanced particle swarm current strategies.
advancement calculation for enormous information 3.1 Wrapper Method
arrangement. The proposed calculation is known as The feature selection in the basis of novel Whale
'Improved CSO' (ICSO) and adjusted starting the amicable Optimization Algorithm is working based on wrapper-based
particle swarm advancement. They led investigations to strategy. The usage of the classifier as in the form of the
decide if the two proposed techniques enhance the execution controller of the feature selection system is the foremost
of conventional CSOs when connected exclusively. The feature of the wrapper strategies. The subsequent three main
execution of the general ICSO in include choice was assessed schemes are used in the feature selection in wrapper [22]:
utilizing an SVM. They utilized different datasets to • Classification Scheme
encourage correlations of ICSO and CSO and likewise led a • Criteria of Feature Evaluation
trial to research the impacts of fluctuating SVM restrictions
• Search Scheme
on CSO and ICSO yields.
Sina Tabakhi et al. [19] displayed an unsupervised component
choice strategy given subterranean ant colony optimization,
called UFSACO. The technique looks to locate the ideal
element subset through a few emphases without utilizing any
learning calculations. Additionally, the element importance
will be processed in light of the comparability between
highlights, which prompts the minimization of the repetition.
Along these lines, it can be named a channel based
multivariate strategy. The proposed technique has a low
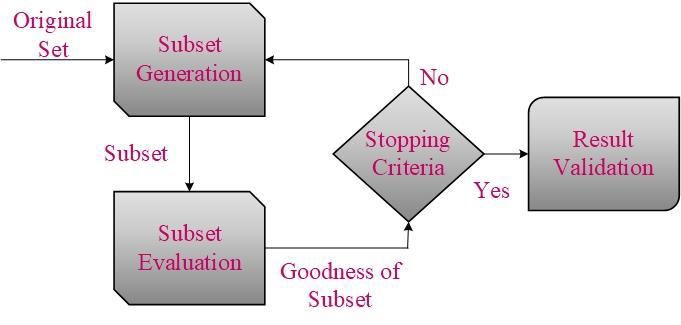
computational many-sided quality; along these lines, it can be Fig 3.1 Process of Feature Subset Selection
connected for high dimensional datasets. The test comes A Subset Generation is a heuristic pursuit process where
about on a few habitually utilized datasets demonstrate the look for space contains states, each one of which
productivity and adequacy of the UFSACO technique and demonstrates a cheerful subset for evaluation. Two things
additionally enhancements over past related strategies. must be settled for subset age, Search starting stage, and
Simon Fong et al. [20] proposed a novel lightweight Search framework. Hunt starting stage can be forward,
component determination calculation, especially to mine backward, bi-directional, and unpredictable. An interesting
gushing information on the fly, and it is utilized the APSO framework must pick the contender subsets [6].
(accelerated particle swarm optimization). The assessment An Evaluation display is used to survey each as of late
comes about demonstrated that the incremental technique made candidate.
acquired a higher pick up in exactness every second caused in
pre-handling. Specifically, APSO is intended to utilize for
information mining of information streams on the fly. A
Published By:
Retrieval Number L37631081219/2019©BEIESP Blue Eyes Intelligence Engineering
DOI: 10.35940/ijitee.L3763.1081219
272 & Sciences Publication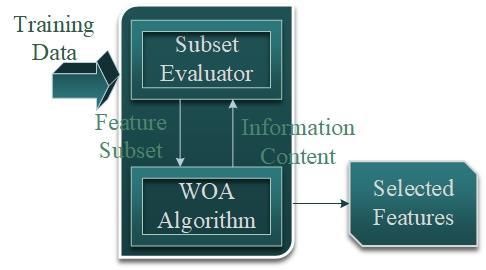
International Journal of Innovative Technology and Exploring Engineering (IJITEE)
ISSN: 2278-3075, Volume-8, Issue-12, October 2019
In perspective of the dependence on learning calculations the class marks of covered up occurrences; exactness is
that will be associated with pick feature set an evaluation typically the evaluator of the produced subsets, however, cost
demonstrate is arranged into two social affairs, one is needy high to figure precision for each element subset.
criteria second one is self-ruling criteria. Wrapper Consequently, in the wrapper technique, it is imperative to
demonstrate uses subordinate criteria, and for feature choice, distinguish the choice strategy most appropriate for the given
it needs a learning computation. Fairness of feature or its dataset and characterization strategy. Besides, the subset of
subset is assessed with the help of critical features of the highlights chose is the negligible containing all the pertinent
arrangement data without associating any learning algorithm. highlights for the objective class. Fig 3.2 shows the
In include subset decision, a stopping model speaks to wrapper-based feature selection approach. The training set
produced to subset evaluator. The dataset is too big, so the set
when the feature decision process will stop. A bit of the
is given to the optimization algorithm to evaluate the optimal
routinely used halting criteria are according to the
dataset. The reduced dataset value is processed under the
accompanying:
correlation process to get the optimal feature set. The most
➢ Exhaustive search finishes. relevancy data considered as the optimal set and the other
➢ If a progressive expansion or evacuation of any element values are given back to the subset evaluator.
does not influence comes about component determination 3.2 WOA
process could be ceased. Here the WOA is said to be a fresh optimization algorithm.
➢ If the agreeably decent subset chosen. The WOP algorithm used to mimic the Humpback whales
Toward the end, comes about are approved by utilizing natural behavior. Hunting behavior is the main character of
grouping blunder rate of classifiers as an execution marker. these whales in the path of survival. This technique is to
Examinations are led to compare the characterization error address the optimization problems, and the hunting strategy
rate on the full arrangement of the classifier learned on has been introducing and to chase the prey in the search space;
the capability to employ the best agent or random is the whale
highlights, and that prepared on the chose include subset [8].
algorithms uniqueness. By using spirals, humpback whales
Wrapper based component subset assessment strategies
bubble-net attaching mechanism is simulated [23].
prompt learning calculations amid assessment venture to
The demonstrating of this calculation incorporates three
calculate the decency of a chose include subset given the administrators to mimic the scan for prey (investigation
calculation's precision so are computationally costly when stage), the surrounding prey, and the air pocket net searching
contrasted with channels. As far as prescient or arrangement, (abuse stage) conduct of humpback whales. The numerical
exactness wrapper strategies viewed as better than the definition is displayed and clarified as takes after:
channel. The utilized element order criteria or target work in • Prey Encircling: By using the best hunt operator whale
the wrapper highlight determination is regularly mirroring the calculation begins here. The present activities are the best and
grouping execution and also the number of highlights. A also whether it is the area of the prey or near this expects it.
non-specific portrayal of the wellness work speaking to for Whatever remains of the operators subsequently refresh their
both order execution and the number of chose includes as areas in the direction of the finest pursuit specialist.
portrayed in condition (10) In wrapper-based techniques, the
single assessment of guaranteed arrangement is exorbitant as
it generally applies preparing and testing of the given more P B . x * (t ) x (t ) (1)
tasteful. Along these lines, the proficient choice of the look
technique is fundamental. x (t 1) x * (t ) A . P (2)
Here, a recent repetition of the method represented as t;
coefficient vectors are denoted as A and B . The best
*
solution in the location vector represented as x , and the
location vector is x . x* must be updated iteratively for the
actuality of better solution. A and B Vectors are deliberate
in the following expression:
Fig 3.2: Wrapper Approach for Feature Selection
The wrapper is a moderate component determination strategy. A 2a.r a (3)
As per the reliance standard embraced by the wrapper display,
it requires a foreordained acceptance calculation and B 2. r (4)
utilizations its execution measure to be connected on the
chosen subset to figure out which highlights are chosen. It by where, over the number of iterations from 2 to 0, a is
and large gives better execution as it chooses includes more linearly decreased and random vector in [0, 1] denoted as r.
qualified to the fated acceptance calculation. However, it is
computationally more costly and moderate, which may not be
appropriate for other acceptance calculations once in a while.
The highlights chose by the classifier are utilized to anticipate
Retrieval Number L37631081219/2019©BEIESP Published By:
DOI: 10.35940/ijitee.L3763.1081219 Blue Eyes Intelligence Engineering
273 & Sciences Publication
An Adaptive Whale Optimization Algorithm Guided Smart City Big Data Feature Identification for Fair
Resource Utilization
The above demonstrating gives some operator to refreshing
that one area in the district of the present finest arrangement
(7)
also emulates enclosing the victim. For n measurements it also
x * (t ) A . P if p 0.5
x (t 1)
P . e . cos(2l ) x (t ) if p 0.5
' bl *
encourages the look space, also the specialists encourage the
hypercubes development using the about the finest where, p is a random number in [0, 1].
arrangement accomplished. Exploration Phase: A global optimization is attaining in
Exploitation Phase: It is also known as bubble-net attacking
also two tactics are used to work the task: WOA in this phase. To accommodate the search agent A is
Mechanism of Shrinking encircling: here, based on the eqn set casually from [-1, 1] and which is used to retreat as of the
3, a value is reduced and subsequently the changeability reference whale. It means the value of A ranges from either
less than the -1 or greater than 1. Search agent location
range of A is also reduced by a . it indicates that a is simplified through choosing an agent in randomly and that
permits WOA to execute the global search.
arbitrarily positioned in [- a a ]. Here over the optimization
The mathematical expression of the displaying of this
time from 2 to 0 the value of a is reduced. Where, The
assessment appliance given below:
unpredictability of A in [-1, 1], determine the search agents
new location next to the best current location and past agent
P C . xrand x (8)
location.
Spiral updating position: The distance amongst x (t 1) x rand A . P (9)
the locations of whale and its prey is estimated. By using
Where random location for the arbitrary whale denoted as
humpback whales of helix shape, the spiral equation is formed
among prey locations also whale to enhance the movement. It x rand and that preferred since the present residents. The
exposed in the following equation: WOA pseudo-code presented in Algorithm 1.
x (t 1) P . e bl . cos(2l ) x (t )
' *
3.3 Feature selection of WOA
(5) Whale optimization algorithm approach utilized for consist
of optimal in a wrapper-form strategy. The significant
P x (t ) x (t )
' *
(6) standard for the wrapper-based technique is used to put on the
order of methodology as a manual for determination strategy
The ith whale distance is given in eqn 6, and the logarithmic includes some enhanced part which chose the feature set. This
spiral shape constant is denoted as b, and in the region of [-1, article applies the WOA adaptively for the ideal element
1] random number is denoted as l. It has a whale movement in subset to discover that expanding order execution. With an
the direction of its prey is simultaneously spread over the underlying best pursuit operator, the whales ceaselessly
shrinking circling, and it placed in a spiral-shaped path. modify their areas to any point in the space begins the suitable
Consequently, the whale’s next position updated by the 50% operator in the WOA. As in conditions (1) and (2) their work
postulation of the opportunity to control between the binary to refresh the situations toward the best pursuit specialist from
modes. that forward point. With a similar measurement in the
dataset, the individual arrangement portrayed as a constant
vector. The arrangement vector esteems limited to [0, 1] and
constant. While the estimations of arrangement fitness
calculation are binary signified. A connected fitness work is
normally coordinating several chose features and the
grouping execution. This can be spoken to the following
condition.
f . H (1 )
i i (10)
N
Based on the above equation, f is represented as a function
of fitness specified a vector θ, N sized with 1/0 components,
which is elaborating the unselected or selected feature subset.
In the database, the whole amount of features described as N.
Fig 3.3: Algorithm of WAO with Feature Subset Selection
Published By:
Retrieval Number L37631081219/2019©BEIESP Blue Eyes Intelligence Engineering
DOI: 10.35940/ijitee.L3763.1081219
274 & Sciences Publication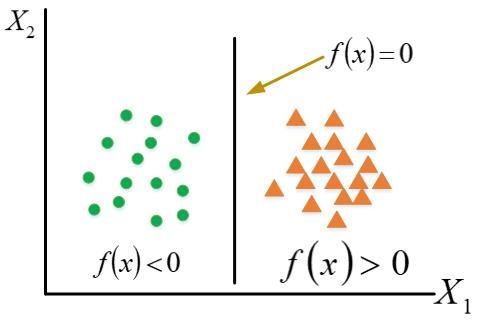
International Journal of Innovative Technology and Exploring Engineering (IJITEE)
ISSN: 2278-3075, Volume-8, Issue-12, October 2019
From the given selected feature subset, H is represented as a For b = 1 to B Make
classification error. β is a constant. Finally, the constant Draw Z* of size N.
handling the trade-off amongst classification errors to feature Construct a random forest tree Rf to the initial
subset quantity. The organization enactment is the main condition, through the repeatedly reconstructing the
associated steps for every end child of the tree, till the
objective, so β=1 use in this work.
point that the base hub evaluates nmin is makes to a
3.4 Regression Model Random Forest with Support minimum.
3.4.1 Vector Machine (RF-SVM): From the p variables, select the m variables
Random Forest: randomly.
Among the m pick the finest
This procedure comprises of an outfit of various
variable/split-point.
relapse trees. Random forest regression is a tree-based
Divide the node
strategy that includes stratifying or portioning the predictor
space into various straightforward locales. To make a forecast Output the group of trees T .
B
b1
for a given perception, the mean of the reaction estimations of
Fig 3.5: Algorithm of Random Forest
the preparation perceptions in a similar area is regularly
The prediction making at the novel point x is denoted by:
connected [24].
Regression:
Fˆ B X T X
1 B
rf
B
b 1 b
(11)
Classification:
The bth random forest tree prediction is assumed by Cˆ b x .
Cˆ rfB X majority vote Cˆ b X 1
B
(12)
In random forest arrangement technique, numerous
classifiers are produced from littler subgroups of the
information and late their distinct outcomes are collected in
light of a voting mechanism to create the coveted yield of the
informational info index. This outfit learning system has, as of
late turned out to be exceptionally prevalent. Previously from
Fig 3.4: Random Forest Pictorial Representation the RF, Bagging, Boosting and were the main two group
education strategies utilized. RF has been broadly connected
It is the piece of programmed learning technique. in different zones together with sedate present-day disclosure,
"Bagging" and irregular subspaces ideas consolidated by organize interruption identification, arrive cover examination,
utilizing this calculation. The choice tree forest calculation FICO assessment investigation, remote detecting and quality
microarrays information examination and so on [26] [27].
prepares on numerous choice trees driven on somewhat
Two approaches are used to assess the blunder
unique subsets of information. proportion. They are the training and testing part. To fabricate
The arbitrary backwoods is a piece of the set the backwoods, the preparation part is used, and to figure the
strategies that takings the choice tree as a separable indicator, blunder rate, the test part-use. An alternative path is to utilize
and depend on the techniques for Random Subspace the Out of Bag (OOB) blunder assess. Since irregular
pardoning boosting, Randomizing Outputs, and Bagging [25]. backwoods calculation figures the OOB mistake amid the
The calculation of random forest is truly outstanding among preparation stage, we don't have to part the preparation
information.
characterization calculations - ready to order a lot of
3.4.2 SVM:
information with precision. It is an outfit learning technique It is an assessable grouping approach and depends
for characterization and relapse that builds various tree choice on the boost of edge among the occasions also the hyper-plane
at preparing period and conveys the class that is the method of partition. The technique observed as the best content
the programs yield through singular trees. arrangement of performance. It is said to be a
non-probabilistic paired direct classifier, which can straightly
Algorithm: 2 isolate the classes by a substantial edge, it winds up a standout
amongst the most intense classifier equipped for taking care
of limitless dimensional component vectors.
SVM is a coordinated machine learning computation
which can be used for both backslide tasks and gathering.
Regardless, it is, for the most part, utilized as a few portrayal
issues. In this check, we plot every datum thing in
n-dimensional space point with the estimation of each
segment being the estimation of
a specific mastermind.
Retrieval Number L37631081219/2019©BEIESP Published By:
DOI: 10.35940/ijitee.L3763.1081219 Blue Eyes Intelligence Engineering
275 & Sciences Publication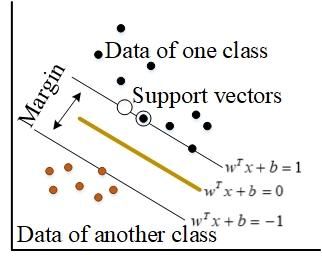
An Adaptive Whale Optimization Algorithm Guided Smart City Big Data Feature Identification for Fair
Resource Utilization
By at that point, we execute assembling through wT xi b 1 (15)
discovery the hyper-plane and that distinctive the double
The hyperplane mathematical formation indicated below:
classes to an incredible degree well.
It has demonstrated effective in characterizing f x sgn wT x b
supposition archives, including style. The guideline for help (16)
vector machine calculation is to tackle arrangement and Where, sign function is indicated as sgn (), which is
relapse issues. It has connected to numerous fields. SVMs scientifically characterized through the equivalence, as shown
were produced in the 1990s given the hypothetical below [31]:
contemplations of Vladimir Vapnik on the advancement of a
measurable hypothesis learning is said to be 1 if X 0
Vapnik-Chervonenkis hypothesis. SVMs were immediately sgn X 0 if X 0 (17)
received aimed at their capacity to work through vast 1 if X 0
information, the modest hyper constraints number, their
hypothetical certifications, also their great outcomes by and The following condition gives the separation D. It is from the
by. hyperplane to the point is spoken to scientifically:
A linear classifier is measured to make the SVM is less wT x b
demanding for twofold arrangement issue with highlights x D (18)
and y names. y 1,1 is used to designate the constraints w
w, b and class labels:
f ( x) wT x b (13)
where,
The normal to the line denoted as w. Bias displayed by b.
It is spoken to via an isolating the hyperplane of f (x)
in the sense of geometrically separates the information space
into two assorted districts subsequently bringing about the
grouping of the info information space into two classifications
[28]:
Fig 3.7: Support Vector Machines Hyperplane
The margin is displayed by:
W T X X
. X X
W (19)
W W
1 b 1 b
W T
W W 2
T T
(20)
W W
Fig 3.6: Separating the Hyperplane f(x) Many hyperplanes use in this optimization, and these
The capacity f(x) means that the isolation of hyperplanes have split the data into two regions. But the
hyperplane in two locales also encourages in a grouping of the hyperplane is selected vu the SVM, in the two regions the
informational index. Hyperplane creates two locales hyperplane is the extreme distance from the nearby data
symmetrically and compares to two classifications of points. But few hyperplanes are there, and that should fulfill
information underneath two class names. An information this condition. Finally, the accurate classification results are
point "a" has a place with both of the area relying upon the provided the SVM by ensuring that criterion [32].
estimation of f (a). On the off chance that f (a) > 0 it has a The means took after while utilizing SVM in
place with one district and if f (a) < 0 it has a place with arranging information are specified in the beneath algorithm:
another region.
Accept that the information comprises of n Algorithm: 3
information vectors where every datum vector is spoken to by
xi ∈ Rn, where i=1, 2… n. Class is given, and a chance to mark
that should exist allocated to the information directions to
execute managed order stay signified using yi, which is +1
aimed at information vectors of one classification and -1
aimed at the further classification of information vectors. By
using hyperplane, the informational collection can be
geometrically isolated. Subsequently, the hyperplane is
spoken to by a line it can likewise be scientifically spoken to
the following eqn[29]:
wT xi b 1 (14)
Published By:
Retrieval Number L37631081219/2019©BEIESP Blue Eyes Intelligence Engineering
DOI: 10.35940/ijitee.L3763.1081219
276 & Sciences PublicationInternational Journal of Innovative Technology and Exploring Engineering (IJITEE)
ISSN: 2278-3075, Volume-8, Issue-12, October 2019
I/P: I: Given data
Healthy Medium
O/P: V: Maintenance vectors set
Healthy
Start
Separate the given data set into two sets of data items Healthy Unhealthy
To support the vector set, V then add them
The divided n data items are then loop
If a data element is not allocated to any of the Medium Healthy
class labels means then add that to set V. Healthy
If inadequate data substances are created then Medium Medium
break Healthy Healthy
end the loop
Train and test using the SVM classifier Medium Unhealthy
End Healthy
Unhealthy Healthy
Fig 3.8: SVM Algorithm Unhealthy Medium
Healthy
IV. EXPERIMENTS RESULTS
Unhealthy Unhealthy
A. Dataset:
City Pulse of EU FP7 Assignment [33] includes a few SC
applications in light of IoT. Inside the extent of the pollution, As shown in table 4.3, evaluating the predicted
task, road traffic, climate, social, parking and library values and observed values of pollutant attentions together,
information was gathered starting the urban areas of Brasov the final alarm colors are labeled.
and Aarhus in Denmark and also Romania individually in the
vicinity of 2015 and 2013. In this investigation, CityPulse EU C. Performance Metrics:
FP7 pollution dataset Task is utilized to understand the novel The following well-known methods such as Precision,
framework. The dataset has eight features such as particulate Confusion Matrix (CM), False Negative Rate (FNR),
issue, ozone, sulfur dioxide, carbon monoxide, nitrogen Accuracy metrics, F1-Score, Specificity, False Positive Rate
dioxide, timestamp, longitude, and latitude utilized for (FPR) and G-mean are used to estimate the alarm color
exploring. Seventeen thousand five hundred sixty-eight matching performance of the novel prediction strategy.
examples are presented in the dataset and that are assembled Precision and Recall then showed as;
at five-minute intervals. Each test esteem set as standard of TP
EPA's AQI. In this examination, nitrogen dioxide and ozone Pr ecision (21)
toxins are chosen as expectation of air quality. TP FP
B. Thresholds: TP
In this part, by considering the AQI (Air Quality Index) Re call (22)
critical level (100), its levels are separated into three. Based TP FN
TN
on the alarm color, the threshold values are defined, and it is
Specificity (23)
described in the below table. FP TN
Table 4.1: Threshold value for AQI
FP
Index value Level
Alarm FPR (24)
Colour FP TN
FN
0 - 50 Healthy Green FNR (25)
FN TP
51 – 100 Medium Healthy Yellow
TP TN
Accuracy (26)
101 - 500 Unhealthy Red TP TN FP FN
TP
According to these threshold values, the test datasets Sensitivity (27)
of nitrogen dioxide and ozone are independently labeled as TP FN
Healthy, Medium Healthy, and Unhealthy. And it is
enumerated in table 4.2. G mean Sensitivit y precision (28)
Table 4.2: The Alarm based Decision Table The precision and recall harmonic mean is said to be
a combine measure between recall and precision, the balanced
Ozone Nitrogen Alarm F-score or traditional F-measure:
Dioxide based
Colour
Healthy Healthy
Retrieval Number L37631081219/2019©BEIESP Published By:
DOI: 10.35940/ijitee.L3763.1081219 Blue Eyes Intelligence Engineering
277 & Sciences PublicationAn Adaptive Whale Optimization Algorithm Guided Smart City Big Data Feature Identification for Fair
Resource Utilization
Pr ecision recall threshold values. Table 4.1 gives the threshold values, and
F Score 2 (29) table 4.2 gives the decision values.
Pr ecision recall Next, Table 4.3 represents the performance metrics values
Where, True Negative is indicated by TN, True Positive is of the Precision, False Negative Rate, G-Mean, False Positive
indicated by TP, False Negative is represented by FN and Rate, Recall, F1-Score, specificity and Accuracy metrics
False Positive is denoted as FP. based on the existing methods HMM-SVM, ANN, and KNN.
D. Results Analysis:
Here the outcomes of double air pollutant concentrations
and assessment of air quality prediction model are introduced.
To appraise that prediction performance from several
perspectives, we used Precision, False Negative Rate,
G-Mean, False Positive Rate, F1-Score, Recall, Accuracy
metrics, and Specificity.
In terms of error criteria, the proposed strategy gives a
significant development. Precision, Confusion Matrix (CM),
F1-Score, and Recall values are obtained according to the
results from the arrangement and which is prepared by using
Table 4.3: Evaluation of Performance Metrics
Methods Precision Recall Specificity FPR FNR F1-measure G-mean Accuracy
Proposed 0.94 0.95 0.92 0.57 0.15 0.941 0.943 0.978
HMM-SV 0.92 0.9 0.9 0.5 0.23 0.92 0.91 0.96
M
ANN 0.84 0.81 0.86 0.45 0.65 0.55 0.82 0.85
KNN 0.74 0.79 0.79 0.49 0.61 0.81 0.76 0.81
Table 4.4: Pollution Level Ranking of Cities
POLLUTION LEVEL
CITIES
RANKING
1 9
2 3
3 10
4 2
5 1
6 4
7 8
8 7
9 5 Fig 4.1: Performance of Specificity
10 6 Fig 4.2 and Fig 4.3 gives the graphical representation of the
recall and precision performance. It has high values rather
Table 4.4 gives the pollution level ranking of cities. than the HMM-SVM, ANN and KNN
Here, the ranking of the cities is evaluated by computing the
pollution rates between the pollutants ozone and nitrogen
dioxide. According to the air quality index, the health concern
level calculated, and the alarm is predicted the color. The
cities ranked by using this alarm. Based on the unhealthy
cities are ranked. Let us consider ten cities, among that we
find out the hazard level of each city. According to the
hazardous level of the city, the lowest level is said to be rank
1, further levels are mentioned as rank 2, rank 3…etc. The
graphical representing the ranking of cities is shown in fig 4.9.
The following figures are the performance analysis of the
special matrices.
The performance analysis of graphical representation is
shown in Fig 4.1. It represented the proposed method has
good specificity performance compared to other existing
methods HMM-SVM, ANN, KNN.
Fig 4.2: Recall Performance
Published By:
Retrieval Number L37631081219/2019©BEIESP Blue Eyes Intelligence Engineering
DOI: 10.35940/ijitee.L3763.1081219
278 & Sciences PublicationInternational Journal of Innovative Technology and Exploring Engineering (IJITEE)
ISSN: 2278-3075, Volume-8, Issue-12, October 2019
Fig 4.3: Precision Performance
Fig 4.6: G-mean Performance
Fig 4.4: FPR Performance
Fig 4.7: F1-measure Performance
Fig 4.6 and 4.7 shows the graphical representation of
the performance of G-mean and F1-measure. By seeing this
representation, our proposed method has a high-performance
value.
Fig 4.5: FNR Performance
Fig 4.4 and fig 4.5 represents the false positive and
negative rate performance. When compared to the existing
approaches such as HMM-SVM, ANN, and KNN, our
proposed method has good performance rate.
Fig 4.8: Performance of Accuracy
Retrieval Number L37631081219/2019©BEIESP Published By:
DOI: 10.35940/ijitee.L3763.1081219 Blue Eyes Intelligence Engineering
279 & Sciences PublicationAn Adaptive Whale Optimization Algorithm Guided Smart City Big Data Feature Identification for Fair
Resource Utilization
Fig 4.8 represents the performance accuracy graphical 6. Chen, Min, Shiwen Mao, and Yunhao Liu, "Big data: A survey,"
Mobile Networks and Applications, Vol. 19, No. 2, pp. 171-209, 2014.
representation. Accuracy of the proposed method is high 7. Gubbi, Jayavardhana, Rajkumar Buyya, Slaven Marusic, and
compared to existing methods such as HMM-SVM, ANN, Marimuthu Palaniswami, "Internet of Things (IoT): A vision,
architectural elements, and future directions," Future generation
and KNN. computer systems, Vol. 29, No. 7, pp. 1645-1660, 2013.
8. Hashem, Ibrahim Abaker Targio, Victor Chang, Nor Badrul Anuar,
Kayode Adewole, Ibrar Yaqoob, Abdullah Gani, Ejaz Ahmed, and
Haruna Chiroma, "The role of big data in the smart city," International
Journal of Information Management, Vol. 36, No. 5, pp. 748-758,
2016.
9. Al Nuaimi, Eiman, Hind Al Neyadi, Nader Mohamed, and Jameela
Al-Jaroodi, "Applications of big data to smart cities," Journal of
Internet Services and Applications, Vol. 6, No. 1, pp. 25, 2015.
10. Kambatla, Karthik, Giorgos Kollias, Vipin Kumar, and Ananth Grama,
"Trends in big data analytics," Journal of Parallel and Distributed
Computing, Vol. 74, No. 7, pp. 2561-2573, 2014.
11. Vilajosana, Ignasi, Jordi Llosa, Borja Martinez, Marc Domingo-Prieto,
Albert Angles, and Xavier Vilajosana, "Bootstrapping smart cities
through a self-sustainable model based on big data flows," IEEE
Communications Magazine, Vol. 51, No. 6, pp. 128-134, 2013.
12. Yang, Jieming, Yuanning Liu, Xiaodong Zhu, Zhen Liu, and Xiaoxu
Fig 4.9: Ranking Level of Different Cities Zhang, "A new feature selection based on comprehensive measurement
both in inter-category and intra-category for text categorization,"
Fig 4.9 gives the graphical representation of Information Processing & Management, Vol. 48, No. 4, pp. 741-754,
different cities. In which, the city having the lowest hazardous 2012.
13. Miorandi, Daniele, Sabrina Sicari, Francesco De Pellegrini, and Imrich
level marked as rank 1. City 5 having rank one position that is Chlamtac, "Internet of things: Vision, applications and research
hazardous level is low. challenges," Ad Hoc Networks, Vol. 10, No. 7, pp. 1497-1516, 2012.
14. Liu M, Lu X, Song J, “A New Feature Selection Method for Text
Categorization of Customer Reviews,” Communications in
V. CONCLUSION Statistics-Simulation and Computation, Vol.45,
No.4,pp.1397-409,2016.
Smart cities have the most indispensable part in 15. Yang J, Liu Y, Zhu X, Liu Z, Zhang X, “A new feature selection based
altering distinctive regions of human life, touching segments on comprehensive measurement both in inter-category and
intra-category for text categorization,” Information Processing and
like transportation, wellbeing, vitality, and instruction. Big
Management, Vol.48, No.4,pp.741-754,2012.
data smart cities fair resource utilization is the main goal of 16. Wang Y, Wang J, Liao H, Chen H, “An efficient semi-supervised
this method. In this method, Whale optimization is used to get representatives feature selection algorithm based on information
theory,” Pattern Recognition, Vol.61,pp.511-523,2017.
the optimal resource set, and the whale optimization method 17. Abualigah LM, Khader AT, “Unsupervised text feature selection
is performed based on the wrapper method. From the City technique based on hybrid particle swarm optimization algorithm with
genetic operators for the text clustering,” The Journal of
pulse dataset, air pollution datasets are utilized for the Supercomputing, pp.1-23, 2017.
performance analysis. Finally, the regression model Random 18. Lin KC, Zhang KY, Huang YH, Hung JC, Yen N. Feature selection
based on an improved cat swarm optimization algorithm for big data
Forest with Support Vector Machine (RF-SVM) classifier is
classification. The Journal of Supercomputing. 2016 Aug 1;
developed to get the performance analysis. The novel 72(8):3210-21.
approach is implemented in the MATLAB platform the 19. Tabakhi S, Moradi P, Akhlaghian F. An unsupervised feature selection
algorithm based on ant colony optimization. Engineering Applications
enactment is evaluated based on the identified subset of of Artificial Intelligence. 2014 Jun 30; 32:112-23.
features leads to optimal resource utilization and obtained 20. Fong S, Wong R, Vasilakos AV. Accelerated PSO swarm search
feature selection for data stream mining big data. IEEE transactions on
results compared to earlier wrapper model-based algorithm. services computing. 2016 Jan 1; 9(1):33-45.
Our proposed method has a good performance compared to 21. Mafarja, Majdi, and Seyedali Mirjalili. "Whale optimization
approaches for wrapper feature selection." Applied Soft Computing 62
the other existing methods, and the cities are ranked based on
(2018): 441-453.
the hazardous level of pollution. 22. Zambia, Hossam M., Eid Emary, Aboul Ella Hassanien, and Bazil
Parv. "A wrapper approach for feature selection based on swarm
optimization algorithm inspired by the behavior of social-spiders." In
REFERENCES Soft Computing and Pattern Recognition (SoCPaR), 2015 7th
1. Sta, Hatem Ben, "Quality and the efficiency of data in “Smart-Cities,” International Conference of, pp. 25-30. IEEE, 2015.
Future Generation Computer Systems, Vol. 74, pp. 409-416, 2017. 23. M. Seyedali and A. Lewis, “The Whale Optimization Algorithm,” Adv.
2. Lazaro, George Cristian, and Mariacristina Rosica, "Definition Eng. Soft. vol. 95, pp. 51-67, 2016.
methodology for the smart cities model," Energy, Vol. 47, No. 1, pp. 24. Al Amrani, Yassine, Mohamed Lazaar, and Kamal Eddine El Kadiri.
326-332, 2012. "Random Forest and Support Vector Machine based Hybrid Approach
3. Rodríguez-Mazahua, Lisbeth, Cristian-Aarón Rodríguez-Enríquez, to Sentiment Analysis." Procedia Computer Science 127 (2018):
José Luis Sánchez-Cervantes, Jair Cervantes, Jorge Luis 511-520.
García-Alcaraz, and Giner Alor-Hernández, "A general perspective of 25. Gender, Robin. "Forêts aléatoires: aspects théoriques, sélection de
Big Data: applications, tools, challenges and trends," The Journal of variables et applications." Ph.D. diss., Université Paris Sud-Paris XI,
Supercomputing, Vol. 72, No. 8, pp. 3073-3113, 2016. 2010.
4. Zanella, Andrea, Nicola Bui, Angelo Castellani, Lorenzo Vangelista,
and Michele Zorzi, "Internet of things for smart cities," IEEE Internet
of Things Journal, Vol. 1, No. 1, pp. 22-32, 2014.
5. Bhosale, Amar S. "Critical and Comparative Study of Indian Tv
Industry With Special Reference To Channel Trp." (2017).
Published By:
Retrieval Number L37631081219/2019©BEIESP Blue Eyes Intelligence Engineering
DOI: 10.35940/ijitee.L3763.1081219
280 & Sciences PublicationInternational Journal of Innovative Technology and Exploring Engineering (IJITEE)
ISSN: 2278-3075, Volume-8, Issue-12, October 2019
26. V.F. Rodríguez-Galiano, F.Abarca-Hernández, B. Ghimire, M.
Chica-Olmo, P.M.Akinson, C. Jeganathan, “Incorporating Spatial
Variability Measures in Land-cover Classification using Random
Forests, ” Procedia Environmental Sciences, vol. 3, pp. 44-49, 2011.
27. Reda M. Elbasiony, Elsayed A.Sallam, Tarek E. Eltobely, Mahmoud
M. Fahmy, “A hybrid network intrusion detection framework based on
random forests and weighted k-means, ” An in Shams Engineering
Journal, Available online 7 Mar. 2013.
28. Al-Amrani, Yassine, Mohamed Lazaar, and Kamal Eddine Elkadiri.
"Sentiment Analysis using supervised classification algorithms." In
Proceedings of the 2nd International Conference on Big Data, Cloud
and Applications, p. 61. ACM, 2017.
29. Chun-Xia Zhang, Jiang-She Zhang, Gai-Ying Zhang, “An efficient
modified boosting method for solving classification problems,”
Journal of Computational and Applied Mathematics, vol. 214, issue 2,
1 May 2008, pp. 381-392.
30. Xinjun Peng, Yifei Wang, Dong Xu, “Structural twin
parametric-margin support vector machine for binary classification,
Knowledge-Based Systems,” vol. 49, Sept. 2013, pp. 63-72.
31. J. T. Lalis, “A New Multiclass Classification Method for Objects with
Geometric Attributes Using Simple Linear Regression,” IAENG
International Journal of Computer Science, vol. 43, no. 2, pp.198–203,
2016.
32. Hsun-Jung Cho, Ming-Tseng, “A support vector machine approach to
CMOS-based radar signal processing for vehicle classification and
speed estimation,” Mathematical and Computer Modelling, vol. 58,
issues 1–2, Jul. 2013, pp. 438- 448.
33. T. C. Consortium, "CityPulse Annual Report," The CityPulse
Consortium2016.
34. S. Tayal, N. Nagwal, and K. Sharma, “Role of big data in make in
India,” in Advances in Intelligent Systems and Computing, 2018, vol.
564, pp. 431–437.
35. K. Sharma and S. Tayal, “Indian Smart City Ranking Model,” Int. J.
Recent Technol. Eng. ISSN2277-3878, vol. 8, no. 2, pp. 4820–4832,
2019.
36. S. Tayal, S. K. Goel, and K. Sharma, “A comparative study of various
text mining techniques,” in 2015 International Conference on
Computing for Sustainable Global Development, INDIACom 2015,
2015, vol. 11, no. 5, pp. 76–81.
37. R. Garg, R. K. Sharma, and K. Sharma, “Ranking and selection of
commercial off-the-shelf using fuzzy distance-based approach,” Decis.
Sci. Lett., vol. 5, no. 2, pp. 201–210, 2016.
38. K. Sharma, R. Garg, C. K. Nagpal, and R. K. Garg, “Selection of
optimal software reliability growth models using a distance-based
approach,” IEEE Trans. Reliab., vol. 59, no. 2, pp. 266–276, 2010.
39. S. Tayal and K. Sharma, “The Recommender Systems Model for Smart
Cities,” Int. J. Recent Technol. Eng., vol. 8, no. 2S7, pp. 451–456,
2019.
AUTHORS PROFILE
*Kapil Sharma has completed his Doctors Degree in
Computer Science and Engineering under the Faculty of
Engineering and Technology at the M. D. University,
Rohtak (Haryana), India in 2011. he has worked as a
Faculty of the Department of Information Technology at
Guru Premsukh Memorial College of Engineering,
Budhpur, Delhi, India. Presently, he is working as Professor and Head of
Information Technology Department at Delhi Technological University
(DTU), Delhi,.
Sandeep Tayal is Pursuing a Doctorate Degree in
Information Technology under the Department of
Information Technology at Delhi Technological
University (DTU), Delhi, India. Presently, he is working
as an Assistant Professor in the Department of Computer
Science and Engineering at Maharaja Agrasen Institute of Technology,
Rohini Sector- 22, Delhi, India
Retrieval Number L37631081219/2019©BEIESP Published By:
DOI: 10.35940/ijitee.L3763.1081219 Blue Eyes Intelligence Engineering
281 & Sciences PublicationYou can also read