A Virtual Reality-based Training and Assessment System for Bridge Inspectors with an Assitant Drone
←
→
Page content transcription
If your browser does not render page correctly, please read the page content below
A Virtual Reality-based Training and Assessment System for
                                                 Bridge Inspectors with an Assitant Drone
                                                                                                                                 ∗
                                                                                                                                 †
                                                               Yu Li, Muhammad Monjurul Karim, Ruwen Qin
arXiv:2109.02705v1 [cs.RO] 6 Sep 2021

                                        1     Abstract
                                        Over 600,000 bridges in the U.S. must be inspected every two years to identify flaws, defects, or
                                        potential problems that may need follow-up maintenance. An aerial robotic technology, Unmanned
                                        Aerial Vehicles (drones), has been adopted for bridge inspection for improving safety, efficiency,
                                        and cost-effectiveness. Although drones have an autonomous operation mode, keeping inspectors
                                        in the loop is still necessary for complex tasks like bridge inspection. Therefore, inspectors need to
                                        develop the skill and confidence in operating drones in their jobs. This paper presents the design
                                        and development of a virtual reality-based system for training inspectors who are assisted by a drone
                                        in the bridge inspection. The system is composed of four integrated modules: a simulated bridge
                                        inspection developed in Unity, an interface that allows a trainee to operate the drone in simulation
                                        using a remote controller, monitoring and analysis that analyzes data to provide real-time, in-
                                        task feedback to trainees to assist their learning, and a post-study assessment for accelerating
                                        the learning of trainees. The paper also conducts a small-size experimental study to illustrate the
                                        functionality of this system and its helpfulness for establishing the inspector-drone partnership. The
                                        developed system has built a modeling and analysis foundation for exploring advanced solutions to
                                        human-drone cooperative inspection and human sensor-based human-drone interaction.

                                        Keywords: Virtual Reality, Infrastructure Inspection, Unmanned Aerial Vehicle, Training, Perfor-
                                        mance Assessment, Sensing, Human-in-the-loop

                                        2     Introduction
                                        The U.S. Highway Bridge Inventory has approximately 617,000 bridges. 42% of them are over
                                        50-years old, and 7.5% are structurally deficient [3]. To avoid catastrophic incidents, all bridges are
                                        required to be inspected every two years for identifying flaws, defects, or potential problems that
                                        may need a follow-up maintenance. Traditional bridge inspection may require closing the traffic and
                                        the use of heavy equipment such as a snooper truck. Inspecting a bridge needs a crew of inspectors
                                           ∗ Y. Li, M.M. Karim, R. Qin are with the Department of Civil Engineering, Stony Brook University, Stony Brook,

                                        NY, 11794, USA.
                                           † Corresponding author, ruwen.qin@stonybrook.edu, 2424 Computer Science Building, Stony Brook University,

                                        Stony Brook, NY 11794-4424

                                                                                               1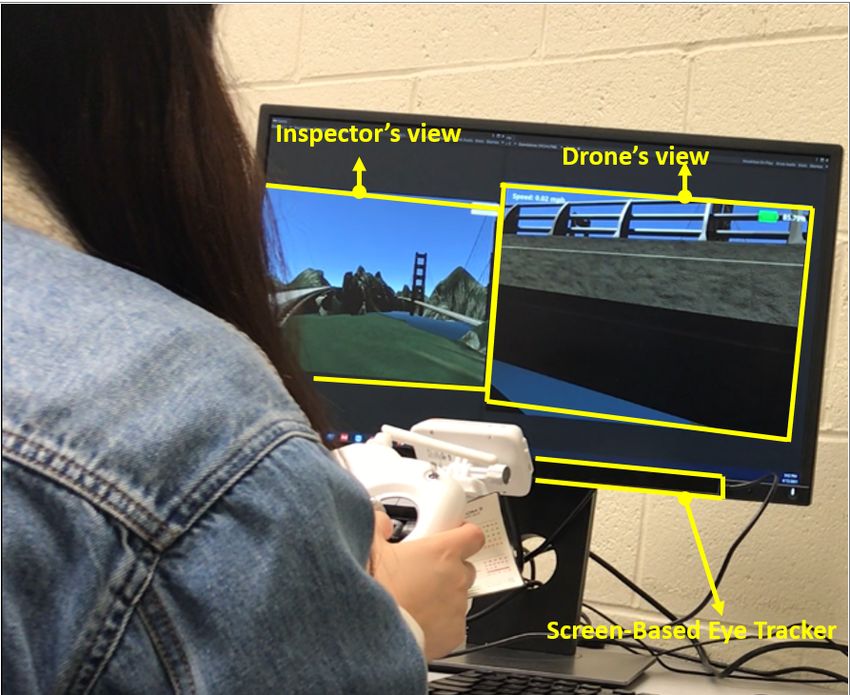
working at the site for many hours. Some field operations are dangerous, such as climbing up to
high bridge columns.
    To make bridge inspection safer, faster, and cheaper, an aerial robotic technology, Unmanned
Aerial Vehicles or drones, has been adopted for use. A drone can conveniently access various
locations of a bridge to capture a large amount of inspection data efficiently using sensors that it
carries, such as a camera. Then, inspectors can stay in a safe location to analyze the inspection
data. The use of drones for data collection also minimizes the traffic closure and the use of heavy,
expensive equipment. A survey conducted by the American Association of State Highway and
Transportation Officials (AASHTO) shows that using drones for bridge inspection can reduce the
cost by 74% [1]. Besides bridges, other low-accessible infrastructures have also been adopting drones
for inspection, such as dams and penstocks [23], transmission lines [14], and railways [4].
    Current studies on the bridge inspection with an assistant drone mainly focus on the drone
technology (e.g., [19]) and data analysis using image processing and computer vision (e.g., [12]).
The human factors aspect is largely ignored. The use of drones in bridge inspection is not to
eliminate humans [11]. Instead, drones and inspectors must form a cooperative team to enhance
inspection safety, efficiency, and effectiveness. To inspectors, collaborating with drones in bridge
inspection is a complex activity wherein human factors significantly contribute to its success [8].
Although drones have an autonomous operation mode, a ground operating crew needs to monitor
the operation and the bridge condition dynamically. In response to an alarming situation or a
suddenly emerging need, an inspector has to adjust the autonomous level of the drone, including
disengaging it from the autonomous mode and taking control of it [13]. Keeping human-in-the-loop
is necessary for bridge inspection with a drone.
    Training is essential to help inspectors gain the skill and confidence in inspecting bridges with an
assistant drone. Drones specialized for bridge inspection are usually more expensive than those for
entertainment, and crashes into the traffic will cause severe consequences. Therefore, the tolerance
to drone crashes is low. Like aviation training systems or driving simulators, simulation-based
training and assessment of inspector-drone cooperation is a cost-effective way to meet the need. A
virtual reality (VR) environment can provide simulated scenes and tasks similar to the real-world
inspection. VR-based training systems have been developed for civil engineers in pipe maintenance
[26], bridge construction process [25], and bridge crane operation [6]. Some commercial drone
flight simulations have been developed. For example, AeroSim Drone Simulator [2] offers training
scenarios of inspecting wind turbines, power lines, towers, and solar panels. Moud et al. [20]
also developed a first-ever drone flight simulator for construction sites. To our best knowledge, no
simulator has been developed for inspector-drone cooperative bridge inspection, nor a data-driven
framework for assessing the training performance of bridge inspectors.
    A simulator for training bridge inspectors to operate a drone in their jobs is needed. Some unique
features of bridge inspection differentiate it from other types of inspection, such as the traffic passing
the bridge, complex and diverse structures, narrow irregular spaces between structural elements
such as diaphragms, interlayers to name a few. Moreover, factors that may impact the bridge
inspection with an assistant drone are broad, including job site-related, drone-related, job-related,
and human-related factors. While some factors are commonly considered by drone simulators, such
as the wind speed and direction, battery level, and task difficulty level (e.g., [8, 2, 20, 24]), those
are not sufficient for characterizing the drone assisted bridge inspection. Skills and confidence
developed from simulators for inspecting other types of infrastructure are not transferred to bridge
inspection.
    Monitoring and assessing training performance in a data-driven approach are beneficial. Feed-

                                                    2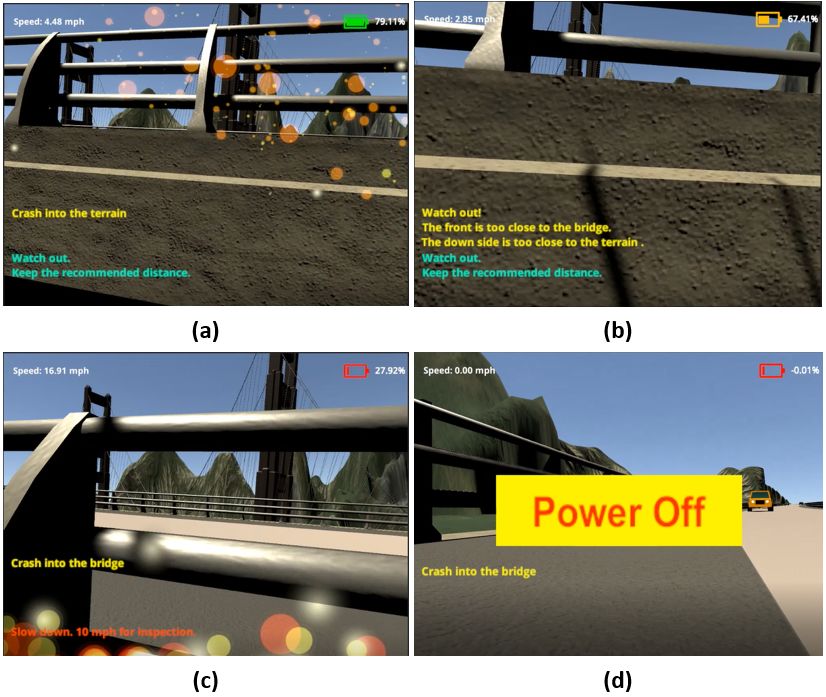
back to inspectors, both in-training and post-training, help accelerate their learning processes.
Effective feedback to an inspector should be built on measurements of the inspector’s tasks per-
formance and human states (e.g., cognitive load, physical load, emotion, and other psychological
states). The measurements are from multiple dimensions, include time, quality, productivity, safety,
cost to list several. While task performance measurements have studied widely in operations man-
agement [22], many metrics are output-based such as the time of completion and productivity, not
applicable to providing in-task feedback. Subjective evaluation of task performance and human
states can be performed by the subject herself/himself, by peers, or by one or a group of evalua-
tors. Subjective judgement lacks reliability, timeliness, and accuracy. Despite of these limitations,
subjective evaluation is still commonly used due to the low cost and the ease to implement. NASA
Task Load Index (NASA-TLX) [10] is a questionnaire commonly used by pilots for reporting their
physical demand, time pressure, effort, performance, mental demand, and frustration level [7, 8].
A data-driven approach to training performance monitoring and assessment would address the
limitations of existing methods by supplementing them.
This paper presents the design and development of a training and assessment system for bridge
Inspection with an assistant drone (TASBID). Filling gaps in the literature, contributions of this
paper are threefold:
• A factorial framework for creating a VR-based bridge inspection simulator, which allows the
inspector to operate a drone in a virtual inspection using a remote controller;
• A data-driven approach to providing real-time, in-task feedback, which is achieved through
monitoring and analyzing the inspector’s operation;
• A comprehensive post-study assessment of inspectors’ task performance for learning acceler-
ation.
The source code of the system is publicly available for download at Github [15].
The remainder of this paper is organized as the following. The next section presents the proposed
TASBID. Section 4 exhibits the functionality of the system with the data collected from a small
group of participants. In the end, Section 5 concludes the study and summarizes directions of future
work.
3 The Training and Assessment System
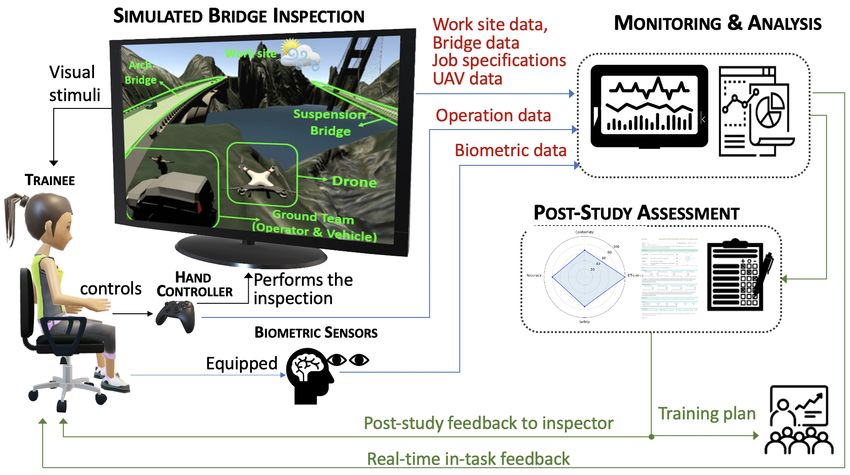
The architecture of the training and assessment system for bridge inspection with an assistant drone
(TASBID) is illustrated in Figure 1. The system is designed to consist of four modules: bridge
inspection simulation, interfaces that allows the bridge inspector (the trainee) to interact with the
drone in the simulated inspection, monitoring & data analysis, and post-study assessment. The
inspector, may be equipped with biometric sensors, operates the drone in the simulated inspection
using a remote controller. Streaming data of the inspector and the drone are monitored to provide
real-time in-task feedback to the inspector. The data on job specifications, the bridge, and the site
are references for monitoring and analysis. Upon completing a simulation study, a comprehensive
assessment based on the collected data is performed to provide the post-study feedback to the
trainee and the management. Below is a discussion of the four modules in detail.
3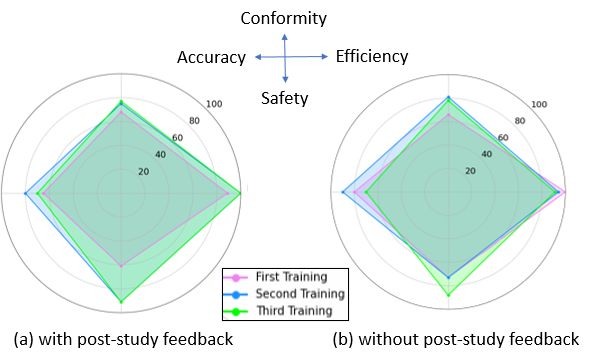
Figure 1: Architecture of the training and assessment system for bridge inspection with an assistant
drone (TASBID)

                                                 4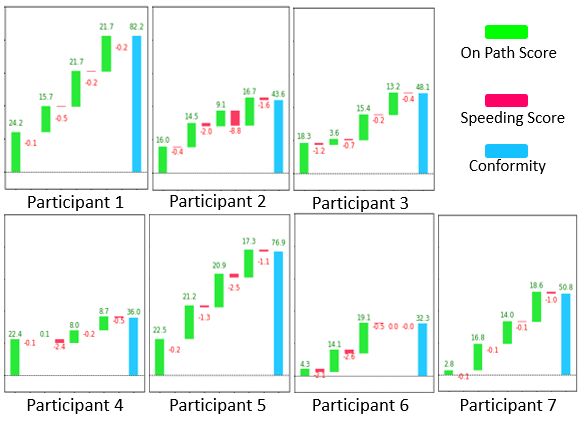
3.1     Simulated Bridge Inspection
The inspection simulation created in Unity is illustrated in Figure 1. The simulation provides the
visual stimulus of bridge inspection with an assistant drone for the inspector. To assure that it is
close to the real-world work context, the simulation is designed to include five major elements of
bridge inspection: the ground team, the drone, bridges, the job site, and example tasks.

3.1.1   The Ground Team
The ground team in the simulation comprises an inspector (the virtual counterpart of the trainee)
and a truck. The simulation defines the location of the ground team where the drone takes off
and returns to. The simulation provides two views to the trainee. The first one is the view of the
inspector in the simulation. The second one is the camera’s view that is moving along with the
drone. The trainee uses these two views alternatively, depending on the stage of the inspection.
For example, the inspector’s view can be useful during taking-off and landing. The camera’s view
is what the trainee would concentrate on during the inspection and the navigation.

3.1.2   The Drone
The simulation adopts a drone simulation model from a Unity drone controller asset [9] and revises
it for the bridge inspection. Parameters for modeling the drone include the drone model, mass and
load, movement force, maximum forward speed, maximum side-ward speed, rotation speed, slow-
down time, movement sound, the propellers’ rotation, battery capacity, and movement types. In
this simulation, eight types of movement are sufficient for the bridge inspection. They are forward
& backward, right sideward & left sideward, up & down, and right rotation & left rotation. The
trainee controls the movement of the drone and the speed using the remote controller. The battery
level is a dynamic constraint for the drone operation, which drops gradually during the inspection.
This simulation does not include the return to home function that can bring the drone to the home
point when the battery level drops to a pre-specified level. Instead, the battery level is displayed
for examining the trainee’s time stress.

3.1.3   Bridges
The simulation uses Road Architect [5] to create the bridge models, wherein multiple types of bridges
are available for choice and redesign. The simulation includes an arch bridge and a suspension
bridge to provide trainees with different experiences in training. For example, the arch bridge in
the simulation has cramped spaces where the drone manipulation is challenging to the trainee.
Road Architect defines the structural elements of the bridges. Accordingly, the spatial-temporal
relationship between the drone and specific bridge elements during the simulated inspection can be
determined. Defects such as cracks are added to the surface of some bridge elements, to assess the
trainee’s ability to recognize defects during the inspection.

3.1.4   The Job Site
Simulation of the bridge inspection site focuses on creating the geographic context, the environ-
mental condition, and the traffic condition at the bridges. Bridges to be inspected sit on a lake
in a mountain area. Bridge inspection needs to be conducted in the daytime with a clear weather
although a sudden change in the weather may occur in rare cases. Therefore, only wind under level

                                                 5
five of the Beaufort Wind Scale has been considered as a possible weather impact in the system.
The wind factor is simulated by adding the force value and direction in Unity. Since most com-
mercial drones can be flown in the wind between 10 and 30 mph, TASBID considers three levels
of wind: light, gentle, and medium. They correspond to the wind speed around 2mph, 11mph and
22mph, and cause the force of 0.12N, 3N and 12N, respectively. A three-dimensional vector can set
up the wind direction. Light condition is another common impact factor for the inspection. Some
dim areas of bridges, such as the bridge bottom, are present although the natural light condition
is good. TASBID is designed to include tasks to inspect dim areas of bridges. The drone in the
simulation is equipped with a light. Trainees can turn it on or off according to their needs by
pressing the key “B” on the keyboard. Traffic volume is considered as well because inspectors may
feel pressure when flying the drone near the traffic. Vehicles moving on the bridges are included in
TASBID using a free traffic simulation asset [18]. The total number of vehicles can be increased or
decreased corresponding to the design of experiments.
3.1.5 Inspection Tasks
Tasks of the simulated inspection are designed based on the specific goal of training. TASBID
includes four tasks that differ in the flight paths, the space for the drone, and the light condition,
and the requirement.
• Task 1 is to inspect the slab of the arch bridge from one side. The flying path is a straight
line, and the open space for the drone is ample. The trainee is expected to keep the drone
1∼2 meter away from the bridge in task 1 and also in tasks 2 and 3 below.
• Task 2 is to inspect the bottom of the arch bridge. Different from task 1, task 2 has a curved
flying path and the light condition under the bridge is darker.
• Task 3 is about inspecting the cramped interlayer area. Compared to tasks 1 and 2, task 3
has a very short flying path and a limited space for the drone, and the drone requires fine
adjustments to let the camera capture both the upper side and the down side of the interlayer
area.
• Task 4 is about harvesting the monitoring data captured by sensing devices placed under the
water near a pier of the suspension bridge. The trainee is expected to fly the drone around
the pier in a lap. The trainee should keep the drone 5∼7 meters away from the pier and
around 3 meters above the water.
The recommended speed during the inspection is 10 mph. The recommended task sequence (tasks
1, 2, 3, and 4) is not mandatory. The inspector is expected to complete all the four tasks timely
and return to the ground station, especially before the drone is running out of power.
3.2 Interface between the Trainee and the Drone
The trainee manipulates the drone in the simulated inspection using a remote controller. TAS-
BID uses a Phantom 2 DJI controller for this purpose. The controller is connected to Unity, the
development environment for creating the simulation, using the vJoy device driver [21] and the
method in mDjiController [17]. The trainee adjust the joysticks of the controller to control the
drone movement and speed. The trainee’s data on operating the controller are recorded.
63.3 Monitoring & Analysis
TASBID can collect six types of data from the study, as Figure 1 illustrates. The workplace
characteristics, the bridge models, the drone model, and job specifications are pre-specified static
data that do not change during a study. The flight data of the drone and the trainee’s operation
data are the frame-level streaming data that vary in each time of the study. Although this paper
skips the discussion of biometric sensory data, TASBID has already integrated a screen-based eye
tracker and an EEG device to capture trainees’ eye and brain activities, respectively.
3.3.1 Streaming Data
A simulated inspection is captured by a sequence of N frames, indexed by i. Given the frame rate,
f , the total duration of an inspection is N/f . The starting frame of the inspection is defined as
the time when the drone is taking off. The ending frame corresponds to the time when the drone
lands near the ground team or it is not able to continue and finish the inspection (e.g., the battery
drains or the drone crashes into the traffic), whichever occurs the first. Let Oi and Di denote the
trainee’s operation data and the drone flight data, respectively, collected at any frame i.
The trainee operates the remote controller that has four-axis inputs for controlling the movement
of the drone. Besides, the trainee can use the key “B” on the keyboard to turn on/off the light
and “P” to take snapshots during the inspection. Therefore, the trainee’s operation data are time
series data in six dimensions:
Oi = [of b,i , orl,i , oud,i , ort,i , ob,i , op,i ] (1)
where
of b,i : Forward(+) & Backward(-),
orl,i : Right(+) & Left(-) Sideward,
oud,i : Up(+) & Down(-),
ort,i : Right(+) & Left(-) Rotation,
ob,i : Turning on(true) & off(false) the light,
op,i : Taking a snapshot (true) & no(false).
The drone flight data include the position, velocity, and the remaining batter level of the drone:
~ i , vi , bi ] = [lx,i , ly,i , lz,i , vi , bi ],
Di = [L (2)
~ i = (lx,i , ly,i , lz,i ) are the 3D coordinates of the drone’s location in the earth reference
where L
system, vi is the linear speed of drone, and bi is the remaining battery level in percentage.
3.3.2 Data Analysis
Following the job specifications and focusing on job entities (e.g., the drone and bridge elements to
inspection) contribute to good results from the inspection. Analysis of the collected data further
provides measurements that reveal if the trainee meets requirements in the inspection. A reference
path for each task is part of the job specifications, which is defined by a sequence of reference points
7Algorithm 1 On-path analysis for task t at any frame i
// {~pt,n |n = 1, . . . , Nt }: reference points that define the reference path for the drone in task t,
// ~ i : position of the drone in frame i,
L
// l(L~ i , p~t,n ): the distance between the drone and the reference point pt,n ,
// n∗ : the index of the reference point with the shortest distance to the drone,
// vt,n : the segment of the reference path, defined by p~t,n and its adjacent point(s),
// l(L~ i , vt,n ): the distance from the drone to any location on the segment vt,n ,
∗
// lt,i : the minimum distance from the drone to the reference path,
// lt : the threshold distance for identifying if the drone is on the reference path for task t,
// Xt,i : binary variable indicating whether the drone in frame i is on the reference path of task
t.
Step 1: find the reference point with the shortest distance to the drone, p~t,n∗ , where
~ i , p~t,n )|n = 1, . . . , Nt }.
n∗ := arg minn {l(L
Step 2: The shortest distance from the drone to the reference path is computed as:
∗
lt,i = min l(Li , vt,n∗ )
Step 3: Determine if the drone in frame i is on path:
Xt,i = 1{l∗ ≤ lt }
∗
Return (Xt,i , lt,i )
on the path. Let t be the index of tasks and n be the index of reference points. {~ pt,n |n = 1, . . . , Nt }
defines the reference flying path for the drone in task t. A speed limit, v, is also specified for the
drone in performing the inspection tasks.
On-path Analysis. Denote Xt,i as the binary variable indicating if the drone in frame i is on the
PT
reference path of task t, for t = 1, . . . , T and i = 1, . . . , N . t=1 Xt,i ≤ 1 for any i, indicating
the drone cannot be on more than one task simultaneously. Using Algorithm 1 below, the analysis
module evaluates if the drone is on the reference path for task t. Specifically, the algorithm uses
the reference path of task t and the location of the drone as inputs to determine the value of the
binary variable Xt,i . Using the output of the algorithm, the starting frame of task t, It,s , and the
ending frame, It,e , are determined accordingly. The analysis module treats the first frame when
Xt,i takes one as the starting frame for task t and the last frame when Xt,i takes one as the ending
frame:
It,s = min{i|Xt,i = true}
i
(3)
It,e = max{i|Xt,i = true}
i
Analysis of Speed Control. Similarly, a binary variable, Xs,i , is defined to indicate if the drone in
frame i is speeding when performing inspection tasks.
Xs,i = 1{vi > v̄, i ∈ ∪Tt=1 [It,s , It,e ]}. (4)
Crash Analysis. A crash in the simulation is defined as an event that the drone touches traffic
agents, the bridges, the terrain, or the waterbody. The simulation can sense types of objects the
drone crash into and track crash events. Xh,i is a binary variable indicating if the drone in frame i
8touches a human in the traffic. Xv,i is another binary variable indicating if the drone crashes into a
vehicle in the traffic. Xo,i is a categorical variable indicating if the drone touches any other objects.
A crash event may last for multiple frames. Therefore, whenever Xh,i turns from “false” to “true”,
the simulation identifies the occurrence of a crash into a human, indicated by a binary variable Xh :
Xh = 1{∃Xh,i = true}, (5)
and another binary variable Xv indicates if a crash into a vehicle happens:
Xv = 1{∃Xv,i = true}. (6)
Crashing into other objects will not terminate the study. At the end, the total number of crashes
into other objects will be
N
X
Xo = 1{Xo,i 6= false & Xo,i−1 = false}. (7)
i=2
Visual Detection Analysis. Experienced bridge inspectors should be sensitive to defects developed
on the surface such as cracks, spalling, corrosion to name a few. To test this hypothesis, the study
randomly places Xd surface defects on the bridges to inspect. The trainee takes a snapshot if she/he
believes a defect is found. The total number of snapshots is the count of times that the trainee
pushes the key “P”:
XN
Xpd = 1{op,i = true}. (8)
i=1
Some of the snapshots may be false detection. The number of true detection is Xtd .
3.3.3 Real-time, In-task Feedback
Using the monitoring data and measurements calculated from the data, real-time, in-task feedback
is provided to the trainee. TASBID is designed to provide five types of information, illustrated in
Figure 2, to raise the trainee’s attention to job safety and task specifications.
The remaining battery level in percentage of the battery capacity is updated in real-time and
displayed at the upper right corner of the camera view, as Figure 2 illustrates. The battery icon
is in green color when the remaining power is 70% or higher, yellow if between 30% and 70%, and
otherwise in red. The battery icon starts to flush once the remaining power drops below 30%. The
displayed battery level sets a time constraint to encourage the trainee to finish the task before
the drone running out of power. The drone’s speed is always displayed at the upper left corner of
the camera view. Three types of messages may appear at the bottom left when certain conditions
occur:
• A message about speeding will show up at the bottom left corner if Xs,i in Equation (4) is
one.
• A message to remind the recommended distance from the bridge elements will appear if
∗
Algorithm 1 returns Xt,i = 0 but lt,i ≤ 8m for the inspection task t.
• A message appears if the drone senses any object within 2.5m to the center of the drone or
crashes into anything (i.e., whenever Xh,i , Xv,i , or Xo,i turns from false to a non-false value).
9Figure 2: Illustration of in-task feedback
103.4 Post-Study Assessment
After a simulation study ends, data collected from the study are further used to perform a com-
prehensive post-study assessment. The assessment covers the trainee’s task performance and self-
assessment through a questionnaire survey. The trainee’s task performance is evaluated on four
dimensions: conformity, efficiency, safety, and accuracy.
3.4.1 Task Performance
The trainee’s ability to conform with task specifications is term conformity, reflected by the trainee’s
ability to keep on the reference paths and the recommended speed during the inspection. The ability
to be on-path in performing tasks is measured by the percentage of task time when the drone is on
the reference paths of the tasks:
T
PIt,e
i=It,s Xt,i
X
Pp = . (9)
I − It,s + 1
t=1 t,e
To measure the trainee’s ability to control the drone at the recommended speed, a weighted sum
of times when the drone is speeding is calculated with the weights being the speed in the unit of
speed limit:
T
PIt,e
i=It,s (vi /v̄)Xs,i
X
Ps = . (10)
t=1
It,e − It,s + 1
Then, the conformity is an aggregation of Pp and Ps ,
PC = ω p Pp + ω s Ps , (11)
where ωp is the gain coefficient for on-path and ωs is the loss coefficient for speeding. The range of
PC in TASBID is [-100,100]. The maximum score occurs if the drone is always on-path and never
speeding in all tasks (e.g., Pp = 1 and Ps = 0). The minimum score occurs when the drone is never
on-path and always flying at its maximum speed (e.g., Pp = 0 and Ps = vmax /v̄). The maximum
speed of the drone in TASBID is 30mph and the speed limit for inspection is 10mph. Therefore,
ωp and ωs are set to 25 and -25/3, respectively.
The trainee’s ability to finish the inspection timely is term time efficiency. Multiple critical
values are defined with respect to the time efficiency of trainees. τ defines the cut-off point of
the inspection time for receiving the highest score and τ̄ is the maximum allowable flight time for
the drone. The battery drains if the inspection would go beyond τ̄ . Let Xb be a binary variable
indicating if the drone fails to return to the ground team due to running out of power. Xb equals
one if N/f > τ̄ , and zero otherwise. Accordingly, The score of time efficiency, PE , is calculated as:
PE = [ωe0 + ωe1 (N/f − τ )+ ](1 − Xb ) + ωb Xb . (12)
The range of PE score is [-100,100]. ωe0 in Equation (12) is set to be 100, representing the highest
efficiency score a trainee receives if the inspection is done by τ . ωb is set to be -100, indicating
the trainee fails to complete the inspection within the maximum allowed time τ and thus loses 100
points. PE score will be 0 if the inspection is completed at the defined maximum allowable time τ .
ωe1 = −ωe0 /(τ − τ ), representing the score deduction for every additional unit of time exceeding τ .
In TASBID, τ is 25 minutes and τ is 15 minutes.
11The trainee’s ability to avoid any crashes is termed job safety. The lack of ability to keep safe
in inspection is measured by the total lost score due to crashes:
PS = max[ωh Xh + ωv Xv + ωo Xo , PS0 ] (13)
where ωh , ωv , and ωo are losses from each crash into a human, a vehicle, and any other object,
respectively. In TASBID, ωh and ωv are set to be -100, indicating a crash into a traffic agent usually
has severe consequences such as a fatality or a hospitalized incident. ωo is set to be -3, indicating
the consequence of crash into other objects is more related to the drone damage. PS0 is set to be
-100 in TASBID, meaning that no more points will be further deducted if the cumulative loss has
reached PS0 . Therefore, the range of PS score is [-100,0]. Limiting the loss due to crashes by PS0 can
avoid the scenario that PS dominates scores of other performance measurements.
A trainee’s ability to recognize surface defects correctly during the inspection is termed accuracy.
The assessment module calculates the recall (the portion of the surface defects that the trainee
detected correctly):
Rc = Xtd /Xd , (14)
and the precision (the portion of snapshots that contain a surface defect):
Pr = Xtd /Xpd , (15)
to measure the accuracy. Fβ further integrates the recall and the precision as a single metric:
(1 + β 2 )PrRc
Fβ = , (16)
β 2 Pr + Rc
where β is a non-negative coefficient indicating the relative importance of recall with respect to
precision. Setting β as zero indicates precision is dominantly important, and setting it as ∞ means
recall is dominantly important. β is equal to one if precision and recall are equally important. Fβ
is within [0, 100%]. Accordingly, the score of accuracy is measured as
PA = ωf Fβ . (17)
ωf in Equation (17) is set to be 100 and so the range of PA is [0, 100].
The trainee’s scores on conformity, efficiency, safety, and accuracy are further standardized to
be within the range from 0% to 100%. Then the standardized scores are presented as a Kiviat
diagram to show the subject’s task performance on the four dimensions.
3.4.2 Questionnaire-based Workload Assessment
After the simulation study is completed, the trainee is invited to fill out a questionnaire adopted from
[8] and revised for TASBID. Table 1 list the six aspects the questionnaire asks. “Time Pressure”,
“Frustration”, and “In-task Feedback” are three aspects asked regarding the overall simulation
study. “Performance”, “Mental Demand”, and “Physical Demand” are asked with respect to each
phase or task of the inspection, including calibration, taking-off, individual tasks 1∼4, and landing.
The response to questions are on a five-point likert scale: strongly agree (1), agree (2), neutral (3),
disagree (4), and strongly disagree (5). “Strongly agree” stands for the most positive response, and
“strongly disagree” stands for the most negative response.
12Table 1: Questionnaire Questions
QUESTIONS
Time Pressure: I finished the inspection without
stress in regard of the required time.
Overall
Frustration: I never felt insecure, irritated,
stressed, or discomforted during this task.
In-task Feedback: The in-task feedback (e.g. bat-
tery level, speed, messages) were helpful for me.
Performance: I finished the task with a good per-
By tasks
formed.
Mental Demand: It’s easy to finish the task.
Physical Demand: There was no physical activity
(including pressing, pulling, turning, controlling, and
holding) required in the task.
Heavy physical or cognitive load may cause frustration and time pressure, and these psycholog-
ical states may further influence the task performance. In-task feedback may mitigate the negative
effect of the physical and mental loads posed on inspectors. The questionnaire can assist in causation
analysis of the aforementioned relationship among causal factors (physical and mental demands),
human states (time pressure and frustration), task performance, and the moderator (in-task feed-
back).
3.4.3 Continuous Improvement
Repetitive training would help improve a trainee’s task performance and tolerance to physical and
mental demands. The improvement is manifested by progressive changes in both performance
measurements and subjective evaluation results, which are the learning curve of the trainee. A
hypothesis is that the post-study feedback would accelerate the learning of the trainee.
4 Capability Demonstration
A small-scale experimental study is conducted to demonstrate the capabilities of the developed
TASBID. Seven volunteers participated in the study. Among them, two are female, and five are
male. Their ages are from 18 to 45, and their background is in civil engineering. All participants
have no prior experience with operating drones, but some of them have the experience of playing
video games.
4.1 Experiment Protocol
The experimental protocol for the simulation study is the following. In the beginning, an intro-
duction to TASBID will be presented to the participant using a few PowerPoint slides. Then, a
short tutorial [16] on the simulation study is given to the participant, which is presented as images
and video clips with annotations. After that, the participant enters a practice session that offers
an opportunity to practice the drone operation using the provided remote controller. The practice
scene has some random variations from the scene for the simulation study. The inspection simula-
tion starts after the participant feels she/he has enough practice and is ready for the study. After
13the simulation study, the participant will fill out the questionnaire and then exit the study. The
duration of the entire study can last 15∼60 minutes, depending on the participant’s prior experience
with TASBID. Fig. 3 illustrates a participant operating the drone in the simulated inspection. The
display screen is split into two parts. The left portion is the operator’s view and the right portion
is the camera’s view. Vivid videos of the inspection simulation can be found at the project website
[16].
Figure 3: A participant in the simulated study
4.2 Task Performance
4.2.1 Task Performance of Individuals
The task performance of any participant in a simulation study is calculated according to the as-
sessment method presented in Section 3.4.1. Figure 4 is a Kiviat diagram that TASBID generates
to show the task performance of participant #6 on four dimensions. It straightforwardly tells that
the strength of the participant is efficiency, and the weaknesses that the participant can work on
and improve are conformity, safety, and accuracy. The post-study analysis report further explains
the detail of the performance assessment and suggests ways of improvement. The template of the
report is available for download from the project website [16].
4.2.2 Task Performance of a Group
TASBID can further generate Figure 5 to study the task performance of a group. Four boxplots
respectively show the distribution of the group’s performance on the four dimensions. The figure can
tell how diverse the group is on each performance measurement. For example, the distribution of
the group’s safety score is the largest and that of time efficiency is the smallest. This figure can also
tell the strength and weakness at the group level. The strength of this group is the efficiency, and
the conformity is what the entire group needs to improve. Furthermore, individuals, represented
by colored dots, are overlaid with the boxplots to compare the performance of any individual to
the group. For example, participant #4 has a relatively low performance and probably needs more
training. Participant #1 has achieved the top performance on conformity and accuracy among the
14Figure 4: Participant 6 Performance Radar Chart
group, and she/he can focus on improving efficiency and safety. Data of participants #2-#6 in
Figure 5 are their initial performance (i.e., from their first time of participation). Both participants
#4 and #6 have low scores on conformity and safety, while others had a good score on conformity,
safety, or both. Participants #4 and #6 have minimum prior experiences with operating a drone,
either in physical or virtual contexts. Participant #1 performs well because she/he benefits from
practicing the skills using TASBID frequently.
Figure 5: Performance of a Group
4.2.3 Conformity Analysis
TASBID also analyzes participants’ ability to follow task specifications. Figure 6 shows how each
participant gained scores (green columns) from keeping on the reference path of each task and lost
scores (red columns) due to speeding. The conformity score (blue columns) is the aggregation of
on-path scores and speeding scores on the four tasks. For example, participant #1 followed the
recommended inspection path and speed well in all tasks and speeding is a negligible issue of her/his
performance, thus achieving the highest conformity among the seven participants. Participant #7
15should particularly pay attention to keeping on the reference path for task 1, and participant #2
should avoid speeding in task 3.
Figure 6: The waterfall chart interpreting the conformity score of individual participants
4.2.4 Safety Analysis
TASBID analyzes the likelihood of crashes by tasks and by participants. Figure 7 is a stacked
column chart counting the number of crashes from each participant, split by tasks. There were 44
crashes in total, and 25 (56.8%) occurred when performing inspection tasks. Among the four tasks,
the slab inspection has the largest chance of crashes, and the inspection of the narrow interlayer
space has the second largest chance. The chance of crashes when inspecting the pier is the lowest.
Participant #4 achieved the lowest safety score in the group, as seen from Figure 5. Figure 7
further shows this participant had 13 crashes in total, with 10 (76.9%) occurred when she/he was
not performing tasks. Participant #5 had 11 crashes and achieved the second lowest safety score.
Among the 11 crashes, 6 (54.5%) occurred in inspecting the narrow interlayer space. Participant
#6 is another inspector who had a relatively low safety score too. She/he had 4 crashes when
inspecting the bridge bottom. The observation suggests further training should be individualized
for every inspector according to specific needs for improvement.
Figure 7: Count of participants’ crashes by tasks
164.2.5 Accuracy Analysis
TASBID also generates Fig. 8 to summarize the accuracy of participants in visual recognition of
surface defects. The group has varied ability to detect surface defects, but most participants (6
out of 7) are 100% correct about their detection. The observation confirms that false negatives is
a more severe issue than false positives in human visual inspection.
Figure 8: Participants accuracy performance
4.2.6 Continuous Improvement Achieved
Participants can improve their skill to operate drones gradually by repetitive training in TASBID.
The post-study assessment provided to participants may positively influence their learning outcome.
For the illustration purpose, participants #4 and #6 respectively repeated the training for three
times during a two-week period. The overall inspection scene does not change over the repeated
training, but locations of surface defects are changed from one training to another. The post-study
assessment was provided to participant #4, but not participant #6. Figure 9 illustrates the task
performance of participants #4 and #6, respectively, achieved from their three times of training.
Comparing to the initial training, participant #4 improved the conformity, efficiency, safety, and
accuracy by 13.24%, 12.36%, 49.18% and 7.69%, respectively, from the third round of training,
while the changes of participant #6 are 18.18%, -9%, 20.55% and -12.5%. From informal interviews
with participants #4 and #6 respectively, participant #4 took the post-study assessment into
consideration in late training, whereas participant #6 focused on dimensions that she/he felt not
performed well from the last round of training. The comparison suggests the data-driven post-study
feedback to participants is objective and may be more effective than participants’ self perception in
improving their skills of bridge inspection. The effect of post-study assessment on trainees’ learning
curves can be tested statistically after more samples are collected.
4.3 Questionnaire Result
Figure 10 summarizes the average, the most positive, and the post negative evaluations by the group
of seven participants. The average scores of self-assessment reveal the between-task variations in
performance, mental demand, and physical demand. The most positive and the most negative
evaluations from the group demonstrate the diverse feelings of the participants.
17Figure 9: Performance improvement over repetitive training
Figure 10: Participants’ Questionnaire Result
18Subjective judgement and objective assessment on task performance can be consistent or contra-
dict. For example, participant #6 believes her/his performance on the pier inspection task is poor,
and the actual performance measured by TASBID is consistent with the participant’s subjective
judgement. Another example is that participant #2 believes she/he performed well in inspecting
the bridge bottom and the interlayer, but not the slab and the pier. The actual performances of
the participant are exactly the opposite. The inconsistency between subjective and objective as-
sessments highlights the importance of TASBID’s ability to provide the performance measurement.
Moreover, the management can investigate the reason for observed contradiction and how partici-
pants’ feeling influences their ability to finish the remaining tasks. Participants’ self-assessment of
workload, human states, and in-task feedback can facilitate the development of models for analyzing
human sensor data automatically.
A participant’s responses to the questionnaire may change over her/his repetitive training.
Figure 11 visualizes the self-assessment by participants #4 and #6 from their repetitive training.
The row and column labels are the same as those in 10. Both participants’ responses to the
questionnaire change over multiple rounds of training, but in different manners. Participant #4
felt time pressure in the first round of training. All of her/his responses were ranged from neural
to strongly agree after the second and third rounds of training. Frequencies of agree or strongly
agree after the third round of training are higher than the second round. The observation indicates
participant #4’s subjective assessment became more and more positive over training, indicating the
confidence and comfort of her/him in the bridge inspection with an assistant drone are creasing.
The responses of participant #6 over the three rounds of training have a slightly different pattern.
In the first round of training, participant #6’s self-assessment of performance and mental demand
in performing tasks 1-4 were ranged from strongly disagree to neural, indicating that these tasks
were difficult for her/him. All of her/his responses are at least neural after the second and third
rounds of training, which means the tasks are less challenging to the participant after two rounds
of training. However, from the second round to the third round of training, both strongly agree
and neural are increasing. The comparison suggests the effectiveness of repetitive training varies
among inspectors and the post-study assessment provided to inspectors may be an impact factor.
Figure 11: Responses to questionnaire by participants 4 and 6.
195 Conclusions and Future Work
This paper introduced a training and assessment system named TASBID by developing a virtual
reality-based simulator for bridge inspectors assisted by a drone. TASBID monitors and analyzes
the trainee’s operation to provide real-time, in-task feedback, assisting the trainee in the simulated
bridge inspection. A post-study assessment further analyzes and reports the trainees’ task perfor-
mance on dimensions of conformity, efficiency, safety, and accuracy to increase the trainee’s learning
effectiveness.
The design of the inspection simulation has a multi-factorial framework. It can be revised to
provide a wide range of scenarios for training or factorial experiments. This paper shares the code of
the project with the public. Prospective users can revise and develop it further to adapt to their own
studies [15]. TASBID monitors trainees’ operation data and the drone’s flight data to provide real-
time, in-task feedback and perform post-study assessment. The demonstration, although is based
on a small-scale experimental study, shows this data-driven approach is timely, individualized, in
detail, and objective. Therefore, TASBID positively supports inspectors in developing the skill and
confidence in operating a drone in bridge inspection.
A more realistic scenario is that the drone is in the autonomous flying mode, and the inspector
takes control when needed. The mode of inspector-drone cooperative inspection has been added to
TASBID. Both the training and the assessment introduced in this paper have built a foundation
for creating these for the cooperative inspection as well. Besides, a gap is present between the
simulation created in Unity and the real-world inspection scene. To provide realistic visual stimuli
to inspectors, a Generative Adversarial Network (GAN) can convert the game-based scene into a
more realistic one. Furthermore, this paper focuses on the system design and development, thus
only conducting a small-size experimental study to demonstrate the system functionality. Factorial
experiments at a larger scale would be necessary for the system testing and improvement. TASBID
can integrate a multi-modal biometric sensor system composed of EEG, eye tracker, ECG, EMG,
and IMU. Advanced methods of data analytics, such as deep neural networks, need to be developed
for analyzing the multi-modal biometric sensor data to reliably detect and classify human states
and for creating other methods of human-drone interactions. This paper has built a foundation for
exploring the above-discussed opportunities.
Acknowledgement
Li, Karim, and Qin receive financial support from National Science Foundation through the grant
ECCS-#2026357 in Future Work at the Human Technology Frontier Program and CMMI-#1646162
in Cyber-Physical Systems Program.
References
[1] AASHTO. 2019 aashto uas/drone survey of all 50 state dots. Technical report,
American Association of State Highway and Transportation Officials, 2019. Available
at: https://www.transportation.org/wp-content/uploads/2019/05/MissionControl_
Drones3.pdf, accessed Mar, 2021.
[2] AeroSim. Aerosim drone simulator, n.d. Available at: https://www.aerosimrc.com/en/pro.
htm, accessed Mar, 2021.
20[3] ASCE. 2021 report card for america’s infrastructure. Technical report, American Society of
Civil Engineers, 2021. Available at: https://infrastructurereportcard.org/wp-content/
uploads/2020/12/National_IRC_2021-report-2.pdf, accessed Mar, 2021.
[4] Milan Banić, Aleksandar Miltenović, Milan Pavlović, and Ivan Ćirić. Intelligent machine vision
based railway infrastructure inspection and monitoring using uav. Facta Universitatis, Series:
Mechanical Engineering, 17(3):357–364, 2019.
[5] djohns451. Road architect for unity, 2019. Available at: https://github.com/MicroGSD/
RoadArchitect, accessed Mar, 2021.
[6] Haoming Dong, Shaojun Zou, Dingfang Chen, and Hongliu Xu. Research and development of
distributed bridge crane training system based on virtual reality. In 2009 Second International
Conference on Intelligent Computation Technology and Automation, volume 1, pages 670–673.
IEEE, 2009.
[7] Cali M Fidopiastis, Julie Drexler, Daniel Barber, Keryl Cosenzo, Michael Barnes, Jessie YC
Chen, and Denise Nicholson. Impact of automation and task load on unmanned system op-
erator’s eye movement patterns. In International Conference on Foundations of Augmented
Cognition, pages 229–238. Springer, 2009.
[8] G Gabriel, Miguel A Ramallo, and Elizabeth Cervantes. Workload perception in drone flight
training simulators. Computers in Human Behavior, 64:449–454, 2016.
[9] Mario Haberle. Drone controller full (pc/joystick/mobile), 2021. Avail-
able at: https://assetstore.unity.com/packages/tools/physics/
drone-controller-full-pc-joystick-mobile-111163, accessed Mar, 2021.
[10] Sandra G Hart and Lowell E Staveland. Development of nasa-tlx (task load index): Results
of empirical and theoretical research. In Advances in psychology, volume 52, pages 139–183.
Elsevier, 1988.
[11] Robyn Hopcroft, Eleanore Burchat, and Julian Vince. Unmanned aerial vehicles for maritime
patrol: human factors issues. Technical report, Defence Science and Technology Organisation
Edinburgh (Australia) Air Operations DIV., 2006.
[12] Muhammad Monjurul Karim, Ruwen Qin, Genda Chen, and Zhaozheng Yin. A semi-supervised
self-training method to develop assistive intelligence for segmenting multiclass bridge elements
from inspection videos. Structural Health Monitoring, page 14759217211010422, 2021.
[13] Michael P Kontitsis, Nikos C Tsourveloudis, and Kimon P Valavanis. A uav based automated
airborne surveillance system. In 11th Mediterranean conference on control and automation,
Rhodes, Greece, 2003.
[14] Yu Li. A two-layer routing algorithm for unmanned aerial vehicle in transmission line in-
spection. In Proceedings of the International Annual Conference of the American Society for
Engineering Management., pages 1–9. American Society for Engineering Management (ASEM),
2020.
[15] Yu Li. Bridge inspection with a drone, 2021. Available at: https://github.com/yuli1102/
Bridge-Inspection-with-a-Drone, accessed May, 2021.
21[16] Yu Li. Tasbid experiment, 2021. Available at: https://sites.google.com/view/yuli1102/
projects/bridge-inspection/flight-simulation, accessed May, 2021.
[17] Matsemann. mdjicontroller, 2020. Available at: https://github.com/Matsemann/
mDjiController, accessed Mar, 2021.
[18] mchrbn. Unity-traffic-simulation, 2020. Available at: https://github.com/mchrbn/
unity-traffic-simulation, accessed Mar, 2021.
[19] Najib Metni and Tarek Hamel. A uav for bridge inspection: Visual servoing control law with
orientation limits. Automation in construction, 17(1):3–10, 2007.
[20] Hashem Izadi Moud, Mohamad A Razkenari, Ian Flood, and Charles Kibert. A flight simulator
for unmanned aerial vehicle flights over construction job sites. In Advances in Informatics and
Computing in Civil and Construction Engineering, pages 609–616. Springer, 2019.
[21] n.d. vjoy device driver, n.d. Available at: http://vjoystick.sourceforge.net/site/, ac-
cessed Mar, 2021.
[22] Andy Neely, Mike Gregory, and Ken Platts. Performance measurement system design: a
literature review and research agenda. International journal of operations & production
management, 1995.
[23] Tolga Özaslan, Shaojie Shen, Yash Mulgaonkar, Nathan Michael, and Vijay Kumar. Inspection
of penstocks and featureless tunnel-like environments using micro uavs. In Field and Service
Robotics, pages 123–136. Springer, 2015.
[24] Philippe Rauffet, Assaf Botzer, Alexandre Kostenko, Christine Chauvin, Gilles Coppin, et al.
Eye activity measures as indicators of drone operators’ workload and task completion strategies.
In HFES European Chapter, 2016.
[25] A Zita Sampaio and Luı́s Viana. Virtual reality used as a learning technology: Visual simulation
of the construction of a bridge deck. In 2013 8th Iberian Conference on Information Systems
and Technologies (CISTI), pages 1–5. IEEE, 2013.
[26] Yangming Shi, Jing Du, and Darrell A Worthy. The impact of engineering information for-
mats on learning and execution of construction operations: A virtual reality pipe maintenance
experiment. Automation in Construction, 119:103367, 2020.
22You can also read