Temporal Variation and Source Analysis of Carbonaceous Aerosol in Industrial Cities of Northeast China during the Spring Festival: The Case of ...
←
→
Page content transcription
If your browser does not render page correctly, please read the page content below
atmosphere
Article
Temporal Variation and Source Analysis of
Carbonaceous Aerosol in Industrial Cities of
Northeast China during the Spring Festival:
The Case of Changchun
Mengduo Zhang 1,2,† , Shichun Zhang 1,† , Qiuyang Bao 3 , Chengjiang Yang 4 , Yang Qin 4 , Jing Fu 1
and Weiwei Chen 1,2, *
 1   Key Laboratory of Wetland Ecology and Environment, Northeast Institute of Geography and Agroecology,
     Chinese Academy of Sciences, Changchun 130102, China; zhangmengduo@iga.ac.cn (M.Z.);
     zhangshichun@iga.ac.cn (S.Z.); fujing@iga.ac.cn (J.F.)
 2   College of Resources and Environment, University of Chinese Academy of Sciences, Beijing 100049, China
 3   Center of Atmospheric Environment Research, Jilin Provincial Academy of Environmental Sciences,
     Changchun 130012, China; 13944002068@126.com
 4   Department of Atmospheric Environment, Jilin Provincial Ecological Environment Monitoring Center,
     Changchun 130012, China; ycj-043@163.com (C.Y.); 18738376805@163.com (Y.Q.)
 *   Correspondence: chenweiwei@iga.ac.cn; Tel.: +86-0431-8554-2314
 †   These authors contributed equally to this study and share first authorship.

 Received: 9 August 2020; Accepted: 11 September 2020; Published: 16 September 2020

 Abstract: Carbonaceous aerosol, one of the major components of atmospheric aerosols, significantly
 affects haze episodes, climate change, and human health. Northeastern China suffers severe air
 pollution, especially in some periods (e.g., the Spring Festival). However, studies on carbonaceous
 aerosols in typical northeast industrial cities (i.e., Changchun) are rare, limiting further comprehension
 of the atmospheric haze formation. In this study, we monitored the concentrations of carbonaceous
 aerosols (i.e., OC and EC) in Changchun during the Lunar New Year of 2018 (i.e., from Lunar
 20 December to Lunar 20 January), and analyzed the temporal variation and source contributions via
 the HYbrid-Single Particle Lagrangian Integrated Trajectory (HYSPLIT) model with the potential
 source contribution factor weights (PSCF) method. The daily concentrations of OC and EC were
 9.00 ± 2.81 and 1.57 ± 0.46 µg m−3 , respectively, and were significantly lower at nighttime than at the day
 during the Spring Festival. The concentrations during the major period (i.e., OC: 8.13 ± 2.93 µg m−3 ;
 EC: 1.47 ± 0.47 µg m−3 in festival days), including the Lunar Little New Year; the Lunar New
 Year’s Eve; New Year’s Day; Lunar 5 January, and the Spring Lantern Festival, were mainly
 from the northwestward with the wind speed of 4–6 m/s being lower than that of normal period
 (OC: 9.87 ± 2.46 µg m−3 ; EC: 1.67 ± 0.44 µg m−3 ) from the southeastward with a wind speed of
 6–7 m/s. The direction of the airflow trajectory was mainly in local, northwestward, and northward,
 carrying particulate matter and gaseous pollutants. In major period, the daily concentration of
 atmospheric pollutants presented a bimodal trend, with peaks appearing regularly from 11:00 a.m.
 to 12:00 p.m. and 5:00 p.m. 10:00 p.m., which might be related to traffic, cooking, and firecrackers.
 The OC/EC was greater than 2 during the whole period, indicating the generation of secondary
 organic aerosols (i.e., SOC). This study was essential to understand the formation mechanisms of
 severe pollution episodes and develop control measures for the industrial cities of Northeast China
 during the Spring Festival.

 Keywords: atmospheric pollution; carbonaceous aerosols; HYSPLIT; PSFC; Northern China

Atmosphere 2020, 11, 991; doi:10.3390/atmos11090991                         www.mdpi.com/journal/atmosphere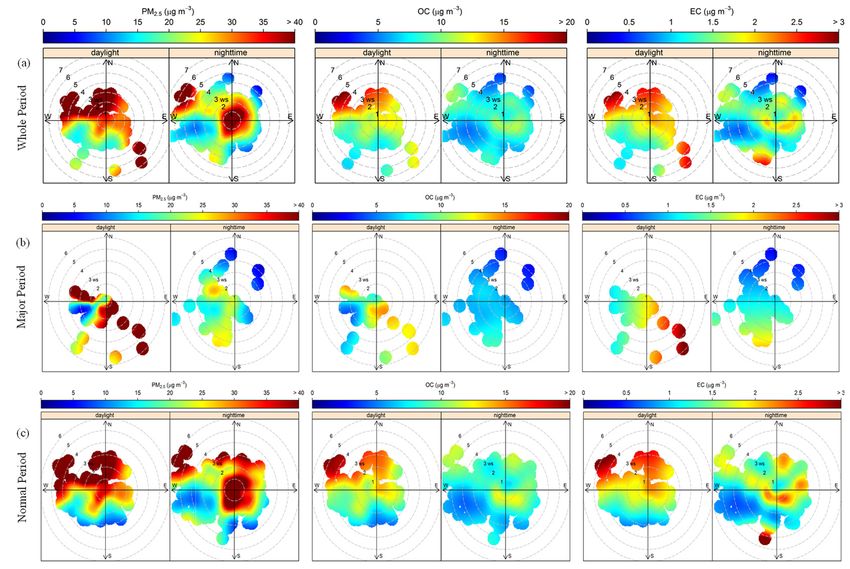
Atmosphere 2020, 11, 991                                                                             2 of 18

1. Introduction
       The complex impacts of carbonaceous aerosols (e.g., elemental carbon (EC) and organic
carbon (OC)) on air quality, human health, and climate change are of increasing concern
in current environmental research [1–3]. Previous studies have confirmed that EC and OC
are derived from the primary aerosol from incomplete biomass combustion, road transport,
shipping, industrial production, and the secondary organic matter generated by chemical reactions,
respectively [4–7]. Quantifying the concentration level, clarifying spatiotemporal characteristics,
identifying emission sources, and exploring variation combined with the external environment
(i.e., meteorology and topography) are necessary to understand carbonaceous aerosols [8–10].
Hoverer, the different terrain, population density, socioeconomic status, and industrial distribution
lead to a complex mixture of various aerosol types [11,12] which increases the difficulty of
studying source analysis and transformation mechanism of carbonaceous aerosols. Furthermore,
carbonaceous aerosols from the same region in different periods, especially haze-episode periods
(i.e., the Chinese Lunar New Year), have distinguishable behaviors in terms of formation mechanisms,
chemical conversions, and extinction, limiting the application of regional air quality models [13–15].
Therefore, systematic scientific research on carbonaceous aerosols are necessary to carry out to clarify
the emission characteristics, spatiotemporal distribution, and source analysis in typical periods of haze
in cities.
       To date, a series of studies on carbonaceous aerosols have been conducted around the world
to estimate the emission characteristics, pollution sources, and chemical conversion mechanisms of
typical particulate matter (i.e., PM2.5 : PM with a diameter of less than 2.5 µm; PM10 : PM with a
diameter of less than 10 µm) during haze. Kalita et al. examined the seasonal variability and long-term
trends of aerosol distribution over Southeast Asia, finding that the contribution of carbon aerosols from
biomass burning and biogenic emissions to the columnar distribution of satellite-based aerosol optical
depth (AOD) before the monsoon season (March-May) reached about 60% [16]. Rai et al. assessed
the seasonal transport trends and potential source regions of different carbonaceous species of PM10
over the Eastern Himalaya, and evaluated the seasonal transport pathway of carbonaceous aerosols by
Backward trajectories, cluster analysis, and concentration-weighted trajectory (CWT) analysis [17].
Ramírez et al. studied the characteristics and temporal variations of organic and elemental carbon
aerosols in a tropical high-altitude megacities in Latin America, quantitatively estimated the SOC
concentration based on the EC-tracing method, and found the peak concentrations of SOC measured in
the months with the highest temperature, indicating their photochemical origin. [18] In the megacities
of China (i.e., the Beijing region), long-term observation experiments were carried out to observe
the daily and seasonal variation of atmospheric carbonaceous aerosols, exhibiting higher values in
the winter than in spring and lower values during the day than at night [19]. Yan et al. provided a
comprehensive episode-based analysis of size-resolved carbonaceous aerosol compositions during the
winter to understand the spatiotemporal characteristics and its role in haze formation in the central
plain urban agglomeration of China [20]. Yin et al. conducted off-line sampling of PM1 by high
topographic relief in typical urban agglomerations in mountainous terrain (i.e., western Sichuan Basin,
China) to analyze the vertical profiles of carbonaceous aerosols and their key influencing factors in
wintertime [21]. However, studies on the variation characteristics and source analysis of atmospheric
carbonaceous aerosol for frequent haze episodes periods (i.e., the Spring Festival) are insufficient.
       Northeastern China, a well-known site of heavy industry, suffers from air pollution that has
been recognized as adversely affecting human health [22]. In recent years, various atmospheric
researches in Northeast China have focused on the emission characteristics of anthropogenic sources,
the long-term analysis of pollution source in a certain region, or the description of the pollution
situation [23–25]. Gao et al. reported vehicle emissions in Northeast China, analyzing the temporal
and spatial dynamics of transport emissions [26]. Li et al. analyzed the yearly indoor/outdoor PM2.5
concentrations of colleges and universities in Northeast China from the perspective of health effects [27].
Li et al. took a typical agriculture-dominated city (i.e., Suihua) as an example to investigate the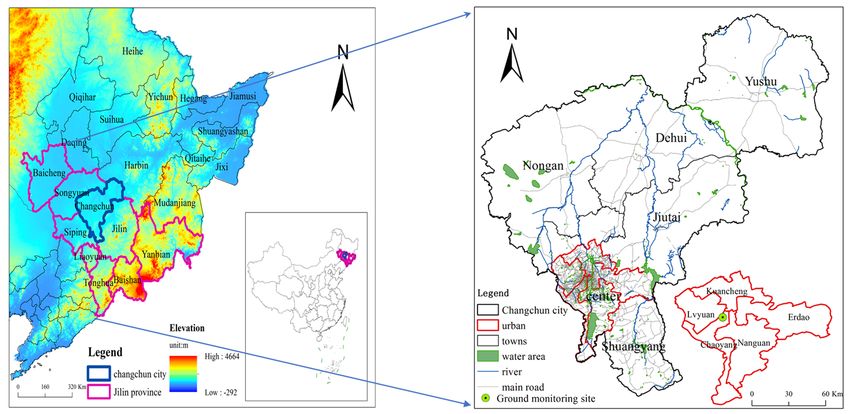
Atmosphere 2020, 11, 991                                                                            3 of 18

characteristics and causes of atmospheric pollution and evaluated the straw burning prohibition [28].
However, comprehensive research on the characteristics and pollution distribution of key pollutants
(i.e., carbonaceous aerosols) during the process of haze formation in a specific period, especially during
the Spring Festival, which involves concentrated haze episodes, has not been conducted.
       Based on a case study in Changchun, the objective of this study is to reveal the emissions
characteristics, spatiotemporal distribution, and pollutant sources of carbonaceous aerosols during
the Spring Festival (i.e., from 20 December to 20 January of the lunar calendar) in a typical
industry-dominated and haze-prone region (i.e., northeastern China), using the HYSPLIT model
and PSCF method. The study period was subdivided into major period (i.e., the Lunar Little New
Year: 8 February 2018; the Lunar New Year’s Eve: 15 February 2018; New Year’s Day: 16 February
2018; Lunar 5 January: 20 February 2018; and the Spring Lantern Festival: 2 March 2018) and normal
period, comparing the carbon concentration variation and emission sources. The results of this work
clarified the emission sources and transmission trajectory of atmospheric carbonaceous aerosols in the
typical period of Changchun, which will provide an empirical reference for the local government to
predict haze events.

2. Methodology

2.1. Study Region and Monitoring Site
      Changchun, the capital of Jilin Province, lies at 43◦ 050 N–45◦ 150 N and 124◦ 180 E–127◦ 050 E.
The city has a population of over 7.5 million and comprises an area of 20,565 km2 . It is located in the
middle of the northeast plain, which is the junction of the Songnen Plain and the Songliao Plain, and is
higher in the east than in the west (Figure 1). It is the natural geographic center of Northeast China,
delimited by the cities of Songyuan to the northwest, Siping to the southwest, Jilin to the southeast,
and Harbin to the northeast. The local climate is characterized by a continental monsoon with four
distinct seasons. The average annual temperature is 5.65 ◦ C, with the mean coldest month (i.e., January)
temperature of −15.1 ◦ C and the hottest month (i.e., July) temperature of 23.1 ◦ C. Based on regional
climate characteristics, the winter generally runs from November to March of the following year,
accompanied by long-term low temperature and continuous intense heating. Changchun is a major
grain production base in China, having a crop-sown area of 1.326 million hectares and a grain output
of 8.646 million tons in 2018 [29]. As a significant node city of the “Belt and Road” northern line and
core city in the Harbin-Changchun cities agglomeration, which is defined under the guidance of the
“National New-type Urbanization Plan (2014–2020)” in China [30], Changchun is the birthplace of the
automobile industry, optoelectronic information, and applied chemistry [31].
      Changchun is a typical industrial city in northeastern China and a high haze pollution region
in China [32]. The Changchun Environmental Quality Report in 2017 demonstrated that the annual
average value of fine particulate matter (i.e., PM2.5 , the annual concentration average is 46 µg/m3 )
and inhalable particulate matter (i.e., PM10 , the annual concentration average is 78 µg/m3 ) exceeded
the limits of the secondary standard of “Ambient Air Quality Standards” (GB3095-2012) by 0.31 and
0.11 times, respectively. The number of days with mild pollution or above (i.e., the air quality index
(AQI) is greater than 150) on an annual scale are 86, accounting for 23.8% of the total monitoring
days [33], of which more than 80% occur in winter. In the state-approved “Harbin-Changchun
Conglomeration Development Plan” [34], the regional atmospheric pollution problem in late autumn
and early winter, especially during the Spring Festival, was also explicitly raised. In response to the
haze events during this period, the government stated clearly in “The 13th Five-Year Plan for the
Revitalization of Northeast China” [35] its intent to tackle the pollution problem. Although Changchun
implemented a “Firecrackers Burning Prohibition Policy” during the Spring Festival in 2016 to reduce
the particulate matter in the environment [36], the firecracker-burning phenomenon still occurs
frequently, especially in regions other than urban construction areas. Previous studies have shown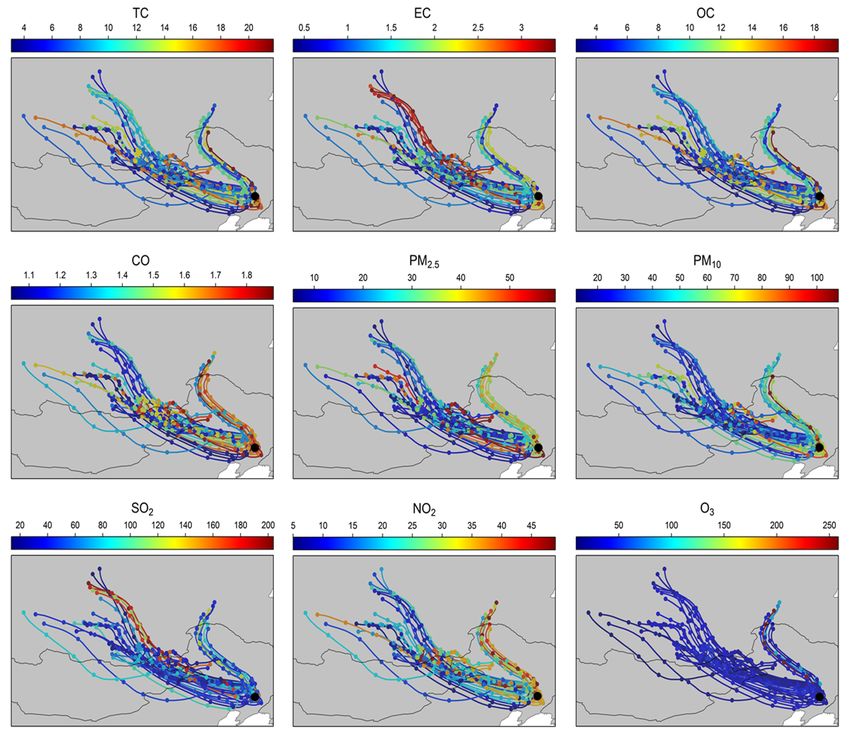
Atmosphere 2020, 11, x FOR PEER REVIEW 4 of 18
Atmosphere 2020, 11, 991 4 of 18
sampling site is adjacent to the four cities of Nong’an, Jiutai, Dehui, and Yushu in the north, where is
the main distribution area of countryside. A few industrial sources are located in the vicinity of the
that firecrackers release a large amount of carbonaceous aerosols, which significantly promotes the
monitoring site. The experimental campaign was launched from 5 February 2018 to 7 March 2018. All
formation of extreme haze episodes.
hourly pollutants data were collected from this monitoring site.
Figure 1.
Figure The location
1. The location of
of the
the study
study region
region in
in northeastern
northeastern China
China and
and itsits regional
regional geography
geography andand
elevation status. The bright purple area on the left indicates Jilin Province, Northeast China,
elevation status. The bright purple area on the left indicates Jilin Province, Northeast China, and the and the
dark blue
dark blue indicates
indicatesthe
theadministrative
administrativeboundary
boundary ofof
Changchun,
Changchun, which is the
which capital
is the of Jilin
capital Province
of Jilin and
Province
the subject of this study. The light red area on the right represents the urban center of the Changchun
and the subject of this study. The light red area on the right represents the urban center of the
region, and the green circles are the ground monitoring sites in this study.
Changchun region, and the green circles are the ground monitoring sites in this study.
The monitoring site (43◦ 510 49” N, 125◦ 170 30” E) is located in the Chaoyang District, which is
2.2. Data Source
the central urban region in Changchun (Figure 1). This region has large population densities and
developed traffic, and road congestion often occurs during commuting hours. Moreover, the sampling
2.2.1. Atmospheric Carbon Aerosol Data
site is adjacent to the four cities of Nong’an, Jiutai, Dehui, and Yushu in the north, where is the main
In this study,
distribution area ofhourly atmospheric
countryside. A few OC/EC
industrialconcentrations
sources are locatedwere measured continuously
in the vicinity using an
of the monitoring
automatic monitoring OC/EC
site. The experimental analyzer
campaign (Model 4,from
was launched Sunset Laboratory
5 February 2018 Inc.,
to 7Tigard,
MarchOR, 2018.USA)
All during
hourly
the Spring Festival (from 20 December to
pollutants data were collected from this monitoring site. 20 January of the lunar calendar in 2018), which is
considered as the peak period for winter heating and fireworks. The analytical instruments use a
2.2. Dataoptical
thermal Source transmission method, mainly composed of a sampling system, chemical analysis,
laser, and CO2 monitoring system. Particles containing carbonaceous aerosols were captured by a
2.2.1. Atmospheric Carbon Aerosol Data
round 16-mm quartz filter( Whatman QM-A, 16 mm, Whatman, Maidstone, UK), and then heated
incrementally in hourly
In this study, a nonoxidizing
atmospheric environment (i.e., pure were
OC/EC concentrations helium gas) through
measured continuouslyan automatic
using an
temperature-raising
automatic monitoringprogram, causing (Model
OC/EC analyzer the organic
4, Sunsetcarbon to be volatilized,
Laboratory Inc., Tigard,while
OR,theUSA) same sample
during the
was
Springgradually heated20in
Festival (from a helium/oxygen
December to 20 January(He/O 2) mixed
of the gas environment,
lunar calendar during
in 2018), which which black
is considered as
carbon
the peak was oxidized
period and decomposed
for winter heating andinto gaseousThe
fireworks. oxides. The decomposition
analytical instruments use products
a thermal generated
optical
in the above two
transmission steps would
method, mainlybecomposed
oxidized to ofCO 2 through an
a sampling oxidation
system, furnace
chemical filled with
analysis, manganese
laser, and CO2
dioxide
monitoring(MnO 2), which
system. was detected
Particles quantitatively
containing carbonaceous usingaerosols
a nondispersive
were capturedinfrared by(NDIR)
a round detector.
16-mm
quartz filter( Whatman QM-A, 16 mm, Whatman, Maidstone, UK), and then heated incrementally
2.2.2. Real-time Pollutants
in a nonoxidizing and Meteorological
environment (i.e., pure heliumData gas) through an automatic temperature-raising
program, causing the organic carbon to be volatilized,
Real-time local atmospheric pollutant concentrations, while the samePM
including sample was gradually heated
2.5, PM10, SO2, NO2, O3 (i.e.,
in a average
1-h helium/oxygen (He/O2 ) mixed
concentration), and CO gasduring
environment,
the Spring during which
Festival inblack
2018 carbon was oxidized
were obtained from and
the
decomposed into gaseous oxides. The decomposition products generated
monitoring site in Jilin Provincial Ecological Environment Monitoring Center. These data were in the above two steps would
not
be oxidized
only used totocharacterize
CO2 throughthe an pollutant
oxidation spatiotemporal
furnace filled with manganese
variation dioxide
but also (MnO2 ),the
to explore which was
internal
detected quantitatively
connection using aaerosols.
with carbonaceous nondispersive infrared
Moreover, we also(NDIR) detector.
obtained real-time meteorological data of
the same monitoring site, including temperature, relative humidity, precipitation, wind direction,
2.2.2. Real-Time Pollutants and Meteorological Data
wind speed, horizontal visibility, which were used to explore the relationship between pollutants
Real-time localfactors.
and meteorological atmospheric pollutant concentrations, including PM2.5 , PM10 , SO2 , NO2 ,
O3 (i.e., 1-h average concentration), and CO during the Spring Festival in 2018 were obtained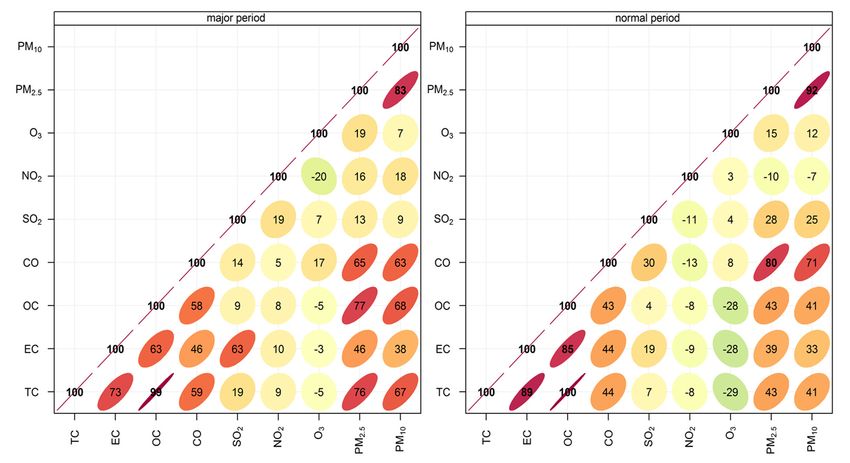
Atmosphere 2020, 11, 991                                                                                5 of 18

from the monitoring site in Jilin Provincial Ecological Environment Monitoring Center. These data were
not only used to characterize the pollutant spatiotemporal variation but also to explore the internal
connection with carbonaceous aerosols. Moreover, we also obtained real-time meteorological data
of the same monitoring site, including temperature, relative humidity, precipitation, wind direction,
wind speed, horizontal visibility, which were used to explore the relationship between pollutants and
meteorological factors.

2.3. Air-Mass Backward Trajectories
      Evaluating the backward trajectory is a common method to determine the source region and
movement of pollutants within the atmosphere [37,38]. The long-distance pollutants transmission
from other regions are generally considered to play a vital role in local haze episodes [39]. Therefore,
it is necessary to determine the long-term transport characteristics and potential emission sources of
pollutants. In this study, the backward trajectory model was applied along with real-time pollution
concentration data of Changchun to compute the backward air flow of major period during the 2018
Spring Festival. The Global Data Assimilation System (GDAS), provided by the National Environmental
Forecast Center (NCEP) [40], was (metrological data: GDAS 0.5◦ ) used in the backward trajectory
model to determine the transport pathways of the pollutant air mass from its potential source areas
to the monitoring site. The meteorology from GDAS at spatial resolution of 0.5◦ × 0.5◦ is the most
commonly used for backward trajectory studies [41,42]. The meteorological factors include ambient
temperature, atmospheric pressure, relative humidity, surface precipitation, horizontal and vertical
wind speeds, and directions. The HYbrid-Single Particle Lagrangian Integrated Trajectory (HYSPLIT)
model was run by using Openair packages under software R3.6.2 [43]. In brief, 72 h back trajectory
analyses were carried at a height of 500 m to minimize the impact of surface turbulence [44,45],
thereby identifying the dominating backward trajectory clusters and found the contributions of target
areas in the following research [46]. Backward trajectory analysis produces large trajectories and
created the spatial area of the air parcel reaching the recipient site.
      The potential source contribution factor weights (PSCF) is the receptor-based model to calculate
the probability that a source is located at latitude and longitude widely used to indicate the potential
source and its spatial distribution [47,48]. Ara Begum et al. assessed the ability of the PSCF analysis
method against the known source locations of wildfires and found that it performed well for PM2.5 , EC,
and OC [49]. PSCF is a gridded statistical analysis method based on the backward trajectory model,
which can obtain the distribution of the potential source regions along the trajectory to the receptor
site, semiquantitatively, and analyze the pollution characteristics of different trajectories and potential
source areas [50]. In this study, we explored the distribution of potential sources of PM2.5 , which was
considered as the primary pollutant during research period, based on the PSCF method. The PSCF
algorithm is displayed as follows:
                                                       m(i,j)
                                              PSCF =          ,                                         (1)
                                                       n(i,j)
where n(i,j) is the total residence time that the trajectories passed through the cell (i,j) and m(i,j) is the
total residence time that the source concentration exceeds a specified threshold when the trajectories
passed through the cell (i,j). The limit value of PM2.5 adopted in the study is 75 µg/m3 , which is the
limits of the secondary standard of “Ambient Air Quality Standards” (GB3095-2012).

2.4. Estimation of Secondary Organic Carbon (SOC)
     Generally, Secondary organic carbons (SOC) were considered to be generated when the OC/EC
concentration ratio is higher than 2 [51]. It is not possible to obtain direct SOC measurements due to the
complex physical and chemical processes involved, thus, an indirect method was used. In this study,
the SOC concentrations was estimated by the empirical formula of Turpin et al., based on minimum
OC/EC ratios [52]. This method uses EC as a tracer for primary OC, and assumes that EC is not affected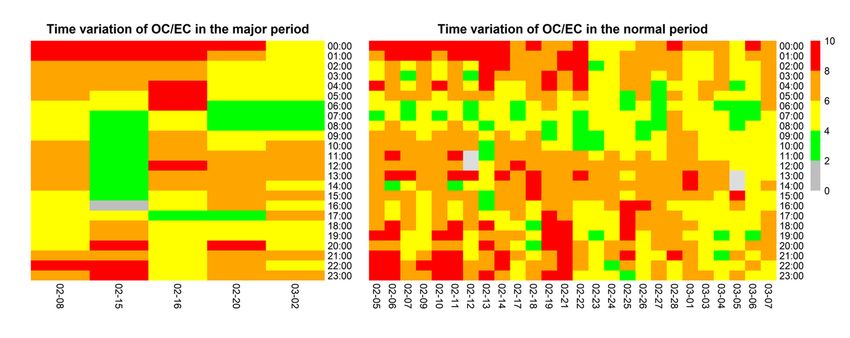
Atmosphere 2020, 11, 991                                                                                6 of 18

by photochemical oxidation reactions, and the ratio of primary OC/EC remains constant throughout
the process. The concentration of SOC was computed using the following equation:

                                                        OC

                                        SOC = OCtotal −                 × EC                               (2)
                                                        EC        min

where SOC is secondary organic carbon, and OC and EC are the real-time local environmental
concentrations, respectively.

2.5. Data Analysis
      By the design of various pollutants’ concentration over time, the temporal characteristics of
air pollution during the research period are determined. PollutionRose, which is a function of
openair package in R improved by Carslaw [43] is used to not only visually reflect the meteorological
conditions of various regions but also to qualitatively describe the spatial distribution of heavy
pollution by counting the wind direction and wind speed in a certain area. The hourly pollutant
concentrations (i.e., TC, OC, EC, PM2.5 , PM10 , SO2 , NO2 , CO, and O3 ) and meteorological conditions
(e.g., wind speed and wind direction) were determined to analyze the relationships between them.
The correlation between various pollutants was also displayed quantitatively to explore their internal
potential connections.
      The statistical procedures and plotting were performed using SigmaPlot 14.0 (SPSS Inc.,
Chicago, IL, USA) and ArcGIS 10.4.1 (Esri, Redlands, CA, USA) software. The PollutionRose drawing
and backward trajectory analysis were adopted by software R3.6.2 (R Development Core Team, 2009).

3. Results and Discussion

3.1. Temporal Variation of Pollutants
     The average values of TC, EC, OC, CO, SO2 , NO2 , O3 , PM2.5 , and PM10 in the study period were
10.57 ± 3.19 µg/m3 , 1.57 ± 0.46 µg/m3 , 9.00 ± 2.81 µg/m3 , 1.44 ± 0.14 mg/m3 , 59.24 ± 18.73 µg/m3 ,
27.92 ± 9.11 µg/m3 , 30.02 ± 7.92 µg/m3 , 26.95 ± 7.23 µg/m3 , and 39.82 ± 8.69 µg/m3 , respectively (Table 1).
The average concentration of SO2 during the entire period was close to the limits of the secondary
standard of “Ambient Air Quality Standards” (GB3095–2012) (i.e., the annual average concentration
limit of the secondary standard is 60 µg/m3 ), which might be related to the high-intensity coal-burning
emissions from large power plants and industrial production, considered as the largest sources in the
northeastern winter in previous studies [53]. Apart from this, small domestic heating boilers burn
coal in some regions, especially in rural households and suburban areas, which would observably
increase the atmospheric concentration of SO2 because of low-quality coal and backward exhaust
gas treatment devices [54]. Simultaneously, fireworks in marginal regions would also increase the
SO2 concentration in a specific period [55]. The atmospheric concentrations of carbonaceous aerosols
in normal period, whether OC or EC, were greater than in major period, which indicated that more
carbon-intensive activities were concentrated during the normal period. Similar variation trends
were seen for PM2.5 and PM10 . However, the concentrations of SO2 , NO2 , and O3 had completely
different trends: the concentrations during the major period were approximately 1.1–1.5 times those of
the normal period. Comparing with the major period, higher relative humidity, lower temperature,
and lower wind speed were seen in the normal period, which created an environment that would
encourage pollution incidents.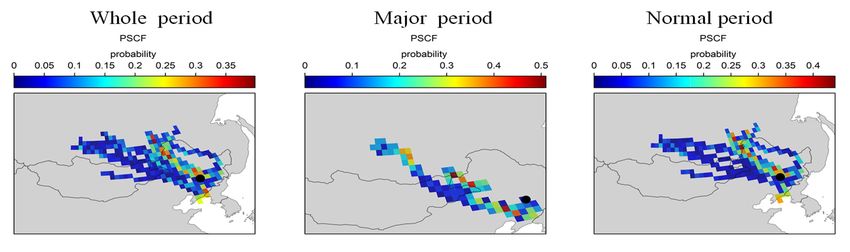
Atmosphere 2020, 11, 991                                                                                        7 of 18

      Table 1. Daily average values of pollutants (i.e., total carbon (TC), organic carbon (OC), elemental carbon
      (EC), CO, SO2 , NO2 , O3 , particulate matter (PM10 and PM2.5 )) and meteorological elements
      (i.e., ambient temperature, relative humidity, and wind speed) in different periods (i.e., major period and
      normal period) of the Spring Festival in Changchun. Except for CO, the unit of remaining pollutants is
      µg/m3 , while for CO, it is mg/m3 ; the units of wind speed, relative humidity, and ambient temperature
      are m/s, %, and ◦ C, respectively.

                                                                      Periods
                           Index
                                                Whole                 Major                Normal
                       TC                    10.57 ± 3.19           9.60 ± 3.29           11.54 ± 2.84
                       EC                     1.57 ± 0.46            1.47 ± 0.47           1.67 ± 0.44
                       OC                     9.00 ± 2.81            8.13 ± 2.93           9.87 ± 2.46
                       CO                     1.44 ± 0.14            1.36 ± 0.10           1.52 ± 0.13
                       SO2                   59.24 ± 18.73         62.77 ± 22.27         55.71 ± 13.97
                       NO2                   27.92 ± 9.11          22.28 ± 6.23           33.56 ± 8.03
                        O3                   30.02 ± 7.92          32.00 ± 7.35           28.04 ± 8.12
                      PM2.5                  26.95 ± 7.23          24.22 ± 7.65           29.69 ± 5.72
                      PM10                   39.82 ± 8.69          39.50 ± 10.43          40.12 ± 6.73
                   Wind speed                 2.30 ± 0.65            2.61 ± 0.69           1.99 ± 0.43
                Relative humidity            49.06 ± 5.93           46.69 ± 6.45          51.43 ± 4.31
               Ambient temperature           −9.41 ± 2.88          −8.69 ± 3.32          −10.12 ± 2.20

      The hourly concentration variations of pollutants during the above festivals are illustrated in
Figures 2 and 3. In the major period, the daily concentration of all pollutants presented a bimodal
trend, with peaks appearing regularly from 11:00 a.m. to 12:00 p.m. and 5:00 p.m. to 10:00 p.m.,
which might be related to the increase in human activities and the unfavorable meteorological
conditions. Concentrated cooking activities during the first peak period (i.e., 11:00 a.m. to 12:00 p.m.)
began to take place, especially in suburban and rural areas, where cooking mainly relies on traditional
coal-fired stoves. Massive burning of coal was the main source of pollutants (e.g., PM, SO2 , NO2 ,
and CO) during this period [56], while higher relative humidity would further increase the nucleation
and aggregation of fine particulate matter, promoting particle formation [57]. Compared with the first
concentration peak, the second peak started at 5:00 p.m. and ended at 10:00 p.m., showing a continuous
upward trend, with a peak that was higher than that of the former. Complicated factors caused this
phenomenon. First, concentrated coal burning for cooking was still the major cause of rising pollution.
Afternoon cooking activities in the northeast winter are generally done from 5:00 p.m. to 6:00 p.m. [58],
which is consistent with the time when pollution started to rise. Continuous pollutant release from
domestic coal during dinner was reported by Liu et al., and the proportion in the evening was higher
than that of other periods [54]. Second, lots of firecrackers being burned aggravated the air pollution.
Burning firecrackers, as the essential form of celebration during the major festivals, was recorded in
urban, suburban, and rural areas. Previous studies have shown that firecracker emissions during the
Spring Festival may increase the atmospheric concentrations of PM10 , SO2 , and NO2 , manifesting a
rise from 6:00 p.m. and a decrease from 12:00 a.m. [55], which was consistent with the firecracker use
in Changchun, indicating that the rising pollutant concentration in this period is inseparable from the
burning of firecrackers. Wind direction is a crucial parameter for the regional pollution as it indicates
the origin of the air mass and the relative position of the measuring sites to the main sources [59,60].
In this study, the wind direction in this region was mainly northeast or northwest, with the average
wind speed of 2.14 m/s. In addition to anthropogenic emissions, poor meteorological environmental
factors (i.e., lower ambient temperature, higher relative humidity, lower atmospheric boundary layer
height, and lower wind speed) also adversely affect pollutant diffusion and deposition [61].
Atmosphere 2020, 11, 991 8 of 18
Atmosphere 2020, 11, x FOR PEER REVIEW 8 of 18
V
I II III IV
40 TC OC EC 25
OC TC(μg/m3)
20
EC(μg/m3)
30
15
20
10
10 5
0 0
800 4
SO₂ CO
CO(mg/m3)
SO2(µg/m3)
600 3
400 2
200 1
0 0
80 O₃ NO₂ 80
O3(μg/m3)
60 60
NO2(µg/m3)
40 40
20 20
0 0
150 PM₁₀ PM₂.₅ 150
PM2.5(µg/m3)
PM10(µg/m3)
100 100
50 50
0 0
50 temperature RH 90
Temperature(℃)
30
RH(%)
60
10
30
−-10
10
−-30
30 0
Precipitation
200
(mm)
0
Atmosphere 2020, 11, x FOR
02-05 PEER
02-07 02-09REVIEW
02-11 02-13 02-15 02-17 02-19 02-21 02-23 02-25 02-27 03-01 03-03 03-05 03-07 9 of 18
in the2.increase
Figure Hourly of PM2.5 andinEC
variations theconcentration in the diurnal
pollutant concentrations variations,
(i.e., especially
total carbon at specific
(TC), organic period
carbon (OC),
(i.e., Figurerush
daily 2. Hourly
hour) variations
[63]. in the pollutant
Changchun is concentrations
densely populated,(i.e., total
with carbon
over (TC),
7.5 organic people
million carbon and 1.7
elemental carbon (EC), particulate matter
(OC), elemental carbon (EC), particulate matter
(PM and PM
2.5 (PM2.5 and ),
10 PM10SO , NO , CO, and
2 ), SO22, NO2, CO, and O 3 ) and meteorological
million motor vehicles. During the normal period, the increase in the concentrationO3of ) and
OC and EC
parameters (i.e., temperature,
meteorological relative
parameters (i.e., humidity,
temperature, precipitation,
relative wind direction,
humidity, precipitation, and wind
wind direction, and speed) in
from 8:30 a.m. to 9:30 a.m. is mainly due to the emission of workers’ motor vehicles. Compared with
Changchun wind during
speed) inthe Changchun
SpringduringFestivalthe Spring Festival
(i.e., from (i.e., from
Lunar Lunar 20 December
20 December to Lunar to Lunar 20
20 January of the
the normal period, most workers would enjoy a short holiday to celebrate the Spring Festival during
January of the following year). The shaded areas represent five typical holiday periods: I (i.e., the
following
the major year). The shaded areas represent five typical holiday periods: I (i.e., the Lunar Little New
Lunarperiod,
Little NewandYear);
the shopping behavior
II (i.e., the Chinese New will increase
Year’s Eve); III significantly, resultingIVin
(i.e., Lunar 5 January); anthe
(i.e., increase in
Year); IISpring
(i.e., the
the frequency Chinese
of motor New
vehicle Year’s
use. Eve);
Moreover,III (i.e.,
low Lunar 5
temperature January);
Lantern Festival), and V (i.e., Chinese Lunar New Year legal holidays, from Lunar 30
IV (i.e.,
significantly the Spring
promoted Lantern
traffic
Festival),
emissions and V to(i.e.,
(e.g.,
December PM 2.5Chinese
Lunar and BC) of
7 January Lunar
ofthe New Year
cold-start
the following legal has
process
year). holidays,
been showed from Lunar
by Gao30 et December
al.’s research tointo
Lunar
on-road of
7 January emissions
the followingin low-temperature
year). areas in the winter (i.e., Changchun) [26].
Significant differences were found in terms of the diurnal variation of various pollutants and
meteorological
20
indicators20
during major3 and normal period 20
(Figure 3).20The
TC OC
results highlighted
3
that
TC OC EC EC
carbonaceous15 aerosols (i.e.,
15 OC and EC)2 and atmospheric15particulate matter 15 (i.e., PM2.5,2 PM10) had the
10 10 10 10
highest concentration peaks at 6:00 p.m.1 and decreased significantly thereafter during normal
1
period;
5 5 5 5
on the contrary,
0
the atmospheric
0
pollutants
0
concentration 0
during major 0
period would 0
continue to
3.2 SO 80
rise after 6:00 CO
p.m. 200
and reached a maximum
60
NO
at 12:00 a.m.,3.2 with
CO
2
concentrations
200 SO
80
much higher
2 NO
than the 2 2
2.4 150 2.4 150 60
daily average.
1.6 This is similar
100 to what 40was reported by Hao 1.6 et al. [62]100when studying 40 the variation
pollutants
characteristics
0.8 of atmospheric
50 pollutant20 concentration during
0.8 the fireworks-burning
50 20 period of the
0 0 0 0 0 0
Spring Festival
50 O in Tianjin,
45 indicating
PM that
60 the
PM
3
sharp rise in
50 pollution concentrations
O2.5
45 PM 10
during
60 PM the same
3 2.5 10
40 40
time in Changchun
30
might
30 also be affected
40 by the short-term
30 concentrated 30 fireworks. In
40 addition, the
20
lower wind 20 speed after 6:00 p.m. during
15 20 the major period 10
in 2018 hindered
15 pollutant20 diffusion and
10
increased its0
5
accumulation 0 in the atmosphere.
0
-5
The PM 2.50 and EC concentrations
5
0
90
were 0
-5 significantly
T
wd 90 RH T wd RH
4 4
higher at 9:003
a.m. compared
60 to at other
-10 times in major or normal period,
3 60 which might
-10 be caused by
2 -15 2 -15
the emissions 1
30
of road vehicles. Previous studies have shown 1 that traffic30 emissions played a key role
0 0 -20 0 0 -20
00:00
03:00
06:00
09:00
12:00
15:00
18:00
21:00
00:00
03:00
06:00
09:00
12:00
15:00
18:00
21:00
00:00
03:00
06:00
09:00
12:00
15:00
18:00
21:00
00:00
03:00
06:00
09:00
12:00
15:00
18:00
21:00
00:00
03:00
06:00
09:00
12:00
15:00
18:00
21:00
00:00
03:00
06:00
09:00
12:00
15:00
18:00
21:00
Maior period Normal period
periods
Figure Figure 3. Diurnal
3. Diurnal concentrationvariations
concentration variations of
of various
variouspollutants
pollutants andand
the trends of meteorological
the trends of meteorological
factors by major and normal period during the Spring Festival in Changchun
factors by major and normal period during the Spring Festival in Changchun City, City, Jilin Province.
Jilin Province.
Note: except for CO, the units of remaining pollutants are µg/m33, while for CO is in mg/m3; the3units
Note: except for CO, the units of remaining pollutants are µg/m , while for CO is in mg/m ; the units of
of wind speed, relative humidity, and ambient temperature are m/s, %, and °C, respectively.
wind speed, relative humidity, and ambient temperature are m/s, %, and ◦ C, respectively.
The correlations between the nine pollutant concentrations in this study during the Spring
Festival of Changchun in 2018 were displayed for the major and normal period, showing a clear
difference between them (Figure 4). The correlation coefficient between OC and EC in normal period
is 0.85, which represents a better correlation, being significantly higher than in the major period (i.e.,
0.63). Cao et al. and Turpin et al. reported that the source of carbon aerosol particles can be
distinguished by the relationship between OC and EC—a better correlation indicates more unitary
pollutant sources released [52,64]. In this study, the correlation of OC and EC during the normal
period was higher than during the major period, demonstrating that the source of carbonaceousAtmosphere 2020, 11, 991 9 of 18
Significant differences were found in terms of the diurnal variation of various pollutants and
meteorological indicators during major and normal period (Figure 3). The results highlighted that
carbonaceous aerosols (i.e., OC and EC) and atmospheric particulate matter (i.e., PM2.5 , PM10 ) had
the highest concentration peaks at 6:00 p.m. and decreased significantly thereafter during normal
period; on the contrary, the atmospheric pollutants concentration during major period would continue
to rise after 6:00 p.m. and reached a maximum at 12:00 a.m., with concentrations much higher than the
daily average. This is similar to what was reported by Hao et al. [62] when studying the variation
characteristics of atmospheric pollutant concentration during the fireworks-burning period of the
Spring Festival in Tianjin, indicating that the sharp rise in pollution concentrations during the same
time in Changchun might also be affected by the short-term concentrated fireworks. In addition,
the lower wind speed after 6:00 p.m. during the major period in 2018 hindered pollutant diffusion and
increased its accumulation in the atmosphere. The PM2.5 and EC concentrations were significantly
higher at 9:00 a.m. compared to at other times in major or normal period, which might be caused
by the emissions of road vehicles. Previous studies have shown that traffic emissions played a key
role in the increase of PM2.5 and EC concentration in the diurnal variations, especially at specific
period (i.e., daily rush hour) [63]. Changchun is densely populated, with over 7.5 million people and
1.7 million motor vehicles. During the normal period, the increase in the concentration of OC and EC
from 8:30 a.m. to 9:30 a.m. is mainly due to the emission of workers’ motor vehicles. Compared with
the normal period, most workers would enjoy a short holiday to celebrate the Spring Festival during
the major period, and the shopping behavior will increase significantly, resulting in an increase in the
frequency of motor vehicle use. Moreover, low temperature significantly promoted traffic emissions
(e.g., PM2.5 and BC) of the cold-start process has been showed by Gao et al.’s research into on-road
emissions in low-temperature areas in the winter (i.e., Changchun) [26].
The correlations between the nine pollutant concentrations in this study during the Spring
Festival of Changchun in 2018 were displayed for the major and normal period, showing a clear
difference between them (Figure 4). The correlation coefficient between OC and EC in normal period
is 0.85, which represents a better correlation, being significantly higher than in the major period
(i.e., 0.63). Cao et al. and Turpin et al. reported that the source of carbon aerosol particles can be
distinguished by the relationship between OC and EC—a better correlation indicates more unitary
pollutant sources released [52,64]. In this study, the correlation of OC and EC during the normal period
was higher than during the major period, demonstrating that the source of carbonaceous aerosol was
relatively simple, which might reflect the combined contribution of vehicle exhaust gas and coal-fired
heating [65]. By contrast, the coefficient of major period was low, reflecting the more complicated
source of atmospheric carbonaceous aerosol during this period. The major period of the Spring Festival
is generally considered as the concentrated time of firework burning, which would release a large
amount of pollutants in a short time (e.g., heavy metal ions, black carbon, and particulate matter),
increasing the chemical transformation of atmospheric substances [66]. Although Changchun has
implemented a Firecrackers Burning Prohibition Plan (FBPP) since 2016, many regions (i.e., suburban
areas and rural areas) still burn firecrackers as the most common form of celebrating the Chinese
New Year, limiting the effectiveness of the control policy. The correlation coefficient between SO2
and PM2.5 was less than 0.3, displaying a weak correlation whether in the major or normal period,
which directly reflects the positive effect of ultralow emission coal-fired power plants due to the coal
combustion in power or heating plants being the foremost source of the above emissions during the
winter in the northeastern China. CO and PM2.5 illustrated a strong correlation throughout the study
period, especially in normal period, when the value was above 80, possibly caused by insufficient coal
combustion from domestic heating boilers.Atmosphere 2020, 11, x FOR PEER REVIEW 10 of 18
correlation
Atmosphere throughout
2020, 11, 991 the study period, especially in normal period, when the value was above
10 of80,
18
possibly caused
Atmosphere 2020, by
11, xinsufficient coal combustion from domestic heating boilers.
FOR PEER REVIEW 10 of 18
correlation throughout the study period, especially in normal period, when the value was above 80,
possibly caused by insufficient coal combustion from domestic heating boilers.
Figure 4.
Figure 4. Correlation
Correlation ofof atmospheric
atmospheric pollutants
pollutants inin different
different periods
periods (i.e.,
(i.e., major
major and
and normal
normal periods)
periods)
of Figure
the 4. Correlation
Spring Festival inofChangchun
atmosphericin pollutants
2018. Thein correlation
different periods (i.e.,between
degree major and normal periods)
pollutants is displayed
of the Spring Festival in Changchun in 2018. The correlation degree between pollutants is displayed
of the Spring Festival in Changchun in 2018. The correlation degree between pollutants is displayed
synergistically
synergistically by the
by theshape
shape(i.e.,
(i.e.,ellipses),
ellipses),colors,
colors,and
andnumerical
numericalvalues.
values.
synergistically by the shape (i.e., ellipses), colors, and numerical values.
3.2.
3.2. Relationship of Pollutants
Pollutants with
with Wind
Wind Speed
Speed and
and Wind
Wind Direction
Direction
3.2. Relationship of Pollutants with Wind Speed and Wind Direction
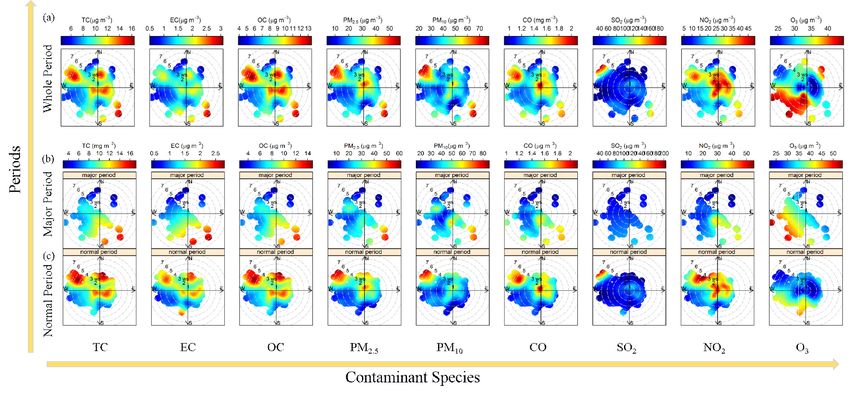
The regional
TheTheregional transmission
regional transmission
transmission ofofpollutants
ofpollutants
pollutants was also
was
was influenced
also
also influenced
influenced bybydifferent
by wind
different
different directions
windwind and
directions
directions and windand
speeds
windwind[67,68].
speeds
speeds In[67,68].
the whole
[67,68]. InInthe period,
thewhole the
wholeperiod,
period,areasthe
thewith high
areas
areas with
with concentrations
high
high of TC,ofOC,
concentrations
concentrations of PM
TC, TC,2.5,
OC, OC,
PM CO,
2.5,PMand
CO,2.5, SO
CO,2
were attributed
and and
SO were
2 SO largely
attributed
2 were to largely
attributed the northwesterly,
largely totothe southeasterly,
the northwesterly,
northwesterly, and southerly
southeasterly,
southeasterly, andand wind with
windspeed
southerly
southerly wind of 4–7speed
with
with speed m/s;
whileofhigh
of 4–7 4–7 values
m/s;m/s; while
while ofhigh
highNO andof
2values
values O
of3NO were
NO and
22 andfrom northwesterly
O33 were
were from and southwesterly
fromnorthwesterly
northwesterly andand wind wind
southwesterly
southwesterlywithwind speeds
with of
with
3–7 speeds
and
speeds 1–6
of ofm/s,
3–7 3–7
and and1–61–6
respectively
m/s,m/s,respectively
respectively
(Figure 5a).(Figure(Figure 5a).
5a).Generally,
Generally, the thethe
pollution
Generally, pollution
situation situation
pollution in theinnormal
in situation
the normal period
the normal was
more period
waswas
serious more
than inserious
the majorthanin
inthe the major
period. major period.
Except for OExcept forfor
O3O
, the pollutant massmass
concentration
period more serious than period. 3 , the pollutant
Except mass
3, the concentration
pollutant during the
concentration
during
normal the
period normal
wasperiod period
highly was was highly
similar during similar during
the during the
whole period, whole period,
occurring occurring mainly
the localinlocal
in the
during the normal highly similar the whole period, mainly
occurring in mainly emission
the local
emission and northwesterly wind with speed of 0–7 m/s. Compared to the normal period, high
and northwesterly
emission wind with speed
and northwesterly wind of with 0–7speed
m/s. Compared
of 0–7 m/s. to the normal period,
Compared high pollution
to the normal period,levelshigh
pollution levels appeared to the southeast during the major period, with the wind speed of only 5–7 m/s
appeared
pollution
(Figure
to5b,c).
the appeared
levels southeastto during the major
the southeast period,
during thewith
major the wind with
period, speedthe ofwind
only 5–7 m/s
speed of(Figure
only 5–75b,c). m/s
(Figure 5b,c).
Figure 5. The
Figure relationship
5. The relationshipofof
pollutant
pollutantconcentration (fromleft
concentration (from lefttotoright:
right:
TC,TC,
EC,EC,
OC,OC,
PM2.5PM , PM , ,PM
2.510 10 , CO,
CO,
SO2 ,SO
NO2, 2
NO, and O3O
2, and ) to wind
3) to winddirection
direction and wind
windspeed
speedduring
during
thethe
20182018 Spring
Spring Festival
Festival (i.e., (i.e.,
from from
LunarLunar
20 December to Lunar 20 January of the following year) in Changchun. (a) Relationship of various
Figure 5. The relationship of pollutant concentration (from left to right: TC, EC, OC, PM2.5, PM10, CO,
pollutant concentration to wind direction and wind speed throughout the entire Spring Festival. (b,c)
SO2, NO2, and O3) to wind direction and wind speed during the 2018 Spring Festival (i.e., from Lunar
Relationship of pollutant concentration to wind direction and wind speed in the major and normal
period of the Spring Festival, respectively.spatiotemporal variation and identify sources of carbonaceous aerosols (Figure 6). A significant
influence of wind speed and wind direction was found in this study on the concentration distribution
of PM2.5, OC, and EC, which varied between daylight and nighttime. For the whole period, a high
PM2.5 concentration was recorded north of the monitoring site, with wind speeds of 1–5 m/s in the
daylight,
Atmosphere which
2020, 11,was
991 higher than at nighttime; the PM2.5 pollution that occurred around the station
11 ofat
18
nighttime was more serious, which explains why the release of fine particles dominates the local
emissions during this period. The concentrations of OC and EC from the north at nighttime was
Analyzing the relationships between EC, OC, and PM2.5 and wind speeds and wind directions,
obviously lower than in the daylight, indicating that the initial carbonaceous aerosol emissions were
which were highly correlated during the study period, can help us to improve our understanding
mostly concentrated in the daylight, which was consistent with the concentration variation of PM2.5.
of spatiotemporal variation and identify sources of carbonaceous aerosols (Figure 6). A significant
It is noted that nighttime PM2.5 concentrations greater than 40 µg/m3 appeared in the central region
influence of wind speed and wind direction was found in this study on the concentration distribution
and the surrounding regions had a low or calm wind state (i.e., the hourly wind speed was 1–3 m/s).
of PM2.5 , OC, and EC, which varied between daylight and nighttime. For the whole period, a high
The relationships among pollutant concentrations, wind directions, and wind speeds, divided
PM2.5 concentration was recorded north of the monitoring site, with wind speeds of 1–5 m/s in the
by different periods, suggested that more intensive emissions occurred during the normal period and
daylight, which was higher than at nighttime; the PM2.5 pollution that occurred around the station
were concentrated in the northwestern and surrounding regions of the monitoring site. On the one
at nighttime was more serious, which explains why the release of fine particles dominates the local
hand, the factories were closed during major holidays, greatly reducing emissions; on the other hand,
emissions during this period. The concentrations of OC and EC from the north at nighttime was
high pollutant concentrations were regularly concentrated northwest of the monitoring site, where
obviously lower than in the daylight, indicating that the initial carbonaceous aerosol emissions were
the rural and suburban areas are located. Pollutant emissions were closely related to local human
mostly concentrated in the daylight, which was consistent with the concentration variation of PM2.5 .
activities and regulatory policies, especially fireworks-burning prohibitions during the period. Thus,
It is noted that nighttime PM2.5 concentrations greater than 40 µg/m3 appeared in the central region
large-scale illegal fireworks burning, coupled with the meteorological conditions, resulted in higher
and the surrounding regions had a low or calm wind state (i.e., the hourly wind speed was 1–3 m/s).
pollutant concentrations in rural and marginal areas.
RelationshipofofPM
Figure 6.6. Relationship
Figure PM 2.5,2.5 , OC,
OC, andand
ECEC concentration
concentration to wind
to wind direction
direction andand wind
wind speed
speed in
in Changchun
Changchun by periods
by periods (i.e., (a)(i.e.,
whole, (a) (b)
whole,
major,(b)
andmajor, and (c)
(c) normal) andnormal)
circadianand circadian
rhythms rhythms
(i.e., daylight
(i.e.,
vs. daylight vs. nighttime).
nighttime).
The relationships among pollutant concentrations, wind directions, and wind speeds, divided by
different periods, suggested that more intensive emissions occurred during the normal period and
were concentrated in the northwestern and surrounding regions of the monitoring site. On the one
hand, the factories were closed during major holidays, greatly reducing emissions; on the other hand,
high pollutant concentrations were regularly concentrated northwest of the monitoring site, where the
rural and suburban areas are located. Pollutant emissions were closely related to local human activities
and regulatory policies, especially fireworks-burning prohibitions during the period. Thus, large-scale
illegal fireworks burning, coupled with the meteorological conditions, resulted in higher pollutant
concentrations in rural and marginal areas.Atmosphere 2020, 11,
Atmosphere 2020, 11, 991
x FOR PEER REVIEW 12 of
12 of 18
18
3.3. Pollutant Transportation Trajectories and Potential Sources
3.3. Pollutant Transportation Trajectories and Potential Sources
The backward trajectory, an analysis method for atmospheric pollutants transport and diffusion,
The backward trajectory, an analysis method for atmospheric pollutants transport and diffusion,
was used with pollutant concentration data to compute the backward air flow trajectories,
was used with pollutant concentration data to compute the backward air flow trajectories, characterizing
characterizing the influence of air mass from the source direction on the pollutant’s concentration
the influence of air mass from the source direction on the pollutant’s concentration during the major
during the major festival period in Changchun (Figure A1). The direction of the airflow trajectory
festival period in Changchun (Figure A1). The direction of the airflow trajectory was mainly in local,
was mainly in local, northwestward, and northward, carrying a large amount of particulate matter
northwestward, and northward, carrying a large amount of particulate matter and gaseous pollutants,
and gaseous pollutants, but clear differences in terms of the contribution of various pollutants to the
but clear differences in terms of the contribution of various pollutants to the overall concentration
overall concentration can be observed from the three directions. Regarding carbonaceous aerosols
can be observed from the three directions. Regarding carbonaceous aerosols (i.e., OC and EC) and
(i.e., OC and EC) and particulate matter (i.e., PM2.5, PM10), the pollutants were mainly based on local
particulate matter (i.e., PM2.5 , PM10 ), the pollutants were mainly based on local pollution sources,
pollution sources, followed by the long-distance transportation from the northwest airflow trajectory
followed by the long-distance transportation from the northwest airflow trajectory from eastern
from eastern Mongolia, Inner Mongolia, Baicheng, and Songyuan, and a fraction of pollutants from
Mongolia, Inner Mongolia, Baicheng, and Songyuan, and a fraction of pollutants from northern
northern Heilongjiang Province (e.g., Qiqihar and Daqing). The emission of higher SO2 and EC and
Heilongjiang Province (e.g., Qiqihar and Daqing). The emission of higher SO2 and EC and lower
lower PM2.5 generally characterize the insufficient coal combustion. In Northeast China, coal burning
PM2.5 generally characterize the insufficient coal combustion. In Northeast China, coal burning in
in winter can be summarized into three aspects: coal fired in power and heating plants for heating
winter can be summarized into three aspects: coal fired in power and heating plants for heating supply,
supply, household boilers for heating and cooking, and industrial production [53]. Among them,
household boilers for heating and cooking, and industrial production [53]. Among them, industrial coal
industrial coal consumption will be significantly weakened because of the factory shutdowns for
consumption will be significantly weakened because of the factory shutdowns for holiday celebrations.
holiday celebrations. Although local pollution sources dominated for CO emissions, the short-
Although local pollution sources dominated for CO emissions, the short-distance and high-intensity
distance and high-intensity transmission from Qiqihar, Daqing, and Suihua of Heilongjiang Province
transmission from Qiqihar, Daqing, and Suihua of Heilongjiang Province cannot be ignored. During the
cannot be ignored. During the study period, local emissions were not the foremost source of high
study period, local emissions were not the foremost source of high atmospheric SO2 concentrations;
atmospheric SO2 concentrations; long-distance transmission from northeastern Changchun was
long-distance transmission from northeastern Changchun was dominant. The above results indicate
dominant. The above results indicate that pollutants during the Spring Festival in Changchun not
that pollutants during the Spring Festival in Changchun not only originated from localized source
only originated from localized source emissions, but the airflow transportation from the
emissions, but the airflow transportation from the northwestward and northward could also adversely
northwestward and northward could also adversely affect air quality.
affect air quality.
Based on the potential source contribution factor weights (PSCF) method, which can
Based on the potential source contribution factor weights (PSCF) method, which can
semiquantitatively obtain the distribution of potential pollution source and the concentration weight
semiquantitatively obtain the distribution of potential pollution source and the concentration weight
of airflow trajectories [69], we analyzed the pollution contribution of trajectories and potential sources
of airflow trajectories [69], we analyzed the pollution contribution of trajectories and potential sources
of PM2.5 during the 2018 Spring Festival in Changchun (Figure 7). Higher PSCF values were identified
of PM2.5 during the 2018 Spring Festival in Changchun (Figure 7). Higher PSCF values were identified
as significant potential sources that have a substantial effect on PM2.5, and vice versa. Regardless of
as significant potential sources that have a substantial effect on PM2.5 , and vice versa. Regardless of the
the period, the potential sources of pollutants were concentrated in the monitoring site and its
period, the potential sources of pollutants were concentrated in the monitoring site and its surrounding
surrounding areas, southwest of Heilongjiang Province, and east of the East Fourth League. The scale
areas, southwest of Heilongjiang Province, and east of the East Fourth League. The scale of potential
of potential source areas during major period was significantly lower than during normal period.
source areas during major period was significantly lower than during normal period. These results
These results indicated that the distribution of air pollution concentration during the Changchun
indicated that the distribution of air pollution concentration during the Changchun Spring Festival of
Spring Festival of 2018 was not only affected by localized pollution emissions but also by long-
2018 was not only affected by localized pollution emissions but also by long-distance transportation of
distance transportation of pollution from regions outside the province by strong winds.
pollution from regions outside the province by strong winds.
Figure 7. Potential source contribution factor weights (PSCF) distribution characteristics of PM2.5 in
Figure 7. Potential source contribution factor weights (PSCF) distribution characteristics of PM2.5 in
different periods in Changchun during the 2018 Spring Festival.
different periods in Changchun during the 2018 Spring Festival.
3.4. Variation Characteristics of OC/EC and SOC
3.4. Variation Characteristics of OC/EC and SOC
Turpin et al. [52] indicated that the value of OC/EC > 2 is used as an indicator of SOC formation
whenTurpin et al. [52]
EC mainly fromindicated thatcombustion
incomplete the value ofemissions
OC/EC > 2ofiscoal
used as an indicator
consumption andoftraffic.
SOC formation
Our data
when EC mainly from incomplete combustion emissions of coal consumption and traffic. Our data
demonstrated that the minimum ratio of OC/EC in the major period and normal period was 3.6 andYou can also read