Measurement report: Exploring NH3 behavior in urban and suburban Beijing: comparison and implications
←
→
Page content transcription
If your browser does not render page correctly, please read the page content below
Atmos. Chem. Phys., 21, 4561–4573, 2021
https://doi.org/10.5194/acp-21-4561-2021
© Author(s) 2021. This work is distributed under
the Creative Commons Attribution 4.0 License.

Measurement report: Exploring NH3 behavior in urban and
suburban Beijing: comparison and implications
Ziru Lan1 , Weili Lin1 , Weiwei Pu2 , and Zhiqiang Ma2,3
1 College of Life and Environmental Sciences, Minzu University of China, Beijing, 100081, China
2 Environmental  Meteorological Forecast Center of Beijing–Tianjin–Hebei, Beijing, 100089, China
3 Beijing Shangdianzi Regional Atmosphere Watch Station, Beijing, 101507, China

Correspondence: Weili Lin (linwl@muc.edu.cn)

Received: 8 October 2020 – Discussion started: 2 November 2020
Revised: 22 February 2021 – Accepted: 23 February 2021 – Published: 24 March 2021

Abstract. Ammonia (NH3 ) plays an important role in par-           ences between the urban and suburban sites. The reasons for
ticulate matter formation; hence, its atmospheric level is rel-    the different relationships need to be investigated in future
evant to human health and climate change. Due to different         studies. Higher wind speed mainly from the northwest sec-
relative distributions of NH3 sources, concentrations of at-       tor lowered the NH3 mixing ratios at both sites. Similarly to
mospheric NH3 may behave differently in urban and rural            other primary pollutants in Beijing, the NH3 mixing ratios
areas. However, few parallel long-term observations of NH3         were high when impacted by air masses from the southern
exist to reveal the different behaviors of NH3 concentrations      sector.
at urban and rural sites in a same region. In this study, online
ammonia analyzers were used to continuously observe atmo-
spheric NH3 concentrations at an urban site and a suburban
site in Beijing from 13 January 2018 to 13 January 2019. The       1   Introduction
observed mixing ratio of NH3 averaged 21 ± 14 ppb (range
of 1.6–133 ppb) at the urban site and 22 ± 15 ppb (range of        Ammonia (NH3 ) is the most abundant alkaline trace gas in
0.8–199 ppb) at the suburban site. The NH3 mixing ratios at        the atmosphere (Meng et al., 2017). An excessive NH3 con-
the urban and suburban sites exhibited similar seasonal vari-      centration directly harms the ecosystem; causes water eu-
ations, with high values in summer and spring and low values       trophication and soil acidification; and leads to forest soil
in autumn and winter. The hourly mean NH3 mixing ratios at         erosion, biodiversity reduction, and carbon uptake variations
the urban site were highly correlated (R = 0.849, P < 0.01)        (Pearson and Stewart, 1993; Reay et al., 2008; Van Breemen
with those at the suburban site; however, the average diurnal      et al., 1983; Erisman et al., 2007). NH3 can react with acidic
variations in the NH3 mixing ratios at the urban and suburban      gases to form ammonium salts, which might significantly in-
sites differed significantly, which implies different contribu-    fluence the mass concentration and composition of particu-
tions from NH3 sources and sinks at the urban and suburban         late matter (Wu et al., 2009). As major components of fine
sites. In addition to the emission sources, meteorological fac-    particulate matter, ammonium salts contribute largely to the
tors were closely related to the changes in the NH3 concen-        scattering of solar radiation and, hence, influence climate
trations. For the same temperature (relative humidity) at the      change (Charlson et al., 1991). Therefore, atmospheric NH3
urban and suburban sites, the NH3 mixing ratios increased          is one of the key species relevant to human health as well as
with relative humidity (temperature). Relative humidity was        ecosystem and climate change.
the factor with the strongest influence on the NH3 mixing             After the implementation of policies such as the “12th
ratio in different seasons at the two sites. The relationships     Five-Year Plan for the Key Regional Air Pollution Prevention
between the NH3 concentrations and temperature (relative           and Control in Key Regions” (Ministry of Ecology and En-
humidity) varied from season to season and showed differ-          vironment of the People’s Republic of China, 2012) and the
                                                                   “Air Pollution Prevention and Control Action Plan” (General

Published by Copernicus Publications on behalf of the European Geosciences Union.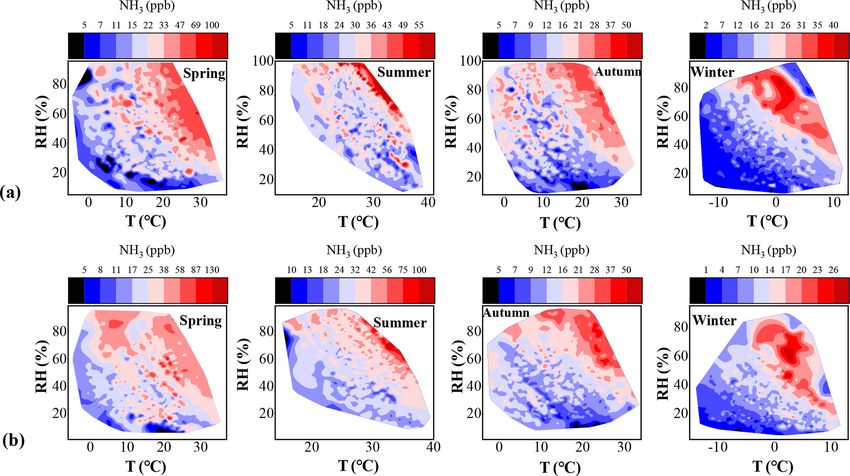
4562 Z. Lan et al.: Exploring NH3 behavior in urban and suburban Beijing
Office of the State Council, PRC, 2013), China, especially Currently, NH3 is not included in the routine environmen-
the capital city Beijing, has been effectively controlling the tal monitoring operation in China. Research data on NH3
emissions of sulfur dioxide (SO2 ) and nitrogen oxide (NOx ), monitoring, particularly on the synchronous observations of
which are key precursors of fine particles. However, the pol- NH3 concentrations with a high temporal resolution in ur-
lution caused by fine particles is still serious (Krotkov et al., ban and suburban areas, are relatively scarce. In this study,
2016; UN Environment, 2019), particularly in winter in the high-time-resolution observations of NH3 were obtained si-
North China Plain, where excess NH3 promotes haze forma- multaneously at an urban site and a suburban site in Beijing.
tion through heterogeneous reactions (Ge et al., 2019). Stud- The variation characteristics and influencing factors of the
ies have indicated that when the SO2 and NOx concentra- NH3 concentration were analyzed with meteorological data
tions are reduced to a certain extent, reducing NH3 emissions to provide a scientific basis for NH3 pollution control in Bei-
is the most economical and effective method to decrease jing.
the PM2.5 concentration (Pinder et al., 2008). In China, the
main anthropogenic sources of NH3 are livestock and poul-
try feces (54 %) and fertilizer volatilization (33 %) (Huang et 2 Materials and methods
al., 2012). Moreover, the atmospheric NH3 concentration in
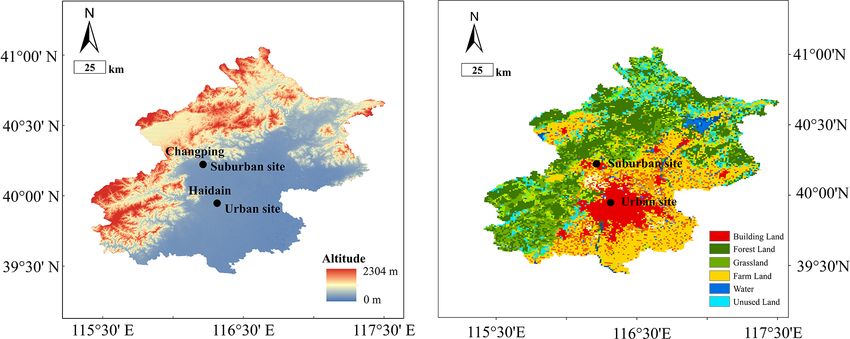
2.1 Measurement sites
China has increased with the expansion of agricultural activi-
ties, control of SO2 and NOx , and an increase in temperature From January 2018 to January 2019, continuous and simul-
(Warner et al., 2017). This increase in the NH3 concentration taneous observations of atmospheric NH3 were conducted
might weaken the effectiveness of SO2 and NOx emission at an urban site and a suburban site in Beijing. The urban
control in reducing PM2.5 pollution (Fu et al., 2017). site was located on the roof of the Science and Technology
The North China Plain is a region with high NH3 emis- Building of Minzu University of China (39.95◦ N, 116.32◦ E,
sions (Zhang et al., 2017), and Beijing has one of the highest altitude: 102 m) and the suburban site was in the Changping
NH3 concentrations in the world (Chang et al., 2016b; Pan et Meteorological Station (40◦ 130 N, 116◦ 130 E; 77 m altitude).
al., 2018). Compared with studies on pollutants such as SO2 The suburban site is in the northwestern direction relative to
and NOx , considerably fewer studies have been conducted the urban site, and the shortest distance between these two
on the NH3 concentration in Beijing. Chang et al. (2016a) sites is approximately 32 km (Fig. 1). More farmland and
collected gaseous NH3 samples during the 2014 APEC grassland is located around the suburban site than the urban
(Asia-Pacific Economic Cooperation) summit (18 October site.
to 29 November 2014) in the Beijing urban area and con-
cluded that the overall contributions of traffic, garbage, live- 2.2 Measurements and data acquisition
stock, and fertilizers to the NH3 concentration were 20.4 %,
25.9 %, 24.0 %, and 29.7 %, respectively. According to the NH3 concentrations were measured using two NH3 analyzers
data from Huang et al. (2012), the NH3 emissions in Beijing (Economical ammonia analyzer, Los Gatos Research Inc.,
were from livestock and poultry farming (34.55 %), nitrogen- USA), which have a minimum detection limit of < 0.2 ppb
fixing plants (33.57 %), fertilizer use (13.06 %), household and a maximum drift of 0.2 ppb over 24 h. The NH3 ana-
garbage treatment (8.29 %), traffic emissions (5.20 %), in- lyzers were deployed in air-conditioned rooms. These an-
dustrial emissions (0.14 %), biomass combustion (0.42 %), alyzers use off-axis integrated cavity output spectroscopy
and agricultural soil (0.84 %). Zhang (2016) measured the (OA-ICOS) technology, which is a fourth-generation cavity-
NH3 concentrations in urban and rural areas of Beijing from enhanced absorption technique, to simultaneously measure
January to July 2014 and found that the NH3 concentration NH3 and water vapor (H2 O) in the atmosphere. The incident
in urban areas was approximately 65 % higher than that in laser beam of the OA-ICOS technology deviates from the op-
rural areas. Meng et al. (2011) reported that the highest NH3 tical axis, which differs from the traditional coaxial incidence
concentration in Beijing occurred in summer and the low- mode. The axial incidence mode of the OA-ICOS technology
est concentration occurred in winter, and their results indi- can increase the optical path, stimulate additional high-order
cated that traffic is a significant source of NH3 in urban ar- transverse modes, effectively suppress the noise of the cavity
eas. Zhang et al. (2018) reported the vertical variability of mode, reduce the cross interferences and errors due to con-
NH3 in urban Beijing based on 1-year passive sampling in taminants existing in the cavity, and improve the detection
2016–2017 and concluded that local sources such as traffic sensitivity (Baer et al., 2002, 2012). The analyzer method is
emissions were important contributors to urban NH3 . Meng a quasi-absolute measurement, which theoretically does not
et al. (2020) investigated the significant increase in winter require calibration. However, to ensure the comparability of
NH3 and its contribution to the increasing nitrate in PM2.5 the obtained data with other monitoring data, NH3 standard
from 2009 to 2016, and they also concluded that vehicle ex- gas (Beijing AP BAIF Gases Industry Co., Ltd.) was used
haust was an important contributor to NH3 in urban Beijing for a comparison measurement before the observation. The
in winter. recorded concentrations were revised with respect to the ref-
erence NH3 concentration in the standard gas mixture.
Atmos. Chem. Phys., 21, 4561–4573, 2021 https://doi.org/10.5194/acp-21-4561-2021
Z. Lan et al.: Exploring NH3 behavior in urban and suburban Beijing                                                                     4563

Figure 1. Location of the observation sites, the topography, and the land use for Beijing city.

   Ambient air was drained at > 0.4 L min−1 through Teflon
lines (1/40 o.d.) from a manifold. The lengths of the Teflon
lines were designed to be as short as possible (less than 2 m
from the manifold). Particulate matter was filtered by Teflon
membranes with a pore size of less than 5 µm. As NH3 easily
“sticks” to surfaces (such as the inside walls of tubes), heated
sample lines have been suggested by many measurement
studies. However, according to our laboratory test (Fig. S1),
when the heating (70 ◦ C) was on, there was a peak lasting
5–6 min that then deceased to normal levels in ambient air,
which means that a new balancing process was established in
less than 10 min. This suggests that heating is not necessarily
a solution for NH3 sticking. Maintaining the relatively sta-
ble balance between adsorption and desorption of NH3 in the
sampling system is important. When tested using air with dif-
ferent humidity levels, only very sharp changes in humidity
obviously influenced and altered the balance, and a new bal-              Figure 2. Temporal variations in the hourly average NH3 mixing ra-
ance required tens of minutes to be reestablished (Fig. S2).              tios, temperatures (T ), and relative humidity (RH) at the urban and
                                                                          suburban stations in Beijing. Continuous thick lines were smoothed
Under normal weather conditions, humidity changes in a rel-
                                                                          with 168 points (7 d) using the Savitzky–Golay method.
atively smooth way unless a quickly changing weather sys-
tem, like rain, is approaching. The minute-level data were
converted into hourly averages during the data analysis pro-                 In total, 7645 and 8342 valid hourly mean observations
cess, and the hourly resolution can smooth the effect caused              were obtained for the urban (Haidian) and suburban (Chang-
by variations in humidity and temperature during the obser-               ping) sites, respectively. In addition, the urban and suburban
vation to some extent.                                                    meteorological data (temperature, relative humidity, wind di-
   The balancing idea was also used to carry out multi-point              rection, and wind speed) during the sampling period were ob-
calibrations on the NH3 analyzers (Fig. S3). A high mix-                  tained from the Haidian Meteorological Observation Station
ing ratio (e.g., 400 ppb or higher) of NH3 mixing gases was               and Changping Meteorological Station, respectively.
firstly produced by a dynamic diluter and measured by the
NH3 analyzers overnight. After the signals reached a sta-
ble level, other lower span values were switched in turn. At              3     Results and discussion
each span point, the measurement time was at least 40 min or
longer. A linear regression function was then obtained with               3.1    Overall variations in the NH3 mixing ratios
an R 2 higher than 0.999. Nowadays, NH3 in a compressed
gas cylinder is also trustworthy, as confirmed by the compar-             Figure 2 displays the time series variations in the NH3 mix-
ison with the NH3 standard in a permeation tube (Fig. S4).                ing ratios, temperatures, and relative humidity at the urban
                                                                          and suburban sites in Beijing. At the urban site, the mean

https://doi.org/10.5194/acp-21-4561-2021                                                     Atmos. Chem. Phys., 21, 4561–4573, 2021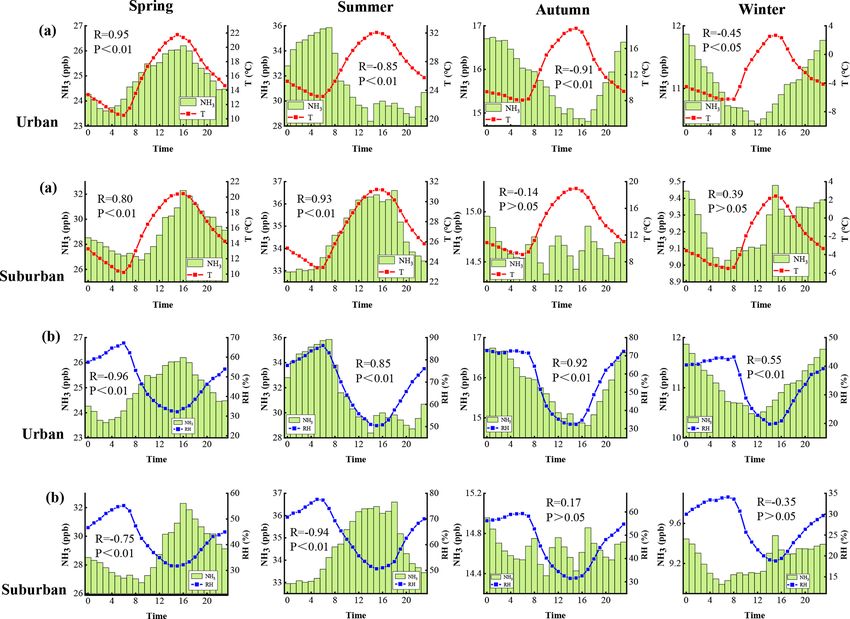
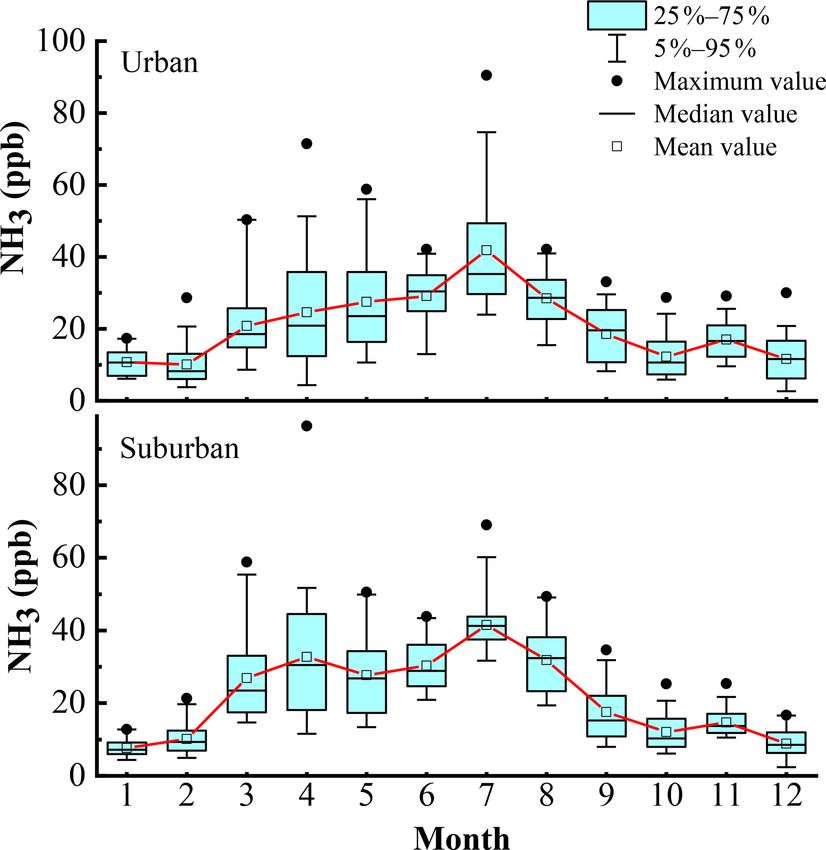
4564                                                  Z. Lan et al.: Exploring NH3 behavior in urban and suburban Beijing

±1σ , median, maximum, and minimum values of the hourly
average NH3 mixing ratio during the observation period were
21 ± 14, 17, 133 and 1.6 ppb, respectively. At the suburban
site, the corresponding values were 22 ± 15, 18, 199, and
0.8 ppb, respectively. The annual average and range of the
NH3 mixing ratio at the suburban site were marginally higher
than those at the urban site. The characteristics of the weekly
smoothed data indicate that the NH3 variations and temper-
ature and humidity fluctuations at the two sites were practi-
cally consistent, which suggests that both sites were under
the influence of similar weather systems. The hourly mean
NH3 concentrations at the urban site were significantly corre-
lated (R = 0.849, P < 0.01) with those at the suburban site.
   Table 1 shows the comparison of the atmospheric NH3
concentrations (ppb) observed in different areas. Meng et
al. (2011) obtained an average NH3 mixing ratio of 22.8 ±
16.3 ppb for the period from 2008 to 2010 in the Beijing
urban area, which is very close to our result (21 ± 14 ppb)
for 2018–2019. Therefore, the annual average NH3 mix-
ing ratio in urban Beijing did not change significantly from
2008 to 2019. Moreover, results from this study and Meng
et al. (2011) indicate that the NH3 concentrations at the ur-      Figure 3. Monthly statistical variation in the NH3 mixing ratios at
ban and suburban sites were higher than those in the back-         the urban and suburban sites in Beijing.
ground areas. The observed NH3 concentrations in Beijing
were higher than those in northwestern China (Meng et al.,
2010) and the Yangtze River Delta region (Chang et al.,            cities in China and much higher than those observed in de-
2019). The average annual NH3 concentration in the urban           veloped countries in America, Europe, and Asia.
area of Shanghai, a megacity in Southeast China (31◦ N), was
approximately 50 % lower than that in urban Beijing. This          3.2   Seasonal variations
might be related to the fact that the North China Plain, in
which Beijing is located, is one of the most intensive agricul-    Figure 3 displays the monthly statistics for the NH3 mixing
tural production regions in China. The differences in the soil     ratios at the urban and suburban sites in Beijing. The sea-
properties of Beijing and Shanghai may be another reason           sonal variations in the NH3 mixing ratios were very similar
for this difference, as the loss of soil NH3 can increase with     at the urban and suburban sites, with higher mixing ratios
an increase in the soil pH (Ju et al., 2009). Shanghai and its     in the spring and summer and low values in the autumn and
surrounding areas are dominated by the acidic soil of paddy        winter (Table 2). The daily mean concentrations fluctuated
fields (Zhao et al., 2009), whereas Beijing is dominated by        considerably in the spring, particularly in April. The high-
the alkaline soils of dry lands (Wei et al., 2013). In addition,   est mean NH3 concentrations at the urban and suburban sites
the climate in Beijing is much drier than in Shanghai; thus,       were 42 ± 17 and 42 ± 8.2 ppb, respectively. Both occurred
less atmospheric NH3 can be removed by wet deposition in           in July, when the NH3 concentrations also fluctuated consid-
Beijing compared with Shanghai.                                    erably. On average, the seasonal NH3 mixing ratios at the
   Table 1 also shows observational results of atmospheric         urban and suburban sites can be arranged as follows: sum-
NH3 from some other countries. The NH3 concentrations in           mer > spring > autumn > winter. The main grain crops in the
the USA (Edgerton et al., 2007; Nowak et al., 2006; Zhou et        rural area of Beijing are corn and wheat. Corn is categorized
al., 2019), Scotland (Burkhardt et al., 1998), Canada (Hu et       as spring corn and summer corn, which are sown in April and
al., 2014), Japan (Osada et al., 2019), and Germany (Vogt et       June, respectively. Usually, a large amount of base fertilizer
al., 2005) were 0.23–13, 1.6–2.3, 0.1–4, 4.1, and 5.2 ppb, re-     is applied when planting corn, and the topdressing is applied
spectively. These values are considerably lower than those in      after 2 months. Wheat is sown from September to October,
Beijing. However, Delhi, India (Saraswati et al., 2019), ex-       and the topdressing is applied in the following spring. The
hibited a higher NH3 concentration (53.4 ± 14.9 ppb) than          volatilization of nitrogen fertilizers can cause an increase in
Beijing did. This result might be attributed to the well-          atmospheric NH3 mixing ratios and their fluctuations in fer-
developed livestock breeding activities in Delhi. This com-        tilization seasons (Zhang et al., 2016). In addition, the high
parison indicates that the NH3 concentration in Beijing did        temperature in summer should also be responsible for the
not change considerably in the decade before 2019; however,        high NH3 mixing ratios in this season. An increase in the
the NH3 concentration in Beijing is the highest of the big         temperature can increase the biological activity and, thus, en-

Atmos. Chem. Phys., 21, 4561–4573, 2021                                              https://doi.org/10.5194/acp-21-4561-2021
Z. Lan et al.: Exploring NH3 behavior in urban and suburban Beijing 4565
Table 1. Comparison of the atmospheric NH3 concentrations (ppb) observed in different areas.
Period Location Methodology Types Concentration (ppb) Reference
Urban 20.8 ± 13.7
Jan 2018–Jan 2019 Beijing, China Online monitor This study
Suburban 21.9 ± 14.9
Feb 2008–Jul 2010 Urban 22.8 ± 16.3
Beijing, China Passive sampler Meng et al. (2011)
Jan 2007–Jul 2010 Background 10.2 ± 10.8
Urban 7.8
May 2014–Jun 2015 Shanghai, China Passive sampler Chang et al. (2019)
Suburban 6.8
Urban 18.6
Apr 2006–Apr 2007 Xi’an, China Passive sampler Cao et al. (2009)
Suburban 20.3
Dec 2017–Feb 2018 Hebei, China Online monitor Rural 16.7 ± 19.7 He et al. (2020)
2008 Qinghai, China Passive sampler Rural 4.1 ± 2.2 Meng et al. (2010)
Urban 2.3–3.0
Jul 2003–Sep 2011 Toronto, Canada Passive sampler Hu et al. (2014)
Rural 0.1–4
Active and pas- Urban 2.2–3.2
Apr 2016–Oct 2017 New York, USA Zhou et al. (2019)
sive
system Rural 0.6–0.8
Dec 2017 Tokyo, Japan Semi-continuous Urban 4.1 Osada et al. (2019)
microflow analyt-
ical system
Jan 2013–Dec 2015 Delhi, India Automatic ana- Urban 53.4 ± 14.9 Saraswati et al. (2019)
lyzer
Oct 2012–Sep 2013 Jaunpur, India Glass flask sam- Suburban 51.6 ± 22.8 Singh and Kulshrestha (2014)
pling
Jan 2008–Feb 2009 Bamako, Mali Passive sampler Urban 46.7 Adon et al. (2016)
Mar 2006–Apr 2017 Edmonton, Canada Online monitor Urban 2.4 ± 0.6 Yao and Zhang (2016)
Sep 2010–Aug 2011 Seoul, South Korea Online monitor Urban 10.9 ± 4.25 Phan et al. (2013)
Mar 2004–Jul 2004 Münster, Germany Wet denuder Urban 5.2 Vogt et al. (2005)
hance the NH3 production and emission. High temperature is In the autumn and winter, the NH3 mixing ratios at the urban
also conducive for the volatilization of the urea and diammo- site were marginally higher than those at the suburban site. In
nium phosphate applied to crops. Moreover, the equilibrium the autumn and winter seasons, the influences of agricultural
among ammonium nitrate particles, gaseous NH3 , and ni- activities on the NH3 concentration were weakened, whereas
tric acid is transferred to the gas phase at high temperature, the influences of other sources (such as traffic sources) were
which increases the NH3 concentration (Behera et al., 2013). enhanced. According to Wang et al. (2019), the traffic NH3
Sewage treatment, household garbage, golf courses, and hu- emissions per unit area in Haidian (urban site) were 3 times
man excreta are crucial NH3 sources that are easily neglected higher than in Changping (suburban site). This difference in
(Pu et al., 2020). The relatively low NH3 concentrations in traffic source emissions might have resulted in higher NH3
the autumn and winter might be caused by the decrease in concentrations at the urban site than at the suburban site in
NH3 emission in the soil and vegetation, the decrease in the the autumn and winter.
NH4 NO3 decomposition capacity at low temperatures, and
the reduced human activities caused by a large floating pop- 3.3 Diurnal variations
ulation returning to their native locations outside of Beijing
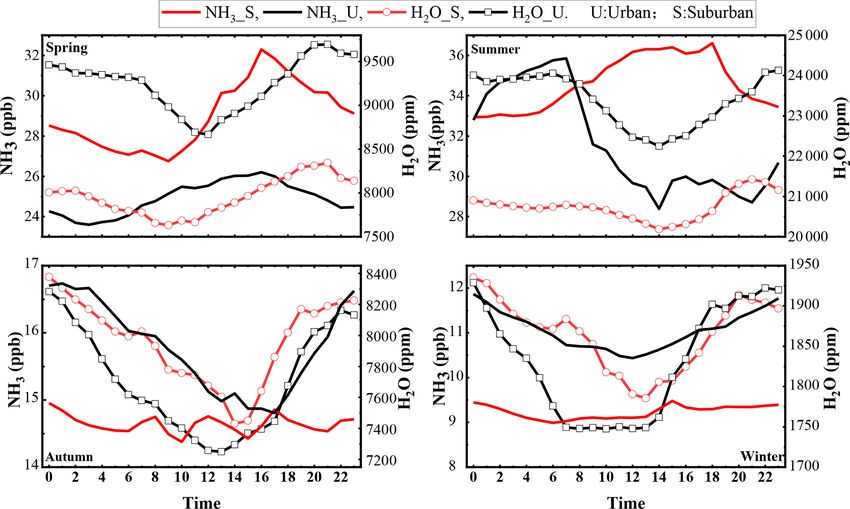
during the Spring Festival (Liao et al., 2014). In spring and Figure 4 displays the average diurnal variations in the NH3
summer, the NH3 mixing ratios at the suburban site were and H2 O mixing ratios in different seasons at the urban and
higher than those at the urban site, which might be related suburban sites in Beijing. Ambient NH3 exhibited different
to the higher agricultural activity around the suburban site. diurnal behaviors in different seasons.
https://doi.org/10.5194/acp-21-4561-2021 Atmos. Chem. Phys., 21, 4561–4573, 2021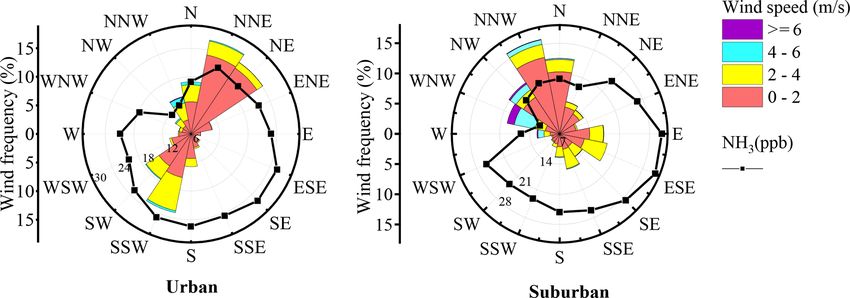
4566                                                     Z. Lan et al.: Exploring NH3 behavior in urban and suburban Beijing

Figure 4. Average diurnal variations in the NH3 and H2 O mixing ratios in different seasons at the urban and suburban sites in Beijing.

   In spring, the average diurnal variations in the NH3 mixing           by Chang et al. (2019). The diurnal variations in NH3 at the
ratio were similar at the urban and suburban sites. The diurnal          suburban site were considerably affected by the temperature
variations exhibited a single-peak pattern with high values in           and the contribution from volatile NH3 sources. However, the
the daytime and low values at night. The NH3 mixing ratio                diurnal summer variation of NH3 at the urban site was com-
began to increase in the morning, reached its maximum value              pletely different from that at the suburban site. The summer
at 16:00 Beijing time, UTC+8, and then decreased gradu-                  level of NH3 at the urban site was obviously lower during
ally. The lowest mixing ratios at the urban and suburban sites           the daytime and evening than that at the suburban site, in-
occurred at 03:00 and 09:00, respectively. The NH3 mixing                creased gradually from 21:00 to levels higher its suburban
ratio began to increase earlier at the urban site than at the sub-       counterpart, dropped after reaching its peak value at 07:00,
urban site. A plausible explanation for the earlier increase in          and then reached its lowest value at 14:00. This diurnal pat-
NH3 emissions at the urban site is traffic emissions during the          tern (with a peak in early morning) has been observed in
morning rush hours. In spring, the mixing ratio of NH3 was               other areas, such as rural (Ellis et al., 2011), urban (Gong et
higher at the suburban site than that at the urban site, with            al., 2011), and steppe areas located far away from human ac-
an average difference of 4.1 ppb and a maximum difference                tivity (Wentworth et al., 2016). Kuang et al. (2020) believed
of 6.1 ppb. The average diurnal amplitude of the NH3 mix-                that such a diurnal pattern of NH3 was caused by the evap-
ing ratio at the suburban site was 5.3 ppb, which was higher             oration of dew in the morning, which resulted in the release
than that (2.6 ppb) at the urban site. At the urban site, the av-        of NH3 originally stored in the droplets. A lag was observed
erage diurnal variations in the NH3 and H2 O mixing ratios               between the changes in the NH3 and H2 O concentrations in
exhibited nearly opposite trends. The H2 O mixing ratio had              the early morning, which supported the hypothesis of Kuang
high values at night and low values during the day. At the               et al. (2020). In addition, the increase in the NH3 concentra-
suburban site, the variation characteristics of NH3 and H2 O             tion in the morning might have been caused by the breakup
were very similar; however, the peak NH3 concentration oc-               of the boundary layer formed at night. The downward mixing
curred 5 h earlier than the peak H2 O concentration. In spring,          of air with a higher NH3 concentration in the residual layer
in contrast to the NH3 mixing ratio, the H2 O mixing ratio at            led to a morning increase in the NH3 concentration on the
the urban site was 1279 ppm higher than that at the suburban             ground (Bash et al., 2010). In summer, the NH3 concentra-
site.                                                                    tions at the suburban site were significantly higher than those
   The diurnal variation in the NH3 mixing ratio at the sub-             at the urban site during the daytime and first half of the night.
urban site in summer was similar to that in spring. This phe-            The average diurnal amplitude of the NH3 concentration was
nomenon was also observed in the rural areas of Shanghai                 7.5 and 3.7 ppb at the urban and suburban sites, respectively.

Atmos. Chem. Phys., 21, 4561–4573, 2021                                                     https://doi.org/10.5194/acp-21-4561-2021
Z. Lan et al.: Exploring NH3 behavior in urban and suburban Beijing                                                        4567

Similar to the situation in spring, the H2 O concentrations at    itively (negatively) correlated with those of temperature (rel-
the urban site were significantly higher than those at the sub-   ative humidity) in spring, but the correlations were reversed
urban site in the summer.                                         in the other seasons. At the suburban site, the seasonal hourly
   In autumn, the NH3 concentration at the suburban site was      means of the NH3 mixing ratio were positively (negatively)
relatively stable and remained almost consistently lower than     correlated with those of temperature (relative humidity) in
that at the urban site, which showed low values during the        the spring and summer, but they were less correlated in au-
day and high values during the night, with a peak at midnight     tumn and winter. Similar correlation behaviors (diurnal vari-
and a minimum (about 2.0 ppb lower than the peak) at 17:00.       ations) were found at both sites in spring, but the correla-
The H2 O concentration was marginally lower (250 ppm) at          tions (diurnal variations) at the urban site behaved differ-
the urban site than at the suburban site. The diurnal profiles    ently from those at the suburban site in other seasons. The
of H2 O at both sites resemble that of NH3 at the urban site,     inconsistent behavior in summer, autumn, and winter caused
but the lowest values of H2 O occurred earlier than the lowest    urban–suburban differences in the annual diurnal patterns of
value of NH3 at the urban site.                                   NH3 , temperature, and relative humidity as well as the NH3 –
   The diurnal patterns of NH3 and H2 O in winter were sim-       temperature (relative humidity) correlations, as can be seen
ilar to those in autumn, although the mixing ratios of NH3        from Fig. S6. Figure 6 displays the contour maps of the NH3
and H2 O were lower than their autumn counterparts. There         mixing ratio, temperature, and relative humidity in different
were two slight differences: (1) the mixing ratios of NH3 at      seasons at the urban and suburban sites. The annual contour
both sites exhibited lower fluctuations than those in autumn,     maps are shown in Fig. S7. As shown in these contour maps,
and (2) the mixing ratio of NH3 at the urban site reached its     the NH3 mixing ratios at both sites increased with relative
minimum in winter earlier than that in autumn.                    humidity at the same temperature and increased with temper-
   The above results indicate that although the two sites were    ature at the same relative humidity. Although there is some
under the influence of similar weather systems, the diurnal       scatter in the contour maps, high NH3 levels are generally
variations in the NH3 mixing ratios at the two sites were dif-    associated with high temperature and humidity. In winter,
ferent in different seasons. This finding suggests that differ-   when the air temperature was low (< 0 ◦ C), the NH3 mixing
ent NH3 sources and possibly sinks had different contribu-        ratios at both sites often had low values except at high hu-
tions to the NH3 concentrations at the urban and suburban         midity (> 60 %). An increase in temperature caused higher
sites. Additional studies should be conducted to better under-    NH3 mixing ratios at both sites; however, the NH3 concen-
stand the behaviors of atmospheric NH3 and its influencing        tration at the suburban site was more significantly correlated
factors.                                                          with temperature than that at the urban site (Table 3), sug-
                                                                  gesting that volatile NH3 sources might have a higher con-
3.4   Effect of meteorological factors on the NH3 levels          tribution to the NH3 concentration in suburban than in urban
                                                                  area. A higher amount of NH3 removal via chemical transfor-
Table 3 presents the annual and seasonal correlation coef-        mation is expected during the day at the urban site than at the
ficients between the daily means of NH3 mixing ratios and         suburban site, as the urban area had a higher relative humid-
those of the temperature, relative humidity, and wind speed       ity, higher particulate matter concentrations, and higher acid
at the two sites. Annually, the NH3 mixing ratios at both sites   gas emissions (particularly NOx ) than the suburban area. In
were positively correlated with temperature and relative hu-      2018, the concentrations of PM2.5 , SO2 , and NO2 were 50, 5,
midity and negatively correlated with wind speed, and the         and 43 µg m−3 in Haidian and 46, 6, and 35 µg m−3 in Chang-
correlations are all highly significant. However, the corre-      ping, respectively, as reported by the Beijing Ecology and
lations deteriorated somewhat in warm seasons. In summer          Environment Statement.
and autumn, no significant correlations were noted between           To explore the influence of wind on the NH3 mixing ra-
ambient NH3 and temperature at the two sites. The corre-          tios, wind rose diagrams were drawn for the hourly mean
lation between NH3 and wind speed in summer was much              concentration of NH3 , wind direction frequency, and wind
weaker than in the other seasons. The relative humidity was       speed during the observation period (Fig. 7). The large-scale
more strongly correlated with the NH3 concentration at the        wind circulation in the North China Plain is often influenced
two sites than temperature, which can be perceived in Fig. 2.     by the mountain–plain topography; therefore, the dominant
Also, the correlation between NH3 and relative humidity did       winds in this region are southerly (from noon to midnight)
not vary much from season to season. This implies the possi-      and northerly (from midnight to noon) (Lin et al., 2009,
bility that relative humidity exerts a certain influence on the   2011). As displayed in Fig. 7, some differences existed in
variation of the NH3 level in the surface layer.                  the distributions of the surface wind between the urban and
   Figure 5 displays the seasonal mean diurnal variations in      suburban sites. The prevailing surface winds were northeast-
the NH3 mixing ratio, temperature, and relative humidity in       erly and southwesterly at the urban site and northwesterly
different seasons at the urban and suburban sites, with their     and easterly at the suburban site. At the urban site, the NH3
correlation coefficients shown in Fig. S5. At the urban site,     mixing ratios were relatively high when the winds originated
the seasonal hourly means of the NH3 mixing ratio were pos-       from the southern sectors and relatively low when the winds

https://doi.org/10.5194/acp-21-4561-2021                                           Atmos. Chem. Phys., 21, 4561–4573, 2021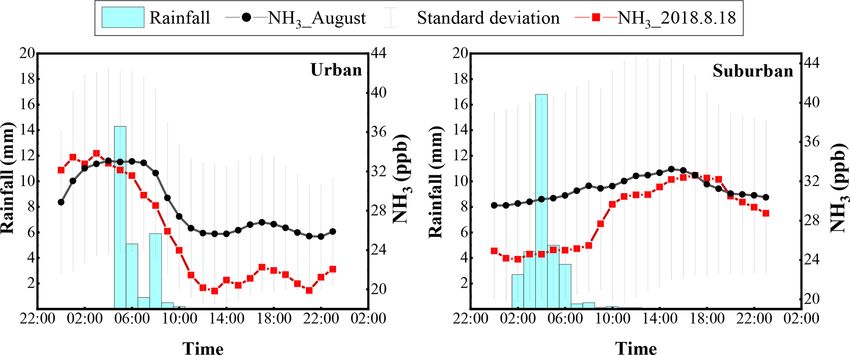
4568                                                       Z. Lan et al.: Exploring NH3 behavior in urban and suburban Beijing

Table 2. NH3 mixing ratios (ppb) measured at the urban and suburban sites in Beijing.

                      Site         Time period    Mean       Standard deviation   Minimum      Median    Maximum
                                   Annual            21                     14           1.6       17          133
                                   Spring            25                     16           1.9       21          101
                      Urban        Summer            32                     12           5.0       30          133
                                   Autumn            16                     7.5          3.8       15           41
                                   Winter            11                     6.7          1.6      9.9           42
                                   Annual             22                    15           0.8       18          198
                                   Spring             29                    16           6.8       26          180
                      Suburban     Summer             35                    12          12.1       33          199
                                   Autumn             15                    6.8          4.1       13           55
                                   Winter            9.2                    4.5          0.8      8.4           29

Figure 5. Diurnal variations in and correlation coefficients between the NH3 mixing ratios and the respective temperature (a) and relative
humidity (b) in different seasons at the urban and suburban sites in Beijing.

originated from the northwestern sectors. Therefore, under              concluded that the air mass from the southeast has a cumu-
southwesterly wind conditions, air masses from the south of             lative effect on the NH3 concentration. Although the domi-
Beijing carry not only air pollutants but also higher levels of         nant wind direction at the suburban site was different from
NH3 to the urban site. Meng et al. (2017) examined the ef-              that at the urban site, the NH3 mixing ratios were also rel-
fect of long-range air transport on the urban NH3 levels in             atively high in the southern sectors. Thus, winds from the
Beijing during the summer using trajectory analysis. They               southeast, south, and southwest can elevate levels of atmo-

Atmos. Chem. Phys., 21, 4561–4573, 2021                                                    https://doi.org/10.5194/acp-21-4561-2021
Z. Lan et al.: Exploring NH3 behavior in urban and suburban Beijing 4569
Figure 6. Contour maps of the NH3 mixing ratio, temperature, and relative humidity in different seasons at the (a) urban and (b) suburban
sites in Beijing.
Figure 7. Wind rose diagrams of the NH3 mixing ratios, wind frequency, and wind speed in different wind direction sectors.
spheric NH3 at both the urban and suburban sites. The NH3 NH3 mixing ratio at the suburban site remained at a low level
mixing ratios were relatively low when air masses originated during the rainfall period, which was considerably lower than
from the northwestern sector at the urban site and from the the August mean NH3 concentration during the same time of
western sector at the suburban site. The western and north- day. However, the NH3 mixing ratio increased rapidly after
western winds were stronger and promoted the dilution and the precipitation and reached the mean level at 17:00. The
diffusion of NH3 emitted into the boundary layer. rainfall might have had an obvious clearing effect on NH3 ,
As a water-soluble gas, NH3 can be impacted by precipita- but more case studies are needed to reach a robust conclu-
tion. Heavy rainfall occurred on 18 August 2018 (Fig. 8). Be- sion.
fore the rainfall, the NH3 concentration at the urban site was
higher than the average level in August. After the rainfall, the
NH3 concentration decreased rapidly, and it was significantly 4 Conclusions
lower than the mean value in August. However, the diurnal
In this study, the atmospheric NH3 concentrations at an urban
pattern of NH3 on that day did not differ considerably from
site and a suburban site in Beijing were continuously and si-
the average diurnal pattern in August. On the same day, the
multaneously observed from January 2018 to January 2019.
https://doi.org/10.5194/acp-21-4561-2021 Atmos. Chem. Phys., 21, 4561–4573, 20214570 Z. Lan et al.: Exploring NH3 behavior in urban and suburban Beijing
Figure 8. Diurnal variations in the rainfall and NH3 concentration on 18 August 2018.
Table 3. Correlations between the daily mean values of NH3 and at night. The opposite trend was observed at the suburban
meteorological elements (Spearman’s rank correlation coefficient). site. Although both sites were under the influence of similar
weather systems, the seasonal diurnal variations in the NH3
Site Time Temperature Relative Wind mixing ratio were different at the urban and suburban sites,
period humidity speed suggesting that NH3 sources had different relative contribu-
Annual 0.680** 0.706** −0.370** tions to the NH3 levels at the urban and suburban sites.
Spring 0.450** 0.645** −0.540** The relationship of meteorological factors with the NH3
Urban Summer 0.043 0.488** −0.106** mixing ratio was complex. Overall, the NH3 mixing ratios
Autumn 0.101 0.759** −0.413** increased with relative humidity and temperate at both sites.
Winter 0.596** 0.690** −0.449** Relative humidity was more strongly correlated with the NH3
Annual 0.745** 0.730** −0.325** mixing ratio at both sites. The situation in different seasons
Spring 0.256* 0.518** −0.391** varied and was site dependent, which warrants further stud-
Suburban Summer 0.126 0.576** −0.061** ies. A high wind speed (mainly under northwesterly wind
Autumn 0.135 0.792** −0.618** conditions) suppressed the levels of NH3 at both sites. The
Winter 0.676** 0.663** −0.545** NH3 mixing ratios were higher under southerly wind condi-
“*” denotes that the value is significant at the 0.05 level. “**” denotes that the value
tions. Rainfall had a certain scavenging effect on NH3 but
is significant at the 0.01 level. had little effect on the diurnal variations in the NH3 concen-
tration.
The mean NH3 mixing ratios were 21±14 and 22±15 ppb at
Data availability. The stationary measurement data are available
the urban and suburban sites, respectively. These NH3 levels
upon reasonable request from the corresponding author, Weili Lin
are among the highest mean values found in China and much
(linwl@muc.edu.cn).
higher than those reported for some developed countries in
America, Europe, and Asia. In the summer and spring, the
NH3 mixing ratios at the suburban site were slightly higher Supplement. The supplement related to this article is available on-
than those at the urban site. In the autumn and winter, how- line at: https://doi.org/10.5194/acp-21-4561-2021-supplement.
ever, the situation was reversed. The highest NH3 mixing ra-
tios at the urban and suburban sites were all found in July.
The lowest NH3 mixing ratio occurred in February at the ur- Author contributions. ZL and WL developed the idea for this paper,
ban site and in January at the suburban site. A comparison formulated the research goals, and carried out the measurements at
with data from the literature shows that the mean concentra- the urban site. WP and ZM carried out the NH3 field observations
tion of NH3 in Beijing did not change considerably in the at the suburban site.
decade before 2019.
The hourly mean NH3 mixing ratios at the urban site were
highly correlated (R = 0.849, P < 0.01) with those at the Competing interests. The authors declare that they have no conflict
suburban site. However, the mean diurnal variations in the of interest.
NH3 mixing ratios at the urban and suburban sites were dif-
ferent. At the urban site, lower NH3 mixing ratios were ob-
served in the daytime and higher mixing ratios were observed
Atmos. Chem. Phys., 21, 4561–4573, 2021 https://doi.org/10.5194/acp-21-4561-2021Z. Lan et al.: Exploring NH3 behavior in urban and suburban Beijing 4571
Acknowledgements. The authors wish to thank Xu Xiaobin for help tural and Nonagricultural Emissions to Atmospheric Ammonia
with language editing and professor Guo Le for providing the land in a Chinese Megacity, Environ. Sci. Technol., 53, 1822–1833,
use map of Beijing. https://doi.org/10.1021/acs.est.8b05984, 2019.
Charlson, R. J., Langner, J., Rodhe, H., Leovy, C. B., and Warren,
S. G.: Perturbation of the northern hemisphere radiative balance
Financial support. This research has been supported by the Na- by backscattering from anthropogenic sulfate aerosols, Tellus
tional Natural Science Foundation of China (grant no. 91744206) B, 43, 152–163, https://doi.org/10.1034/j.1600-0889.1991.t01-1-
and the Beijing Municipal Science and Technology Commission 00013.x, 1991.
(grant no. Z181100005418016). Edgerton, E. S., Saylor, R. D., Hartsell, B. E., Jansen, J. J., and
Alan Hansen, D.: Ammonia and ammonium measurements from
the southeastern United States, Atmos. Environ., 41, 3339–3351,
Review statement. This paper was edited by James Allan and re- https://doi.org/10.1016/j.atmosenv.2006.12.034, 2007.
viewed by two anonymous referees. Ellis, R. A., Murphy, J. G., Markovic, M. Z., VandenBoer, T. C.,
Makar, P. A., Brook, J., and Mihele, C.: The influence of gas-
particle partitioning and surface-atmosphere exchange on am-
monia during BAQS-Met, Atmos. Chem. Phys., 11, 133–145,
References https://doi.org/10.5194/acp-11-133-2011, 2011.
Erisman, J. W., Bleeker, A., Galloway, J., and Sutton, M. S.: Re-
Adon, M., Yoboué, V., Galy-Lacaux, C., Liousse, C., Diop, B., duced nitrogen in ecology and the environment, Environ. Pollut.,
Doumbia, E. H. T., Gardrat, E., Ndiaye, S. A., and Jarnot, 150, 140–149, https://doi.org/10.1016/j.envpol.2007.06.033,
C.: Measurements of NO2 , SO2 , NH3 , HNO3 and O3 in 2007.
West African urban environments, Atmos. Environ., 135, 31–40, Fu, X., Wang, S., Xing, J., Zhang, X., Wang, T., and Hao, J.: Increas-
https://doi.org/10.1016/j.atmosenv.2016.03.050, 2016. ing Ammonia Concentrations Reduce the Effectiveness of Par-
Baer, D. S., Paul, J. B., Gupta, M., and O’Keefe, A.: Sensitive ab- ticle Pollution Control Achieved via SO2 and NOX Emissions
sorption measurements in the near-infrared region using off-axis Reduction in East China, Environ. Sci. Tech. Let., 4, 221–227,
integrated-cavity-output spectroscopy, Appl. Phys. B-Lasers O., https://doi.org/10.1021/acs.estlett.7b00143, 2017.
75, 261–265, https://doi.org/10.1007/s00340-002-0971-z, 2002. Ge, B., Xu, X., Ma, Z., Pan, X., Wang, Z., Lin, W., Ouyang, B., Xu,
Baer, D. S., Gupta, M., Leen, J. B., and Berman, E.: Environmen- D., Lee, J., Zheng, M., Ji, D., Sun, Y., Dong, H., Squires, F. A.,
tal and atmospheric monitoring using off-axis integrated cavity Fu, F., and Wang, Z.: Role of ammonia on the feedback between
output spectroscopy (OA-ICOS), Am. Lab., 44, 20–23, 2012. AWC and inorganic aerosol formation during heavy pollution in
Bash, J. O., Walker, J. T., Katul, G. G., Iones, M. R., Nemitz, E., the North China Plain, Earth and Space Science, 6, 1675–1693,
and Robarge, W. P.: Estimation of in-canony ammonia sources https://doi.org/10.1029/2019EA000799, 2019.
and sinks in a fertilized zea mays field, Environ. Sci. Technol., General Office of the State Council, PRC: Air Pollution Preven-
44, 1683–1689, https://doi.org/10.1021/es9037269, 2010. tion and Control Action Plan, available at: http://www.gov.cn/
Behera, S. N., Sharma, M., Aneja, V. P., and Balasubrama- zwgk/2013-09/12/content_2486773.htm (last access: 22 Octo-
nian, R.: Ammonia in the atmosphere: A review on emis- ber 2020), 2013.
sion sources, atmospheric chemistry and deposition on ter- Gong, L., Lewicki, R., Griffin, R. J., Flynn, J. H., Lefer,
restrial bodies, Environ. Sci. Pollut. R., 20, 8092–8131, B. L., and Tittel, F. K.: Atmospheric ammonia measure-
https://doi.org/10.1007/s11356-013-2051-9, 2013. ments in Houston, TX using an external-cavity quantum cas-
Burkhardt, J., Sutton, M. A., Milford, C., Storeton-West, R. L., and cade laser-based sensor, Atmos. Chem. Phys., 11, 9721–9733,
Fowler, D.: Ammonia concentrations at a site in southern Scot- https://doi.org/10.5194/acp-11-9721-2011, 2011.
land from 2 yr of continuous measurements, Atmos. Environ., He, Y., Pan, Y., Zhang, G., Ji, D., Tian, S., Xu, X.,
32, 325–331, https://doi.org/10.1016/S1352-2310(97)00198-2, Zhang, R., and Wang, Y.: Tracking ammonia morning peak,
1998. sources and transport with 1 Hz measurements at a rural
Cao, J.-J., Zhang, T., Chow, J. C., Watson, J. G., Wu, site in North China Plain, Atmos. Environ., 235, 117630,
F., and Li, H.: Characterization of Atmospheric Ammonia https://doi.org/10.1016/j.atmosenv.2020.117630, 2020.
over Xi’an, China, Aerosol Air Qual. Res., 9, 277–289, Hu, Q., Zhang, L., Evans, G. J., and Yao, X.: Variability of at-
https://doi.org/10.4209/aaqr.2008.10.0043, 2009. mospheric ammonia related to potential emission sources in
Chang, Y., Liu, X., Deng, C., Dore, A. J., and Zhuang, G.: downtown Toronto, Canada, Atmos. Environ., 99, 365–373,
Source apportionment of atmospheric ammonia before, during, https://doi.org/10.1016/j.atmosenv.2014.10.006, 2014.
and after the 2014 APEC summit in Beijing using stable nitro- Huang, X., Song, Y., Li, M., Li, J., Huo, Q., Cai, X., Zhu,
gen isotope signatures, Atmos. Chem. Phys., 16, 11635–11647, T., Hu, M., and Zhang, H.: A high-resolution ammonia emis-
https://doi.org/10.5194/acp-16-11635-2016, 2016a. sion inventory in China, Global Biogeochem. Cy., 26, GB1030,
Chang, Y., Zou, Z., Deng, C., Huang, K., Collett, J. L., Lin, J., https://doi.org/10.1029/2011GB004161, 2012.
and Zhuang, G.: The importance of vehicle emissions as a Ju, X. T., Xing, G. X., Chen, X. P., Zhang, S. L., Zhang,
source of atmospheric ammonia in the megacity of Shanghai, At- L. J., Liu, X. J., Cui, Z. L., Yin, B., Christie, P., Zhu,
mos. Chem. Phys., 16, 3577–3594, https://doi.org/10.5194/acp- Z. L., and Zhang, F. S.: Reducing environmental risk
16-3577-2016, 2016b. by improving N management in intensive Chinese agricul-
Chang, Y., Zou, Z., Zhang, Y., Deng, C., Hu, J., Shi, Z., Dore,
A. J., and Collett, J. L.: Assessing Contributions of Agricul-
https://doi.org/10.5194/acp-21-4561-2021 Atmos. Chem. Phys., 21, 4561–4573, 20214572 Z. Lan et al.: Exploring NH3 behavior in urban and suburban Beijing tural systems, P. Natl. Acad. Sci. USA, 106, 3041–3046, Osada, K., Saito, S., Tsurumaru, H., and Hoshi, J.: Vehicular ex- https://doi.org/10.1073/pnas.0813417106, 2009. haust contributions to high NH3 and PM2.5 concentrations dur- Krotkov, N. A., McLinden, C. A., Li, C., Lamsal, L. N., Celarier, ing winter in Tokyo, Japan, Atmos. Environ., 206, 218–224, E. A., Marchenko, S. V., Swartz, W. H., Bucsela, E. J., Joiner, https://doi.org/10.1016/j.atmosenv.2019.03.008, 2019. J., Duncan, B. N., Boersma, K. F., Veefkind, J. P., Levelt, P. F., Pan, Y., Tian, S., Zhao, Y., Zhang, L., Zhu, X., Gao, J., Huang, Fioletov, V. E., Dickerson, R. R., He, H., Lu, Z., and Streets, W., Zhou, Y., Song, Y., Zhang, Q., and Wang, Y.: Iden- D. G.: Aura OMI observations of regional SO2 and NO2 pollu- tifying Ammonia Hotspots in China Using a National Ob- tion changes from 2005 to 2015, Atmos. Chem. Phys., 16, 4605– servation Network, Environ. Sci. Technol., 52, 3926–3934, 4629, https://doi.org/10.5194/acp-16-4605-2016, 2016. https://doi.org/10.1021/acs.est.7b05235, 2018. Kuang, Y., Xu, W., Lin, W., Meng, Z., Zhao, H., Ren, S., Zhang, Pearson, J. and Stewart, G. R.: The deposition of atmospheric am- G., Liang, L., and Xu, X.: Explosive morning growth phenom- monia and its effects on plants, New Phytol., 125, 283–305, ena of NH3 on the North China Plain: Causes and potential https://doi.org/10.1111/j.1469-8137.1993.tb03882.x, 1993. impacts on aerosol formation, Environ. Pollut., 257, 113621, Phan, N.-T., Kim, K.-H., Shon, Z.-H., Jeon, E.-C., Jung, https://doi.org/10.1016/j.envpol.2019.113621, 2020. K., and Kim, N.-J.: Analysis of ammonia variation in Liao, X., Zhang, X., Wang, Y., Liu, W., Du, J., and Zhao, L.: Com- the urban atmosphere, Atmos. Environ., 65, 177–185, parative Analysis on Meteorological Condition for Persistent https://doi.org/10.1016/j.atmosenv.2012.10.049, 2013. Haze Cases in Summer and Winter in Beijing, Environ. Sci., 35, Pinder, R. W., Gilliland, A. B., and Dennis, R. L.: Environmental 2031–2044, https://doi.org/10.13227/j.hjkx.2014.06.001, 2014. impact of atmospheric NH3 emissions under present and future Lin, W., Xu, X., Ge, B., and Zhang, X.: Characteris- conditions in the eastern United States, Geophys. Res. Lett., 35, tics of gaseous pollutants at Gucheng, a rural site 89–90, https://doi.org/10.1029/2008GL033732, 2008. southwest of Beijing, J. Geophys. Res., 114, D00G14, Pu, W., Ma, Z., Collett, J. L., Guo, H., Lin, W., Cheng, https://doi.org/10.1029/2008JD010339, 2009. Y., Quan, W., Li, Y., Dong, F., and He, D.: Regional Lin, W., Xu, X., Ge, B., and Liu, X.: Gaseous pollutants in Bei- transport and urban emissions are important ammonia con- jing urban area during the heating period 2007–2008: vari- tributors in Beijing, China, Environ. Pollut., 265, 115062, ability, sources, meteorological, and chemical impacts, Atmos. https://doi.org/10.1016/j.envpol.2020.115062, 2020. Chem. Phys., 11, 8157–8170, https://doi.org/10.5194/acp-11- Reay, D. S., Dentener, F., Smith, P., Grace, J., and Feely, R. A.: 8157-2011, 2011. Global nitrogen deposition and carbon sinks, Nat. Geosci., 1, Meng, Z. Y., Xu, X.-B., Wang, T., Zhang, X. Y., Yu, X. L., Wang, S. 430–437, https://doi.org/10.1038/ngeo230, 2008. F., Lin, W. L., Chen, Y. Z., Jiang, Y. A., and An, X. Q.: Ambient Saraswati, Y., George, M. P., Sharma, S. K., Mandal, T. K., and sulfur dioxide, nitrogen dioxide, and ammonia at ten background Kotnala, R. K.: Simultaneous Measurements of Ambient NH3 and rural sites in China during 2007-2008, Atmos. Environ., and Its Relationship with Other Trace Gases, PM2.5 and Meteo- 44, 2625–2631, https://doi.org/10.1016/j.atmosenv.2010.04.008, rological Parameters over Delhi, India, Mapan-J. Metrol. Soc. I., 2010. 34, 55–69, https://doi.org/10.1007/s12647-018-0286-0, 2019. Meng, Z. Y., Lin, W. L., Jiang, X. M., Yan, P., Wang, Y., Zhang, Singh, S. and Kulshrestha, U. C.: Rural versus urban gaseous inor- Y. M., Jia, X. F., and Yu, X. L.: Characteristics of atmospheric ganic reactive nitrogen in the Indo-Gangetic plains (IGP) of In- ammonia over Beijing, China, Atmos. Chem. Phys., 11, 6139– dia, Environ. Res. Lett., 9, 125004, https://doi.org/10.1088/1748- 6151, https://doi.org/10.5194/acp-11-6139-2011, 2011. 9326/9/12/125004, 2014. Meng, Z. Y., Lin, W., Zhang, R., Han, Z., and Jia, X.: Summer- UN Environment: A Review of 20 Years’ Air Pollution Control time ambient ammonia and its effects on ammonium aerosol in Beijing, United Nations Environment Programme, Nairobi, in urban Beijing, China, Sci. Total Environ., 579, 1521–1530, Kenya, 2019. https://doi.org/10.1016/j.scitotenv.2016.11.159, 2017. Van Breemen, N., Mulder, J., and Driscoll, C. T.: Acidifi- Meng, Z. Y., Wu, L., Xu, X., Xu, W., Zhang, R., Jia, X., Liang, cation and alkalinization of soils, Plant Soil, 75, 283–308, L., Miao, Y., Cheng, H., Xie, Y., He, J., and Zhong, J.: Changes https://doi.org/10.1007/BF02369968, 1983. in ammonia and its effects on PM2.5 chemical property in Vogt, E., Held, A., and Klemm, O.: Sources and concentra- three winter seasons in Beijing, China, Sci. Total Environ., 749, tions of gaseous and particulate reduced nitrogen in the 142208, https://doi.org/10.1016/j.scitotenv.2020.142208, 2020. city of Münster (Germany), Atmos. Environ., 39, 7393–7402, Ministry of Ecology and Environment of the People’s Republic of https://doi.org/10.1016/j.atmosenv.2005.09.012, 2005. China: 12th Five-Year Plan for the Key Regional Air Pollution Wang, K., Fan, S., Guo, J., and Sun, G.: Characteristics of ammonia Prevention and Control in Key Regions, available at: http://www. emission from motor vehicle exhaust in Beijing, Environ. Eng., mee.gov.cn/gkml/hbb/bwj/201212/t20121205_243271.htm (last 36, 98–101, https://doi.org/10.13205/j.hjgc.201803020, 2019. access: 12 October 2020), 2012. Warner, J. X., Dickerson, R. R., Wei, Z., Strow, L. L., Wang, Y., and Nowak, J. B., Huey, L. G., Russell, A. G., Tian, D., Neuman, J. Liang, Q.: Increased atmospheric ammonia over the world’s ma- A., Orsini, D., Sjostedt, S. J., Sullivan, A. P., Tanner, D. J., We- jor agricultural areas detected from space, Geophys. Res. Lett., ber, R. J., Nenes, A., Edgerton, E., and Fehsenfeld, F. C.: Anal- 44, 2875–2884, https://doi.org/10.1002/2016GL072305, 2017. ysis of urban gas phase ammonia measurements from the 2002 Wei, S., Dai, Y., Liu, B., Zhu, A., Duan, Q., Wu, L., Ji, D., Ye, Atlanta Aerosol Nucleation and Real-Time Characterization Ex- A., Yuan, H., Zhang, Q., Chen, D., Chen, M., Chu, J., Dou, Y., periment (ANARChE), J. Geophys. Res.-Atmos., 111, D17308, Guo, J., Li, H., Li, J., Liang, L., Liang, X., Liu, H., Liu, S., https://doi.org/10.1029/2006JD007113, 2006. Miao, C., and Zhang, Y.: A China data set of soil properties for Atmos. Chem. Phys., 21, 4561–4573, 2021 https://doi.org/10.5194/acp-21-4561-2021
Z. Lan et al.: Exploring NH3 behavior in urban and suburban Beijing                                                                  4573

  land surface modeling, J. Adv. Model. Earth Sy., 5, 212–224,     Zhang, X., Wu, Y., Liu, X., Reis, S., Jin, J., Dragosits, U.,
  https://doi.org/10.1002/jame.20026, 2013.                          van Damme, M., Clarisse, L., Whitburn, S., Coheur, P. F.,
Wentworth, G. R., Murphy, J. G., Benedict, K. B., Bangs, E. J.,      and Gu, B.: Ammonia emissions may be substantially under-
  and Collett Jr., J. L.: The role of dew as a night-time reser-     estimated in China, Environ. Sci. Technol., 51, 12089–12096,
  voir and morning source for atmospheric ammonia, Atmos.            https://doi.org/10.1021/acs.est.7b02171, 2017.
  Chem. Phys., 16, 7435–7449, https://doi.org/10.5194/acp-16-      Zhang, Y., Tang, A., Wang, D., Wang, Q., Benedict, K., Zhang, L.,
  7435-2016, 2016.                                                   Liu, D., Li, Y., Collett Jr., J. L., Sun, Y., and Liu, X.: The vertical
Wu, Z., Hu, M., Shao, K., and Slanina, J.: Acidic gases, NH3 and     variability of ammonia in urban Beijing, China, Atmos. Chem.
  secondary inorganic ions in PM10 during summertime in Beijing,     Phys., 18, 16385–16398, https://doi.org/10.5194/acp-18-16385-
  China and their relation to air mass history, Chemosphere, 76,     2018, 2018.
  1028–1035, https://doi.org/10.1016/j.chemosphere.2009.04.066,    Zhao, X., Xie, Y. X., Xiong, Z. Q., Yan, X. Y., Xing, G. X., and Zhu,
  2009.                                                              Z. L.: Nitrogen fate and environmental consequence in paddy soil
Yao, X. and Zhang, L.: Trends in atmospheric ammonia at urban,       under rice-wheat rotation in the Taihu lake region, China, Plant
  rural, and remote sites across North America, Atmos. Chem.         Soil, 319, 225–234, https://doi.org/10.1007/s11104-008-9865-0,
  Phys., 16, 11465–11475, https://doi.org/10.5194/acp-16-11465-      2009.
  2016, 2016.                                                      Zhou, C., Zhou, H., Holsen, T. M., Hopke, P. K., Edgerton, E. S.,
Zhang, B.: Atmospheric Distribution and Variation of NH3 in Bei-     and Schwab, J. J.: Ambient Ammonia Concentrations Across
  jing, Environmental Science and Management, 41, 119–122,           New York State, J. Geophys. Res.-Atmos., 124, 8287–8302,
  2016.                                                              https://doi.org/10.1029/2019JD030380, 2019.
Zhang, S., Wag, A., Zhang, Z., Wang, J., Han, Y., Su, R., and
  Qu, Y.: On creating an anthropogenic ammonia emission in-
  ventory in capital Beijing, J. Safety Environ., 16, 242–245,
  https://doi.org/10.13637/j.issn.1009-6094.2016.02.047, 2016.

https://doi.org/10.5194/acp-21-4561-2021                                              Atmos. Chem. Phys., 21, 4561–4573, 2021
You can also read