Diagnosing Initial Condition Sensitivity of Typhoon Sinlaku (2008) and Hurricane Ike (2008)
←
→
Page content transcription
If your browser does not render page correctly, please read the page content below
3224                                        MONTHLY WEATHER REVIEW                                                             VOLUME 139

               Diagnosing Initial Condition Sensitivity of Typhoon Sinlaku (2008)
                                   and Hurricane Ike (2008)

                  WILLIAM A. KOMAROMI, SHARANYA J. MAJUMDAR, AND ERIC D. RAPPIN
                                                 University of Miami, Miami, Florida

                                (Manuscript received 21 October 2010, in final form 28 March 2011)

                                                             ABSTRACT

              The response of Weather Research and Forecasting (WRF) model predictions of two tropical cyclones to
            perturbations in the initial conditions is investigated. Local perturbations to the vorticity field in the
            synoptic environment are created in features considered subjectively to be of importance to the track
            forecast. The rebalanced analysis is then integrated forward and compared with an unperturbed ‘‘control’’
            simulation possessing similar errors to those in the corresponding operational model forecasts. In the first
            case, Typhoon Sinlaku (2008), the premature recurvature in the control simulation is found to be corrected
            by a variety of initial perturbations; in particular, the weakening of an upper-level low directly to its north,
            and the weakening of a remote short-wave trough in the midlatitude storm track. It is suggested that one or
            both of the short waves may have been initialized too strongly. In the second case, the forecasts for
            Hurricane Ike (2008) initialized 4 days prior to its landfall in Texas were not sensitive to most remote
            perturbations. The primary corrections to the track of Ike arose from a weakening of a midlevel ridge
            directly to its north, and the strengthening of a short-wave trough in the midlatitudes. For both storms, the
            targets selected by the ensemble transform Kalman filter (ETKF) were often, but not always, consistent
            with the most sensitive regions found in this study. Overall, the results can be used to retrospectively
            diagnose features in which the initial conditions require improvement, in order to improve forecasts of
            tropical cyclone track.

1. Introduction                                                      It was found that the balanced flows deduced via the
                                                                     separation of PV fields were useful in interpreting TC
   In the environment of tropical cyclones (TCs), the
                                                                     motion.
evolution of features including adjacent subtropical
                                                                        Recently, attention has turned to investigating errors
ridges, a midlatitude trough, or a nearby cyclonic cir-
                                                                     in numerical forecasts of TC motion that arise due in
culation may influence the motion and behavior of the
                                                                     part to inaccuracies in their initial conditions. To explore
TC. Early studies focused on the dynamical processes
                                                                     this, several objective sensitivity methods, such as sin-
that govern TC motion, beginning with investigations of
                                                                     gular vector (Peng and Reynolds 2006; Chen et al. 2009;
barotropic processes (reviewed in Elsberry 1995), and
                                                                     Kim and Jung 2009), adjoint-derived sensitivity steering
potential vorticity (PV) in a baroclinic environment
                                                                     vector (Wu et al. 2007), and ensemble sensitivity (Torn
(Shapiro 1992; Wu and Emanuel 1993; Molinari et al.
                                                                     and Hakim 2008), have been devised. These methods
1998; Wu and Wang 2000). Additionally, piecewise PV
                                                                     have been used to identify locations in which to tar-
inversion (Davis and Emanuel 1991) was employed to
                                                                     get observations during field campaigns such as The
diagnose the steering flow and the interaction between
                                                                     Observing System Research and Predictability Experi-
the TC and its environment (Wu and Emanuel 1995a,b).
                                                                     ment (THORPEX) Pacific Asian Regional Campaign
                                                                     (T-PARC; Reynolds et al. 2010). Other methods such
                                                                     as the ensemble transform Kalman filter (ETKF;
  Corresponding author address: William Komaromi, Division of
Meteorology and Physical Oceanography, RSMAS, 4600 Rick-             Majumdar et al. 2011) investigate the sensitivity of TC
enbacker Cswy., Miami, FL 33149.                                     forecasts to the assimilation of observations. Sensitivity
E-mail: wkomaromi@rsmas.miami.edu                                    guidance products provided by these respective methods

DOI: 10.1175/MWR-D-10-05018.1

Ó 2011 American Meteorological Society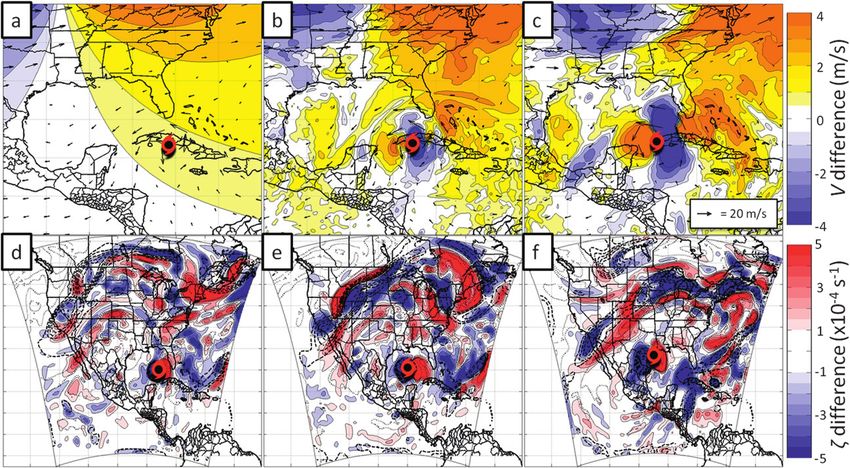
OCTOBER 2011                                    KOMAROMI ET AL.                                                         3225

often exhibit different characteristics for common cases       are used: Rapid Radiative Transfer Model (RRTM)
(Majumdar et al. 2006; Wu et al. 2009).                        longwave radiation (Mlawer et al. 1997; Iacono et al.
   These objective initial condition sensitivity methods       2000), Dudhia shortwave radiation (Dudhia 1989), WRF
are also only perfect when linear dynamics are obeyed,         Single-Moment (WSM) six-class microphysics (Dudhia
and if the data assimilation scheme (if assumed) is per-       et al. 2008), and the Mellor–Yamada–Janjić (MYJ)
fect. In this paper, we employ a more direct approach to       boundary layer scheme (Mellor and Yamada 1982; Janjić
investigate the means by which TC forecasts may be             1990). A second-order diffusion scheme is employed, and
modified via changes to the analysis, by subjectively          no damping is used.
perturbing the initial conditions in specified environ-           Several global models were initially examined for use
mental features and integrating the forecast model             as initial and boundary conditions. An intercomparison
forward. Initial perturbations are created via the am-         between the 2008 versions of the National Centers for
plification or weakening of relative vorticity within          Environmental Prediction (NCEP) Global Forecast
a chosen area and layer in the synoptic environment of         System (GFS), the Navy Operational Global Atmo-
the TC, followed by a rebalancing of the newly modi-           spheric Prediction System (NOGAPS), and the Euro-
fied field. The primary goal of the study is to diagnose       pean Centre for Medium-Range Forecasts (ECMWF)
the primary initial condition sensitivities when full-         model revealed that the ECMWF produced the most
physics, nonlinear models are used. The methodology            realistic vortex initialization. Therefore, twice-daily 18 3 18
may be used retrospectively by the research and op-            horizontal resolution ECMWF analyses are used to
erational communities to offer suggestions on the              provide initial and boundary conditions for the WRF
weather features in which the initial analysis required        domain in this study. For each TC case, a ‘‘control’’
improvement, via a combination of improved model-              (nonperturbed) simulation, and an array of ‘‘perturbed’’
ing, observational coverage, or data assimilation. The         simulations in which the initial conditions are modified
diagnostic technique may also be used to improve our           by local, balanced perturbations of vorticity in the syn-
understanding of the aforementioned objective sensi-           optic environment, are integrated out to 5 days. The
tivity methods and their limitations. Two TCs, Typhoon         ‘‘sensitivity’’ to a given location is then interpreted as
Sinlaku (2008) and Hurricane Ike (2008), are selected          the change in TC track associated with a particular
for this study, given their importance to society and the      vorticity perturbation.
problems encountered in their operational forecasts 3–5
days prior to landfall. For each case, the variations in the
                                                               b. Vorticity perturbation technique
TC track due to initial perturbations of differing loca-
tions and amplitudes are examined, together with an               The modification to the initial conditions is achieved
investigation of how the environment is modified to alter      by first perturbing the relative vorticity field within
the track forecasts. The sensitivity to perturbations in       a local cylinder of radius R and, then, rebalancing the
additional locations deemed important based on an              flow by solving for the nondivergent streamfunction
objective technique (ETKF) is also examined.                   followed by the geopotential. While it is desirable to
   In section 2, the regional modeling framework and           use a full piecewise potential vorticity inversion tech-
vorticity perturbation technique are presented. In sections    nique such as that of Davis (1992), the method em-
3 and 4, the applications of this technique to Tropical Cy-    ployed here is computationally simpler and follows the
clones Sinlaku and Ike, respectively, are presented, fol-      vorticity removal and inversion method of Davis and
lowed by concluding remarks in section 5.                      Low-Nam (2001), which has been widely used as
                                                               a component of the fifth-generation National Center
                                                               for Atmospheric Research–Pennsylvania State Uni-
2. Methodology                                                 versity (NCAR–Penn State) Mesoscale Model (MM5)
                                                               system. In this study, the technique is designed to en-
a. Modeling framework
                                                               sure that smooth, balanced changes to the analysis are
  Version 3.1.1 of the regional Advanced Research              created.
Weather Research and Forecasting model (WRF-                      The location and radius of perturbation, the pressure
ARW) is employed in this paper. A single, fixed grid           levels ( ptop and pbot) between which the perturbation is
with a horizontal resolution of 21 km and 41 vertical          applied, and the multiplicative factor amax applied to the
levels is used. The domains for the two TC cases are           vorticity value at the perturbation center are all speci-
chosen such that all synoptic targets are included:            fied subjectively. The perturbation magnitude a(r, p)
8946 km 3 7056 km for Typhoon Sinlaku and 6510 km 3            decreases linearly outward with radius r from the point
5880 km for Hurricane Ike. The following physics options       (0, pmean) as follows: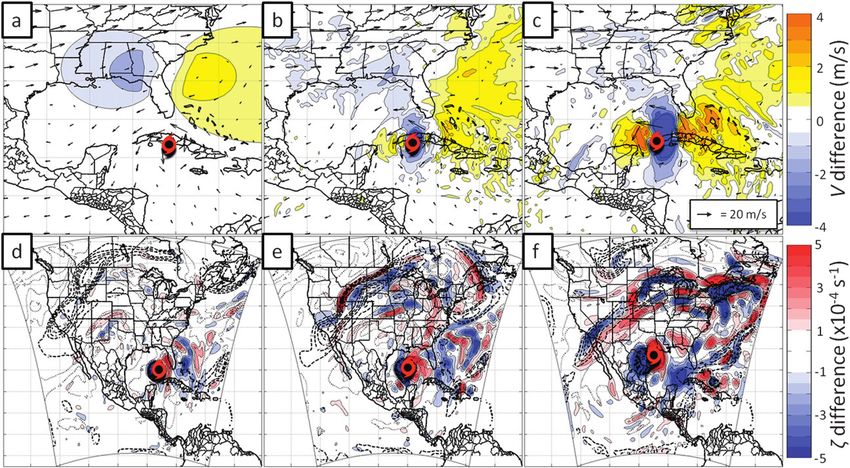
3226 MONTHLY WEATHER REVIEW VOLUME 139
R2r p 2 ptop
a(r, p) 5 2 a , r # R, ptop # p # pmean
R pbot 2 ptop max
R2r pbot 2 p
a(r, p) 5 2 a , r # R, pmean # p # pbot
R pbot 2 ptop max
a(r, p) 5 0, r . R, p # ptop , or p . pbot, (1)
where pmean is the mean of pbot and ptop. Therefore, NCEP Gridpoint Statistical Interpolation scheme
a(r, p) 5 amax at the point (0, pmean). The perturbation (Kleist et al. 2009). While the vorticity perturbation is
technique is fundamentally identical to the NCAR constrained to be within radius R, due to the inversion of
vortex removal technique (Davis and Low-Nam 2001), the Laplacian operator over the model domain, small
with two additional modifications. First, the inclusion of initial wind (V) perturbations remain at remote dis-
amax allows for incremental, rather than complete, re- tances. Vorticity perturbations are chosen such that the
moval (or increases) of vorticity. Second, the perturba- maximum V perturbation in the vicinity of the tropical
tion scales linearly to zero at a user-specified ptop and cyclone is 1 m s21 or less, and additional diagnoses are
pbot. This modification allows for the perturbation of conducted to determine that the most significant con-
features that exist through a limited depth of the tro- tribution to the track forecast arises from the vicinity of
posphere, such as upper-level lows or surface anticy- the perturbation center and not from the remote initial
clones. The new relative vorticity z1 is then expressed as perturbation near the TC. It is also worth noting that
a sum of the original relative vorticity z0 and the per- ‘‘data impact’’ computations using operational data as-
turbation relative vorticity z9: similation can produce initially small, rapidly growing
perturbations remote from the location of the observa-
z1 5 z0 1 z9 5 [1 1 a(r, p)]z0 . (2) tional data (Hodyss and Majumdar 2007), leading to
upscale growth (Zhang et al. 2003). Small initial per-
The streamfunction is recovered via inversion of the turbations may influence track forecasts of TCs, with the
Laplacian operator in c9 5 =2 z9 through the use of long-wave pattern being modified significantly even af-
a successive overrelaxation technique (Tannehill et al. ter 2 days (Aberson 2008; Brennan and Majumdar
1997). The nondivergent wind perturbation v9c 5 k 3 $c9 2011).
is then computed and added to the initial wind field,
while the divergent component remains unperturbed.
The geopotential field is then adjusted via geostrophic 3. Sensitivity analysis for Typhoon Sinlaku (2008)
balance, and the temperature is finally adjusted through
a. Synopsis and selection of targets
hydrostatic balance.
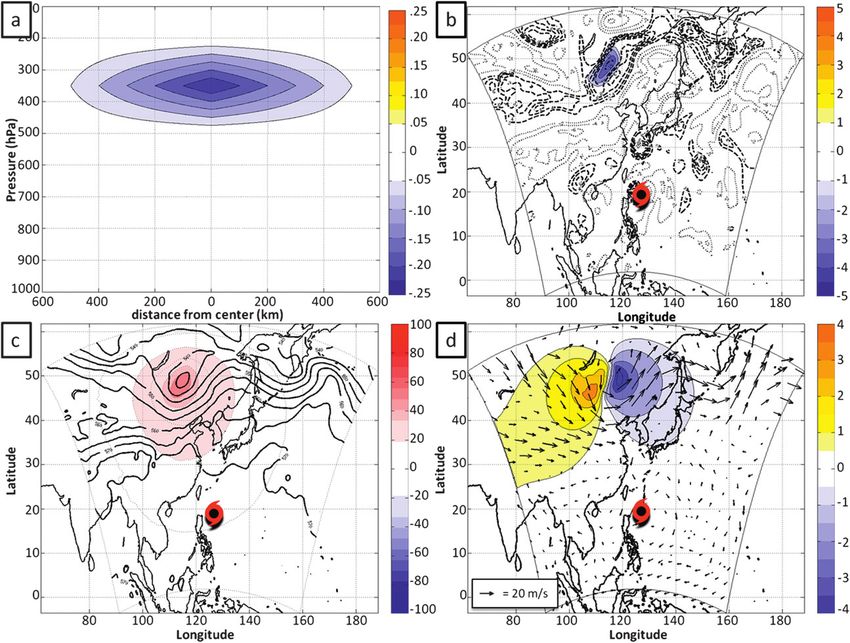
An example of the perturbed fields is illustrated in Typhoon Sinlaku (2008) posed a series of forecasting
Fig. 1. An upper-layer (500–200 hPa) negative vorticity challenges from its genesis through to recurvature and
perturbation of strength amax 5 20.23 (Fig. 1a) is in- extratropical transition. In this paper, we focus on
troduced in order to weaken a strong midlatitude short forecasts initialized at 0000 UTC 10 September 2008,
wave. The resulting modification to the vorticity field is at which time Sinlaku had been declared by the Joint
local to the perturbation (Fig. 1b), with the largest vor- Typhoon Warning Center as a typhoon with maxi-
ticity perturbation value situated off center due to the mum sustained winds (averaged over 10 min) of 90 kt
value of the vorticity being significantly larger at adja- (1 kt = 0.5144 m s21), meandering slowly northward and
cent locations. While the perturbation itself a(r, p) is posing a potential threat to Taiwan (Fig. 2a). Sinlaku is
a circle on a height surface, the perturbed vorticity z1 is situated in between two large deep-layer anticyclones:
not circular (Fig. 1b), due to the fact that it is a function one over China and the other over the western North
of both a(r, p) and the initial vorticity z0. The changes to Pacific Ocean (Fig. 2b). The lack of a dominant steering
the 500-hPa geopotential height (Fig. 1c) and deep-layer flow contributed to the large spread in the 5-day
(850–200 hPa) mean velocity fields (Fig. 1d) extend ECMWF ensemble forecasts of Sinlaku (Fig. 2c). Sev-
farther outward, with wind perturbations dropping be- eral of the deterministic forecasts produced a 5-day
low 1 m s21 1000 km from the perturbation center. The forecast over 500 km to the east of the actual track, with
initial perturbations are qualitatively similar in shape recurvature occurring by 4 days, 2 days too early. The
and spatial extent to those produced by the assimila- WRF control simulation initialized from the ECMWF
tion of an observation in a scheme that permits quasi- analysis produced a forecast track with similar timing
isotropic error covariance information, such as the and location errors as the operational models. After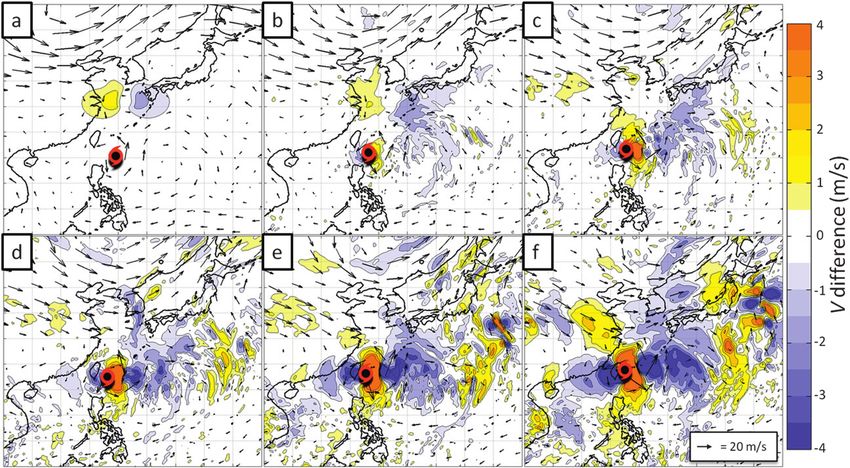
OCTOBER 2011                                         KOMAROMI ET AL.                                                              3227

  FIG. 1. Vorticity perturbation valid 0000 UTC 10 Sep 2008 at target S1 using amax 5 20.23. (a) Vertical cross section of a(r, p), (b)
500–200-hPa layer mean relative vorticity (positive, dashed; negative, dotted) and relative vorticity difference between the control and
perturbed simulations (31024 s21, colors), (c) 500-hPa geopotential height (m, contours) and 500-hPa geopotential height difference
between the control and perturbed simulations (m, colors), and (d) 850–200-hPa deep-layer mean vector wind (arrows) and meridional
wind difference (m s21, colors). The location of Typhoon Sinlaku at 0000 UTC 10 Sep 2008 is indicated by the TC symbol.

a correctly predicted slow track over the first 2 days               which S1 is selected lies in between two large ridges in an
(with a 2-day error of only 44 km), the control forecast             amplified long-wave pattern. The center of the pertur-
diverged considerably from the best track over the                   bation for S1 is selected to be at the southern end of
following 3 days with an erroneously strong northward                a short wave over southeast Russia and Mongolia, with
component (Fig. 2d). Between 2 and 5 days, the fore-                 a radius of perturbation R 5 600 km. This radius is
cast error in the control run grew almost linearly at                similar to the radius of curvature in the base of the
200 km day21, culminating in a 5-day error of 644 km.                trough, beyond which the flow becomes dominated by
  The locations for the vorticity perturbations were se-             the surrounding ridges (Fig. 3a). Target S2 is a smaller
lected within features in the synoptic environment of                upper-level trough that becomes cut off from the jet
Sinlaku that may be expected to influence the track. The             2 days prior to the initial time, only to rejoin the jet
locations (designated with an S for Sinlaku) include                 36 h later. To restrict the perturbation to the vicinity
a remote midlatitude short-wave trough to the north-                 and scale of S2, R is reduced to 400 km. For the lower-
northwest of Sinlaku (S1), a smaller upper-level short               tropospheric targets S3 and S4, R is set to 500 and
wave nearby to the north (S2), a low-level monsoon trough            400 km respectively, consistent with the sizes of their
over Vietnam and Cambodia to the west-southwest (S3),                circulations. The maximum vorticity in the low-level
and the decaying Tropical Storm 16W, just southwest of               monsoon trough associated with S3 is smaller than that
Japan (S4) (Fig. 3). The large upper-level trough within             for the other targets (Fig. 3b). Target S4 is associated
3228                                       MONTHLY WEATHER REVIEW                                                     VOLUME 139

   FIG. 2. Typhoon Sinlaku at 0000 UTC 10 Sep 2008. (a) Water vapor imagery from Cooperative Institute for Mesoscale Meteorological
Studies (CIMMS)–University of Wisconsin, (b) 850–300-hPa deep-layer mean streamlines (from CIMSS), (c) ECMWF ensemble track
forecast initialized at the same time, and (d) Joint Typhoon Warning Center (JTWC) best track and track of control WRF simulation
initialized at the same time.

with high vorticity in the lower troposphere over a small          incrementally reduced for perturbation S2, in order to
area spanning Tropical Storm 16W. These four targets               identify a state in which the perturbation may compen-
all lie in cloudy areas (Fig. 1). A fifth location (‘‘SE’’)        sate for local errors in the model analysis and allow for
downstream of target S1, based on guidance from the                the successful replication of the TC’s best track. To
ETKF strategy, is also examined (Fig. 3a). Finally, a re-          compare the effects of perturbing two targets (S1 and
gion 200 km downstream of Sinlaku is selected to ex-               S2) with a consistent initial wind perturbation jV9jmax,
amine the sensitivity of the TC to a local perturbation            a new perturbation of amax5 60.23 is then applied to S1.
that is not associated with a distinct synoptic feature.           Finally, for SC, a 60.16 perturbation is applied in order
This target is designated SC (Fig. 3b).                            to produce a V perturbation of average magnitude equal
                                                                   to 1 m s21 within a 300-km radius of the TC. A summary
b. Sensitivity to perturbations
                                                                   of targets and corresponding values of amax is given in
   The choice of the multiplicative factor amax is sub-            Table 1.
jective, and it depends on the type of feature to be
                                                                     1) S1: MIDLATITUDE TROUGH
perturbed. First, perturbations with amax 5 60.75 are
selected. Although the magnitudes of these perturba-                 To examine the sensitivity and the robustness of the
tions are larger than typical inaccuracies in an opera-            perturbation technique, a range of positive and negative
tional analysis, they are initially created to investigate         vorticity perturbations is selected. Target S1 is per-
the gross characteristics of the sensitivity. Next, amax is        turbed using amax 5 60.75 and 60.23, generating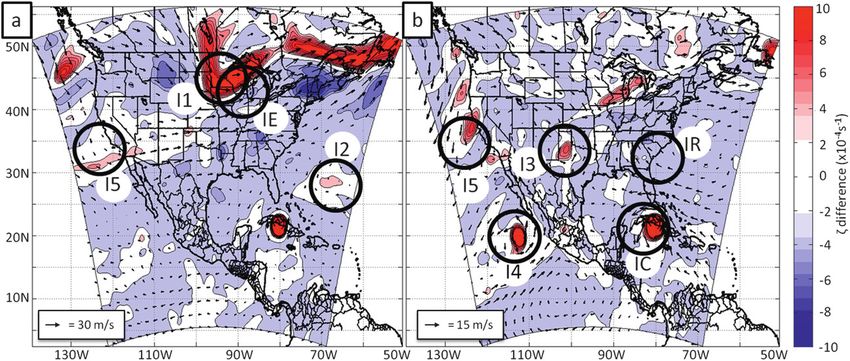
OCTOBER 2011                                          KOMAROMI ET AL.                                                                3229

  FIG. 3. ECMWF analysis within the WRF domain at 0000 UTC 10 Sep 2008. (a) The 500–200-hPa layer mean relative vorticity (shaded)
and deep-layer mean vector wind (arrows) with upper-level targets S1 and S2, and (b) the 850–700-hPa layer mean relative vorticity with
low-level targets S3 and S4. Typhoon Sinlaku is the vorticity maximum southeast of Taiwan in both (a) and (b).

maximum vertically averaged deep-layer (850–200 hPa)                     A perturbation of amax 5 20.23 corrects the pre-
wind perturbations of 15.6 and 4.9 m s21, respectively,                mature recurvature and replicates the actual track
at the target, and 0.6 and 0.2 m s21, respectively, within             almost perfectly. This modest weakening to the S1
300 km of the center of Sinlaku. The WRF forecast track                trough produces an initial negative perturbation of
of Sinlaku is found to be highly sensitive to the pertur-              meridional wind (y) on the east side of the trough cor-
bations with amax 5 60.75 (Fig. 4a). The substantial                   responding to a weakening of the southerly wind com-
weakening of the S1 trough (amax 5 20.75) produces                     ponent, and a positive y perturbation on the west side
a track well to the left of the best track, with an initial            corresponding to a weakening of the northerly wind
landfall in southern Taiwan and a second landfall in                   component (Figs. 5a and 1d). The weakening of the S1
China. On the other hand, the strengthening of the S1                  trough strengthens the eastern periphery of the anticy-
trough (amax 5 10.75) acts to accelerate Sinlaku toward                clone over China very slightly, resulting in slightly stron-
the north-northeast. For both positive and negative                    ger northerly wind to the west of Sinlaku (Figs. 5b–d).
perturbations, the 5-day forecast differs from the control             Concurrently, weaker southerly wind on the east side
run by over 1000 km.                                                   of S1 propagates southward with time, away from the

  TABLE 1. Summary of cases for Typhoon Sinlaku initialized on 0000 UTC 10 Sep 2008. Columns correspond to target name (target),
maximum vorticity amplification factor (amax), radius of perturbations (rper, km), distance between the perturbation and the TC (distance,
km), the normalized ETKF sensitivity (ETKF), the maximum magnitude of the 850–200-hPa vertically averaged wind perturbation at the
target (jV9jmax at target) and at the TC (jV9jmax at TC, m s21), and the distance (km) between the perturbed and the control tracks, for 48-
and 120-h forecasts.

                           rpert      Distance                        jV9jmax at          jV9jmax at           48-h               120-h
Target        amax        (km)         (km)           ETKF         target (m s21)        TC (m s21)        Dtrack (km)         Dtrack (km)
 S1          20.75         600          3200           0.65             15.6                  0.6               220                1086
 S1          20.23         400          3200           0.65              4.9                  0.2                60                 577
 S2          20.75         400          1200           0.79              4.9                  0.6               246                1108
 S2          20.55         400          1200           0.79              3.6                  0.4               188                 905
 S2          20.25         400          1200           0.79              1.6                  0.2                80                 808
 S2          20.15         400          1200           0.79              1.0                  0.1                53                 366
 S3          20.75         500          2300           0.92              4.9                  0.7               107                 464
 S4          20.75         400          2500           0.56              3.1                  0.1                84                 771
 SC          20.16         500           200           0.87              0.6                  0.6                27                  38
 SE          20.75         600          3400           0.89              7.3                , 0.1                38                 362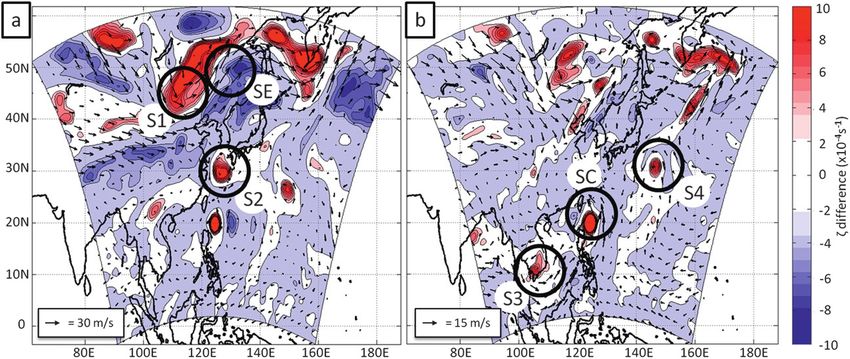
3230 MONTHLY WEATHER REVIEW VOLUME 139
FIG. 4. The 5-day WRF track simulations initialized 0000 UTC 10 Sep 2008 for perturbations at targets (a) S1 and (b)
S2. Each dot represents a 1-day forecast increment.
initial perturbation, resulting in weaker southerly wind period, with the perturbed track remaining to the south
to the east of Sinlaku. The net effect of these negative of the control (Fig. 4a). While there is a significant
y anomalies both east and west of Sinlaku is to slow the modification to the meridional component of the wind in
northward propagation of the cyclone. The short-term the environment of Sinlaku, the modification to the
track forecast was not substantially modified (and was in zonal component is relatively small, as expected, since
fact degraded by 23 km at 48 h) due to the perturbation. the zonal wind in this region is weak. However, Sinlaku
From 60 h, the modification to the track is consistent travels farther west in the perturbed simulation than
with the onset of bifurcation between the track forecasts in the control, since it remains sufficiently remote from
in the control and perturbed simulations during this the short wave to its north to avoid recurvature. Its
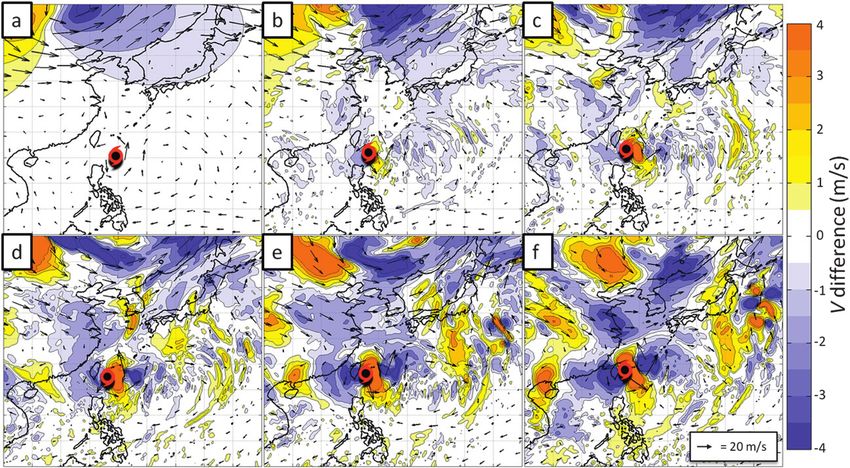
FIG. 5. Colors show the meridional wind difference (m s21) between the perturbed (amax 5 20.23) and control WRF simulations for (a)
0, (b) 12, (c) 24, (d) 36, (e) 48, and (f) 60 h. A positive (negative) value implies that the positive meridional component in the perturbed
simulation is higher (lower) than that in the control simulation. Vectors show the 850–200-hPa-layer mean wind in the control simulation.
The location of Sinlaku at the corresponding time is indicated by the TC symbol.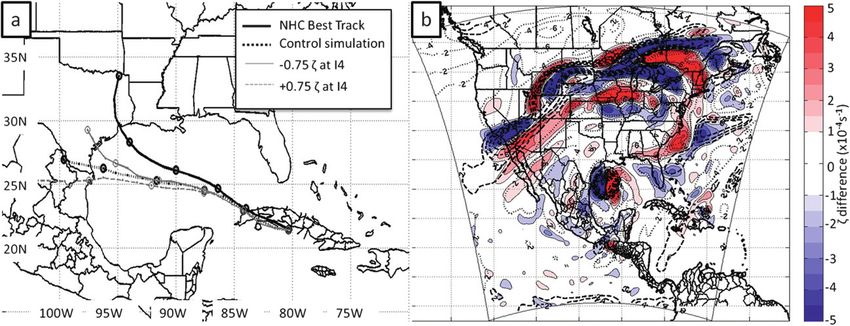
OCTOBER 2011                                    KOMAROMI ET AL.                                                              3231

continued slow westward motion, resulting in a 5-day              TABLE 2. First two columns are as in Table 1. Boldface shows
track forecast error of just 113 km (compared with             errors (in km) of the control forecast for Typhoon Sinlaku, ini-
                                                               tialized on 0000 UTC 10 Sep 2008. The remaining numbers show
644 km in the control run), is likely due to a combination
                                                               the improvements (2) or degradations (1) to the control forecast
of the weaker southeasterly flow in the Pacific ridge and      (km), computed as the track forecast error of the perturbed sim-
the beta drift of Sinlaku.                                     ulation minus that of the control simulation. Values in italics (and
   In contrast, when the trough at S1 is strengthened          underlined) correspond to improvements over 100 (200) km.
(amax 5 10.23), the opposite evolutionary pattern occurs.
                                                               Target   amax    48 h    60 h   72 h    84 h   96 h   108 h 120 h
As the positive meridional wind perturbation on the east
                                                               CTRL             44   67  150  240  347 509 644
side of the trough extends southward, Sinlaku acceler-
                                                               S1       20.75 1185 1179 195 1100 1120 223 295
ates northward around the western periphery of the             S1       20.23 126 215 2146 2220 2234 2378 2531
strengthened Pacific ridge. In doing so, Sinlaku recurves      S2       20.75 1212 1225 1150 1153 1120 276 296
even earlier in the perturbed simulation than the con-         S2       20.55 1159 1129 168 148 119 2206 2311
trol, with a 5-day error exceeding 1000 km. Similar re-        S2       20.25 160 215 2119 2160 2174 2362 2444
                                                               S2       20.15 136 246 291 2108 2142 2274 2355
sults have been found for perturbations of different
                                                               S3       20.75 185 114 287 2122 2162 2323 2439
strengths, with larger perturbations producing propor-         S4       20.75 153 111 292 2141 2174 2362 2472
tionally greater deviations to the track. A summary of         SC       20.16 115 235 219 238        0 118 138
track errors of the control and perturbed simulations is       SE       20.75 136 235 255 293 2160 2246 2363
given in Table 2.
  2) S2: UPPER-LEVEL LOW
                                                               over China (Fig. 6c). There is relatively little modifica-
   Target S2 is perturbed using amax 5 60.75, 60.55,           tion to the flow in the midlatitudes. Furthermore, the
60.25, and 60.15, generating maximum changes to the            magnitude of the S2 perturbation near Sinlaku is larger
850–200-hPa wind of 4.9, 3.6, 1.6, and 1.0 m s21, re-          than that for S1 at 24 h, possibly due in part to the rel-
spectively, at the target, and initial wind perturbations of   ative proximity of S2 to Sinlaku compared with S1. At
0.6, 0.4, 0.2, and 0.1 m s21 at Sinlaku. A wide spreading      later times, the weakening of the southerly wind on the
of 5-day track forecasts for Sinlaku results from these        west side of the Pacific ridge remains, leading to a
eight perturbations (Fig. 4b). All simulations in which        weaker northward motion of Sinlaku than in the control
the short wave is strengthened lead to an earlier re-          simulation (Figs. 6d–f). As is the case with the weak-
curvature, and a track even farther from the best track        ening of the S1 trough, the recurvature of Sinlaku is
than the control. The perturbations with amax 5 20.75          again delayed, leading to a forecast track that drifts
and 20.55 overly weaken the short wave, sending                farther westward with a 5-day track forecast error of
Sinlaku into southern Taiwan and then on to China. The         only 200 km. Again, there is a minimal short-term de-
simulations closest to the best track are produced with        terioration of the forecast track, but this becomes
amax 5 20.25 and 20.15. The 20.25 perturbation is              overwhelmed by the improvement beyond 2 days as the
selected for further investigation.                            influence of the perturbations to the synoptic environ-
   The S2 vorticity perturbation exhibits similar vertical     ment takes over.
and radial structures to the initial S1 perturbation (as
                                                                 3) S3 AND S4: LOWER-LEVEL PERTURBATIONS
seen in Fig. 1a). The structures of the resulting perturbed
height and wind fields are also similar (as seen in Figs. 1c      Despite the fact that both low-level targets (with amax 5
and 1d), although comparatively smaller and weaker             60.75) have a minimal vorticity signature at the upper
due to the relative size and strength of the S2 shortwave.     levels and are of relatively small spatial scale, the sim-
By weakening the S2 shortwave, the southerly deep-             ulation of Sinlaku is sensitive to small perturbations in
layer mean wind component on the east side of the              these regions (Figs. 7a and 7b). In the 850–700-hPa layer
trough is weakened while the northerly component on            wind analysis (not shown), a broad region of south-
the west side of the trough is also weakened (Fig. 6a).        westerly winds associated with S3 appears to modify the
The southerly wind on the periphery of the Pacific an-         track of Sinlaku. In weakening the monsoon trough,
ticyclone east of Sinlaku, due south of the short-wave S2,     these winds subsequently weaken with negative pertur-
also weakens as the short wave propagates eastward             bations of zonal and meridional winds generated on the
(Figs. 6b and 6c). However, while the amplitude of the         east side of the trough. This signal weakens the envi-
evolving S1 perturbation is approximately equal in             ronmental forcing that supports the northeastward mo-
the two subtropical ridges adjacent to Sinlaku at 24 h, the    tion of Sinlaku, resulting in a track that is not as far to
evolving S2 perturbation is more lopsided, being consid-       the east or north as the control. Despite a small recur-
erably larger in the anticyclone over the Pacific than that    ring short-term deterioration of the track forecast, the
3232 MONTHLY WEATHER REVIEW VOLUME 139
FIG. 6. As in Fig. 5, but for the perturbation at S2 using amax 5 20.25.
long-term track forecast improves such that the 5-day toward the northeast than the control simulation over
error decreases to only 205 km. The opposite effect oc- the first 36 h.
curs when the monsoon trough S3 is strengthened. Upon
4) SC: LOCAL PERTURBATION
weakening S4 (Tropical Storm 16W), the subtropical
ridge over the western Pacific is allowed to build over the It is impossible to completely separate the sensitivity of
first 2 days, with the resulting increased deep-layer east- a tropical cyclone to the perturbed evolution of synoptic-
erlies on the southern side of the ridge forcing Sinlaku scale features from the sensitivity to the initial V pertur-
farther west and avoiding recurvature. The forecast track bation at or near the TC. To investigate the sensitivity of
error is consistently lower than that of S3 (172 km at Sinlaku to adjacent perturbations in the absence of
5 days), even though the initial wind perturbation is changes to the synoptic environment, a new perturbation
moderately smaller. And as expected, the strengthening (SC) is created. SC is selected to be 200 km to the north-
of 16W acts to weaken the subtropical ridge, inducing northwest of Sinlaku, directly in its path with a perturba-
a deep-layer flow that possesses a stronger component tion value of 0.59 m s21 at the TC that is chosen to be
FIG. 7. As in Fig. 4, but for perturbations at (a) S3 and (b) S4.OCTOBER 2011 KOMAROMI ET AL. 3233
FIG. 8. (a) ETKF summary map (normalized by maximum value) and location of target SE. (b) As in Fig. 4, but for
perturbations at SE.
identical to the corresponding value produced by S1 (with region centered on the TC is produced for an array of
amax 5 60.75). The perturbation SC produced virtually hypothetical column observations of horizontal wind,
no change to the 120-h track of Sinlaku, suggesting that temperature, and specific humidity sampled at 200, 500,
the sensitivity in the track forecast is more likely due to and 850 hPa at the initial time (0000 UTC 10 September
the evolving perturbation in the synoptic environment 2008 for Sinlaku). A 50-member ECMWF ensemble,
than the small initial perturbation near the TC. initialized 2 days prior to the initial time, is used in the
Another result of the SC perturbation is that an initial computations. The ETKF summary map guidance is
V perturbation of ;1 m s21 at the TC resulted in a plot of the reduction in wind forecast error variance as
a 15-km track forecast degradation at 48 h. This is of the a function of the location of the hypothetical observa-
same order as the increase in track errors seen in the tions (Fig. 8a). The maximum sensitivity to potential
other perturbations. Therefore, the initial degradations observations is exhibited in the vicinity of Sinlaku, with
in the track forecast from the other perturbations may secondary maxima coincident with S2, S3, and a likely
be due to a small deterioration of the representation of spurious target far to the northeast of Sinlaku. However,
the initial wind field near the TC, while the long-term there is relatively low sensitivity to observations in the
track improvements are due to an improvement of the base of the trough S1. Instead, an ETKF maximum ex-
representation of the synoptic features in the model. ists in an area downstream of the trough axis, and this
target is labeled SE. The WRF forecast sensitivity to the
5) SE: PERTURBATION BASED ON ETKF
application of initial perturbations of strength amax 5
The sensitivity of nonlinear model simulations to 60.75 (Fig. 8b) is found to be slightly weaker than
perturbations selected using an objective technique re- the sensitivity to the amax 5 60.75 perturbations applied
mains an open question. As a preliminary investigation, to S3 and S4, with a 5-day track forecast error of
an additional perturbation is created in a location of 281 km, still less than half the error of the control sim-
sensitivity selected by one such objective technique, the ulation.
ETKF. The ETKF uses ensemble Kalman filtering the-
6) INTERCOMPARISON OF SINLAKU
ory to estimate the reduction in forecast error variance
PERTURBATIONS
due to the assimilation of any given deployment of tar-
geted observations (Bishop et al. 2001). The version of Overall, it is evident that Typhoon Sinlaku exhibits
the ETKF modified for use with tropical cyclones sensitivity to a variety of targets in both the near and far
(Majumdar et al. 2011) is employed here. After re- synoptic environments. The 60.23 perturbation at S1,
moving the axisymmetric component of the vortex from the 60.75 perturbation at S2, and the 60.75 perturba-
each ensemble member, ensemble perturbations are tion at S3 all generate a maximum initial deep-layer
computed about the ensemble mean. From these per- mean wind perturbation of 4.9 m s21 at their targets,
turbations, estimates of the analysis and forecast error with small V perturbations of similar magnitude at
covariance matrices based on the assimilation of a sim- Sinlaku. (Target S4 is not considered in this comparison,
plified representation of the observational network can since a perturbation of 4.9 m s21 would correspond to
then be computed. In this study, the reduction in 48-h an unrealistically drastic modification to Tropical Storm
wind forecast error variance localized in a verification 16W.) Given the similarity in the magnitudes of these3234 MONTHLY WEATHER REVIEW VOLUME 139
FIG. 9. Hurricane Ike valid 0000 UTC 9 Sep 2008. (a) The 850–300-hPa layer mean streamlines (from CIMSS–
University of Wisconsin) and (b) the National Hurricane Center (NHC) best track and the 5-day WRF control
simulation.
perturbations, one may suggest via the magnitude of the for this study. At that time, Ike was situated along the
120-h track changes (Table 1) that Sinlaku is more southern coast of Cuba, possessing maximum sustained
sensitive to the perturbation of the smaller, but signifi- winds of 70 kt (averaged over 1 min), and traveling to-
cantly closer, short wave. To corroborate this argument ward the west-northwest on the southern periphery of
from a different angle, the magnitude of the velocity a strong anticyclone (Fig. 9a). The deep-layer mean flow
perturbation in S1 would need to exceed 15 m s21 in was considerably stronger than that of Sinlaku, given
order to generate a modification to the track comparable that Ike was propagating at 11 kt at the time. Ike con-
to S2. We therefore suggest that the track of Sinlaku is tinued in a general west-northwestward direction until
more sensitive to S2 than either S1 or S3 when the initial 1200 UTC 13 September, before undergoing recurvature
wind perturbations are similar. due to interaction with a short-wave trough over the
It should be emphasized that the results are de- southwestern United States.
pendent on the size and strength of the perturbation, The forecasts initialized on 0000 UTC 9 September
and not only the location. For example, it is evident from 2008 were noteworthy since the consensus of model
Table 2 that certain perturbations of S3 and S4 yield forecasts available to the National Hurricane Center for
larger improvements in the track forecast than some landfall shifted erroneously southward toward the
perturbations of S1 and S2. Texas–Mexico border, following earlier forecasts that
As mentioned above, those perturbations that resul- had depicted a landfall along the north Texas coast
ted in an improvement in the 120-h track forecast had (Brennan and Majumdar 2011). The WRF control sim-
degraded the 48-h forecast. However, the perturbations ulation exhibits a similar erroneous track (Fig. 9b) as
that produced the greatest improvement in the 5-day several operational models initialized at that time. The
track forecast (20.23 at S1, 20.25 at S2, and 20.75 at S3 control is accurate over the first day, after which the error
and S4) did not degrade the 48-h track forecast by more grows steadily and linearly by approximately 100 km
than 60 km. These short-term deteriorations are of day21 over the following 3 days. This error growth is as-
similar magnitude to what is expected to result from the sociated with a deviation that tracks progressively farther
effects of the initial V perturbations in the vicinity of the south relative to the best track. During days 4 and 5, the
TC, acting to degrade the initial motion of the TC, while control forecast of Ike remains to the south and avoids
long-term track improvements are associated with ei- interaction with the approaching short wave, thereby in-
ther an improvement in the initial representation of the correctly avoiding recurvature. The forecast error grows
synoptic environment of Sinlaku or a compensation for rapidly from 317 to 859 km between days 4 and 5.
errors produced by the perturbations. For several features including the ridge to the north
of Ike, the differences between the 84-h control simu-
4. Sensitivity analysis for Hurricane Ike (2008) lation and the corresponding ECMWF analysis used
for verification are relatively minor. However, the
a. Synopsis and selection of targets
control exhibits a less amplified long-wave pattern over
Hurricane Ike was entering the Gulf of Mexico on the continental United States than does the analysis
0000 UTC 9 September 2008, the initial time of interest (Figs. 10a and 10b). In the analysis, a short wave embeddedOCTOBER 2011 KOMAROMI ET AL. 3235 FIG. 10. Fields associated with Hurricane Ike, valid at 1200 UTC 12 Sep 2008. (a) ECMWF analysis and (b) 60-h WRF simulation of 500– 200-hPa layer mean relative vorticity (2 3 1024 s21; positive, dashed; negative, dotted) and corresponding wind vectors. (c) ECMWF analysis and (d) 60-h WRF simulation of meridional wind (m s21). Vertical cross section is along the latitude of Hurricane Ike. within the long-wave trough over the western United Several features within the environment of Ike are States merges with neighboring short waves along the designated as targets for perturbation, including the southern end of the long wave and propagates as far subtropical ridge, three upper-level short-wave troughs, south as the latitude of Ike, ultimately contributing to and two low-level short-wave troughs that are potential the recurvature of Ike (Fig. 10a). On the other hand, the candidates to modify the propagation and subsequent simulated short waves approaching the western United recurvature of Ike (Fig. 11). Values of amax and the per- States at this time are too positively tilted at 500 hPa and turbation radii for each target are given in Table 3. The have not moved as far south (Fig. 10b). The vertical first target is the western periphery of the 500–850-hPa cross section in the analysis reveals a strong (25– subtropical anticyclone immediately to the north of Ike 30 m s21) and broad southwesterly jet with two maxima, (designated IR). Although the ridge is a broad feature, one at 300 hPa and one above 200 hPa (Fig. 10c). In a perturbation radius of 400 km is selected to prevent contrast, the control simulation exhibits a narrower and modification to the initial structure of Ike. The three shallower southwesterly jet with only one maximum at upper-level troughs in which perturbations are made and above 200 hPa, and which is farther from Ike than between 200 and 500 hPa compose a strong short wave that in the analysis (Fig. 10d). The discrepancy between to the west of the Great Lakes (I1), a much weaker the long-wave patterns in the control and the verifying upper-level low east of the Bahamas (I2), and a short analysis suggests that Ike is less likely to undergo a wave of moderate intensity along the west coast of strong recurvature in the control simulation. California (I5). I1 is deemed a potentially significant
3236                                        MONTHLY WEATHER REVIEW                                                 VOLUME 139

  FIG. 11. ECMWF analysis within WRF domain valid at 0000 UTC 9 Sep 2008. (a) The 500–200-hPa layer mean relative vorticity
(shaded) and deep-layer mean vector wind (arrows) with upper-level targets I1 and I2 and (b) the 850–700-hPa layer mean relative
vorticity with low-level targets IR, I3, I4, and I5. The vorticity maximum adjacent to Cuba is Hurricane Ike.

target due to its size and strength, and therefore its po-        northeast within the subtropical jet and may interact with
tential ability to modify the long-wave pattern in the            the short waves that influence the recurvature of Ike.
midlatitudes. Target I2 is selected due to its proximity to       Perturbations in a midlatitude target identified by the
Ike. Target I5, which is embedded within a long-wave              ETKF (IE) and in a region local to Ike (IC) are also in-
trough, merges with other short waves to produce the              vestigated (Fig. 11). The ETKF targets the leading edge
short wave that is illustrated 84 h later in Fig. 10, and         of the midlatitude trough for both Sinlaku and Ike (SE
which is responsible for the recurvature of Ike. The              and IE).
three lower-level short waves in which perturbations are
                                                                  b. Sensitivity to perturbations
made between 500 and 850 hPa compose a small short
wave at the tail end of a cold front over Texas and                  The sensitivity study of Ike utilizes a uniform amax 5
Oklahoma (I3), Tropical Storm Lowell south of Baja                60.75 perturbation to all targets, except IC, consistent
California (I4), and the low-level reflection of target I5.       with the Sinlaku study. Similar to S2, amax for IR is in-
Note that target region I5 is perturbed at both upper and         crementally reduced to zero to demonstrate that, for
lower levels, due to the existence of both upper- and             some less-extreme modification of the ridge, there exists
lower-level short waves within the same region. Target I3         a set of initial conditions that will accurately depict the
bypasses Ike by less than 2000 km to the north. I4 is of          best track for Ike. A comparison at I1 between simula-
interest given that Lowell is advected toward the                 tions in which amax 5 60.75 and 61.00 demonstrates the

                        TABLE 3. As in Table 1, but for Hurricane Ike initialized on 0000 UTC 9 Sep 2008.

                         rpert     Distance                      jV9jmax at        jV9jmax at           48-h           120-h
Target       amax       (km)        (km)         ETKF         target (m s21)      TC (m s21)        Dtrack (km)     Dtrack (km)
 IR         20.75       400          1100         0.54              4.1               1.1               280            1042
 IR         20.55       400          1100         0.54              3.0               0.8               186             756
 IR         20.35       400          1100         0.54              1.9               0.5               112             524
 I1         11.00       600          2700         0.70             15.5               1.4               350             709
 I1         10.75       600          2700         0.70             11.6               1.1               284             600
 I1         10.22       500          2700         0.70              3.3               0.3                66             180
 I2         20.75       500          1500         0.65              3.3               0.3                20             132
 I3         10.75       400          2400         0.75              2.0               0.1                20              46
 I4         20.75       400          3400         0.78              5.4               0.2                 0             327
 I5         10.75       500          4500         N/A               3.5               0.1                20              66
 IC         10.04       400           200         0.80              1.2               1.1                 0              46
 IE         10.75       600          2600         0.91             10.7               0.7               198             544
OCTOBER 2011 KOMAROMI ET AL. 3237
FIG. 12. The 5-day WRF track simulations initialized 0000 UTC 10 Sep 2008 for perturbations at targets
(a) IR and (b) I1.
difference between substantially weakening (strength- While the perturbed simulation of Ike remains less than
ening) a short wave and removing (doubling) the short 200 km north of the control simulation through to 72 h
wave altogether. A perturbation of 60.22 is applied to (Fig. 13e), this gain in latitude and slow motion is suffi-
I1 in order to produce a jV9jmax at I1 equal to jV9jmax at cient for Ike to fall under the influence of the ap-
I2 (60.75) for comparison. Finally, a 60.04 perturbation proaching trough over the southwestern United States,
is applied to IC in order to produce a V perturbation of resulting in recurvature at 108 h (Fig. 13f). Also note
average magnitude equal to 1 m s21 within a 300-km that the weakening of the IR ridge has allowed the
radius of Ike. western United States trough to extend farther south by
108 h, inducing strengthened southerlies over the
1) IR: ATLANTIC RIDGE
southern United States and western Gulf of Mexico. The
Target IR is perturbed using amax 5 60.75, 60.55, recurvature in the perturbed simulation is proposed to
and 60.35, generating maximum 850–200-hPa wind be primarily a consequence of the gain in latitude of Ike,
perturbations of 15.5, 11.6, and 3.3 m s21, respectively, which is attributed to the weakening of the western
at the target (Table 3). The WRF simulation initialized periphery of the Atlantic ridge. The southward shift of
with amax 5 20.35, which corresponds to a modest the long-wave trough also likely contributes to the re-
weakening of the initial ridge, produces a track that re- curvature.
sembles the best track for the first 3 days (Fig. 12a).
2) I1: MIDLATITUDE TROUGH
While recurvature occurs at the correct time in this
simulation, the forward velocity of Ike is too slow, pro- Target I1 is perturbed using amax 5 60.22, 60.75,
ducing recurvature too far south and 5-day forecast er- and 61.00, generating maximum 850–200-hPa wind
rors of approximately 400 km, mostly along track.
However, this track error is less than half of that of the
control. A summary of the track errors in the control and TABLE 4. As in Table 2, but for Hurricane Ike initialized on
various perturbed simulations is given in Table 4. 0000 UTC 9 Sep 2008.
The initial weakening of the subtropical ridge pro- Target amax 48 h 60 h 72 h 84 h 96 h 108 h 120 h
duces a negative meridional wind (y) perturbation to the
CTRL 119 170 190 236 317 514 859
north-northwest of Ike and a positive y perturbation to
IR 20.75 149 164 1121 1161 1131 266 2349
the north-northeast of Ike (Fig. 13a). Within the first IR 20.55 241 254 240 230 279 2273 2520
24 h, the negative y perturbation diminishes, while the IR 20.35 298 2149 2149 2144 2148 2298 2452
positive y perturbation grows (Figs. 13b and 13c). The I1 11.00 1113 1153 1232 1225 1109 280 2331
positive perturbation, corresponding to a strengthening I1 10.75 147 149 190 174 24 2181 2386
I1 10.22 265 274 251 262 252 2112 2180
of the southerly wind component, amplifies thereafter,
I2 20.75 23 220 210 229 230 292 2127
allowing Ike to propagate 100 km farther north in the I3 10.75 220 210 218 23 1 4 25
perturbed simulation than the control at 48 h (Fig. 13d). I4 20.75 0 239 218 262 299 2198 2324
The far-field propagation of the perturbation signal I5 10.75 23 210 0 23 31 29 43
beyond 48 h is evident off the Eastern Seaboard, and IC 10.04 0 0 118 217 230 262 246
IE 10.75 238 234 211 220 245 2177 2392
eventually within the long-wave pattern (Figs. 13d–f).3238 MONTHLY WEATHER REVIEW VOLUME 139 FIG. 13. (a)–(c) Colors show the meridional wind difference (m s21) between the perturbed (amax 5 20.35) and control WRF simu- lations for (a) 0, (b) 12, and (c) 24 h. Vectors show the 850–200-hPa layer mean wind in the perturbed simulation. (d)–(f) Contours show the 500–200-hPa layer mean relative vorticity (2 3 1024 s21; positive, dashed; negative, dotted). Colors show the relative vorticity dif- ference between the perturbed and control simulations (31024 s21) at (d) 48, (e) 72, and (f) 108 h. The location of Ike at the corre- sponding time is indicated by the TC symbol. perturbations of 3.3, 11.6, and 15.5 m s21, respectively, albeit with slightly higher track errors (Fig. 14d). Con- at the target. Weakening the short wave consistently current with the direct initial change to Ike’s track, the degrades the track forecast, producing a landfall south midlatitude long- and short-wave patterns are also of the control (Fig. 12b). Conversely, strengthening the modified via the I1 perturbation. This modification be- short wave produces landfall locations farther north of gins when the short wave associated with I1 lifts to the the control. A strong perturbation, amax 5 10.75, is northeast, leading to a ridge building in from the west. necessary to produce a simulated track close to the best This ridge is more amplified in the perturbed simulation track at longer time ranges, with an improvement over than in the control, consistent with the differences be- the control of nearly 400 km at 15 days. However, in tween the verifying analysis and the control. Farther improving the long-range track forecast and landfall lo- upstream, the short wave initially over the Pacific North- cation, the short-range track forecast is slightly de- west is propagating southward, more so in the perturbed teriorated due to a northward bias. simulation. By 72 h, a phase difference is evident in the The initial perturbation yields a stronger southerly short wave around 428N, 1108W, with positive vorticity (northerly) wind component on the eastern (western) perturbations to the west of and extending farther south side of the short wave (Fig. 14a). During the first 12 h, the than the negative perturbations (Fig. 14e). At the same control and perturbed tracks remain similar (Fig. 12), time, the vorticity associated with the local maximum given the time necessary for the initially remote per- over Southern California is shifted to the east. This turbation to reach the immediate environment of Ike suggests that the pattern is less positively tilted than in (Fig. 14b). By 24 h, a southward extension of positive the control forecast, resulting in landfall over northern perturbations of meridional wind dominates the envi- Texas at 108 h (Fig. 14f). In summary, the strengthening ronment of Ike, increasing the southerly component of of vorticity at I1 amplifies the synoptic pattern in two the deep-layer flow and producing a simulated track ways: a direct increase in the southerly component of northward of the best track (Fig. 14c). By 48 h, the winds near Ike, followed by interaction with a short-wave evolved perturbations are generally neutral around Ike, trough modified by the upstream influence of the I1 per- leading to a track parallel to the control simulation, turbation. The upstream and downstream propagations of
OCTOBER 2011                                      KOMAROMI ET AL.                                                        3239

                               FIG. 14. As in Fig. 13, but for perturbation at I1 with amax 5 10.75.

the short-wave perturbations in the midlatitude storm              due to the weakening of Lowell leads to a more accurate
track have been observed in both the I1 and S1 pertur-             track forecast of Ike.
bations, consistent with the results of Simmons and Hos-
                                                                     4) OTHER PERTURBATIONS
kins (1979), who had determined that upstream and
downstream development occurs in nonlinear simulations                The WRF simulations of Ike exhibit little to no sensi-
of an initially local perturbation in zonal baroclinic flows.      tivity to perturbations I2, I3, or I5, since the tracks pro-
                                                                   duced by the associated perturbed simulations are almost
  3) I4: TROPICAL STORM LOWELL
                                                                   identical to the control (not shown). For I2, a dynamical
   The perturbation I4 (amax 5 20.75), corresponding               connection between the weak upper-level trough over
to the weakening of Tropical Storm Lowell, produces                the Atlantic and the environment of Ike is weak. For I3
virtually no change to the track forecast up to 84 h,              and I5, the perturbations grow but only act to produce
followed by a modest recurvature and improvement to                small-scale phase shifts within the subtropical jet. As
the landfall location by 324 km (Fig. 15a). The weak-              had been investigated in the Sinlaku case, a perturbation
ening of Lowell produces a meridional phase shift in the           (IC) is created adjacent to Ike, to produce an initial
relative vorticity over the U.S.–Mexico border after               maximum velocity perturbation over Ike of 1.08 m s21,
1 day, and the positive part of this vorticity perturbation        identical to that produced over Ike by the strong am-
then spreads northward and splits. The western branch              plification of the short-wave I1 near the Great Lakes.
of this positive perturbation maintains its position over          The evolved perturbation from IC dissipates within the
the southwestern United States, increasing slightly in             first 24 h, resulting in no change to the track forecast of
magnitude to produce a coherent signature in the                   Ike. As with Sinlaku, it is suggested that the modification
evolved vorticity perturbation by 84 h (Fig. 15b). The             to the track arises from remote sources, and not the
double dipole over the western United States corre-                small initial perturbation local to the tropical cyclone.
sponds to the large-scale pattern becoming less positively
                                                                     5) IE: PERTURBATION BASED ON ETKF
tilted, improving the consistency with the verifying anal-
ysis in Fig. 10a. Unlike the IR and I1 cases, there                  The ETKF guidance for Ike exhibits several areas of
is negligible modification to the flow adjacent to Ike prior       potential sensitivity to the assimilation of observations,
to its interaction with the short wave. It is therefore            including I3 and I4 (Fig. 16a). However, as for Sinlaku, the
suggested that the amplification of the upstream pattern           target in the midlatitude storm track is situated slightly
3240 MONTHLY WEATHER REVIEW VOLUME 139
FIG. 15. (a) As in Fig. 12, but for perturbations at I4, corresponding to Tropical Storm Lowell. (b) Contours show the 500–200-hPa layer
mean relative vorticity of the control simulation at 84-h (2 3 1024 s21; positive, dashed; negative, dotted). Colors show the relative
vorticity difference between the perturbed (I4, amax 5 20.75) and the control simulation (31024 s21) at 84 h, valid 1200 UTC 12 Sep 2008.
downstream from the trough axis (labeled IE), in an area unperturbed short-wave trough and undergo recurva-
of lower vorticity but higher velocity. Also common with ture. Second, a very strong perturbation to a mid-
the Sinlaku case is the fact that a modification to the track latitude short wave (I1, IE) resulted in an improvement
simulation is evident when a perturbation of strength to the track forecast, due to a similar gain in latitude at
amax 5 10.75 is applied in this area (IE; see Fig. 16b). early times, but also the amplification of the large-scale
Although the reasoning for the improved track is similar pattern upstream that assisted the recurvature. Third,
to that offered for I1, the forecast errors are consistently a weakening of Tropical Storm Lowell (I4) did not
lower than those for I1 at all times. produce a gain in latitude at early times, but served to
amplify the upstream large-scale pattern resulting in
6) INTERCOMPARISON OF IKE’S PERTURBATIONS
a modest recurvature that the control failed to produce.
Overall, in contrast to the sensitivity analysis for In the control and perturbed simulations, the track er-
Sinlaku, only a limited number of perturbations were rors grew fastest between 4 and 5 days, at the time that
found to improve the track forecast of Ike. First, a Ike underwent recurvature.
modest weakening of the ridge directly north of Ike (IR) In contrast with Sinlaku, the majority of the Ike per-
produced the most significant and immediate improve- turbations that produced 120-h track improvements also
ment. The gain in latitude due to the weakening ridge improved the 48-h track forecast. This indicates that, in
was sufficient for Ike to interact with a relatively addition to a genuine improvement of the initial
FIG. 16. (a) ETKF summary map (normalized by maximum value) and location of target IE. (b) As in Fig. 4, but for
perturbations at IE.OCTOBER 2011 KOMAROMI ET AL. 3241
representation of the synoptic environment in the feature of sensitivity was a short-wave trough in the
model, the initial V perturbation at the TC produced by midlatitude jet, although a strong perturbation that
generating the perturbations for Ike compensated for an amplified the upper-level relative vorticity by 75% was
initial analysis error close to the TC. necessary for this simulation to be consistent with the
best track. The modifications to Ike’s track in this case
were due to a strengthening of the southerly component
5. Conclusions
of the flow near Ike, and an amplification of the large-
An examination of the sensitivity of numerical simu- scale midlatitude pattern via upstream propagation of
lations of tropical cyclone (TC) track to initial pertur- the perturbation, which acted to reduce the positive tilt
bations has been conducted for Typhoon Sinlaku (2008) of a short-wave trough over the western United States.
and Hurricane Ike (2008). Balanced perturbations of The weakening of Tropical Storm Lowell in the eastern
different amplitude, spatial scale, and location were North Pacific basin induced a modest recurvature, due
created via a modification of local relative vorticity at to a similar modification of the pattern over the western
a chosen location and depth. For each TC, 5-day Ad- United States. Unlike for Sinlaku, most perturbations
vanced Research WRF simulations of 21-km resolution that improved the long-range (120 h) track forecast also
were integrated from the unperturbed (‘‘control’’) and resulted in an improved short-range (48 h) forecast.
perturbed initial conditions. The control simulations The ETKF indicated several similar target regions to
replicated forecast errors evident in the operational those selected subjectively, for both cases. However, its
models, with a premature recurvature in the forecast for ranking of the targets, based on reduction of wind
Sinlaku and a landfall too far south along the Texas forecast error variance in the tropical cyclone, was in-
coast for Ike. consistent with those concluded from the perturbation
It was found that several perturbed simulations of experiments. In particular, the ETKF did not identify
Sinlaku exhibited large modifications to its track. The the ridge immediately due north of Ike as an important
greatest improvement to the track forecast occurred target for supplementary observations, due in part to the
when the vorticity associated with either of two short low variance in the ensemble perturbations in that re-
waves to the north of Sinlaku was weakened, suggesting gion. Consistency between the ETKF targets and loca-
that one or both of the short waves may have been ini- tions of maximum initial condition sensitivity found in
tialized too strongly, thereby contributing to an erro- this paper is not necessarily expected, given that the
neous recurvature. In each case, the weakening of the ETKF is an observation sensitivity method that assumes
short wave acted to decrease the northerly component ensemble-based data assimilation and is correct only
of the flow in the deep-layer anticyclones to the west and when error covariance information is perfect and the
east of Sinlaku, thereby keeping the simulated TC suf- model dynamics are linear.
ficiently far south to avoid recurvature. Perturbations to The methodology offered in this paper offers a retro-
a decaying tropical storm and the monsoon trough to the spective qualitative understanding of environmental
southwest also yielded modifications to the track, dem- features that may or may not be important in governing
onstrating that this forecast case was likely one of un- the track forecast of a TC, for a particular model. It
usually low predictability. While all perturbations resulted should be noted that the results are dependent upon the
in increased short-term track errors, those simulations user’s choice of the strength and spatial extent of the
that produced the greatest improvement in long-term initial perturbation. The perturbations are confined to
track performance only degraded the 48-h track forecast local features (such as individual short waves), and
by 85 km or less. These simulations correspondingly im- therefore the technique is applicable to resolving ques-
proved the 120-h track forecast by 363 km or more. tions about where local corrections to the analysis may
In contrast to the Sinlaku case, the strengthening or have led to improved forecasts, either via selective re-
weakening of vorticity in the synoptic environment of gional targeting of observations or improvements to the
Ike exhibited weaker sensitivity for several choices of data assimilation. Finally, the technique may be utilized
perturbation. The highest sensitivity was found when the to evaluate the efficacy of objective initial condition
adjacent Atlantic ridge north of Ike was weakened sensitivity methods and related initialization methods
slightly, thereby increasing the southerly component of for ensemble forecasts.
the deep-layer mean wind and producing a gain in lati-
tude that was sufficient for the perturbed simulation of Acknowledgments. The authors acknowledge funding
Ike to undergo recurvature around the time of landfall in from the Office of Naval Research (Grant N00014-08-1-
northern Texas. This gain in latitude was not produced 0251). The authors are also grateful to Chris Velden,
in many simulations, including the control. A second Rolf Langland, and David Nolan for their commentsYou can also read