LOS ANGELES INTERNATIONAL AIRPORT IN 2011 - ECONOMIC IMPACT ANALYSIS
←
→
Page content transcription
If your browser does not render page correctly, please read the page content below
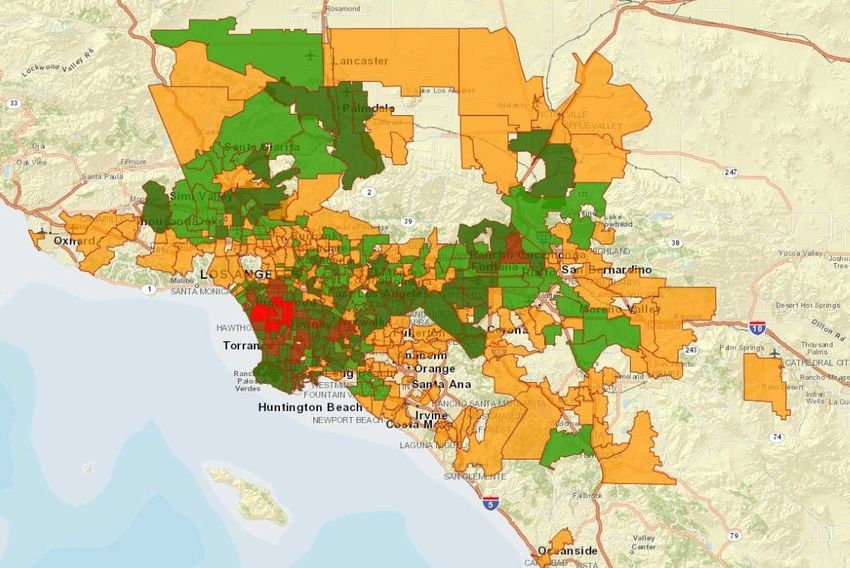
Photo: LAWA, LAX

        LOS ANGELES
   INTERNATIONAL AIRPORT
          IN 2011

ECONOMIC IMPACT ANALYSIS

      ECONOMIC & POLICY ANALYSIS GROUP
Los Angeles County Economic Development Corporation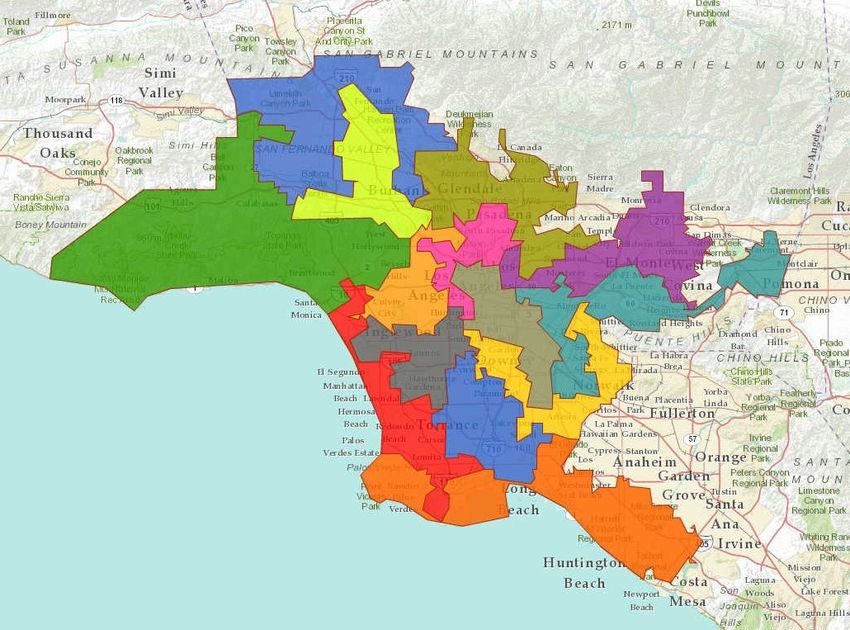
Los Angeles County Economic Development Corporation
444 S. Flower Street, 37th Floor Los Angeles, CA 90071
(888) 4-LAEDC-1 www.LAEDC.org
Christine Cooper, Ph.D.
Myasnik Poghosyan
Shannon M. Sedgwick
August 2012
This report was commissioned by the Los Angeles World Airports.
The LAEDC Economic and Policy Analysis Group offers objective economic and policy research for public agencies
and private firms. The group focuses on economic impact studies, regional industry analyses, economic forecasts and
issue studies, particularly in water, transportation, infrastructure and environmental policy.
Every reasonable effort has been made to ensure that the data contained herein reflect the most accurate and timely
information possible and they are believed to be reliable.
The report is provided solely for informational purposes and is not to be construed as providing advice,
recommendations, endorsements, representations or warranties of any kind whatsoever.
Economic Impact Analysis                                                                     Los Angeles International Airport in 2011

         Executive Summary
         Los Angeles International Airport (LAX),
         located at the western edge of the city where
         the land meets the Pacific Ocean, is the
         sixth-busiest airport in the world, with 61
         million passengers moving in and out of the
         airport on 265,000 flights during the 2011
         fiscal year. More than 1.9 million tons of air
         freight and mail was carried.

         This activity and other on- and off-airport
         operations contributes to the local and
         regional economy by generating business
         revenues for firms providing passenger and aviation service and all supporting services, and
         by providing employment for thousands of workers. All this activity, in turn, generates tax
         revenue for state and local governments.

         Economic and Fiscal Impact
         The economic activity in Los Angeles County resulting from activity occurring at LAX in
         2011, including its capital spending and its related visitor spending, generated 294,400 jobs in
         Los Angeles County with labor income of $13.6 billion and economic output of more than
         $39.7 billion. This activity added $2.5 billion to local and state revenues.

                                      Economic Impact of Los Angeles International Airport in 2011
                                                        (Los Angeles County)
                                                     LAX Ongoing          Capital           Visitor
                                                                                                            TOTAL *
                                                      Operations        Expenditures       Spending
                                                        Direct Economic Activity
             Employment                                  51,600                5,400        119,100           176,100
             Output ($ millions)                         11,100                    850       10,000            22,000
                                                    Total Economic and Fiscal Impact
             Employment (jobs)                          103,100               10,700        180,600           294,400
             Labor income ($ millions)                    6,200                    600        6,800            13,600
             Output ($ millions)                         18,900                1,700         19,000            39,700
             State and local taxes ($ millions)           1,100                     60        1,340             2,500
             * May not sum due to rounding
             Source: Estimates by LAEDC

     Economic and Policy Analysis Group                                                                                              i
Los Angeles International Airport in 2011                                                                  Economic Impact Analysis

         Distribution of Total Employment Impacts
         The total employment impacts are distributed throughout the local and regional economy.
         Based upon the industrial composition of employment within a variety of geographically
         defined areas, including LA County Supervisorial Districts, LA City Council Districts, U.S.
         Congressional districts and regional cities, the total employment impacts of LAX, its capital
         spending and its related visitor spending are estimated.

         Future Capital Projects
         LAWA is in the planning                  Estimated Economic Impact of LAX Prospective Improvements
         stages of additional capital                                                    Los Angeles         Southern
         improvement projects at the                                                       County            California
         airport which they estimate will                             Estimated Direct Economic Activity
         involve expenditures of at least       Employment (jobs)                            44,900              44,900
         $8.5 billion over a period of                                      Total Economic Impact
         ten to fifteen years.
                                                Employment (jobs)                            90,500              98,800
                                                Labor income ($ millions)                     5,600               6,000
         It is estimated that this
         spending will generate 90,500          Output ($ millions)                          14,400              15,900
         job-years in Los Angeles               State and local taxes ($ millions)             520                  590
         County with labor income of            * May not sum due to rounding
                                                Sources: LAWA; Estimates by LAEDC
         $5.6 billion, and add $520
         million in state and local tax
         revenues over the project period.

         Catalytic Effects of LAX
         The presence and utilization of air transportation services involving the movement of goods
         and people act as a catalyst to additional economic activity not directly related to the aviation
         industry, its supply chain or its workers. These include:

                   Demand-side catalytic effects relating to the utilization or consumption of air
                   transportation services provided at LAX.

                   Supply-side catalytic effects, relating to larger market accessibility and increased
                   productivity of local firms.

ii                                                                                             Economic and Policy Analysis Group
Table of Contents

ECONOMIC IMPACT ANALYSIS
 1 Introduction                                                               3
     Economic Impact Analysis                                             4
     Approach and Methodology                                             5

 2 Economic Impact                                                            7
     LAWA Operations at LAX                                               7
     Other On-Airport Activity at LAX                                     9
     LAX-Adjacent Activity                                               12
     LAX Modernization Program – Spending in FY 2011                     14
     Overnight Air Visitor Spending                                      15
     Summary of Results                                                  18

 3 Geographic Distribution of Impacts                                         20
     LAWA’s LAX Employment                                               20
     Employment Impacts in the City Council Districts                    21
     Employment Impacts in Los Angeles County Supervisorial Districts    23
     Employment Impacts in Selected U.S. Congressional Districts         24
     Employment Impacts in Selected Cities                               26

 4 Future Prospective Capital Projects                                        28

CATALYTIC EFFECTS
 5 Catalytic Effects                                                          33
     Demand-Side Catalytic Effects                                       33
     Supply-Side Catalytic Effects                                       37

APPENDIX
     Description of Industry Sectors                                    A-3
This page intentionally left blank

ECONOMIC IMPACT
ANALYSIS

                  1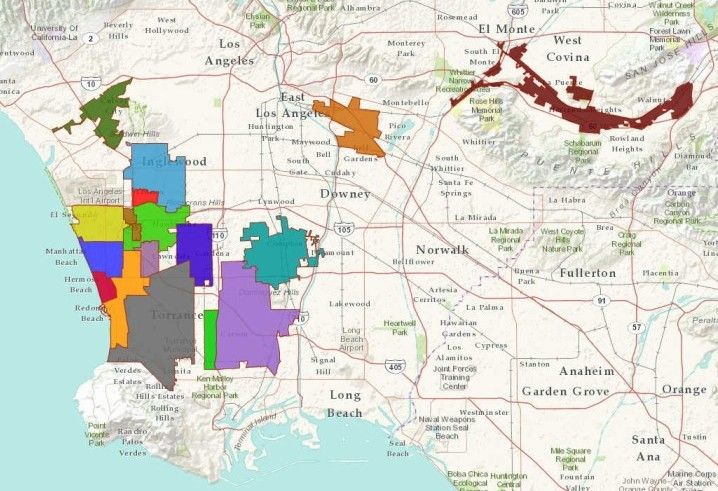
This page intentionally left blank

Economic Impact Analysis                                                        Los Angeles International Airport in 2011

         1 Introduction
         Los Angeles International Airport
         (LAX) is the world’s sixth-busiest
         airport and the nation’s leading origin-
         and-destination airport. Flights from
         LAX connect to more than 80 domestic
         destinations and 66 international
         destinations around the globe.

         The airport is a complex and vibrant
         center of diverse activity, much like a
         small city. On any single day, more than
         150,000 passengers walk through one
         of the terminals, often accompanied by
         greeting friends or relatives, stopping to
         purchase a snack or a souvenir on their
         way to the departure gate, or hailing a
         cab or shuttle bus to take them to their
         home, their business appointment, their hotel or their parked car. Thousands of employees
         arrive at work at the airport each day, booking passengers into departing flights, serving
         meals or refreshments to passengers and other employees, providing maintenance services to
         airlines and to the airport administration, guarding against security risks, handling cargo, and
         providing a myriad other work activities.

         This report quantifies the regional economic effects of the airport by analyzing how regional
         residents and businesses benefit from the services provided at LAX by both on- and off-
         airport firms that cater to airport users. These firms include domestic and international
         airlines, cargo services, food and beverage establishments, newsstands and other retailers,
         ground transportation, off-airport parking, government agencies and maintenance firms. In
         the region surrounding the airport, additional activity that caters to airport users include
         hotels, restaurants, freight forwarders, warehouses, small manufacturers, gas stations, travel
         agencies, cargo handlers and educators. Additional activity is generated in the region by the
         spending of the domestic and international passengers who arrive to spend a few nights in
         the region and enjoy local amenities and cultural attractions.

         Each of these firms hire workers from around the region, paying wages and benefits which
         circulate throughout the local and regional economy, and purchase millions of dollars worth
         of goods and services, much of which is provided by other local suppliers.

         The extent to which the original demand from airport users circulates through the economy
         into additional economic activity in the City of Los Angeles and Los Angeles County is
         significant, which is shown below.

     Economic and Policy Analysis Group                                                                                3
Los Angeles International Airport in 2011                                                   Economic Impact Analysis

         Economic Impact Analysis
         Economic impact analysis is used to estimate the overall economic activity, including the
         spill-over and multiplier impacts, which occurs as a result of a particular business, event, or
         geography.

         The initial economic impact of the activity occurring at the airport is the purchase of goods
         and services from local vendors and the wages and benefits paid to local workers. This
         injection of funds into the region circulates from the initial recipients to the owners and
         employees of establishments that help supply them with goods and services for purchase.

         For example, airlines purchase large amounts of jet fuel, food and catering supplies, janitorial
         services and operating supplies, from paper goods to computer services. They also pay the
         wages and benefits of their own workers, including ticket agents and flight crews.

         The suppliers of all the goods and services sold to the airlines in turn hire their own staff and
         purchase parts and other inputs in order to fill the orders received from the airlines.

         Workers at the airlines and at the supplier companies spend a portion of their incomes on
         groceries, rent, vehicle expenses, healthcare, entertainment, and so on. The recirculation of
         the original expenditures multiplies the initial impact through these indirect and induced
         effects.

         The extent to which the initial expenditures multiply is estimated using economic models
         that depict the relationships between industries (such as construction and its suppliers) and
         among different economic agents (such as industries and their employees). These models are
         built upon actual data of expenditure patterns that are reported to the U.S. Bureau of Labor
         Statistics, the U.S. Census Bureau and the Bureau of Economic Analysis of the U.S.
         Department of Commerce. Data is regionalized so that it reflects and incorporates local
         conditions such as prevailing wages rates, idiosyncratic expenditure patterns, and resource
         availability and costs.

         The magnitude of the multiplying effect differs from one region to another depending on
         the extent to which the local region can fill the demand for all rounds of supplying needs.
         For example, the automobile manufacturing industry has high multipliers in Detroit and
         Indiana since these regions have deep and wide supplier networks, while the same industry
         multiplier in Phoenix is quite small. In another example, the jobs multiplier for the
         construction industry is higher in, say, Arkansas, than in California because the same amount
         of spending will purchase fewer workers in Los Angeles than in Little Rock.

         Multipliers can also differ from year to year as relative material and labor costs change and as
         the production “recipe” of industries change. For example, the IT revolution significantly
         reduced the job multiplier of many industries (such as automotive manufacturing,
         accounting, architecture and publishing) as computers replaced administrative and
         production workers.

4                                                                                  Economic and Policy Analysis Group
Economic Impact Analysis Los Angeles International Airport in 2011
Approach and Methodology
Economic impact analysis typically
begins with an increase in final demand
for an industry’s output, such as a
purchase of construction services, or
an inflow of out-of-town visitors who
spend money at local accommodations
and retail outlets. In the case of an
airport, this would encompass a wide
variety of activity, including not only
the terminal services provided by
LAWA but also retail, food and
beverages, automated teller machines,
phone and internet service, parking,
rental cars, taxi and limousine services,
and government services such as
security and immigration and customs
agents.
The diversity of activity at the airport presents a challenge in defining the parameters of the
activity to include in an economic impact analysis.
Our approach is to define the geographic area for which we are estimating the economic
impact. We begin by estimating the impact of LAWA operations at the airport. LAWA pays
the salaries of thousands of local workers and purchases millions of dollars worth of goods
and services, most of which originates in the region, during the course of ongoing, regular
airport operations.
We follow this with an analysis of all other on-airport activity, including retail, food and
beverages, maintenance, airline services and ground transportation. Finally, we expand the
analysis to include off-airport activity occurring in a circumscribed region adjacent to the
airport.
We consulted a variety of data sources to determine the direct activity occurring in each
geographic unit. Our estimates for LAWA operations at LAX are produced using data from
LAWA’s Annual Financial Report for the fiscal year ending June 30, 2011. Spending
estimates for the airport modernization projects were also provided by LAWA.
Our estimates of direct activity for on-airport operations and off-airport operations adjacent
to LAX were developed using GIS mapping of the airport property and the surrounding
region. These maps were overlaid with Census Bureau data on employment by place of work
for the 2010 calendar year. This employment data is taken from official unemployment
insurance payroll returns filed by all covered businesses, and identifies the numbers of jobs
in each industry sector within the defined geography. While accurate insofar as the data is
Economic and Policy Analysis Group 5Los Angeles International Airport in 2011 Economic Impact Analysis
defined, these returns will underestimate government employment which is not covered by
the unemployment insurance system, and will not count employees who work at the airport
but whose official business address is elsewhere.
To estimate the local spending of domestic and international visitors to the region, we use
data published by the Los Angeles Tourism and Convention Board on overnight visitors and
their spending patterns.
Once the initial direct activity was determined, we estimated the indirect and induced
impacts using models developed with data and software from MIG, Inc. Our regions of
interest are Los Angeles County and the five-county Southern California region (consisting
of the counties of Los Angeles, Orange, Riverside, San Bernardino and Ventura). MIG’s
IMPLAN system is a robust widely-used set of modeling tools that provide economic
resolution from the national level down to the ZIP code level.
To estimate the regional, five-county impacts, we employ multi-regional analysis since we
know that the initial direct activity occurs in Los Angeles County. Multi-regional analysis
allows the estimation of the spill-over impact into the neighboring four counties, and the
subsequent spill-over impact from each of these four counties back into Los Angeles
County. Such multi-regional analysis provides a more accurate picture of the overall impact
in the larger region of activity which originates in Los Angeles County.
The metrics used to determine the value of the economic impact include employment, labor
income and the value of output. Employment numbers include full-time, part-time, permanent
and seasonal employees, and the self-employed, and are measured on a job-count basis
regardless of the number of hours worked. Labor income is a measure of all income received
by both payroll employees and the self-employed, including wages and benefits such as
health insurance and pension plan contributions. Output is the value of the goods and
services produced. For most industries, this is simply the revenues generated through sales;
for others, in particular retail industries, output is the value of the services supplied.
The total impacts include direct, indirect and induced effects, as the examples above illustrate.
Direct employment is the personnel hired by the airport administration and by the airlines,
the concessionaires and other related companies in their ongoing operations, including ticket
agents, engineers, maintenance workers, administrative, management, parking attendants,
and so on. Direct output is the value of the services provided by each business firm or entity.
Indirect effects are those which stem from the employment and output motivated by the
purchases made by each direct company. For example, indirect jobs are sustained by the
suppliers of the office supplies and insurance purchased by LAWA, American Airlines, and
Wolfgang Puck Express. Induced effects are those generated by the household spending of
employees whose wages are sustained by both direct and indirect spending.
Our estimates for labor income and output are reported in 2012 dollars. Employment
estimates are reported on an annual basis, i.e., the number of full and part time jobs
supported in one year.
6 Economic and Policy Analysis GroupEconomic Impact Analysis Los Angeles International Airport in 2011
2 Economic Impact
The estimation of the economic impact of ongoing
operations at LAX is taken in five parts. First, the
annual operations of Los Angeles World Airports
(LAWA) at LAX is analyzed. Thereafter, all other
on-airport activity is reviewed, followed by off-
airport activity adjacent to the airport. In the
fourth section, we estimate the economic activity
associated with the modernization program that is
currently underway. Finally, we conclude with an
analysis of the spending of visitors whose travel to
Los Angeles is facilitated by LAX.
LAWA Operations at LAX
During the 2011 fiscal year, LAX handled 265,000 domestic and international flights,
carrying 60.6 million passengers and 1.9 million tons of mail and cargo. This activity
generated operating revenue of $772 million and resulted in the employment of 3,550
workers with salaries and benefits of $323 million. Financial data for LAX for the fiscal year
is shown in Exhibit 2-1.
Exhibit 2-1 Approximately two-thirds of
LAWA Operations at LAX Financial Summary (FY2011) LAWA’s operating revenue at LAX
Operating revenue ($ millions): originates from landing fees,
Aviation revenue (landing fees, building and building rent and land rental.
505.3
land rentals, etc.) Concession revenue from non-
Concession revenue 263.2 aviation firms at the airport
Other operating revenue 3.4 generated the majority of the
Total 771.9 remaining one-third of operating
revenue.
Operating expenses ($ millions):
LAWA spent more than $323
Salaries and benefits 323.5
million on salaries and benefits for
Contractual services 143.7 its employees, and an additional
Materials and supplies 32.7 $144 million on contracted
Utilities 29.6 services. It purchased $33 million
Other operating expenses (incl. allocated admin
11.7
in materials and supplies, and $30
charges) million in utility services, many of
Total * 541.2 which are sourced from the local
* Does not include depreciation and amortization and regional economy.
Source: LAWA Annual Financial Report FY 2011
Economic and Policy Analysis Group 7Los Angeles International Airport in 2011 Economic Impact Analysis
Using operating revenues, employment and salaries and benefits as the direct economic
activity of LAWA at LAX, the estimated total economic and fiscal impact in Los Angeles
County and in the five-county Southern California region is shown in Exhibit 2-2.
Exhibit 2-2
It is estimated that LAWA
Economic and Fiscal Impact of LAWA Operations at LAX operations at LAX during the
Los Angeles Southern fiscal year ending June 30,
County California 2011, supported 8,700 annual
Direct Economic Activity: jobs with total labor income of
Employment (jobs) 3,550 3,550 $590 million in Los Angeles
County and 9,400 annual jobs
Labor income ($ millions) 323 323
with total labor income of $620
Output ($ millions) 772 772
million in the five-county
Southern California region.
Total Economic Impact:
Employment (jobs) 8,700 9,400 The total output impact is
Labor income ($ millions) 590 620 estimated to have been $1.5
Output ($ millions) 1,450 1,560 billion in Los Angeles County
and an additional $110 million
Total Fiscal Impact ($ millions):
in the four neighboring
counties of Southern
State and local taxes 71 77
California.
Federal taxes 122 130
Sources: LAWA; Estimates by LAEDC
This activity in Los Angeles
County is estimated to have
generated $71 million in state and local tax revenues, and $122 million in federal tax
revenues. When accounting additional activity occurring in the larger Southern California
region, state and local tax revenues are $77 million and federal taxes are $130 million.
8 Economic and Policy Analysis GroupEconomic Impact Analysis Los Angeles International Airport in 2011
Other On-Airport Activity at LAX
LAWA is the operator and landlord of airport
property, which includes more than the terminals
and runways. With thousands of employees and
hundreds of thousands of passengers moving
through the airport on a daily basis, a myriad of
businesses delivering on-airport services have located
on the premises. Examples of businesses delivering
on-airport services include domestic and
international airlines (carrying passengers and/or
cargo), airport tenants performing services to airlines,
retail establishments, food and beverage
establishments, public agencies engaged in air traffic
control and providing security, and emergency
services.
A large number of employees who work at LAX are
not directly employed by LAWA but are employed
by firms contracted to operate at LAX.
Badge counts provide a picture of other employees
that work at the airport: many providers of freight
and passenger air transportation locate their operations at LAX—FedEx itself employs more
than 3,000 workers at LAX, and airline companies alone employ an additional 12,000 people.
City and county employees number almost 1,000. The U.S. Department of Homeland
Security staffs the TSA with almost 3,000 employees. Other federal agencies with staff at the
airport include General Services Administration, the Department of Agriculture, the Federal
Bureau of Investigation, Fish and Wildlife, the State Department, the Drug Enforcement
Agency, and the Food and Drug Administration.
Total employment related to on-airport businesses may not be fully represented by badge
count data. For example, employees who work in establishments located in publicly
accessible areas of the airport do not require badges.
To obtain complete detailed employment and payroll data estimates across all industries for
the on-airport services, unrelated to LAWA, we defined LAX as a custom site using GIS
software. Specialized reports containing place of work data can be obtained using the
defined custom geography. A map of the custom site of LAX property is shown in Exhibit
2-3.
Economic and Policy Analysis Group 9Los Angeles International Airport in 2011 Economic Impact Analysis
Exhibit 2-3 Using the map,
Map of LAX Property payroll data for
employment by place
of work is estimated
for each business
location within the
defined geography.
The summary of
employment by
industry sector
within the property is
shown in Exhibit 2-
4. Most employees
are in the
transportation sector,
which includes not
only airlines but also airport support services such as cabin service, and freight handling.
Other measureable employment is found in the accommodation and food services and in the
public sector, which would include TSA
employees and US Customs and Border
Patrol. Exhibit 2-4
Employment in Other On-Airport Activity at LAX
This summary does not include LAWA’s Industry Sector Employment
employment since that was estimated in the Utilities 109
previous section. All other on-airport Construction 13
activities employ 25,540 persons in Manufacturing 14
addition to LAWA’s employment. Wholesale trade 512
Retail trade 344
To avoid double-counting of impacts, such Transportation and warehousing 16,809
as those which occur when airport Information 96
employees purchase food and beverages Finance and insurance 72
from concessionaires on airport property, Real estate and rental and leasing 582
we have discounted the actual employment Professional, scientific and technical services 174
recorded in the region. Management of companies 6
Administrative and waste management 310
Using the estimated on-airport activities Educational services 15
employment, estimates of the total Health care and social assistance 66
economic and fiscal impact of other on- Arts, entertainment and recreation 1
airport activity in Los Angeles County and Accommodation and food services 1,850
in the five-county Southern California Other services 335
region can be generated. These impacts are Public administration 4,225
shown in Exhibit 2-5. Total * 25,540
Source: U.S. Census Bureau Local Employment Dynamics 2010
10 Economic and Policy Analysis GroupEconomic Impact Analysis Los Angeles International Airport in 2011
It is estimated that other on-
Exhibit 2-5
Economic and Fiscal Impact of Other On-Airport Activity airport activities at LAX
Los Angeles Southern
during the year supported
County California 56,000 annual jobs with total
Estimated Direct Economic Activity: labor income of $3.5 billion
Employment (jobs) 25,540 25,540
in Los Angeles County and
61,100 annual jobs with total
Output ($ millions) 7,000 7,000
labor income of $3.8 billion
in the five-county Southern
Total Economic Impact: California region.
Employment (jobs) 56,000 61,100
Labor income ($ millions) 3,530 3,800 The total output impact is
Output ($ millions) 11,840 12,720 estimated to have been
$11.8 billion in Los Angeles
Total Fiscal Impact ($ millions):
County and an additional
$880 million in the four
State and local taxes 702 750
neighboring counties of
Federal taxes 829 896
Southern California.
Sources: LAWA; Estimates by LAEDC
The total economic activity
in Los Angeles County is estimated to have generated $702 million in state and local tax
revenues, and $829 million in federal tax revenues. When accounting additional activity
occurring in the larger Southern California region, state and local tax revenues are $750
million and federal taxes are $896 million.
Economic and Policy Analysis Group 11Los Angeles International Airport in 2011 Economic Impact Analysis
LAX-Adjacent Activity
In addition to on-airport business activity, a variety of
businesses operate within close proximity to the airport
for the purpose of catering to airport users. Examples of
such businesses include hotels, restaurant, freight
forwarders, ground transportation, rental car agencies,
ticket agents, truck transportation, warehouses,
manufacturers and local maintenance services.
In this section, we estimate the economic impact of all
businesses within a prescribed geographic region of the
airport, since their livelihood is dependent on proximity.
For example, hotels within the area house the overnight
crew of international and domestic airlines. While not all
crew will stay at an airport-adjacent hotel, the vast
majority will, and their spending is directly related to the
aviation services provided at the airport.
Similarly, convention facilities utilized near the airport are chosen specifically for their
proximity and ease of access for arriving visitors. These are included in our estimates of
direct activity because we believe that they would essentially vanish if the airport were not
there.
The boundaries of the LAX-adjacent area are Imperial Highway to the south, Manchester
Avenue to the north, Aviation Boulevard to the east, and the Pacific Ocean to the west. A
careful examination of a much broader area indicates that this LAX-adjacent geography is
appropriate. A map of the region is shown in Exhibit 2-6. Note the darker region in the
exhibit is the LAX airport property.
Exhibit 2-6
Map of LAX-Adjacent Area
12 Economic and Policy Analysis GroupEconomic Impact Analysis Los Angeles International Airport in 2011
Using the map, payroll data for employment Exhibit 2-7
by place of work is estimated for each Employment in LAX-Adjacent Area
business location within the defined Industry Sector Employment
geography. The summary of employment by Agriculture 25
industry sector within the property is shown Mining 1
in Exhibit 2-7. This summary does not Utilities 50
include LAWA’s employment or other on- Construction 199
airport employment shown in Exhibit 2-4. Manufacturing 1,593
Wholesale trade 1,511
To avoid double-counting of impacts, we Retail trade 1,074
have discounted the actual employment Transportation and warehousing 4,243
recorded in the region. Information 209
Finance and insurance 528
The methodology as was applied above is Real estate and rental and leasing 1,074
used to estimate the total economic impact Professional, scientific and technical 1,227
in the Los Angeles County and in the five- services
Management of companies 598
county Southern California region of activity Administrative and waste management 1,376
occurring the LAX-Adjacent region, which Educational services 1,071
is shown in Exhibit 2-8. Health care and social assistance 1,098
Arts, entertainment and recreation 163
It is estimated that activities in LAX- Accommodation and food services 5,253
adjacent area during the year supported
Other services 968
38,400 annual jobs with total labor income
Public administration 193
of $2.1 billion in Los Angeles County and
Total * 22,450
41,400 annual jobs with total labor income * May not sum due to rounding
of $2.2 billion in the five-county Southern Source: U.S. Census Bureau Local Employment Dynamics 2010
California region. The total output impact is
estimated to have been $5.6 billion in Los
Angeles County and an
additional $470 million in
Exhibit 2-8
Economic Impact of Activity in LAX–Adjacent Area the four neighboring
Los Angeles Southern
counties of Southern
County California California.
Estimated Direct Economic Activity:
Employment (jobs) 22,450 22,450
This activity is estimated to
have generated $327 million
Output ($ millions) 3,300 3,300
in state and local tax
revenues, and $467 million
Total Economic Impact: in federal tax revenues.
Employment (jobs) 38,400 41,400 When accounting additional
Labor income ($ millions) 2,080 2,230 activity occurring in the
Output ($ millions) 5,650 6,120 larger Southern California
region, state and local tax
Total Fiscal Impact ($ millions):
revenues are $352 million
and federal taxes are $503
State and local taxes 327 352
million.
Federal taxes 467 503
Sources: LAWA; Estimates by LAEDC
Economic and Policy Analysis Group 13Los Angeles International Airport in 2011 Economic Impact Analysis
LAX Modernization Program – Spending
in FY 2011
LAWA is in the completion stages of a multi-year
$4.11 billion renovation and improvement program
at LAX, which involved two major components: (i)
renovation of the Tom Bradley International
terminal, which included projects such as aircraft
taxilanes, replacement of the airport’s central utility
plant, airport gates, perimeter fencing, noise
mitigation and monitoring, and luggage screening
facilities; and (ii) improvements to and renovation of
the Central Terminal Area, including inline and
checkpoint improvements, new escalators, new
concession facilities, remodeled baggage claim area,
and a new consolidated rental car facility.
During the fiscal year, total capital improvement
spending was $850 million. The methodology as was applied above is used to estimate the
total economic impact in the Los Angeles County and in the five-county Southern California
region of activity resulting from this spending, which is shown in Exhibit 2-9.
It is estimated that the capital improvement spending of $850 million that occurred during
the fiscal year supported 10,700 jobs with total labor income of $600 million in Los Angeles
County and 11,700 annual jobs with total labor income of $690 million in the five-county
Southern California region.
Exhibit 2-9 The total output impact is
Economic Impact of LAX Modernization Program (FY 2011) estimated to have been $1.7
Los Angeles Southern billion in Los Angeles County
County California and an additional $200 million
Estimated Direct Economic Activity: in the four neighboring
Employment (jobs) 5,400 5,400 counties of Southern
Output ($ millions) 850 850 California.
This activity is estimated to
Total Economic Impact:
have generated $60 million in
Employment (jobs) 10,700 11,700 state and local tax revenues,
Labor income ($ millions) 600 690 and $130 million in federal tax
Output ($ millions) 1,700 1,900 revenues. When accounting
additional activity occurring in
Total Fiscal Impact ($ millions): the larger Southern California
State and local taxes 60 70 region, state and local tax
Federal taxes 130 140
revenues are $70 million and
Sources: LAWA; Estimates by LAEDC federal taxes are $140 million.
14 Economic and Policy Analysis GroupEconomic Impact Analysis Los Angeles International Airport in 2011
Overnight Air Visitor Spending
The more than 60 million passengers traveling
through LAX during the fiscal year provide
evidence of the significant economic impact in the
region of visitor spending facilitated by airport
services. As a leading origin and destination airport,
many passengers arriving at LAX choose to spend a
few nights in Los Angeles, enjoying the local
amenities and cultural attractions. With millions of
visitors arriving from overseas after often lengthy
flights, the region enjoys its role as an international
gateway and a conduit to the millions of visitors
who stay in local hotels, visit museums and theme
parks, shop at local retail establishments, and dine at
our famous restaurants.
The U.S. Department of Transportation provides data on passenger traffic between airports.
The sixth-busiest airport in the world in terms of overall passenger service, LAX is the third-
busiest in terms of international passenger service, behind John F. Kennedy Airport and
Miami International Airport.
Passenger traffic between LAX and its top international airport partners for the year ending
September 2011 is shown in Exhibit 2-10. Note that the number of passengers includes both
arrivals from and departures to the partner airport.
Exhibit 2-10
While this data shows the passenger
Top International Airport Partners (2011) traffic between LAX and international
airports, it does not provide
Airport Passengers
information about whether arriving
Heathrow (London, England) 1,447,630
passengers transferred to a domestic
Narita (Tokyo, Japan) 1,114,251 flight on the same day, or if passengers
Sydney (Sydney, Australia) 1,104,245 stayed in the Los Angeles area for any
Incheon (Seoul, Korea) 896,055 length of time. It is possible that
Taoyuan (Taipei, Taiwan) 894,670 passengers arriving from Tokyo or
Vancouver (Vancouver, Canada) 805,000 Sydney early in the morning will stay
Benito Juárez (Mexico City, Mexico) 696,657
the day in LA, perhaps visiting a theme
park or the Hollywood Walk of Fame,
Guadalajara (Guadalajara, Mexico) 693,928
and then return to LAX in the evening
Charles de Gaulle (Paris, France) 568,912
to catch a flight to New York or
Toronto Pearson (Toronto, Canada) 538,047 Chicago. Travelers who stay for the
All others 7,355,100 day are less likely to spend and are
Total 16,114,495 more likely to stay in the airport area,
Source: U.S. Department of Transportation T-100 Segment Data generating economic activity which has
already been estimated.
Economic and Policy Analysis Group 15Los Angeles International Airport in 2011 Economic Impact Analysis
The Los Angeles Tourism and Convention Bureau provides estimates for the number of
overnight visitors to Los Angeles, by country of origin, and their estimated aggregate
spending. For 2011, they estimate that
there were 5.9 million international
Exhibit 2-11 visitors spending an aggregate of $5.5
Overnight International Visitors (2011) billion, or $938 each.
Country of Origin Overnight Visitors % of total
Mexico 1,609,000 27.4
Not all of the international overnight
visitors shown in the exhibit arrive
Canada 675,000 11.5
through LAX. Some will arrive by
Australia 383,000 6.5
bus, automobile or train, or through
United Kingdom 372,000 6.3 another gateway such as John Wayne
China 338,000 5.8 Airport. Others will arrive by cruise
France 335,000 5.7 ship. To accommodate other arrival
Japan 289,000 4.9 routes, the total international
Germany 241,000 4.1 overnight visitor spending is
South Korea 240,000 4.1
discounted by fifteen percent.
Total 5,862,000 100.0
International visitors are not the only
Source: Los Angeles Tourism and Convention Bureau
source of tourist spending in the
region. More than 44 million
domestic passengers arrived or departed from LAX in 2011. Many of these certainly spent
time in Los Angeles, either for business or leisure. The Los Angeles Tourism and
Convention Bureau estimates that in 2011, there were 21 million domestic overnight visitors,
spending an aggregate of $9.7 billion, or $462 each. The city of origin of these visitors is
shown in Exhibit 2-12.
Again, not all of these visitors will
arrive through LAX. Many visitors Exhibit 2-12
from San Diego or from Las Vegas Overnight Domestic Visitors (2011)
will drive, as will others from cities
Domestic Origin Overnight Visitors % of total
in the Southern California region.
San Francisco Bay area 3,024,000 14.4
To accommodate other arrival
routes, the total domestic overnight San Diego 2,016,000 9.6
visitor spending is discounted by New York City area 1,428,000 6.8
twenty-five percent. Sacramento area 1,113,000 5.3
Phoenix 987,000 4.7
The composition of tourist Las Vegas 777,000 3.7
spending differs between leisure Chicago 756,000 3.6
and business travelers and between
Seattle 693,000 3.3
international and domestic visitors.
Fresno 588,000 2.8
Nevertheless, most visitors will
allocate their spending to hotels Portland 546,000 2.6
and accommodations, restaurants All others 9,072,000 43.2
and drinking establishments, retail Total 21,000,000 100.0
purchases, local cultural attractions, Source: Los Angeles Tourism and Convention Bureau
and local transportation.
16 Economic and Policy Analysis GroupEconomic Impact Analysis Los Angeles International Airport in 2011
Using the spending estimates of both international and domestic visitors allocated among
these categories, the total economic impact in the Los Angeles County and in the five-county
Southern California region of activity related to visitors arriving through LAX is shown in
Exhibit 2-13.
Exhibit 2-13
Economic Impact of Overnight Air Visitor Spending It is estimated that the visitor
Los Angeles Southern spending attributed to
County California international and domestic
Estimated Direct Economic Activity: visitors arriving through LAX
Employment (jobs) 119,100 119,100 during the year supported
Output ($ millions) 10,000 10,000 180,600 annual jobs with total
labor income of $6.8 billion
Total Economic Impact:
in Los Angeles County and
an additional 9,600 annual
Employment (jobs) 180,600 190,200
jobs with total labor income
Labor income ($ millions) 6,800 7,300
of $500 million in the rest of
Output ($ millions) 19,000 20,600 the five-county Southern
California region. The total
Total Fiscal Impact ($ millions): output impact is estimated to
State and local taxes 1,340 1,420 have been $19 billion in Los
Federal taxes 1,600 1,700 Angeles County and an
Source: Estimates by LAEDC additional $1.6 billion in the
four neighboring counties of
Southern California.
This activity is estimated to have generated $1.4 billion in state and local tax revenues, and
$1.7 billion in federal tax revenues.
Economic and Policy Analysis Group 17Los Angeles International Airport in 2011 Economic Impact Analysis
Summary of Results
Exhibit 2-14 presents the economic impact results of each of the preceding sections and
produces a total impact for ongoing operations at LAX and visitor spending facilitated by
the airport.
Exhibit 2-14
Economic Impact of Los Angeles International Airport
(Los Angeles County)
TOTAL*
Capital Visitor
Airport Activity Annual
Expenditures Spending
Impact
Estimated Direct Economic Activity:
Employment (jobs) 51,600 5,400 119,100 176,100
Output ($ millions) 11,100 850 10,000 22,000
Total Economic Impact:
Employment (jobs) 103,100 10,700 180,600 294,400
Labor income ($ millions) 6,200 600 6,800 13,600
Output ($ millions) 18,900 1,700 19,000 39,700
Total Fiscal Impact ($ millions):
State and local taxes 1,100 60 1,340 2,500
Federal taxes 1,400 130 1,600 3,100
* May not sum due to rounding
Sources: LAWA; Los Angeles Tourism and Convention Bureau; Estimates by LAEDC
The economic activity in Los Angeles County resulting from ongoing operations at LAX and
its immediate adjacent area generates 294,400 jobs in Los Angeles County with labor income
of $13.6 billion and economic output of $39.7 billion. This activity added $2.5 billion to local
and state revenues.
The total employment impact spills across industries in the region through these indirect and
induced effects, as shown in Exhibit 2-15.
The variety of industry sectors impacted by activities occurring at the airport and by the
visitor spending of tourists arriving through the airport is wide. The industry sector most
impacted is the accommodation and food service sector, with visitor spending being the
largest contributing factor in this impact. Other sectors experiencing large employment
impacts include retail trade, transportation and warehousing, and arts, entertainment and
recreation.
18 Economic and Policy Analysis GroupEconomic Impact Analysis Los Angeles International Airport in 2011
Exhibit 2-15
Employment Impact of All Activity at LAX by Industry Sector
(Los Angeles County)
Airport Capital Visitor
Industry Sector TOTAL*
Activity Expenditures Spending
Agriculture 45 0 50 100
Mining 240 20 80 340
Utilities 280 10 180 460
Construction 730 5,410 860 7,000
Manufacturing 2,940 240 1,570 4,750
Wholesale trade 3,060 160 1,290 4,510
Retail trade 6,740 670 20,750 28,150
Transportation and warehousing 27,630 210 2,240 30,090
Information 2,180 90 3,340 5,610
Finance and insurance 5,260 420 5,080 10,760
Real estate and rental and leasing 4,980 300 4,320 9,600
Professional, scientific and technical 5,340 790 5,680 11,810
services
Management of companies 1,070 30 830 1,940
Administrative and waste management 7,860 440 6,970 15,270
Educational services 2,360 140 1,590 4,100
Health care and social assistance 7,250 630 6,880 14,760
Arts, entertainment and recreation 1,610 120 26,440 28,170
Accommodation and food services 12,860 410 86,100 99,370
Other services 5,250 490 4,760 10,510
Public administration 2,370 70 1,590 7,030
Total * 103,100 10,700 180,600 294,400
* May not sum due to rounding
Source: Estimates by LAEDC
The values in the exhibit should be interpreted as illustrative of industry effects rather than
precise given model and data limitations.
Economic and Policy Analysis Group 19Los Angeles International Airport in 2011 Economic Impact Analysis
3 Geographic Distribution of Impacts
LAWA’s LAX Employment
LAWA directly employs over 3,500 workers at Los Angeles International Airport (LAX).
These jobs range in scope from facilities maintenance, baggage handling, air traffic control,
office and administrative roles to management, and they have varying education and
experience requirements for job entry. The labor pool from which LAX draws their
employees is vast. Workers from throughout the Southern California region seek out
employment opportunities at the airport. From San Diego County to Ventura County,
individuals commute from areas as far as Lancaster, Oceanside, Oxnard, and Palm Dessert.
Exhibit 3-1 shows the geographic distribution of LAWA’s LAX employees by zip code of
their resident addresses. While the most dense concentration of employees is in the
immediate vicinity of LAX, significant concentrations of employees live in surrounding
counties in zip codes that are located along major transportation arteries, including
Interstates 5, 10, 15 and 405 or U.S. Highway 101. It is reasonable to expect that employees
of all other businesses located on-airport and LAX-adjacent would be similarly dispersed
across the region.
Exhibit 3-1
Geographic Distribution of LAWA’s LAX Employees
55 + Employees
25-45 Employees
10-25 Employees
5-9 Employees
1-4 Employees
Source: LAWA
20 Economic and Policy Analysis GroupEconomic Impact Analysis Los Angeles International Airport in 2011
Employment Impacts in the City Exhibit 3-2
Los Angeles City Council Districts
Council Districts
7
Estimated employment impacts of ongoing
12
operations at Los Angeles International 2
Airport (LAX) and its adjacent area in Los
6
Angeles County and in the five-county 3
Southern California region were presented
5 4
above.
11 13 1 14
LAX is located in the City of Los Angeles, 10
which overall represents approximately forty 8
9
percent of the county employment. Total
employment impacts can be estimated for
the City of Los Angeles and for each of the
15 Council Districts using county-wide
employment shares.
15
All Council Districts benefit from the
indirect and induced effects of the activity at
LAX and its adjacent area, and each district
has residents who are employed at the airport Source: ESRI
or who are employed by vendors and
contractors servicing the airport.
Exhibit 3-3
LA City Employment by City Council District Exhibit 3-3 presents the overall
Council
Employment
% of City % of County distribution of employment in the
District Employment Employment
County and in the City by Council
1 75,180 5.2 2.1
District. District 9 has the most
2 60,230 4.2 1.6
3 92,984 6.5 2.5
payroll jobs, followed by District 5
4 80,266 5.6 2.2
and District 11.
5 203,211 14.1 5.6
6 67,332 4.7 1.8 Each district has its own
7 44,329 3.1 1.2 characteristics, with varying
8 42,786 3.0 1.2 concentrations of residential
9 272,523 19.0 7.4 neighborhoods and business
10 62,382 4.3 1.7 activity. As such, employment
11 132,634 9.2 3.6 impacts will not be received the
12 91,171 6.3 2.5 same for all districts.
13 73,765 5.1 2.0
14 83,115 5.8 2.3
15 55,687 3.9 1.5
Total * 1,437,595 100.0 39.3
* May not sum due to rounding
Source: U.S. Census Bureau Local Employment Dynamics 2010
Economic and Policy Analysis Group 21Los Angeles International Airport in 2011 Economic Impact Analysis
Based upon the industrial
Exhibit 3-4 composition of employment
Total Employment Impacts by City Council District
Airport Capital Visitor
of each district, and using the
District TOTAL * Census Bureau Local
Activity Expenditures Spending
1 2,120 220 3,710 6,050 Employment Dynamics data,
2 1,700 180 2,970 4,840 the total employment impacts
3 2,350 270 4,590 7,480 can be distributed across the
4 2,090 230 3,960 6,450 fifteen Los Angeles City
5 4,810 590 10,030 16,340 Council Districts.
6 1,850 200 3,320 5,410
7 1,040 130 2,190 3,570 Exhibit 3-4 displays the total
8 860 130 2,110 3,440 employment impacts of Los
9 8,390 790 13,450 21,920 Angeles International Airport
10 1,540 180 3,080 5,020 (LAX), its capital spending
11 7,620 390 6,550 10,670
and its related visitor spending
12 1,910 270 4,500 7,330
distributed across the fifteen
13 1,770 220 3,640 5,930
Los Angeles City Council
14 2,510 240 4,100 6,680
Districts and the city as a
15 1,990 160 2,750 4,480
whole.
Total * 40,480 3,840 70,940 115,600
* May not sum due to rounding
Source: Estimates by LAEDC
Note that although District 9 has the most
payroll jobs, it is not the district with the Exhibit 3-5
largest employment impact from LAX. As Jobs/Population Ratio
noted above, this is entirely due to the City Council Population
Jobs/
industrial composition of the employment in Population
District (18 years +)
Ratio
the districts and the industrial distribution of 1 174,652 43.0
the overall employment impact. 2 211,655 28.5
3 212,697 43.7
To add context to the distributed employment 4 211,257 38.0
impacts, Exhibit 3-5 presents the jobs-to- 5 227,746 89.2
populations ratio for each district (for 6 177,220 38.0
population aged 18 years and over). 7 176,816 25.1
8 188,205 22.7
Districts with high employment 9 181,172 150.4
concentrations will have larger values while 10 185,988 33.5
districts that contain large residential areas will 11 222,522 59.6
have more residents than employees, resulting 12 205,706 44.3
in lower ratio values. Larger employment 13 180,518 40.9
impacts will occur in areas where there is 14 175,701 47.3
existing concentrations of employment, due to 15 186,098 29.9
the existing structure and infrastructure of Total * 2,918,096 49.3
* May not sum due to rounding
each area. Source: US Census Bureau LED 2010 and 2010 Census
22 CONFIDENTIAL – DO NOT CITE Economic and Policy Analysis GroupEconomic Impact Analysis Los Angeles International Airport in 2011
Employment Impacts in the Supervisorial Districts of Los Angeles County
Beyond the city borders, other areas of the county benefit from the direct, indirect and
induced effects of activity occurring at LAX and its adjacent area, and from the visitor
spending of travelers arriving through LAX.
Using similar methodology as above, total
Exhibit 3-6
Employment by Supervisorial District
employment impacts can be estimated for
Council % of County
each of the five Supervisorial Districts of
Employment the County of Los Angeles.
District Employment
1 884,808 24.2
2 529,470 14.5 Exhibit 3-6 presents the overall distribution
3 828,826 22.6 of employment in the County by
4 732,142 20.0 Supervisorial District. District 1 has the
5 683,811 18.7 most payroll jobs, followed by District 3
Total * 3,659,057 100.0 and District 4.
* May not sum due to rounding
Source: U.S. Census Bureau LED 2010
Based upon the industrial Exhibit 3-7
composition of employment of Employment Impacts by Supervisorial District
each district, and using the Airport Capital Visitor
District TOTAL *
Census Bureau Local Activity Expenditures Spending
Employment Dynamics data, 1 24,910 2,580 46,660 71,150
the total employment impacts 2 14,910 1,540 26,130 42,580
3 23,340 2,410 40,900 66,650
are distributed across the five
4 20,620 2,130 36,130 58,870
Supervisorial Districts. Exhibit
5 19,250 1,990 33,740 54,990
3-7 shows the total
Total * 103,030 10,650 180,560 294,240
employment impacts of LAX, * May not sum due to rounding
its capital spending and its Source: Estimates by LAEDC
related visitor spending in each
district.
Again to add context to the
Exhibit 3-8 distributed employment impacts,
Jobs/Population Ratio Exhibit 3-8 presents the jobs-to-
Supervisorial Population Jobs/Population populations ratio for each district
District (18 years +) Ratio
1 1,442,093 61.4
(for population aged 18 years and
2 1,447,681 36.6
over).
3 1,551,688 53.4
4 1,488,748 49.2 Larger employment impacts will
5 1,486,184 46.0 occur in areas where there is existing
Total * 7,311,760 50.0 concentrations of employment, due
* May not sum due to rounding to the existing structure and
Source: US Census Bureau LED 2010 and 2010 Census
infrastructure of each area.
Economic and Policy Analysis Group 23Los Angeles International Airport in 2011 Economic Impact Analysis
Employment Impacts in Selected U.S. Congressional Districts
The Los Angeles basin is represented in the U.S Congress by several congressional districts.
These are shown in Exhibit 3-9.
The geographic contours of these districts do not conform to county borders, however. To
estimate the total employment impacts within individual congressional districts, therefore,
we use the larger Southern California region as the reference area.
Exhibit 3-9
U.S. Congressional Districts
27
28
29
30
31 32
33
38
34
35
39
37
36
46
Source: ESRI
Exhibit 3-10 shows the payroll employment in each of the selected congressional districts,
and the share of the Southern California payroll employment represented in each district.
Exhibit 3-11 below presents the total employment impacts of LAX, its capital spending and
its related visitor spending in each of the selected districts.
24 CONFIDENTIAL – DO NOT CITE Economic and Policy Analysis GroupEconomic Impact Analysis Los Angeles International Airport in 2011
Exhibit 3-10
Employment of Congressional District
% of Southern
Congressional
Employment California
District
Employment
27 255,033 3.5
28 173,141 2.7
29 313,475 4.9
30 477,844 7.5
31 131,792 2.1
32 193,728 3.1
33 214,580 3.4
34 521,281 8.2
35 149,708 2.4
36 290,114 4.6
37 231,508 3.6
38 249,712 3.9
39 151,928 2.4
46 283,192 4.5
Source: U.S. Census Bureau LED 2010
Exhibit 3-11
Employment Impacts in Selected U.S. Congressional Districts
Airport Capital Visitor
District TOTAL *
Activity Expenditures Spending
27 3,970 410 6,740 11,120
28 3,050 320 5,190 8,560
29 5,520 580 9,390 15,490
30 8,420 880 14,310 23,610
31 2,320 240 3,950 6,510
32 3,410 360 5,800 9,570
33 3,780 400 6,430 10,600
34 9,190 960 15,620 25,760
35 2,640 280 4,480 7,400
36 5,110 530 8,690 14,340
37 4,080 430 6,940 11,440
38 4,400 460 7,480 12,340
39 2,680 280 4,550 7,510
46 4,990 520 8,480 13,990
* May not sum due to rounding
Source: Estimates by LAEDC
Economic and Policy Analysis Group 25Los Angeles International Airport in 2011 Economic Impact Analysis
Employment Impacts in Selected Cities
In addition to the City of Los Angeles, many other cities reap benefits from the direct,
indirect and induced effects of activity occurring at LAX and its adjacent area, and from the
visitor spending of travelers arriving through LAX. Many of these cities are shown in
Exhibit 3-12.
Exhibit 3-12
Neighboring Cities of LAX
15
Source: ESRI
The cities most impacted are those that are closest to the airport. In particular, El Segundo,
Gardena, Hawthorne, Lawndale, Carson and Inglewood benefit from the economic activity
occurring at and around the airport. However, many other communities around the region
are impacted, including the beach cities, Torrance, Commerce, Culver City and Industry.
Using similar methodology as above, total employment impacts can be estimated for a
selection of cities in the region.
26 CONFIDENTIAL – DO NOT CITE Economic and Policy Analysis GroupEconomic Impact Analysis Los Angeles International Airport in 2011
Exhibit 3-13 presents the total employment impacts of LAX, its capital spending and its
related visitor spending in each of the cities.
Exhibit 3-13
Total Employment Impacts in Selected Cities
Airport Capital Visitor
District TOTAL*
Activity Expenditures Spending
Carson 1,290 130 2,270 3,690
Commerce 1,360 140 12,390 3,890
Compton 740 80 1,300 2,110
Culver City 1,310 140 2,290 3,730
Del Aire 40 0 80 130
El Segundo 1,690 170 2,960 4,820
Gardena 640 70 1,120 1,820
Hawthorne 490 50 860 1,400
Hermosa Beach 140 10 250 410
Industry 1,650 170 2,890 4,710
Inglewood 720 80 1,270 2,060
Lawndale 150 10 260 420
Lennox 60 10 110 180
Manhattan Beach 440 40 760 1,240
Redondo Beach 600 60 1,060 1,720
Torrance 2,520 260 4,420 7,200
West Carson 160 20 280 450
* May not sum due to rounding
Source: Estimates by LAEDC
Economic and Policy Analysis Group 27Los Angeles International Airport in 2011 Economic Impact Analysis
4 Future Prospective Capital Projects
LAWA is in the planning stages of additional
capital improvement projects at the airport,
including modernization of terminals and
pedestrian bridges, airfield improvements, a
consolidated rental car facility, and additional
transportation, roadway and parking facilities
enhancements. In total, these projects
represent significant infrastructure
improvements for the region, and will involve
expenditures over a period of ten to fifteen
years of at least $8.5 billion.
The total economic impacts of this
prospective investment are shown in Exhibit
4-1. Since the overall expenditures will occur
over a period of some years, the impacts
shown are an aggregate over the entire
investment period.
It is estimated that this investment program
will generate 90,500 jobs with total labor income of $5.6 billion in Los Angeles County and
98,800 annual jobs with total labor income of $6.0 billion in the five-county Southern
California region. The total output impact is estimated to be $14.4 billion in Los Angeles
County and an additional $1.5
billion in the four neighboring
Exhibit 4-1 counties of Southern
Estimated Economic Impact of LAX Prospective Improvements California.
Los Angeles Southern
County California
Further, it is estimated that
Estimated Direct Economic Activity: $520 million in state and local
Employment (jobs) 44,900 44,900 tax revenues and $1.1 billion in
federal tax revenues will be
Total Economic Impact: generated. When accounting
Employment (jobs) 90,500 98,800 for additional activity
Labor income ($ millions) 5,600 6,000
occurring in the larger
Southern California region,
Output ($ millions) 14,400 15,900
state and local tax revenues
will reach $590 million and
Total Fiscal Impact ($ millions): federal taxes $1.2 billion.
State and local taxes 520 590
Federal taxes 1,100 1,200 The total employment impact
* May not sum due to rounding spills across industries in the
Sources: LAWA; Estimates by LAEDC
28 CONFIDENTIAL – DO NOT CITE Economic and Policy Analysis GroupYou can also read