Revisiting traditional SSR based methodologies available for elephant genetic studies - Nature
←
→
Page content transcription
If your browser does not render page correctly, please read the page content below
www.nature.com/scientificreports
OPEN Revisiting traditional SSR
based methodologies available
for elephant genetic studies
M. S. L. R. P. Marasinghe1,4, R. M. R. Nilanthi1,4, H. A. B. M. Hathurusinghe2,4,
M. G. C. Sooriyabandara1,4, C. H. W. M. R. B. Chandrasekara2,4, K. A. N. C. Jayawardana1,
M. M. Kodagoda2, R. C. Rajapakse3 & P. C. G. Bandaranayake2*
Asian elephant (Elephas maximus) plays a significant role in natural ecosystems and it is considered as
an endangered animal. Molecular genetics studies on elephants’ dates back to 1990s. Microsatellite
markers have been the preferred choice and have played a major role in ecological, evolutionary and
conservation research on elephants over the past 20 years. However, technical constraints especially
related to the specificity of traditionally developed microsatellite markers have brought to question
their application, specifically when degraded samples are utilized for analysis. Therefore, we analyzed
the specificity of 24 sets of microsatellite markers frequently used for elephant molecular work.
Comparative wet lab analysis was done with blood and dung DNA in parallel with in silico work. Our
data suggest cross-amplification of unspecific products when field-collected dung samples are utilized
in assays. The necessity of Asian elephant specific set of microsatellites and or better molecular
techniques are highlighted.
Elephants are the largest living land mammals on the earth and they play an important role in ecosystems. Other
than the large body size, they are distinct from other animals having long muscular trunks and t usks1. Further,
the elephants are famous for their extraordinary sensory system and chemical communication2, unique vocal
communication3–5, memory power and intelligence6–9 and social b ehavior5,10,11.
Elephants belong to the family Elephantidae and the other Proboscidae evolved over 60 million years a go12.
There are two elephant species; the Asian elephant, Elephas maximus and the African elephant, Loxodonta
africana1, 13. Nevertheless, some morphological and molecular evidences suggest, African elephants are not one
species but, two. The Savannah elephant L. africana africana14 and forest elephant L. africana cyclotis13,15–20 are
deeply divergent lineages separated about 4–7 million years a go17,21. It is also recognized that there are three
subspecies of Asian elephant; Elephas maximus maximus from Sri Lanka (1758), Elephas maximus indicus from
Asian mainland/India (1978) and Elephas maximus sumatranus from Sumatra (1847)22–24.
Historical evidences suggest that the Asian elephant ranged from Mesopotamia in the west to the South and
Southeast Asia, China and to the Yangtze River24–30. However, currently it exists on about 15% of the historical
range, in a fragmented and isolated population in South and Southeast Asia24,30. Further, E. maximus is classified
as an ‘endangered’ species in IUCN (International Union for Conservation of Nature) red list31,32. Nevertheless,
Sri Lanka is the homage of a considerable E. maximus population consisting of about 5000–6000 elephants
(DWC records 2011).
The molecular work on elephant started in the early 1990s and initial studies focused on a few mitochondrial
regions28–30,33–39, nuclear genes and microsatellites or simple sequence repeats (SSR)20,40–55. The recent studies
include techniques such as multiplex g enotyping44, protein e lectrophoresis56, single nucleotide polymorphisms
(SNPs)57,58, shotgun and restriction site-associated DNA sequencing (RAD-seq)57,58 and transcriptomics59–61.
Further, relatively high coverage ~ 33.4X Savannah African elephant genome21 and ~ 94.4X of Asian elephant
genome62 are also available now. Scientists have also studied the phylogenetic relationship between E. maximus,
L.africana and Mammuthus primigenius (woolly mammoth)21,63,64.
However, thus far SSR is the most widely used technology in elephant molecular analysis, for resolving phy-
logenetic relationships12, 21,39,63–66, population structure and social organization5,37,41, 67–71, illegal poaching and
1
Department of Wildlife Conservation, 811/A, Jayanthipura Road, Battaramulla 10120, Sri Lanka. 2Agricultural
Biotechnology Centre, Faculty of Agriculture, University of Peradeniya, Peradeniya 20400, Sri Lanka. 3Department
of National Zoological Gardens, Anagarika Dharmapala Mawatha, Dehiwala 10350, Sri Lanka. 4These authors
contributed equally: M. S. L. R. P. Marasinghe, R. M. R. Nilanthi, H. A. B. M. Hathurusinghe, M. G. C. Sooriyabandara
and C. H. W. M. R. B. Chandrasekara. *email: pradeepag@agri.pdn.ac.lk
Scientific Reports | (2021) 11:8718 | https://doi.org/10.1038/s41598-021-88034-9 1
Vol.:(0123456789)www.nature.com/scientificreports/
ivory trade19,72–76, ecology and conservation23,27,28,77–79, distribution and behavior24 and sex d
etermination73,77,80–82.
While the early SSR studies were based on PCR amplification followed by polyacrylamide gel electrophoresis
and silver staining55,83, later studies utilized relatively advanced technologies such as fragment analysis or cap-
illary electrophoresis19,40,52,84–86. Elephant blood or tissues, as well as dung, have been utilized in the previous
studies37,87,88. Interestingly, the SSRs developed for the African elephant have been successfully utilized for Asian
elephant studies50,52,54,89 and vice v ersa19,90. When the first SSR study on Asian elephant was conducted in 2001,
neither the human genome nor the elephant genome was available. Therefore, the specificity of SSRs and the
possibility of amplification from other animals, plants and fungal species were not tested. Interestingly, the same
set of SSR is still being used around the world84,86,91,92. Nevertheless, the specificity of recently developed SSRs was
tested in silico using available genomic data and only the specific ones were selected for subsequent lab w ork84.
The specificity is very critical when the wild-collected dung samples are the only available material for molecu-
lar studies. Here we report lessons learned while utilizing previously published SSRs for amplification of blood
DNA from identified elephants and dung DNA extracted from wild-collected samples from Sri Lankan forests.
Results
Optimization of DNA extraction protocol. The quality and quantity of DNA are the key factors to the
success of any downstream application. As expected, quality DNA was obtained from the elephant blood using
a commercially available kit. However, the commercial kit QIAGEN QIAamp Fast DNA Stool Mini Kit (Cat.
No, 51,604) protocol that is optimized for faecal samples had to be modified to extract good quality DNA from
elephant dung. From the studied temperature and time combinations, 56 °C for 4 h incubation resulted in high-
quality DNA with the least PCR inhibitors and therefore, was selected for dung DNA extraction from the rest
of the samples (Supplementary Figure S1A). The optimized protocol worked efficiently for fresh dung less than
24 h old, and for the outermost mucus layer stored at 4 °C for 2 weeks (Supplementary Figure S1B).
Optimization of PCR conditions for elephant blood DNA. Among the tested reaction and thermo-
cycler conditions, the optimum PCR mixture consisted of 1 × GoTaq Flexi buffer (Promega, Cat No: M891A),
160 µM dNTP mixture (Promega, Cat No: U151B), 1.5 mM MgCl2 (Promega, Cat No: A35H), 0.12 M Spermi-
dine, 0.8% PVP, 0.2 µM Reverse Primer, 0.2 µM FAM-labeled M13 Forward Primer, 0.08 µM M13 tailed Forward
primer (Integrated DNA Technologies IDT, Singapore), 1 Unit Go Taq Flexi DNA polymerase (Promega, Cat
No: M8295) and 100 ng RNase treated DNA template in a 25 µL reaction volume. The touchdown PCR program
consisted of initial denaturation at 94 °C for 5 min, followed by 30 cycles of 94 °C for 1 min, 58 °C for 30 s and
72 °C for 1 min and 08 cycles of 94 °C for 1 min, 55 °C for 30 s and 72 °C for 1 min and final extension at 72 °C
for 5 min.
Selection of SSRs. First, we selected the ten most polymorphic SSRs from previous studies to assess their
suitability for studying the genetic relationship of the current Sri Lankan elephant population. For this, we
selected six elephants housed in the National Zoological Garden of Sri Lanka. This could be considered as a
representative sample of Sri Lankan elephants since they have different morphological features and were from
different geographical locations. The blood DNA extracted amplified with ten SSRs resulted di, tri and tetra-
nucleotide repeats. However, of the ten markers, only eight were polymorphic (Table 1). The EMU17 presented
the highest number of alleles (Table 1), while both EMU10 and EMU13 amplified only two alleles. The UPGMA
dendrogram built with capillary sequencing data (Supplementary Figure S2) showed the relationship among the
six elephants in the National Zoological Garden (Fig. 1).
The six individuals were grouped into two clusters, where Namalee, Bandula, Devi and Ganga clustered
together while Kema and Indi were together. Interestingly, Bandula and Namalee have similar morphologi-
cal features, such as, the abundance of freckles (depigmentation) on the trunk (Supplementary Figure S3a,b
respectively). Devi and Ganga have an average number of freckles on the trunk (Supplementary Figure S3c,d
respectively). The tusker, Kema grouped separately with Indi and both do not have freckles on the trunk (Sup-
plementary Figure S3e,f).
Selection of polymorphic SSR loci for Sri Lankan wild elephant analysis. We initially selected ten
most polymorphic SSRs from previous studies and assessed the suitability of them using blood DNA extracted
from a representative group of elephants. Since only eight of them were polymorphic and number of alleles
observed were less than previous studies, we included 24 SSRs identified from the literature. Further, we selected
another set of elephants including one animal with Indian origin to address the possibility of less overall genetic
diversity among elephants in National Zoological Garden of Sri Lanka. At this point, we also moved from blood
to dung, since collecting blood from a large number of wild elephants are not practically possible for any study.
Therefore, dung samples from four randomly selected domesticated elephants were included in this experiment.
Of the multiple bands detected in 1.5% Agarose gel (Fig. 2), some were approximately similar to the previ-
ously reported work and for the bands resulted from blood samples in the current study, while the others were
much bigger. Therefore, only the fragments with the expected size were considered in the analysis (Table 1).
Except for LafMS06, LA4, EMU13 and EMU17, all the other SSRs showed more alleles than previous reports.
Nine out of ten SSRs used for blood DNA work, amplified more alleles when those were used for amplification
from dung (Table 1). The EMU06 had interesting amplification even in the blood where only 50% (3 out of 6) of
samples resulted visible products. Though the blood and dung were not from the same elephants, monomorphic
bands were consistently present in all the samples. Further, numbers of bands were consistently higher in dung
samples. Though one of the elephants used in dung analysis is with Indian origin, no clear differences were
observed in amplification patterns (Fig. 2d). The current analysis also showed that the primers designed for
Scientific Reports | (2021) 11:8718 | https://doi.org/10.1038/s41598-021-88034-9 2
Vol:.(1234567890)www.nature.com/scientificreports/
Alleles observed in the current study
Blood (06 samples) Dung (04 samples)
Allele size reported Reported number
Reported allele size in the current study of alleles from Total no: of alleles Polymorphic Total no: of alleles Polymorphic
No Locus from literature (bp) (bp) literature observed percentage (%) observed percentage (%)
1 LafMS02 136–168 124–181 8 – 10 100.0
2 LafMS06 138–156 138–185 8 – 6 50.0
3 EMX-1 137–152 133–222 4 – 5 80.0
4 EMX-2 217–223 165–242 2 – 6 33.33
5 EMX-3 238–254 238–273 2 – 4 100.0
6 EMX-4 351–387 351–400 3 – 3 100.0
7 EMX-5 248–263 202–281 3 – 7 100.0
8 LA2 226–241 217–364 4 – 6 66.67
9 LA3 166–172 127–204 3 – 7 71.42
10 LA4 111–137 111–137 4 – 2 100.0
11 LA5 130–154 140–160 2 – 3 33.33
12 LA6 155–214 161–185 3 – 8 100.0
13 EMU03 137–143 106–162 4 – 6 100.0
14 EMU04 97–107 115–173 6 6 83.33 9 100.0
15 EMU06 146–158 122–164 4 5* 80.0 4 75.0
16 EMU07 102–122 111–200 5 3 100.0 8 100.0
17 EMU09 163–169 140–185 4 4 75.0 5 100.0
18 EMU10 94–104 106–145 5 2 0 6 100.0
19 EMU11 122–136 137–149 5 4 75.0 6 100.0
20 EMU12 120–152 110–155 5 6 66.67 6 83.33
21 EMU13 100–110 114–171 6 2 0 5 100.0
22 EMU14 130–138 143–165 4 – – 8 87.5
23 EMU15 142–154 131–170 6 3 100.0 7 100.0
24 EMU17 119–137 108–149 8 7 100.0 3 100.0
Table 1. Summary of capillary electrophoresis data. The blood and dung samples are not from the same
elephants. However, monomorphic bands were present in all the cases. *For some loci only few samples
amplified (3 out of 6). (–) Not tested in the current study.
Figure 1. Relationship among Asian elephants in the National Zoological Garden, Sri Lanka. The phylogenetic
tree developed based on the binary data matrix obtained by reading distinctive peaks of fragment analysis data,
using UPGMA method. Bootstrap probability values for 1000 bootstrap resamples are indicated at each node.
Scientific Reports | (2021) 11:8718 | https://doi.org/10.1038/s41598-021-88034-9 3
Vol.:(0123456789)www.nature.com/scientificreports/
Figure 2. Identification of polymorphic markers for amplification of dung DNA. Primer names are given on
the top of each well. L-100 bp ladder (Promega, Cat no: G2101), (a) – (c) Sri Lankan origin, (d) Indian origin.
Full-length gels are presented in Supplementary Figure S4.
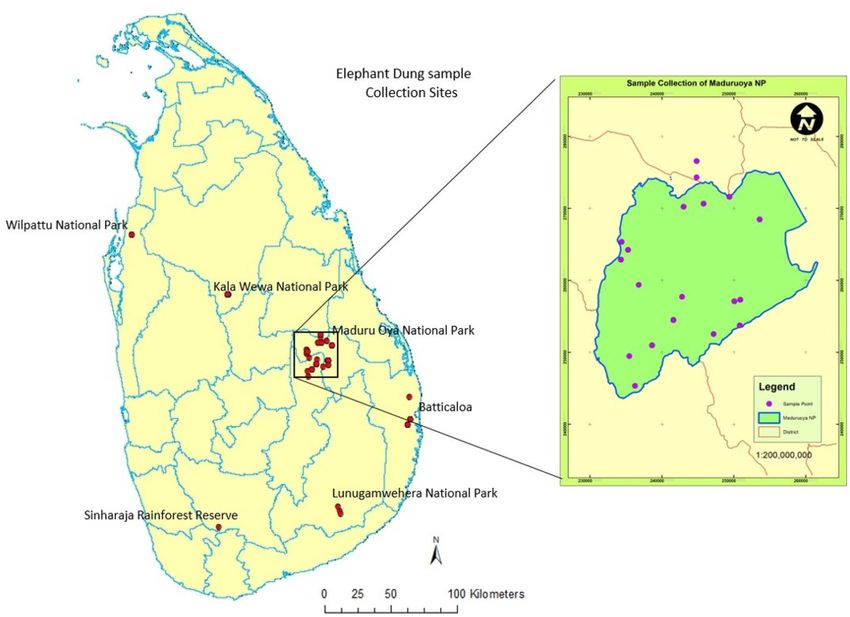
Figure 3. Distribution of wild elephant dung sampling sites in Sri Lanka. The number of dung samples
collected varied and decided in proportion to the number of elephants in a considered population. A total of 93
samples were collected covering most of the National Parks in Sri Lanka from wild elephants.
African elephants are applicable for Asian elephants having both Sri Lankan and Indian origin. Of the 24 SSRs,
LafMS02 amplified the highest total number of alleles, ten (Table 1), with no obvious multiple amplifications on
gels (Fig. 2). Therefore, LafMS02 ranked top among tested SSRs was selected for analysis of selected Sri Lankan
wild elephant population.
Analysis of selected wild populations using LafMS02. A total of 93 wild elephant dung DNA samples
collected from different wildlife parks in Sri Lanka (Fig. 3) were amplified with LafMS02 primers. There were
Scientific Reports | (2021) 11:8718 | https://doi.org/10.1038/s41598-021-88034-9 4
Vol:.(1234567890)www.nature.com/scientificreports/
Figure 4. Amplification with SSR—LafMS02. L-100 bp ladder (Promega Cat no: G2101), 1–93 dung DNA
samples collected from wild elephants. Full-length gels are presented in Supplementary Figure S5.
Figure 5. Testing the specificity of SSR primers. (a) Amplification of LafMS02 primer. L-100 bp molecular
weight marker 1: Elephant dung DNA (from the mucus layer) 2: Fibers taken from inside of the bolus 3: Fibers
taken from multiple samples 4: Mixture of Plant DNA (C. zeylanicum, O. rhizomatis, S. album and S. zeylanica)
5: Elephant Blood DNA (from elephant no: 66) 6: Negative control-water. (b) Amplification of EMU14 primer.
L-100 bp molecular weight marker 1: Elephant dung DNA (from the mucus layer), 2: Fibers taken from inside of
the bolus 3: Mixture of Plant DNA (C. zeylanicum, O. rhizomatis, S. album and S. zeylanica), 4: Elephant Blood
DNA (from elephant no: 66). (c) Amplification of plant DNA with 24 primers.1: EMU03, 2: EMU04, 3: EMU06,
4: EMU07, 5: EMU10, 6: EMU09, 7: EMU11, 8: EMU12, 9: EMU13, 10: EMU14, 11: EMU15, 12: EMU17, 13:
LafMS02, 14: LafMS06, 15: LA2, 16: LA3, 17: LA4, 18: LA5, 19: LA6, 20: EMX-1, 21: EMX-2, 22: EMX-3, 23:
EMX-4, 24: EMX-5, L-100 bp ladder. (d) Amplification of plant DNA with nine selected primers (repeated
PCR). L-100 bp ladder 1: EMU07, 2: EMU09, 3: EMU10, 4: EMU13, 5: EMU14, 6: EMU15, 7: LafMS06, 8:
EMX-4, 9:LA6, 10: Negative control (water). Full-length gels are presented in Supplementary Figure S6.
obvious multiple amplifications, representing different sizes in some samples, for example, samples 09, 81, 82, 83
and 84 (Fig. 4). This observation led us to further test the specificity of the selected SSRs.
For that, first, we used LafMS02 primers to amplify DNA from blood and dung from the same wild elephant,
a sample inside of the dung bolus, a mixture of inner layers of dung bolus and a mixture of plant DNA (Fig. 5a).
The plant mixture included equal amounts of DNA from Cinnamomum zeylanicum, Oryza rhizomatis, Santalum
album and Strobilanthes zeylanica. Aclear single band appeared on the gel from blood DNA while multiple bands
were resulted from the outermost mucus layer of a dung bolus of the same elephant. Interestingly, plant DNA
mixture also resulted approximately similar size band to that of the blood DNA. Further, similar size products
were detectable in the DNA extracted from the inner fibrous layer of the dung bolus as well as with a mixture of
fibrous layers from different dung bolus. To further verify the results, the same analysis was done with another
Scientific Reports | (2021) 11:8718 | https://doi.org/10.1038/s41598-021-88034-9 5
Vol.:(0123456789)www.nature.com/scientificreports/
Figure 6. Optimization of annealing temperature. (a) Annealing temperatures 62–58 °C in ‘touchdown 58’
PCR for randomly selected samples (09,81,82,83,37) using five polymorphic primers; LafMS02, EMU10,
EMU13, EMU17, LafMS06), L-100 bp ladder (Promega, Cat no: G2101), P—Plant DNA mixture, N—Negative
control (water). (b) Annealing temperatures 69–65 °C in ‘touchdown 65’ PCR for three primers having high
annealing temperature for randomly selected samples (09,81,82,83,84,37), L-100 bp ladder (Promega, Cat no:
G2101), P—Plant DNA mixture, N—Negative control (water). Full-length gels are presented in Supplementary
Figure S7.
set of primers, EMU14, selected from the list. Results were similar for having multiple amplifications in dung
DNA and parallel size products amplified from blood and plant DNA (Fig. 5b).
Amplification from plant DNA. The results above directed us to test whether such cross-amplification
exists in other SSRs selected from previous studies. The same plant DNA mixture was used as the template with
the other 24 primers sets selected (Fig. 5c). The PCR was repeated for eight selected primers from above and
products were separated on a 2.0% agarose gel (Fig. 5d). Out of 24, only three SSRs, EMU06, LA4 and LA5 did
not show clear amplification. PCR of plant DNA mixture also resulted in bands of similar size as that from blood
DNA.
Increasing annealing temperature to increase the specificity. It is suggested to use higher anneal-
ing temperatures to avoid unspecific a mplifications93. The majority of selected primers had the melting tempera-
ture of 58 °C while few had little higher or lower temperatures (Supplementary Table S1). We used a touchdown
PCR algorithm to increase the specificity of primer binding. Nevertheless, higher annealing temperatures of
62–58 °C and 69–65 °C were tested for a selected set of primers (Fig. 6a,b). Increasing the annealing temperature
to 62 °C reduced the intensity of the expected products, for example in EMU17 and LafMS06. However, there
was no clear change in the intensity of unexpected amplifications, without affecting the expected product. All
three primer sets; EMU13, EMU17 and LafMS06 resulted clear multiple amplifications even at 62 °C. However,
increasing the annealing temperature to 69 °C affected amplification in all three primers tested (Fig. 6b). These
results suggest that increasing annealing temperature does not help to get rid of cross-amplification of contami-
nating plant DNA possibly co-extracted with elephant DNA.
Cross‑amplification from human DNA. Human DNA contamination is also a possibility of assessing
the degraded D NA84. Therefore, twelve selected SSRs from the list were assessed with human blood DNA, plant
DNA mixture together with three elephant dung DNA samples in three different annealing temperatures 58 °C,
62 °C and 65 °C (Table 2). While there was clear amplification in 58 °C and 62 °C, no clear products were
observed at 65 °C in EMU04, EMU06, EMU11, EMU14 and EMU15. However, EMU07, EMU09 and EMU10
resulted clear products in all the temperatures in all the samples. Human DNA resulted clear products with most
of the tested SSRs with matching size of elephants. Therefore, there is less possibility to discriminate human
DNA contaminations either in gel electrophoresis or by capillary electrophoresis.
In silico analysis. Overall, majority of the selected primers amplified single or multiple products from plant
DNA and human blood DNA. Therefore, the specificity of primers was further tested against available sequence
information in National Center for Biotechnology Information (NCBI). Only the products smaller than 500 bp
were considered in the BLAST analysis against selected plant and animal genomes (Supplementary Table S2).
Except for EMU06 and EMU07, all the other primers had hits in selected genomic sequence data. Further, except
LafMS02, LA2, LA6 and EMU10, all the others had hits with comparable size in the human genome. While
Kongrit et al. in 2 00748 reported amplification of four alleles from Asian elephant blood and dung samples for
EMU06, we observed clear products only in three out of six blood samples (Table 2). Further, EMU06 resulted
amplification in some dung samples. However, it did not result amplification either from plant or human blood
DNA tested in the current study. Nevertheless, EMU07 resulted clear multiple products from elephants’ dung
DNA samples, plant DNA mix, and human blood DNA.
Scientific Reports | (2021) 11:8718 | https://doi.org/10.1038/s41598-021-88034-9 6
Vol:.(1234567890)www.nature.com/scientificreports/
Ta (°C)
Elephant dung Elephant dung Elephant dung
DNA sample DNA sample DNA sample Plant DNA
09 37 81 mixture Human DNA
Primer 58 62 65 58 62 65 58 62 65 58 62 65 58 62 65
EMU03 1 1 1 0 1 0 1 1 0 0 0 0 3 1 0
EMU04 1 1 0 1 1 0 1 1 0 1 1 0 0 1 0
EMU06 1 0 0 1 0 0 1 0 0 0 0 0 0 0 0
EMU07 2 2 2 2 2 3 1 5 4 2 3 3 3 2 3
EMU09 1 1 1 1 1 1 1 1 1 1 1 1 1 1 1
EMU10 1 1 1 2 2 1 1 2 1 1 1 1 3 2 2
EMU11 2 2 0 2 2 0 2 2 0 2 2 0 2 2 0
EMU12 1 1 0 1 0 0 1 1 0 1 0 0 1 1 1
EMU13 3 1 1 2 1 1 1 0 1 1 1 0 2 1 2
EMU14 1 1 0 1 4 0 1 1 0 1 0 0 0 0 0
EMU15 1 1 0 1 1 0 1 1 0 1 1 0 3 2 0
EMU17 2 2 0 1 1 1 2 3 0 1 1 0 2 2 2
Table 2. Number of bands detected in primers with the variation of annealing temperature and DNA type.
Discussion
SSR technique was first introduced by Michael Litt and Jeffrey A. Luty in 1 98994. Since then, it is probably the
most widely used technique in DNA fingerprinting of both animals and p lants95–98. Human DNA fingerprinting
also relies on 13 Short Tandem Repeat (STR) regions and a universally accepted set of primers99.
Fernando et al., in 2 00149 used five sets of SSRs (EMX-1, EMX-2, EMX-3, EMX-4 and EMX-5) for Asian
elephant genetic analysis for the first time. Since 2001, the same set of SSR has been used77 for both blood DNA92
and dung DNA a nalysis77 and all of them were included in this study. Similarly, all the other primers included
in this study have been used more than once. Nevertheless, the first set of SSRs for the elephant genetic analysis
was developed before the rapid growth of next-generation sequencing data. In the past, the PCR products were
separated in polyacrylamide gels and stained with silver n itrate46,55. In the current work we used an advanced
technique, PCR followed by capillary electrophoresis using a genetic analyzer, also known as fragment analysis86.
Even a single base-pair length difference can be distinguished using this technique. The selected SSRs have also
previously been used for fragment analysis-based studies.
Nevertheless, here we compared the amplification in blood and dung DNA, which has not been done before
in a single study. We first used the ten most polymorphic SSRs from the previous research to analyze blood DNA
extracted from six elephants housed at the National Zoological Garden, Sri Lanka. Interestingly, only eight out
of ten were polymorphic and the total number of alleles and the number of polymorphic loci were less than
those of previous studies. Since lower overall genetic diversity among them could be a reason for the next set of
experiments, we selected another population of four elephants, including one elephant with Indian origin. We
also expanded the list of SSRs from ten to 24, including all the SSRs repeatedly used in previous studies. Further,
we selected dung, as the material of choice since obtaining blood from a large number of wild elephants would
be a difficult task for any future study. Interestingly, when the same primers used for the blood were used for the
analysis of dung DNA, it resulted multiple amplifications in many cases. Those products did not disappear when
the annealing temperature increased, suggesting they are to be specific amplifications. To best of our knowl-
edge, there are no reports on testing the specificity of the selected set of SSRs either in the wet lab or in silico.
Therefore, the possibility of miscounting and interpretation in previous studies cannot be excluded. However, a
recently developed set of SSRs was analyzed in silico to test the possibility of amplification from human since it
is a possible contaminant with highly degraded s amples84. Gugala and c olleagues84 used NCBI BLAST to search
each sequence of the locus against African Savannah elephant, L. africana non-redundant database. Then they
used the software in silico PCR on the UCSC Genome Browser to query the primers against the human genome.
Interestingly, about 57% of the primers picked from the initial analysis resulted hits in the human genome sug-
gesting those primers would result products from possible human genome contaminants. Further, when they
conducted the wet lab analysis with SSRs with no hits in the in silico PCR work, template resulted expected
products with human DNA. Our work also showed similar results for some primers, for example, EMU06 and
EMU07. The necessity of in silico analysis for testing specificity of SSRs is highlighted for other wild animals,
for example, leopard100.
Nevertheless, the current study suggests that the analysis should extend beyond the human genome especially
when dung DNA is used as starting materials. It is even critical when wild-collected or degraded samples are
included in the a nalysis101. Except for rice, Oryza sativa, no plant selected in the study has fully sequenced and
assembled genomes. Even the O. rhizomatis could have different SSR motives than O. sativa genomic data in the
NCBI. Similarly, the Sri Lankan human DNA randomly selected for the study could have differences compared
to the sequences available in the database. Some primers resulted multiple hits in the same organism while the
others had hits in several organisms. Here, we considered only a subset of eukaryotic organisms with available
Scientific Reports | (2021) 11:8718 | https://doi.org/10.1038/s41598-021-88034-9 7
Vol.:(0123456789)www.nature.com/scientificreports/
sequencing data and majority of the possible contaminants in the wilderness; both flora and fauna are yet to be
sequenced. Further, we have not considered any microbial genomes, fungal and algal genomes in the analysis.
Therefore, the in silico analysis data presented are not complete and possible cross amplifications could be much
higher for the same primers. Further, we only considered the products smaller than 500 bp in size. The presence
of larger products as observed in wet-lab experiments is possible and such amplification would reduce the effi-
ciency of PCR amplification reaction. Contaminants can be avoided by taking extra precautionary steps when
the blood samples are collected from wild or captive elephants. However, such options are not possible when
dung or degraded tissue samples are collected from the wild, especially in forensic cases. Therefore, the specificity
of primers is a critical factor deciding the success of traditional SSR based methods adopted for such analysis.
During our sample collection, we noticed that bugs and small wild creatures get onto the dung piles within
minutes of defecation. Even though we removed them physically before harvesting the outermost mucus layer,
their mucus would also have been mixed with the outer mucus layer collected. Therefore, even though we har-
vested the outermost mucus layer, contaminations could be possible. Further, there are limited options in the
type of sample or availability of samples, especially in forensic analysis. Therefore, having an elephant specific set
of SSR is a necessity to continue genetic and forensic work with this technology. Based on our study, no primer
set out of 24 tested SSRs could be recommended for future work when the elephant dung is used as the starting
material. If blood samples are drawn carefully with no human or other contaminations, those with no multiple
hits in the elephant genome, for example, EMU06 and EMU07 could still be used. As such, results of the previ-
ous studies done with elephant dung would be questionable with the evidence gathered from current findings.
Nevertheless, no one could challenge the past since the revolutionary technologies pawed the path for the success
of current studies. However, our results suggest the necessity of revisiting available methods.
Alternatively, more specific methodologies with improved statistical power and high genome representation
like ddRAD sequencing57,102,103, SNP genotyping57,104, genotyping-by-sequencing (GBS)86,105,106 may need to be
applied. Having good coverage Asian and African elephant genome would speed up such attempts.
Materials and methods
Sample collection. Blood DNA samples were collected individually from six Asian elephants in the Dehi-
wala National Zoological Garden, Sri Lanka (Supplementary Figure S3a–f) to a vial with K 3EDTA. Name, sex,
age, morphological characteristics and appearance of elephants were recorded.
For the optimization of dung DNA extraction, elephant dung samples were collected from four domesticated
elephants belonging to the Temple of Tooth Relic, Kandy, Sri Lanka. Three of them have Sri Lankan origin while
the other one is a donation from India.
A total of 93 dung samples were collected from different locations of Sri Lanka (Fig. 3). The sample collection
was carried out by the Department of Wildlife Conservation, Sri Lanka. All the samples were collected with direct
sightings. The samples were collected right after the elephant left the site. The collector observed the elephant
from the water holes or tanks and waited till they come to drink water where the pictures were taken and mor-
phological characters, for example, approximate size, sex of the elephant and GPS locations of sample sites were
recorded. Each sample was given an ID and collected into a polyethene ziplock bag and the samples were packed
in a plastic box (Supplementary Figure S3g–h). The boxes were brought to the lab within 24 h as much as possible.
The outer mucus layer was carefully and immediately transferred to four 2.0 mL tubes for separate extractions.
Another sample from the outer mucus layer and inner bolus were collected to separate 50 mL tubes and stored
in − 80 °C for future studies (Supplementary Figure S3i–j). Fibres inside the dung bolus were taken separately
and washed thoroughly to remove other impurities. These clean fibres were taken as a source of plant DNA.
Plant samples for DNA extraction were collected from different locations of the country, Cinnamomum
zeylanicum from Cinnamon Research Station, Palolpitiya, Matara, Oryza rhizomatis from Yala National Park,
Santalum album from Livestock Farm, Udaperadeniya, Peradeniya, and Strobilanthes zeylanica from Sripada Peak
Wilderness sanctuary. Leaf samples collected were ground with liquid nitrogen and stored in the − 80 °C freezer.
Human buccal cells were obtained from a volunteer individual, after getting a written informed consent
clearing the ethical clearance guidelines.
Optimization of DNA extraction protocol. Elephant blood DNA was extracted using Wizard Genomic
DNA Purification kit (Promega, A1120) following the manufacturer’s protocol.
All previous studies depended on fresh dung samples collected less than 24 h time. We also tried to use fresh
samples as much as possible. However, since some collection sites were in deep forests/reserves in Sri Lanka,
taking them to the lab on time would not possible. Therefore, we optimized a DNA extraction protocol, starting
with QIAGEN QIAamp Fast DNA Stool Mini Kit (Cat. No: 51604) which can even be used for samples reach the
lab within a week time. We changed the incubation time and temperature combination to reduce PCR inhibi-
tors and get quality DNA. About 100 mg of the dung samples collected were incubated with 1 mL of inhibitex
buffer at different temperatures and time intervals; 56 °C overnight incubation, 56 °C 4 h incubation, 56 °C 3 h
incubation, 56 °C 2 h incubation, 70 °C > 1 h incubation and 70 °C 1 h incubation. The rest of the steps followed
the manufacturer’s guidelines. The extracted DNA was dissolved in 50 µL of Tris–acetate-EDTA (TAE) buffer
provided with the kit. DNA quality and integrity were tested by running samples on 1% Agarose gel and using
Nanodrop 2000 Spectrophotometer (Thermo Scientific).
Plant and human DNA extraction. Plant DNA was extracted using QIAGEN DNeasy Plant Mini Kit
(Cat. No. 69104) following manufacturers’ guidelines and stored in Tris–EDTA (TE) buffer supplied in the kit,
at − 20 °C. About 1 µg of DNA from each species was mixed to obtain the plant DNA mix. DNA from the fibres
Scientific Reports | (2021) 11:8718 | https://doi.org/10.1038/s41598-021-88034-9 8
Vol:.(1234567890)www.nature.com/scientificreports/
collected from the dung bolus was also extracted using the same kit. Human DNA was extracted using the
method described by107 and dissolved in TE buffer (Sigma, Cat no: 93283).
Selection of SSRs. A total of 24 SSRs were selected based on previous literature. Of those, 17 have resulted
polymorphic loci in Asian elephants where seven were used for African elephants (Supplementary Table S1). All
the primers were synthesized at the Integrated DNA technologies IDT, Singapore and M13 forward sequence
(5′-TGTAAAACGACGGCCAGT-3′) was added to the 5′ end of one set of forward primers to facilitate fluo-
rescent dye labelling in PCR amplicon to be used for capillary sequencing. Therefore, for each SSR, two sets of
forward primers were available with one set of reverse primer.
Optimization of PCR with blood DNA. For initial testing, the most polymorphic SSRs were selected.
As such, PCR was carried out with ten SSRs, EMU04, EMU06, EMU07, EMU09, EMU10, EMU11, EMU12,
EMU13, EMU15 and EMU17 by varying the reaction conditions and thermocycler conditions—‘Touchdown
55’ (Supplementary Table S3). PCR amplicons were examined on 1.5% agarose gel with 0.5 µL of SYBR Safe
(Applied Biosystems) under UV light using the Imager—ChemiDoc BioRad (Software version 6.0.1.34) using
the standard filter settings. Amplified products were subjected to capillary electrophoresis in an ABI PRISM
3100 Genetic Analyzer (Macrogen, Korea).
Identification of polymorphic SSRs for dung DNA analysis. DNA extracted from the dung samples
collected from four elephants rearing at the Temple of the Tooth Relic, Kandy were PCR amplified under the
optimized PCR conditions ‘Touchdown 55’ with the selected 24 SSRs. The PCR products were visualized on
1.5% Agarose gels with SYBR safe dye under UV light and subjected to capillary electrophoresis using the ABI
PRISM 3100 Genetic Analyzer (Macrogen, Korea).
Analysis of wild samples. LafMS02 was the most polymorphic locus and was selected for amplification of
93 wild elephant samples under the same experimental setup.
PCR with plant and blood DNA. Twenty four selected SSRs specifically designed for elephant finger-
printing work, were tested with the plant DNA mixture. Blood and dung DNA from the same elephant (sample
no: 66) and DNA extracted from fibers inside the dung bolus were also included in the analysis. The same plant
DNA was reamplified with EMU07, EMU09, EMU10, EMU13, EMU14, EMU15, LafMS06, EMX-4 and LA06 to
check the repeatability. The same PCR reaction mixture and the thermocycler conditions ‘Touchdown 55’ were
used. (Supplementary Table S3). The products were resolved in either in 1.5% or 2% agarose gels.
Analysis with high annealing temperature. Previous studies suggested annealing temperature of 58 °C
for most of the primers. Three different touchdown annealing temperatures were tested to get rid of unspecific
amplification; ‘Touchdown 58’ ‘Touchdown 62’ and ‘Touchdown 65’ (Supplementary Table S3). Three randomly
selected dung DNA samples, the same plant DNA mixture mentioned above and a human blood DNA sample
were included in the analysis. The effect of FAM labelling was tested for primers with and without labelling.
In silico analysis. The specificity of each primer set was assessed on August 15th, 2019 using NCBI primer
BLAST (https://www.ncbi.nlm.nih.gov/tools/primer-blast/) (non-redundant database) against the same set of
organisms selected from the dropdown menu options: the BLAST parameters included, maximum target size,
500 bp minimum of blast target sequence = 10,000, Blast expected value = 10 and maximum pair to screen = 2000.
Data analysis. Chromatograms were visualized using Peak Scanner Software Version:1.0 (Applied Biosys-
tems). GS350 and GS500 size standards were used in capillary electrophoresis analysis. The scale of Y axis and X
axis were zoomed according to the length size of the product. Well distinctive peaks in the chromatogram were
scored as discrete variables as presence (1) and absence (0). In order to calculate the polymorphic percentage,
total number of loci and polymorphic loci were counted. For the phylogenetic analysis, binary data matrix was
bootstrapped for 1000 resamples using seqboot program in PHYLIP-3.698 phylogenetic inference package108
and subjected to restdist program to generate distance matrix109. Then neighbor joining program was used to
construct a tree by Unweighted Pair Group Method with Arithmetic means (UPGMA) method of clustering and
the tree generated was viewed with FigTree 1.4.2110.
Ethical approval. The study was conducted under the research permit number: WL/3/2/2017/1 provided
by the Research Committee of the Department of Wildlife Conservation, Sri Lanka. All the methods were car-
ried out in accordance with relevant guidelines and regulations for animals. Human genomic DNA was obtained
from the buccal cells collected and stored in Department of Biochemistry and Molecular Biology, Faculty of
Medicine, University of Colombo, Sri Lanka. Ethical approval was obtained from the ethics review committee,
Faculty of Medicine, University of Colombo, Sri Lanka and it was approved for humans (Ethical approval No:
EC-12-138). Buccal cells were collected after getting the informed consent from all the subjects. All the methods
were carried out in accordance with relevant guidelines and regulations.
Scientific Reports | (2021) 11:8718 | https://doi.org/10.1038/s41598-021-88034-9 9
Vol.:(0123456789)www.nature.com/scientificreports/
Received: 25 February 2020; Accepted: 30 March 2021
References
1. Whyte, I. Studying elephant movements, in studying elephants, in African Wildl. Found. Tech. Ser. 7. African Wildl. Found. (ed
Kangwana, K.) 75–89 (1996).
2. Rasmussen, L. E. L. & Krishnamurthy, V. How chemical signals integrate Asian elephant society: The known and the unknown.
Zoo Biol. 19, 405–423 (2000).
3. Nair, S., Balakrishnan, R., Seelamantula, C. S. & Sukumar, R. Vocalizations of wild Asian elephants (Elephas maximus ): structural
classification and social context. J. Acoust. Soc. Am. 126, 2768–2778 (2009).
4. Stoeger, A. S. & Manger, P. Vocal learning in elephants: neural bases and adaptive context. Curr. Opin. Neurobiol. 28, 101–107
(2014).
5. Moss, C. J. & Poole, J. H. Relationships and social structure in African elephants. Primate Soc. Relationsh.: An Integr.
Approach 315-325 (1983).
6. Foerder, P., Galloway, M., Barthel, T., Moore, D. E. & Reiss, D. Insightful problem solving in an asian elephant. PLoS ONE 6,
e23251 (2011).
7. Lee, P. C. Allomothering among African elephant. Animal Behaviour 35, 278-291 (1987).
8. Byrne, R. W., Bates, L. & Moss, C. J. Comparative cognition & behavior reviews. Elephant Cogn. 4, 65–79 (2009).
9. Bates, L. A., Poole, J. H. & Byrne, R. W. Elephant cognition. Curr. Biol. 18, 544–546 (2008).
10. Vance, E. A., Archie, E. A. & Moss, C. J. Social networks in African elephants. Comput. Math. Organ. Theory 15, 273–293 (2009).
11. de Silva, S. & Wittemyer, G. A comparison of social organization in Asian elephants and African savannah elephants. Int. J.
Primatol. 33, 1125–1141 (2012).
12. Shoshani, J. Understanding proboscidean evolution: a formidable task. Trends Ecol. Evol. 13, 480–487 (1998).
13. Rohland, N. et al. Proboscidean mitogenomics: chronology and mode of elephant evolution using mastodon as outgroup. PLoS
Biol. 5, 1663–1671 (2007).
14. de Flamingh, A. Genetic structure of the savannah elephant population (Loxodonta africana (Blumenbach 1797)) in the Kavango-
Zambezi Transfrontier Conservation Area. ProQuest Diss. Theses 102 (2013).
15. Grubb, P., Groves, C. P., Dudley, J. P. & Shoshani, J. Living African elephants belong to two species: Loxodonta africana (Blu-
menbach, 1797) and Loxodonta cyclotis (Matschie, 1900). Elephant 2, 1–4 (2000).
16. Roca, A. L., Georgiadis, N., Pecon-Slattery, J. & O’Brien, S. J. Genetic evidence for two species of elephant in Africa. Science 293,
1473–1477 (2001).
17. Roca, A. L. et al. Elephant natural history: a genomic perspective. Annu. Rev. Anim. Biosci. 3, 139–167 (2015).
18. Wasser, S. K. et al. Assigning African elephant DNA to geographic region of origin: applications to the ivory trade. Proc. Natl.
Acad. Sci. U. S. A. 101, 14847–14852 (2004).
19. Ishida, Y. et al. Distinguishing forest and savanna African elephants using short nuclear DNA sequences. J. Hered. 102, 610–616
(2011).
20. Comstock, K. E. et al. Patterns of molecular genetic variation among African elephant populations. Mol. Ecol. 11, 2489–2498
(2002).
21. Palkopoulou, E. et al. A comprehensive genomic history of extinct and living elephants. Proc. Natl. Acad. Sci. U. S. A. 115,
E2566–E2574 (2018).
22. Shoshani, J. & Eisenberg, J. F. Elephas maximus. Mamm. Species 182, 1–8 (1982).
23. Sukumar, R. The Living Elephants (Oxford University Press, 2003).
24. Sukumar, R. A brief review of the status, distribution and biology of wild Asian elephants Elephas maximus. Int. Zoo Yearb. 40,
1–8 (2006).
25. Olivier, R. Distribution and status of the Asian elephant. Oryx 14(4), 379–424. https://doi.org/10.1017/S003060530001601X
(1978).
26. Santiapillai, C. The Asian elephant conservation: a global strategy. Gajah 18, 21–39 (1997).
27. Sukumar, R. Ecology of the Asian elephant in Southern India. i. movement and habitat utilization patterns. J. Trop. Ecol. 5, 1–18
(1989).
28. Vidya, T. N. C., Fernando, P., Melnick, D. J. & Sukumar, R. Population genetic structure and conservation of Asian elephants
(Elephas maximus) across India. Anim. Conserv. 8, 377–388 (2005).
29. Fleischer, R. C., Perry, E. A., Muralidharan, K., Stevens, E. E. & Wemmer, C. M. Phylogeography of the Asian elephant (Elephas
maximus) based on mitochondrial DNA. Evolution (N. Y.) 55, 1882–1892 (2001).
30. Fernando, P., Pfrender, M. E., Encalada, S. E. & Lande, R. Mitochondrial DNA variation, phylogeography and population
structure of the Asian elephant. Heredity (Edinb). 84, 362–372 (2000).
31. Fernando, P. Elephants in Sri Lanka: past, present, and future. Loris 22, 38–44 (2000).
32. Hendavitharana, W., Dissanayake, S. & de Silva, M. The survey of elephants in Sri Lanka. Gajah 12, 1–30 (1994).
33. Eggert, L. S., Rasner, C. A. & Woodruff, D. S. The evolution and phylogeography of the African elephant inferred from mito-
chondrial DNA sequence and nuclear microsatellite markers. Hungarian Q. 49, 1993–2006 (2008).
34. Ishida, Y., Georgiadis, N. J., Hondo, T. & Roca, A. L. Triangulating the provenance of African elephants using mitochondrial
DNA. Evol. Appl. 6, 253–265 (2013).
35. Liu, C. Z., Wang, L., Xia, X. J. & Jiang, J. Q. Characterization of the complete mitochondrial genome of cape elephant shrew,
Elephantulus edwardii. Mitochondrial DNA Part B Resour. 3, 738–739 (2018).
36. Fernando, P. et al. DNA analysis indicates that Asian elephants are native to Borneo and are therefore a high priority for con-
servation. PLoS Biol. 1, 110–115 (2003).
37. Ahlering, M. A. et al. Genetic diversity, social structure, and conservation value of the elephants of the Nakai Plateau, Lao PDR,
based on non-invasive sampling. Conserv. Genet. 12, 413–422 (2011).
38. Goossens, B. et al. Habitat fragmentation and genetic diversity in natural populations of the Bornean elephant: implications for
conservation. BIOC 196, 80–92 (2016).
39. Shoshani, J., Golenberg, E. M. & Yang, H. Elephantidae phylogeny: Morphological versus molecular results. Acta Theriol. (Warsz)
43, 89–122 (1998).
40. Vidya, T. N. C. & Sukumar, R. Amplification success and feasibility of using microsatellite loci amplified from dung to popula-
tion genetic studies of the Asian elephant (Elephas maximus). Curr. Sci. 88, 489–492 (2005).
41. Vidya, T. N. C., Varma, S., Dang, N. X., Van Thanh, T. & Sukumar, R. Minimum population size, genetic diversity, and social
structure of the Asian elephant in Cat Tien National Park and its adjoining areas, Vietnam, based on molecular genetic analyses.
Conserv. Genet. 8, 1471–1478 (2007).
42. Suwattana, D., Jirasupphachok, J., Kanchanapangka, S. & Koykul, W. Tetranucleotide microsatellite markers for molecular testing
in Thai domestic elephants (Elephas maximus indicus). Thai J. Vet. Med. 40, 405–409 (2010).
43. Eggert, L. S. et al. Using genetic profiles of African forest elephants to infer population structure, movements, and habitat use
in a conservation and development landscape in Gabon. Conserv. Biol. 28, 107–118 (2014).
Scientific Reports | (2021) 11:8718 | https://doi.org/10.1038/s41598-021-88034-9 10
Vol:.(1234567890)www.nature.com/scientificreports/
44. Kinuthia, J. et al. The selection of a standard STR panel for DNA profiling of the African elephant (Loxodonta africana) in Kenya.
Conserv. Genet. Resour. 7, 305–307 (2015).
45. Hedges, S. Monitoring elephant populations and assessing threats. Universities Press (India) Pvt. Ltd., Hyderabad, India 259–292
(2012).
46. Eggert, L. S., Ramakrishnan, U., Mundy, N. I. & Woodruff, D. S. Polymorphic microsatellite DNA markers in the African elephant
(Loxondonta africana) and their use in the Asian elephant (Elephas maximus). Mol. Ecol. 9, 2222–2224 (2000).
47. Nyakaana, S., Arctander, P. & Siegismund, H. R. Population structure of the African savannah elephant inferred from mito-
chondrial control region sequences and nuclear microsatellite loci. Heredity (Edinb). 89, 90–98 (2002).
48. Kongrit, C. et al. Isolation and characterization of dinucleotide microsatellite loci in the Asian elephant (Elephas maximus). Mol.
Ecol. Resour. 8, 175–177 (2007).
49. Fernando, P., Vidya, T. N. C. & Melnick, D. J. Isolation and characterization of tri- and tetranucleotide microsatellite loci in the
Asian elephant, Elephas maximus. Mol. Ecol. Resour. 8, 232–233 (2001).
50. Archie, E. A., Moss, C. J. & Alberts, S. C. Characterization of tetranucleotide microsatellite loci in the African Savannah Elephant
(Loxodonta africana africana). Mol. Ecol. Notes 3, 244–246 (2003).
51. Lieckfeldt, D., Schmidt, A. & Pitra, C. Isolation and characterization of microsatellite loci in the great bustard, Otis tarda. Mol.
Ecol. Notes 1, 133–134 (2001).
52. Nyakaana, S., Okello, J. B. A., Muwanika, V. & Siegismund, H. R. Six new polymorphic microsatellite loci isolated and character-
ized from the African savannah elephant genome. Mol. Ecol. Notes 5, 223–225 (2005).
53. Okello, J. B. A. et al. Population genetic structure of savannah elephants in Kenya: conservation and management implications.
J. Hered. 99, 443–452 (2008).
54. Nyakaana, S. & Arctander, P. Isolation and characterization of microsatellite loci in the African elephant, Loxodonta africana.
Mol. Ecol. 10, 1436–1437 (1998).
55. Comstock, K. E., Wasser, S. K. & Ostrander, E. A. Polymorphic microsatellite DNA loci identified in the African elephant
(Loxodonta africana). Mol. Ecol. 9, 1004–1006 (2000).
56. Hartl, G. B., Hartl, K. F., Hemmer, W. & Nadlinger, K. Electrophoretic and chromosomal variation in captive Asian elephants
(Elephas maximus). Zoo Biol. 14, 87–95 (1995).
57. Bourgeois, S. et al. Single-nucleotide polymorphism discovery and panel characterization in the African forest elephant. Ecol.
Evol. 8, 2207–2217 (2018).
58. Sharma, R. et al. Two different high throughput sequencing approaches identify thousands of De Novo genomic markers for
the genetically depleted Bornean elephant. PLoS ONE 7, e49533 (2012).
59. Reddy, P. C. et al. Comparative sequence analyses of genome and transcriptome reveal novel transcripts and variants in the
Asian elephant Elephas maximus. J. Biosci. 40, 891–907 (2015).
60. Mondol, S. et al. New evidence for hybrid zones of forest and savanna elephants in Central and West Africa. Mol. Ecol. 24,
6134–6147 (2015).
61. Hou, Z. C. et al. Elephant transcriptome provides insights into the evolution of eutherian placentation. Genome Biol. Evol. 4,
713–725 (2012).
62. Tollis, M. et al. Elephant Genomes Reveal Insights into Differences in Disease Defense Mechanisms between Species. bioRxiv
2020.05.29.124396 (2020).
63. Rohland, N. et al. Genomic DNA sequences from mastodon and woolly mammoth reveal deep speciation of forest and savanna
elephants. PLoS Biol. 8, 16–19 (2010).
64. Lynch, V. J. et al. Elephantid genomes reveal the molecular bases of woolly mammoth adaptations to the Arctic. Cell Rep. 12,
217–228 (2015).
65. Yang, H., Golenberg, E. M. & Shoshani, J. Phylogenetic resolution within the elephantidae using fossil DNA sequence from the
American mastodon (Mammut americanum) as an outgroup. Proc. Natl. Acad. Sci. U. S. A. 93, 1190–1194 (1996).
66. Orlando, L., Hänni, C. & Douady, C. J. Mammoth and elephant phylogenetic relationships: Mammut americanum, the missing
outgroup. Evol. Bioinforma. 3, 45–51 (2007).
67. Eggert, L. S., Eggert, J. A. & Woodruff, D. S. Estimating population sizes for elusive animals: the forest elephants of Kakum
National Park, Ghana. Mol. Ecol. 12, 1389–1402 (2003).
68. Vidya, T. N. C. Evolutionary history and population genetic structure of Asian elephants in India. Indian J. Hist. Sci. 51, 391–405
(2016).
69. Schuttler, S. G., Whittaker, A., Jeffery, K. J. & Eggert, L. S. African forest elephant social networks: fission-fusion dynamics, but
fewer associations. Endanger. Species Res. 25, 165–173 (2014).
70. Ahlering, M. A. et al. Identifying source populations and genetic structure for savannah elephants in human-dominated land-
scapes and protected areas in the Kenya-Tanzania borderlands. PLoS ONE 7, e52288 (2012).
71. Vidya, T. N. C., Fernando, P., Melnick, D. J. & Sukumar, R. Population differentiation within and among Asian elephant (Elephas
maximus) populations in southern India. Heredity (Edinb). 94, 71–80 (2005).
72. Sukumar, R., Ramakrishnan, U. & Santosh, J. A. Impact of poaching on an Asian elephant population in Periyar, southern India:
a model of demography and tusk harvest. Anim. Conserv. 1, 281–291 (1998).
73. Mondol, S., Mailand, C. R. & Wasser, S. K. Male biased sex ratio of poached elephants is negatively related to poaching intensity
over time. Conserv. Genet. 15, 1259–1263 (2014).
74. Breuer, T., Maisels, F. & Fishlock, V. The consequences of poaching and anthropogenic change for forest elephants. Conserv.
Biol. 30, 1019–1026 (2016).
75. Mailand, C. & Wasser, S. K. Isolation of DNA from small amounts of elephant ivory. Nat. Protoc. 2, 2228–2232 (2007).
76. Lee, E. et al. The identification of elephant ivory evidences of illegal trade with mitochondrial cytochrome b gene and hypervari-
able D-loop region. J. Forensic Leg. Med. 20, 174–178 (2015).
77. Chakraborty, S., Boominathan, D., Desai, A. A. & Vidya, T. N. C. Using genetic analysis to estimate population size, sex ratio,
and social organization in an Asian elephant population in conflict with humans in Alur, southern India. Conserv. Genet. 15,
897–907 (2014).
78. Fernando, P. & Pastorini, J. Range-wide status of Asian elephants. Gajah 35, 15–20 (2011).
79. Ishida, Y., Gugala, N. A., Georgiadis, N. J. & Roca, A. L. Evolutionary and demographic processes shaping geographic patterns
of genetic diversity in a keystone species, the African forest elephant (Loxodonta cyclotis). Ecol. Evol. 8, 4919–4931 (2018).
80. Kongrit, C. Genetic tools for the conservation of wild Asian elephants. Int. J. Biol. 9, 1 (2017).
81. McComb, K., Shannon, G., Sayialel, K. N. & Moss, C. Elephants can determine ethnicity, gender, and age from acoustic cues in
human voices. Proc. Natl. Acad. Sci. U. S. A. 111, 5433–5438 (2014).
82. Prithiviraj, F. & Melnick, D. J. Molecular sexing eutherina mammals. Mol. Ecol. Notes 1, 350–353 (2001).
83. Vandebona, H. et al. DNA fingerprints of the Asian elephant in Sri Lanka, Elephas maximus maximus, using multilocus probe
33.15 (Jeffreys). J. Natl. Sci. Found. Sri Lanka 32, 83–96 (2004).
84. Gugala, N. A., Ishida, Y., Georgiadis, N. J. & Roca, A. L. Development and characterization of microsatellite markers in the
African forest elephant (Loxodonta cyclotis). BMC Res. Notes 9, 4–9 (2016).
85. Zhang, L. et al. Asian elephants in China: estimating population size and evaluating habitat suitability. PLoS ONE 10, 1–13
(2015).
Scientific Reports | (2021) 11:8718 | https://doi.org/10.1038/s41598-021-88034-9 11
Vol.:(0123456789)www.nature.com/scientificreports/
86. Vartia, S. et al. A novel method of microsatellite genotyping-by-sequencing using individual combinatorial barcoding. R. Soc.
Open Sci. 3, 150565 (2016).
87. Tighe, A. J. et al. Testing PCR amplification from elephant dung using silica-dried swabs. Pachyderm 59, 56–65 (2018).
88. Bourgeois, S. et al. Improving cost-efficiency of faecal genotyping: new tools for elephant species. PLoS ONE 14, e0210811 (2019).
89. Hedges, S., Johnson, A., Ahlering, M., Tyson, M. & Eggert, L. S. Accuracy, precision, and cost-effectiveness of conventional dung
density and fecal DNA based survey methods to estimate Asian elephant (Elephas maximus) population size and structure. Biol.
Conserv. 159, 101–108 (2013).
90. Moßbrucker, A. M. et al. Non-invasive genotyping of Sumatran elephants : implications for conservation The Sumatran elephant
(Elephas maximus sumatranus) is one of three currently recognized subspecies. Trop. Conserv. Sci. 8, 745–759 (2015).
91. Ishida, Y. et al. Short amplicon microsatellite markers for low quality elephant DNA. Conserv. Genet. Resour. 4, 491–494 (2012).
92. Thitaram, C. et al. Evaluation and selection of microsatellite markers for an identification and parentage test of Asian elephants
(Elephas maximus). Conserv. Genet. 9, 921–925 (2008).
93. Lorenz, T. C. Polymerase chain reaction: basic protocol plus troubleshooting and optimization strategies. J. Vis. Exp. 2, 1–15.
https://doi.org/10.3791/3998 (2012).
94. Litt, M. & Luty, J. A. Hypervariable amplification. Am. J. Hum. Genet. 44, 397–401 (1989).
95. Park, Y. J., Lee, J. K. & Kim, N. S. Simple sequence repeat polymorphisms (SSRPs) for evaluation of molecular diversity and
germplasm classification of minor crops. Molecules 14, 4546–4569 (2009).
96. Vieira, M. L. C., Santini, L., Diniz, A. L. & Munhoz, C. D. F. Microsatellite markers: what they mean and why they are so useful.
Genet. Mol. Biol. 39, 312–328 (2016).
97. Stafne, E. T., Clark, J. R., Weber, C. A., Graham, J. & Lewers, K. S. Simple sequence repeat (SSR) markers for genetic mapping
of raspberry and blackberry. J. Am. Soc. Hortic. Sci. 130, 722–728 (2005).
98. Tommasini, L. et al. The development of multiplex simple sequence repeat (SSR) markers to complement distinctness, uniformity
and stability testing of rape (Brassica napus L.) varieties. Theor. Appl. Genet. 106, 1091–1101 (2003).
99. Norrgard, K. Forensics, DNA Fingerprinting, and CODIS. Nat. Educ. 1, 35 (2008).
100. Maroju, P. A. et al. Schrodinger’s scat: A critical review of the currently available tiger (Panthera Tigris) and leopard (Panthera
pardus) specific primers in India, and a novel leopard specific primer. BMC Genet. 17, 1–6 (2016).
101. Waits, L. P. & Pearkau, D. Noninvasive genetic sampling tools for wildlife biologists: a review of applications and recommenda-
tions for accurate data collection. J. Wildl. Manag. 69, 1419–1433 (2005).
102. Baird, N. A. et al. Rapid SNP discovery and genetic mapping using sequenced RAD markers. PLoS ONE 3, 1–7 (2008).
103. Miller, M. R., Dunham, J. P., Amores, A., Cresko, W. A. & Johnson, E. A. Rapid and cost-effective polymorphism identification
and genotyping using restriction site associated DNA (RAD) markers. Genome Res. 17, 240–248 (2007).
104. Delord, C. et al. A cost-and-time effective procedure to develop SNP markers for multiple species: a support for community
genetics. Methods Ecol. Evol. 9, 1959–1974 (2018).
105. Magwanga, R. O. et al. GBS mapping and analysis of genes conserved between Gossypium tomentosum and Gossypium hirsutum
cotton cultivars that respond to drought stress at the seedling stage of the BC2F2generation. Int. J. Mol. Sci. 19, 1614 (2018).
106. Elshire, R. J. et al. A robust, simple genotyping-by-sequencing (GBS) approach for high diversity species. PLoS ONE 6, 1–10
(2011).
107. Chandrasekara, C. H. W. M. R. B., Wijesundera, W. S. S., Perera, H. N., Chong, S. S. & Rajan-Babu, I. S. Cascade screening for
fragile X syndrome/CGG repeat expansions in children attending special education in Sri Lanka. PLoS ONE 10, 1–10 (2015).
108. Felsenstein, J. 2002. {PHYLIP}(Phylogen. I. P. ver. 3. 6a3.—P. by the author. PHYLIP(Phylogeny Inference Package) ver. 3.6a3.
(2002).
109. Nei, M. & Li, W. H. Mathematical model for studying genetic variation in terms of restriction endonucleases. Proc. Natl. Acad.
Sci. U. S. A. 76, 5269–5273 (1979).
110. Rambaut, A. FigTree ver.1. 3.1: tree figure drawing tool. http://tree.bio.ed.ac.uk/software/figtree. (2009).
Acknowledgements
We are grateful to the Eco-System Conservation Management Project (ESCAMP) of the World Bank for provid-
ing the funds to the Department of Wildlife Conservation (DWC), Sri Lanka to conduct the research. We greatly
appreciate the contribution of Dr. Sumith Pilapitiya, former Director General of the DWC for helpful comments
and suggestions to improve the quality throughout the project. We specially thank the Dehiwala National Zoo-
logical Garden, Sri Lanka and the field staff of the DWC for the collection of samples and the staff of Agricultural
Biotechnology Centre, University of Peradeniya, Sri Lanka for their immense support throughout the Project.
Author contributions
P.C.G.B. wrote the initial draft, H.A.B.M.H. prepared the figures and tables. P.C.G.B. edited the subsequent drafts
with the assistance of H.A.B.M.H. R.M.R.N. and K.A.N.C.J. conducted the dung sample collection and R.C.R.
helped in blood sample collection. C.H.W.M.R.B.C., H.A.B.M.H. and M.M.K. conducted the wet lab analy-
sis. P.C.G.B., C.H.W.M.R.B.C. and H.A.B.M.H. contributed to data analysis, P.C.G.B., M.S.L.R.P.M., M.G.C.S.,
R.M.R.N., C.H.W.M.R.B.C. and H.A.B.M.H. contributed to data interpretation. M.G.C.S., M.S.L.R.P.M., P.C.G.B.
and R.M.R.N. designed the study. All authors provided critical feedback and helped shape the research, analysis
and manuscript.
Competing interests
The authors declare no competing interests.
Additional information
Supplementary Information The online version contains supplementary material available at https://doi.org/
10.1038/s41598-021-88034-9.
Correspondence and requests for materials should be addressed to P.C.G.B.
Reprints and permissions information is available at www.nature.com/reprints.
Publisher’s note Springer Nature remains neutral with regard to jurisdictional claims in published maps and
institutional affiliations.
Scientific Reports | (2021) 11:8718 | https://doi.org/10.1038/s41598-021-88034-9 12
Vol:.(1234567890)You can also read