Diurnal temperature variation as the source of the preferential direction of fractures on asteroids: theoretical model for the case of Bennu
←
→
Page content transcription
If your browser does not render page correctly, please read the page content below
Diurnal temperature variation as the source of the
                                                       preferential direction of fractures on asteroids:
                                                           theoretical model for the case of Bennu

                                                            D. Uribea,b,∗, M. Delbob , P.-O. Boucharda , D. Pino Muñoza
arXiv:2102.01939v1 [astro-ph.EP] 3 Feb 2021

                                                                        a
                                                              Centre de Mise en Forme des Matériaux (CEMEF)
                                                                MINES ParisTech, PSL Research University
                                              CNRS UMR 7635, CS 10207 rue Claude Daunesse, 06904 Sophia Antipolis Cedex, France
                                                          b
                                                            Université Côte d’Azur, Observatoire de la Côte d’Azur
                                                         CNRS-Lagrange, CS 34229, 06304 - NICE Cedex 4, France

                                                                                              Abstract
                                              It has been shown that temperature cycles on airless bodies of our Solar System can cause
                                              damaging of surface materials. Nevertheless, propagation mechanisms in the case of space
                                              objects are still poorly understood. Present work combines a thermoelasticity model together
                                              with linear elastic fracture mechanics theory to predict fracture propagation in the presence
                                              of thermal gradients generated by diurnal temperature cycling and under conditions similar
                                              to those existing on the asteroid Bennu. The crack direction is computed using the maximal
                                              strain energy release rate criterion, which is implemented using finite elements and the so-
                                              called Gθ method (Uribe-Suárez et al. 2020. Eng. Fracture Mech. 227:106918). Using the
                                              implemented methodology, crack propagation direction for an initial crack tip in different
                                              positions and for different orientations is computed. It is found that cracks preferentially
                                              propagate in the North to South (N-S), in the North-East to South-West (NE-SW) and in
                                              the North-West to South-East (NW-SE) directions. Finally, thermal fatigue analysis was
                                              performed in order to estimate the crack growth rate. Computed value is in good agreement
                                              with available experimental evidence.

                                              Keywords: Asteroid Bennu, Thermoelastic model, Crack propagation Direction, Energy
                                              Release Rate, Thermal fatigue crack growth
                                              1         Introduction
                                              The formation of fractures and their growth are key processes in man-made structures and
                                              materials. The large majority of the cases studied in the literature are on the aforementioned
                                              structures, given their importance in the everyday life of humans. These processes also occur
                                              in natural objects, such as rocks, boulders, and cliffs [1, 2, 3, 4, 5, 6] and are documented
                                                  ∗
                                                      Corresponding author.
                                                      E-mail address: diego.uribe suarez@mines-paristech.fr (D. Uribe Suárez).

                                                                                                      1
on several objects of our solar system, including Earth [7, 8], Mars [6, 9], our Moon [10, 11],
the nuclei of comets [12, 13, 14], asteroids [15, 16, 17, 18, 19], and meteorites [20].
    The source of the driving forces that provokes crack nucleation and propagation can
be very diverse, ranging from unloading of the pressure stresses under which certain rocks
formed in the deep crust of Earth, tectonic stresses, rapid mechanical stresses from impacts
and thermal stresses. In the latter case, the presence of water can enhance the cracking
phenomena via the known freeze-thaw effect [see e.g. 21, and references therein]. The ef-
fectiveness of thermal stresses in cracking rocks and other geological units in the absence
of water has been long debated: a famous laboratory experiment by Griggs [22] argued
against earlier claims that rocks could be fractured by temperature variations only, the pro-
cess that in general and hereafter is called thermal cracking. However, thermal cracking
gained momentum recently and came to great attention to planetary scientists thanks to
new measurements, modelling, and observations.
    More in details, it has been shown that temperature variations resulting from the cycles
between day and night can damage materials on airless bodies of our Solar System [for ref-
erences on this topic, see the introductions of 23, 24]. This damaging process consists in the
nucleation and growth of micro-fractures inside the material due to the mechanical stresses
induced by the diurnal temperature cycles. In general the mechanical stresses resulting from
temperature gradients due to the day and night cycles are smaller than the strength of the
material [see e.g. 20, 25, 26, 27, 23]. In this case the crack can still open and grow in a
regime that is said to be sub-critical [28]; the material is increasingly damaged at each cycle
and it is usually spoken of thermal fatigue. Eventually, the application of a large number
of cycles can produce important crack growth; the crack tip can reach a boundary of the
material, such as a discontinuity or the edge of a rock; this will cause a rapid transition from
sub-critical to critical failure and lead to material failure [see e.g. 29, 20, for the case of as-
teroids and meteorites]. For example, Liang et al. [30] studied volumetric stress distribution
in an L6 ordinary chondrite’s microstructure subjected to thermal and mechanical loadings
through the combination of experiments and micromechanical models. It was found that
under thermal cycling, the stress concentrates more uniformly along with particle interfaces.
The authors interpret that thermal fatigue crack propagation could result in the debonding
of particles from the surrounding matrix.
    Hence, on solar system bodies without an atmosphere thermal fatigue of surface rocks,
in addition to the impact of micrometeorites, can eventually lead to rocks’ breakup and
produce regolith [29, 20], the latter being the layer of unconsolidated material that covers
planetary surfaces [31, 32, 33]. In the case of the near-Earth asteroid (101955) Bennu [16],
Molaro et al. [34] propose that thermal cracking is also able to eject sub-cm-sized particle
away from the asteroid surface, thereby offering an explanation for the observed activity
of this asteroid [35]. Furthermore, it is also proposed by several studies that macroscopic
fractures, mass-wasting, and material breakdown on asteroids and cometary nuclei could be
explained as a consequence of thermal effects [29, 14, 36, 12, 19].
    For all the reasons above, thermal fatigue cracking is now considered a space weathering
mechanism. On the other hand, direct evidence of thermal cracking on asteroids (and comets)
is still relatively scarce (but strongly growing) and the details of the process in terms of
spatial and temporal scales still poorly understood. One of the first studies that invokes this
phenomenon to explain certain in situ asteroid observations is the work of [29].Using images

                                                2
obtained by NASA’s Shoemaker mission of the surface of the asteroid (433) Eros, these
authors noted boulders that appear to break and erode in place, producing fragments that
fill the inside of craters, creating characteristic “ponds” of regolith. Another observational
evidence, obtained from images of NASA’s OSIRIS-REx mission [37], is constituted by the
detection of exfoliation sheets on some of the boulders on the asteroid (101955) Bennu
[19]. The thickness of the exfoliation sheets is consistent with the depth inside boulders at
which thermoelastic simulations show stress concentration as a result of diurnal temperature
variations [19]. However, it has been shown on Earth [38] and Mars [6] that one of the
most diagnostic observations of thermal cracking induced by diurnal temperature variations
is a preferential meridional direction (north to south) of the fractures on surface rocks. The
reason is very simple: during the day the Sun moves in the sky from the east to the west.
As a consequence, the temperature gradients are directed essentially in the same direction
(west to east). Fractures mainly propagate in a direction perpendicular to that of maximum
principal stress. Therefore it is expected that this direction of propagation is essentially from
the north to the south, when they are driven by these diurnal temperature cycles. There are
hints of predominance of fracture directed in the north to the south and in the north-west
to the south-east on the boulders of the asteroid Bennu [39]. However, a modelling of the
crack propagation direction in conditions similar to those existing on Bennu is still lacking.
The aim of this work is to provide theoretical foundation for analysis and interpretation of
fracture directions on small asteroids with properties similar to those of Bennu. For our
simulations, a thermo-mechanical model will be used to predict stresses on Bennu’s boulders
and an appropriate crack propagation method based on principles of fracture mechanics.
     The paper is organised as follows. In Section 2, the developed thermomechanical model
is presented. This section also reviews crack growth direction theory using an energetic
approach for linear thermoelasticity fracture mechanics problems. One simple example is
presented in Section 3 to show the accuracy of the proposed method when calculating the
crack propagation direction due to the presence of thermal gradients. The results are com-
pared against observed crack propagation directions on asteroid Bennu. In section 4 the
computed crack propagation directions are discussed. Finally some concluding remarks are
presented in Section 5.

2     Methods
Primary goal of this work is to compute the direction of crack propagation due to thermal
strain in a geometry corresponding to a typical boulder on the surface of the asteroid (101955)
Bennu, the target of NASA’s sample return mission OSIRIS-REx. Here it is made the
hypothesis that most of the fractures observed on the surface of the boulders by [16], [18],
and [39] are due to the growth of surface cracks. [34] also discuss stresses inside boulders
that could cause cracking deep inside the rock mass.
    The geometry of our problem is schematised in Fig. 1, where it is shown a cubic-like
boulder extruding from the equator of the asteroid, of which only about half of the equatorial
belt is simulated.
    The mesh is divided in triangular facets. A thermophysical model [40] is used to calculate
the temperatures of all facets as a function of time, as described in the following sections.

                                               3
East view           West view
            a’         North                                                            a’
           a” E                                                                     W a”

                  Rotation direction

 West                                          East       West                                    East

Figure 1: Schematic representation of the cubic-like boulder extruding from the equator
of the asteroid, of which only about half of the equatorial belt is simulated to obtain the
temperature distribution on faces E and W.

The temperatures of the boulder facets are then used in a thermoelastic model in order to
compute the strain and stresses as a function of the position in the boulder and time. Next,
fracture mechanics theory is used to estimate the propagation direction of a tiny notch that
is placed on the horizontal (a’, a”) face of the cubic boulder. This is done by computing the
strain energy release rate 1 , which is a well-known fracture mechanics parameter [41]. The
implemented thermoelastic model as well as the used methodology for the computation of
the energy release rate (G) are explained in the following sections.

2.1     Thermo-physical model
The first step of the presented method consists in using a well-established thermophysical
model [42, 40] to solve the one-dimensional heat diffusion problem. Temperature is calculated
as a function of time for all the surface elements of the mesh depicted in Fig. 1. Boundary
conditions are given by the variable day/night illumination including the shadows cast by
the local terrain of the mesh on itself, radiation of the heat in space, conduction in the
sub surface, and mutual heating [43]. The physical parameters of the material used in this
work are given in Table 1. These properties were taken from [20]. They correspond to the
Carbonaceous Chondrite sub-type CM2 Murchison meteorite. This is considered to be a
good analog of asteroids belonging to the C-complex broad spectroscopic class [44]. The
asteroid Bennu also belong to the C-complex [45].

2.1.1    Thermoelastic model
Delbo et al. [39] observed and mapped cracks on boulders on the surface of the asteroid Bennu
using OSIRIS-REx images that can be approximated as parallel to the local surface of the
  1
    The strain energy release rate represents the change of elastic strain energy per unit area of crack
extension.

                                                      4
Quantity name, symbol Units Value Reference
Rotational period, P s 15,469.2 [1]
Bulk modulus, K MPa 29,000 [2]
Shear modulus, µ MPa 18,000 [2]
Young modulus, E MPa 44,742.857 [2]
Poisson’s ratio, ν 0.2428 [2]
Bulk density, ρ kg m−3 1,662 [2]
Thermal conductivity, λ W mm−1 K−1 5 × 10⁻⁴ [2]
Thermal expansion coefficient, α K−1 8.5 × 10⁻⁶ [2]
Heat capacity, c J kg−1 K−1 500 [2]
Reference temperature, Tref K√ 250 [3]
Paris pre-factor, C m [MPa m]−n 3 × 10⁻⁴ [2]
Paris exponent, n 3.84 [2]
Table 1: Thermal and mechanical properties and their default values used in this work for
the simulations of the crack propagation directions on asteroid Bennu. References: [1] =
[46], [2] = [20], [3] = this work.
asteroid. On the other hand [20], [25] and [26] considered cracks propagating perpendicularly
to the local surface. For this reason, current work is interested in the component of the crack
growth parallel to the local surface of the asteroid, namely the plane perpendicular to the
X-axis of the mesh of Fig. 1. To study this case, a 2-D model where the initial crack is
placed on the a’ and a” facets of Fig. 1 is used. These two facets are treated together in
the following as the single planar face that is called “a-face” (Fig. 2). The separation of the
a-face in two facets is required to make the implemented thermo-phyisical model, that uses
triangular facets only, compatible with the meshing algorithm.
The vertical E and W facets of the 3D mesh of the thermo-physical model (Fig. 1) are
respectively mapped to the vertical right and left sides of the beam simulated by the proposed
thermoelastic and fracture mechanics model (Fig. 2).
The crack propagation on the a-face is essentially driven by the 2D temperature gradient
created by the strong temperature mismatch between the E- and W-face, it will be explained
later on in Section 3. These temperature gradients exist throughout the whole day/night
cycles and strongly depend on time. There is also a component of the temperature gradient
perpendicular to the a-face, which causes crack propagation in the sub-surface. This com-
ponent has been studied by [20], [26] and [25] providing laws to estimate the crack growth
rate in that direction.
Here, therefore, only the temperature gradient is considered in the a-face. To do so, the
heat diffusion equation is used to calculate the temperature as a function of space and time
in the a-face given as boundary conditions the temperatures on the E- and W-faces, which
are determined by the asteroid thermo-physical model.
When temperature variation takes place inside an elastic continuum, it generally induces
thermal stresses. This phenomenon can be taken into account through the linear addition
of thermal strains to mechanical ones. Once the thermal problem has been solved, the effect
5Figure 2: Geometry and boundary conditions for the face of the boulder parallel to the
surface. Crack tip position and crack axis were varied. The length of the a-face is also varied
in our simulations.
of the temperature variation on the mechanical response of the body can be included in the
total strain (), which can be decomposed into an elastic, plastic and thermal part, as it is
shown in equation (1):
ij = elastic
ij + plastic
ij + thermal
ij ; (1)
where ij is the total strain tensor, elastic
ij , plastic
ij and thermal
ij are respectively, the elastic,
plastic and thermal strain tensors. In this work it is assumed that there is no plastic strain
( plastic
ij = 0). Therefore, equation (1) simplifies into:
ij = elastic
ij + thermal
ij ; (2)
where thermal strain is defined as:
thermal
ij = α∆T δij , where ∆T = T − Tref (3)
In equation (3), α is the thermal expansion coefficient [K −1 ], ∆T is the difference between
the computed temperature and the reference temperature, latter one being the temperature
where there is no strain. Finally δij is the Kronecker delta (δij = 0 for i 6= j, δij = 1 for i =
j). It is assumed that the reference temperature is the average of the temperatures given in
Section 3. It is also assumed an isotropic thermal expansion coefficient.
In the presented method a weak thermomechanical coupling is assumed. Which means
that the temperature is initially obtained from the heat problem and then introduced into
the mechanics computation. This is possible since the characteristic time scale of the thermal
problem is several orders of magnitude greater than the characteristic time scale of the crack
propagation problem. For the solution of a thermoelastic problem, first, the temperature
distribution inside the body is computed by solving the heat transfer problem. Then, the
resulting temperature distribution is input to the mechanical problem as an initial strain. In
elasticity, the Hooke’s law for homogeneous and isotropic materials is defined by Equation
(4):
6σij = λδij kk + µ(ij + ji ) (4)
where σij is the stress tensor and λ and µ are respectively, the Lamé’s first and second
parameters. When thermal strain is included, Equation (4) becomes:
σij = λδij (kk − 3α∆T ) + 2µ(ij − α∆T δij ) (5)
2.2 Energy Release Rate (G)
Crack propagation requires energy. The amount of energy released during the fracture
process is known as energy release rate (G). Commonty, G is widely used in the literature
in order to find the crack propagation direction for a given configuration. To compute the
crack propagation direction, a criterion based on the azimuthal distribution of the energy
release rate around the crack tip is used. Multiple crack propagation directions are tested
and then select the one that maximises G. Namely, in the plane of the a-face, the azimuth
of the maximum energy release rate is identified, as it is known that crack propagation will
take place in that direction. This method was tested and validated in Uribe-Suárez et al.
[47].
The G-value is evaluated using all virtual and kinematically admissible crack length
displacements. The direction of crack propagation (θ0 ) can be determined by:
dG
= 0,
dθ2 θ=θ
0 (6)
d G
dθ2 ≤ 0.
θ=θ0
In equation (6), according to the work done by Erdogan and Sih [48], there is a limit angle
corresponding to pure shear: θ = ±70.54◦ . In this work, for the computation of the energy
release rate (G), the numerical technique known as Gθ method [49] is used. The Gθ method’s
implementation is quite simple and multiple extensions are available.
The strain energy release rate is the decrease in the total potential energy (wp ) during
a growth of crack area (dA). To determine the variation of the total potential energy in
cracked solid Ω, F ε is defined as an infinitesimal geometrical perturbation ε in the vicinity
of the crack tip:
F ε : R3 → R3
(7)
∀M ∈ Ω, F ε (M ) = M ε = M + εV(M )
where the virtual field V gives the location of each point of the perturbated solid using its
initial position (M ) before the perturbation. When the perturbation ε is sufficiently small,
Destuynder et al. [49] showed that the stress field (σ) and the displacement field (u) on the
perturbed configuration may be expressed as:
σ ε = σ + εσ 1
(8)
uε = u + εu1
7where σ 1 and u1 are the first order variations of the stress and displacement fields during
the infinitesimal perturbation ε on Ω. The total potential energy variation during a crack
extension is then obtained when ε aims towards 0:
dWp Wpε − Wp
= lim (9)
da ε→0 ε
The virtual displacement field V representing the virtual kinematics of the crack has the
following properties:
• V is parallel to the crack plan.
• V is normal to the crack front.
• The support of V is only needed in the vicinity of the crack.
• kVk is constant in a defined region around the crack tip.
When implementing the Gθ method, first, it should be defined two contours C1 and C2
around the crack tip. Those contours divide this region into three domains Cint , Cring and
Cext as it is shown in Fig. 3.
Figure 3: Contours and domains used to computed G using the Gθ method.
The virtual displacement field, V(v1 , v2 ), is defined by equation (10).
AB
v1 = 1 − AC cos(θ)
V= (10)
v2 = 1 − AB
sin(θ)
AC
Where O is the crack tip, B is an integration point belonging to the ring, A and C are the
intersections between OB and C1 and C2 respectively (inside and outside contours of the
ring); and θ is the virtual direction of propagation measured with respect to the crack axis.
Propagation direction is defined as a function of an angle θ. Hence the values of V in the
three domains are:
• The norm of V in Cint is constant and equal to 1.
8• The norm of V in Cring varies continuously from 1 to 0.
• The norm of V in Cext is equal to 0.
When there is neither thermal strain nor load applied directly to the crack faces, the
total potential energy may be expressed as:
Z Z
1
Wp = σij Uj,i dΩ − fi Ui dΩ (11)
2 Ω Ω
where σij is the stress field, Ui is the displacement field, and fi the external loads. When
an infinitesimal perturbation ε takes place, derivatives and integrals on the perturbed part
can be expressed using a first order “limited development” of operations related to the non-
perturbed part. Due to this, the energy release rate may be expressed as:
Z
1
G= σij Uj,k Vk,i − σij Uj,i Vk,k dAring (12)
ring 2
where Vi is the virtual displacement field, Uj,k is the gradient of the displacement field,
Vk,i is the gradient of the virtual displacement field, Vk,k is the divergence of the virtual
displacement field and Aring is the integration region. Additionally, as Vi varies only inside
Cring , the integration will only be performed over Cring (Aring ). In Fig. 4-a, elements
belonging to Cring are marked with a green dot. A discrete set of θ values will be used
for a virtual crack propagation. The θ values are selected inside the range [−70◦ , 70◦ ] [48]
with respect to the crack axis. For each one of the θ values, an associated G value will be
computed. In Fig. 4-a the virtual ring in which all the integration points are considered
is depicted. Fig. 4-b shows that G can be computed for each value of θ, which makes
the identification of the θ value that maximises G(θ) straightforward. Fig. 4-b shows the
curve G(θ) for a crack where its crack axis is equal to 90◦ (E), in this case the direction of
propagation is equal to 120◦ (NW - SE).
Figure 4: a) Ring of elements around the crack tip. b) G(θ) curve for the maximun energy
release rate criterion for a crack where its crack axis equal to 90◦ .
Furthermore, due to the presence of thermal strain in this work, the inclusion of additional
terms in the Gθ method is necessary. In elasticity according to Hooke’s law, the stress and
strain tensors can be defined as follows:
9σij = Cijkl kl (13)
where Cijkl is the fourth-order elastic constitutive tensor. Combining equations (13), (2) and
(3) leads to the definition of the stress tensor taking into account thermal strain:
σij = Cijkl (kl − α∆T δkl ) (14)
When thermal strain is accounted for, equation (8) is still valid. Therefore, according to
Suo and Combescure [50], Brochard and Suo [51], the equation for the Gθ method in the
present of thermal strain is given:
Z
1
G= σij Uj,k Vk,i − σij (Uj,i − α∆T δij ) Vk,k + ασii T,j Vj dAring (15)
ring 2
where α is the thermal expansion coefficient, ∆T (∆T = T − Tref ) is the difference between
the computed temperature and the reference temperature, δij is the Kronecker delta and T,j
is the gradient of the temperature. A schematic representation of the sequential solution of
the thermomechanical problem presented in this work is provided in Fig. 5.
Figure 5: Schematic representation for the thermoelastic fracture analysis performed in this
work.
2.3 Fatigue crack growth model
For linear elastic materials, K and G are uniquely related as follows [52]:
10 0
K2 K2 K2 E = E
for plane stress
0
G = I0 + II0 + III with E
E = 1−ν 2 for plane strain (16)
E E 2µ E
µ = 2(1+ν)
where G is the energy release rate, KI , KII and KIII are respectively the stress intensity
factors for mode I, mode II and mode III, E is the Young modulus, ν is the Poisson’s ratio
and µ is the shear modulus. Due to the fact that present work deals with thermal cyclic
stress (tension-compression), only mode I loading is assumed. Once the energy release rate
(G) is known, it is possible to compute the stress intensity factor (KI ). Assuming plane
strain conditions, a relation between G and KI can be stated from equation (16):
r
GE
KI = (17)
1 − ν2
where KI is the stress intensity factor, G is the energy release rate, E is the Young modulus
and ν is the Poisson’s ratio. Paris’s Law [53] allows to relate the rate at which the crack
length (a) grows as a function of the number of cycles (N ) to the maximum variation of
stress intensity factor (∆KI ) over the whole cycle. Paris’s law is presented in equation (18):
da
= C[∆KI ]n (18)
dN
where a is the crack length [m], N the number of cycles [−], ∆KI the range of stress intensity
factor [P a m0.5 ], C [m (P a m0.5 )−n ] and n [−] are material properties fitted to experimental
fatigue data.
The beam presented in Fig. 2, also referred as the a-face in this work, is embedded in a
mesh that is different from the one showed in Fig. 1. The aforementioned mesh is an isotropic
unstructured triangular one, that is refined in the neighborhood of the crack tip (Fig. 4-
a). The thermoelasticity problem is solved on this mesh through the finite element method
(FEM). The developed thermoelastic model has been implemented in CimLib, a C++ in-
house finite element library developed at CEMEF [54]. Regarding the thermal problem, the
available finite element framework in CimLib is a classic one where the variable temperature
(T ) is solved through an implicit formulation [55]. The mechanical problem is solved using
an implicit formulation (mixed) with first-order elements using linear interpolation functions
for both velocity and pressure. In this formulation both variables are P 1. This element
combination, linear in both → −v and p (P 1/P 1), does not satisfy the inf − sup condition [56,
57]. The latter, being a condition related with the mathematical convergence characteristics
of the finite element formulation. The inf − sup condition ensures the solvability, stability
and optimality of the finite element solution and is crucial in establishing its quality [58].
Through the inf − sup condition, a problem can be assessed in order to see if it is well-posed
or not. A problem is called well-posed if: (i) a solution exists, (ii) the solution is unique and
(iii) the solution depends continuously on the given data (in some reasonable topology) [59].
To overcome this issue, an extra degree of freedom (DOF) in the center of each element is
added in → −v . This extra DOF is condensed and thus written as a function of the remaining
DOFs of the element. The use of this extra DOF is a well-known stabilization technique
11often called “bubble” or P 1+ /P 1. This technique satisfies the inf − sup condition, and has
been implemented in the CimLib [60, 61].
3 Results
In this work, the simulations begin by calculating temperatures for the mesh of Fig. 1 using
the asteroid thermophysical model described in section 2. The asteroid is placed at a distance
of 1.12 au from the sun. This corresponds to the semi major axis of the orbit of the asteroid
Bennu. The resulting temperatures of the E- and W-faces are shown in Fig. 6. Next, these
temperatures are input into the thermo-mechanical model. This second model predicts the
stress over the domain of the a-face as a function of space and time. Since the presence of
cracks highly affects the stress field, different simulations for different crack positions and
orientations for the same temperature fields are run.
Figure 6: Temperatures TW (W-face) and TE (E-face) used as thermal boundary conditions.
Namely, the propagation direction for an initial crack in different positions inside the
domain of the a-face is computed, as shown in Fig. 2. In addition, for each position of each
initial crack, its orientation is varied. Namely, when the crack is attached to the W-face the
crack propagation direction is computed for different initial orientations with azimuth angles
ranging from 46◦ to 134◦ . Azimuth angle is increasing clockwise (i.e. from the north to the
east) and is equal to zero when it is pointing vertical up (i.e. to the north). When the crack
is attached to the E-face, the crack propagation direction is simulated for different initial
crack orientations having azimuth angles ranging from 226◦ to 314◦ . Finally, when the crack
is attached to the north (top) side of the a-face (also called beam), the crack propagation
direction is simulated for different initial crack orientations with azimuth angles ranging
12from 136◦ to 224◦ . In all the described cases, the length and the width of the a-face were
fixed to 100 mm and 4 mm respectively. These values were chosen after studying: (i) the
characteristic time of the thermal problem as well as (ii) the minimum required width of
the a-face in order to avoid the boundary effects on the results and (iii) to avoid a high
computational cost. Due to the fact that there is no temperature gradient in the vertical
direction in the aforementioned simulations, a larger height of the domain does not affect
initial crack propagation direction. Similarly, this work does not intend to evolve the crack
with time.
The results are presented using the so-called windrose diagrams, which can be considered
as circular histograms that represent the distribution of the computed crack propagation
directions. It should be noticed that for a rotation of 180◦ of the circular histograms (win-
droses) these are identical. This is due to the fact that crack propagation direction (azimuthal
angle) has to be independent of the beginning and ending point of a crack, i.e., for each one
of the computed crack propagation directions θ, in the histograms there are also count the
direction θ + 180◦ . For the scenario where crack propagation direction is computed for an
initial crack tip placed in different positions inside the domain of the a-face and for different
crack orientations, the windroses are presented separately.
Figure 7a shows the windrose diagram for the case of a crack attached to the W-face.
Computed crack propagation directions are preferentially oriented in the North-West to
South-East (NW-SE) direction, regardless of the initial different orientations of the cracks
taken into account. Furthermore, a minimum number of computed crack propagation direc-
tions are oriented East (E) to West (W). In Fig. 7b it is shown the windrose diagram for the
case of a crack attached to the E-face. In this case the preferential orientation of the com-
puted crack propagation directions is in the North-East to South-West (NE-SW) direction.
There are also few cracks propagating in a direction aligned East (E) - West (W). The last
case, where the crack is attached to the north (top) is shown in Fig. 7c. According to the
windrose diagram, the preferential orientation of the computed crack propagation directions
is in the North to South (N-S) direction.
(a) W-face (b) E-face (c) north (top)
Figure 7: Windrose diagrams for different crack orientations and cracks attached to a) the
W-face, b) the E-face and to c) the north.
Finally in Fig. 8 it is presented a windrose diagram that gathers all the cases described
13above. In summary, the distribution of all the computed crack propagation directions are
preferentially oriented in a higher concentration in the North to South (N-S), in the North-
West to South-East (NW-SE) and in the North-East to South-West (NE-SW) directions as
it was already described.
Figure 8: Windrose diagram gathering the cases where crack is attached to the W-face, to
the E-face and to the north (top) for different crack orientations.
It is noted that the cracks simulated up to now have a length considerably smaller than the
ones observed on the boulders on the surface of Bennu [19, 16, 18, 17, 39]. In the following,
the crack propagation direction is studied as a function of the initial crack size. From the
different configurations shown in Fig. 2, it was selected the case for the crack attached to
the E-face. For this, crack propagation direction is computed by placing the crack tip at 3
different positions inside the domain of the a-face; for each one of this positions 3 different
lengths of the a-face were used; for each one of these cases the orientation of the crack was
varied as it was done in the previous simulations.
we varied the orientation of the crack as it was done in the previous simulations.
2
Figure 9 shows that for a small crack length ( |sin azimuth| mm), increasing the length of the
a-face does not play an important role in the distribution of the computed crack propagation
directions. Computed crack propagation directions are preferentially oriented in the North-
East to South-West (NE-SW) direction, with a few amount of computed crack propagation
directions going to the East (E) and to the West (W).
In Fig. 10, it is possible to see that when increasing the length of the a-face for cracks
20
whose lengths are |sin azimuth| mm, the distribution of the computed crack propagation direc-
tions oriented in the North to South (N-S) direction decreases, while the cracks oriented in
the North-East to South-West (NE-SW) direction increase. It should also be noted that the
14(a) a-face length: 200 mm (b) a-face length: 500 mm (c) a-face length: 1000 mm
Figure 9: Windrose diagrams for a crack attached to the E-face when crack length equals to
2
|sin azimuth|
mm and the length of the beam was varied for different crack orientations.
amount of cracks directed to the East (E) and the West (W) decreases when increasing the
length of the a-face from 500 mm to 1000 mm.
(a) a-face length: 200 mm (b) a-face length: 500 mm (c) a-face length: 1000 mm
Figure 10: Windrose diagrams for a crack attached to the E-face when crack length equals
20
to |sin azimuth| mm and the length of the beam was varied for different crack orientations.
Finally, in Fig. 11 it is presented the windrose diagrams for a configuration where crack
200
length is equal to |sin azimuth| mm. Taking into account that the length of the a-face took the
values of 200 mm, 500 mm and 1000 mm, for this last case, the configuration of the a-face
with a length equal to 200 mm was not simulated. Fig. 11 shows that when increasing
the length of the a-face from 500 mm to 1000 mm, a redistribution of the computed crack
propagation directions takes place. The initially cracks preferentially oriented in the North-
East to South-West (NE-SW) direction changed their orientation into the North-West to
South-East (NW-SE) direction.
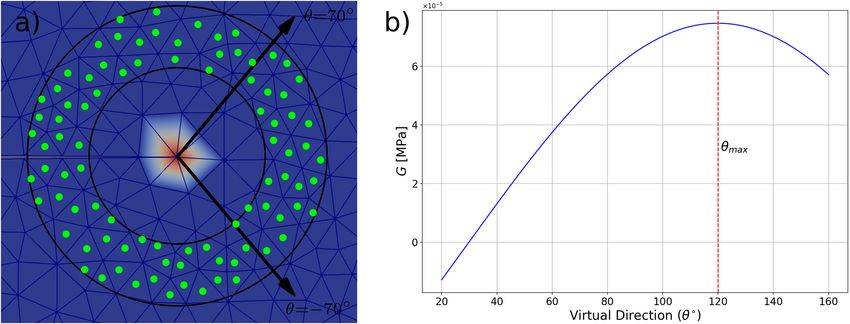
Figure 12 shows the stress field through the maximum principal stress for three cracks
with different orientations: attached to the W-face and directed to the East, attached to
the north face of the boulder and directed to the South, and attached to the E-face of the
15(a) a-face length: 500 mm (b) a-face length: 1000 mm
Figure 11: Windrose diagrams for a crack attached to the E-face when crack length equals
200
to |sin azimuth| mm and the length of the beam was varied for different crack orientations.
boulder and directed to the West. It is worth noting that in all the cases, the computed
crack propagation direction (dashed black line), the one that maximises G, is perpendicular
to the direction in which the maximum principal stress takes place (dashed white line). For
all cases, the maximum stress near the crack tip over a temperature cycle exceeds some MPa,
which is a significant fraction of the typical strength of carbonaceous chondrites and even
comparable to the strength of boulders on Bennu [62]. This indicates that cracks propagate
under these stresses. Although it should be noted that, theoretically, the stress at the crack
tip is supposed to be almost infinity (∞), it depends a lot on the mesh size. The use of
quarter-point elements [63] is recommended for better accuracy of the stress field.
To study whether the crack is propagating it can also be used the typical approach of
thermal fatigue and determine the crack growth length per cycle using the Paris’ law. To do
so, the configuration in which the crack is attached to the W-face was chosen. Additionally,
it was selected an orientation of the crack (azimuthal angle) equal to 90◦ , i.e. pointing to the
east. In this case, as the maximum energy release rate (Gmax ) is known, and assuming plane
strain conditions, it is possible to compute the maximum stress intensity factor (KImax ) using
equation (17). In this case, Gmax in the thermal cycle is equal to 5.15 × 10⁻⁴ [M P a . mm],
therefore, using equation (17), KI is equal to 4.95 [M P a . mm0.5 ]. Due to the fact that in
this work it is dealt with stresses generated by thermal cycles, the crack tip is subjected to
both tensile and compressive stresses over a full cycle. Thus, ignoring crack closure [64], the
lowest stress intensity factor experienced by the crack tip is simply zero. According to this, it
follows that ∆KI is equal to 4.95 [M P a . mm0.5 ]. For the case where constant crack growth
is assumed, it can be computed that for the presented thermal cycle, the crack growth rate
is 2.42 × 10⁻⁴ [mm . cycle−1 ], which is of the order of 0.5 [mm . yr−1 ] (or ∼ 0.5[m] in
thousand years), in good agreement with previous studies [20]. This indicates that cracks
16Figure 12: Maximum principal stress (M P a) for a crack attached to a) the W-face, b) the
E-face and to c) the north (top). In all cases, the dashed black line represents the computed
crack propagation direction, while the dashed white line represents the axis associated with
the maximum principal stress.
would propagate on Bennu’s boulders solely due to diurnal thermal stresses. It is cautioned
here that crack propagation is a non linear process, where the rate of propagation is among
other parameters a function of the position of the crack tip with respect to the temperature
gradient. This means that a full simulation of the crack growth from the beginning until
its size is comparable to the size of the hosting boulder should be carried out in order to
estimate the time required to fracture the boulder, which is beyond the scope of this paper.
4 Discussion
We begin to notice that in Fig. 7a, 7b and 7c, the range of computed crack propagation
directions is preferentially concentrated in some sectors of the windrose diagrams. This
could be explained by the fact that when a crack orientation is defined, the range of possible
17crack propagation directions, is determined by the limit angle corresponding to pure shear
defined in the work of [48]. This value is approximately ±70◦ with respect to the crack axis
orientation. It should also be noted that, the crack was only placed at three different places
inside the domain, i.e. attached to the East, the West faces and attached to the North rim of
the domain. This means that not all the angles belonging to the range [0◦ , 360◦ ] were taken
into account. For example, in Fig. 7b, i.e., for the case of a crack attached to the E-face,
the computed crack propagation directions range from 202.5◦ to 292.5◦ . From this figure, it
is worth noting that most of the computed direction are oriented to the South-West (SW),
and due to the already explained symmetry of the wind rose, the preferential orientation
of the computed crack propagation directions is in the North-East to South-West (NE-SW)
direction.
When plotting the windrose diagrams for the three evaluated cases (crack attached to
the E-, W-face and the north rim of the domain) in the same graph, as shown in Fig. 8,
the sector grouping the majority of the computed directions is the one oriented in the North
to South (N-S) direction, followed by the groups oriented in the North-West to South-East
(NW-SE) and in the North-East to South-West (NE-SW) directions, respectively. Looking
at the results of the three simulated cases, it is worth noting that cracks on asteroid Bennu
propagate mainly in the North-South (N-S) direction.
In Fig. 12 it should be noticed that the computed crack propagation directions in the
three cases presented there, are perpendicular to the axis of the maximum principal stresses,
as stated by the literature. This makes us feel confident about the results coming out from
the coupled thermoelastic model with the linear elastic fracture mechanics approach that was
implemented in this work. Additionally, it is worth mentioning that our model to compute
crack propagation direction was validated in previous work [47].
From Fig. 9 it can be noticed that for short crack lengths, the increasing of the length
of the a-face does not highly affect the tendency of the distribution of the computed crack
propagation directions. Cracks mainly continue propagating oriented in the North-East to
South-West (NE-SW) direction. When increasing the length of the a-face from 500 mm to
1000 mm, a few amount of cracks changed its orientation into the North-West to South-East
(NW-SE) direction. It tells us that even if the temperature gradient along the a-face changes,
cracks of short length are not affected.
According to Fig. 10, when crack length increases, a redistribution of the computed
directions takes place. It is possible to see two main groups, one oriented almost in the
North to South (N-S) direction and another one oriented almost in the West to East (W-E)
direction. Meanwhile, for the case when the crack length is very long compared with the
length of the a-face, as depicted in Fig. 11, a marked tendency is clearly observed. Computed
crack propagation directions are preferentially oriented in the North-West to South-East
(NW-SE) direction, which is consistent with the observations performed by Delbo et al. [39].
Taking into account that the duration of the thermal cycle used in this work is 4.3 h,
and assuming a constant crack propagation rate, the crack growth rate computed here,
whose value is 2.42 × 10⁻⁴ [mm . cycle−1 ], is equivalent to a crack growth rate of about
0.5 [mm . year−1 ]. This value is not quite different from the one measured by Delbo et al.
[20] through laboratory experiments on two meteorites: a carbonaceous chondrite and an
ordinary chondrite. However, as stated in Delbo et al. [20], the crack propagation rate is
typically a nonlinear function between the crack size, the maximum variation of the stress
18intensity factor over the whole cycle and material properties. However, considering that
this work is a first attempt to describe crack growth due to thermal fatigue, the results are
promising.
5 Conclusion
An approach to compute 2D crack propagation direction under the presence of thermal gra-
dients has been presented. It combines thermoelasticity and linear elastic fracture mechanics
theories in order to compute crack propagation directions driven by diurnal temperature cy-
cling and under conditions similar to those existing on the asteroid Bennu. Through the
different scenarios simulated in this work, the robustness and the accuracy of the proposed
approach in terms of crack propagation direction is shown.
It is found that the distribution of the computed crack propagation directions for different
configurations on a simple domain simulating Bennu’s boulders, show a preferential direction
from North to South (N-S) and from North-East to South-West (NE-SW) for shorter cracks.
For longer cracks, the preferential direction is from North to South (N-S) and from North-
West to South-East (NW-SE). This conclusion is supported by observations performed by
[39].
According to the results obtained by means of our thermomechanical model combined
with a well-known fatigue model (Paris’s law) and assuming constant crack growth length, it
is found that on asteroid Bennu cracks grow at rate approximately equal to 0.5 [mm . year−1 ].
This is a value very similar to the one found on experiments perform in the work of Delbo
et al. [20], giving us a good insight of the promising approach proposed.
However, it is cautioned that crack propagation is a highly non-linear process. In order
to estimate the time to fracture Bennu’s meter-sized rocks a full-blown simulation shall be
performed to calculate the crack growth rate at different crack growth stages. This is really
important because crack growth rate highly depends on the geometry and on the stress
intensity factor at the crack tip, and those will change as the crack tip evolves trough the
domain.
Acknowledgements
We acknowledge support from Academies of Excellence on Complex Systems and Space, En-
vironment, Risk and Resilience of the Initiative d’EXcellence ”Joint, Excellent, and Dynamic
Initiative” (IDEX JEDI) of the Université Côte d’Azur and the Center for Planetary Origin
(C4PO) A Material approach (https://www-n.oca.eu/morby/C4PO/C4PO-home.html). We
also acknowledge support from The DIGIMU ANR industrial chair (https://chaire-digimu.
cemef.mines-paristech.fr/) as well as support from the French space agency CNES.
References
[1] R.-H. Cao, P. Cao, H. Lin, X. Fan, C. Zhang, and T. Liu. Crack initiation, propagation,
and failure characteristics of jointed rock or rock-like specimens: A review. Advances
19in Civil Engineering, 2019:1–31, 02 2019. doi: 10.1155/2019/6975751.
[2] A. Al-Mukhtar and B. Merkel. Simulation of the crack propagation in rocks using
fracture mechanics approach. Journal of Failure Analysis and Prevention, 15:90–100,
01 2015. doi: 10.1007/s11668-014-9907-2.
[3] M. Wang, F. Wang, Z. Zhu, Y. Dong, M. Mousavi Nezhad, and L. Zhou. Modelling
of crack propagation in rocks under shpb impacts using a damage method. Fatigue &
Fracture of Engineering Materials & Structures, 42(8):1699–1710, 2019. doi: 10.1111/
ffe.13012. URL https://onlinelibrary.wiley.com/doi/abs/10.1111/ffe.13012.
[4] B. K. Atkinson. Subcritical crack propagation in rocks: theory, experimental re-
sults and applications. Journal of Structural Geology, 4(1):41 – 56, 1982. ISSN
0191-8141. doi: https://doi.org/10.1016/0191-8141(82)90005-0. URL http://www.
sciencedirect.com/science/article/pii/0191814182900050.
[5] Vastola, G. Asymmetric crack propagation near waterfall cliff and its influence on the
waterfall lip shape. EPL, 96(4):49002, 2011. doi: 10.1209/0295-5075/96/49002. URL
https://doi.org/10.1209/0295-5075/96/49002.
[6] M.-C. Eppes, A. Willis, J. Molaro, S. Abernathy, and B. Zhou. Cracks in Martian
boulders exhibit preferred orientations that point to solar-induced thermal stress. Nature
Communications, 6:6712, March 2015.
[7] B. D. Collins and G. M. Stock. Rockfall triggering by cyclic thermal stressing of exfo-
liation fractures. Nature Geoscience, 9(5):395–400, May 2016.
[8] B. D. Collins, G. M. Stock, M.-C. Eppes, S. W. Lewis, S. C. Corbett, and J. B. Smith.
Thermal influences on spontaneous rock dome exfoliation. Nature Communications, 9
(1):762, February 2018.
[9] H. Viles, B. Ehlmann, C. F. Wilson, T. Cebula, M. Page, and M. Bourke. Simulating
weathering of basalt on Mars and Earth by thermal cycling. Geophysical Research
Letters, 37(1):18201, September 2010.
[10] O. Ruesch, E. Sefton-Nash, J. L. Vago, M. Küppers, J. H. Pasckert, K. Krohn, and
K. Otto. In situ fragmentation of lunar blocks and implications for impacts and solar-
induced thermal stresses. Icarus, 336:113431, January 2020.
[11] Y. Li, A. T. Basilevsky, M. Xie, and W.-H. Ip. Shape of boulders ejected from small
lunar impact craters. Planetary and Space Science, 145:71–77, October 2017.
[12] N. Attree, O. Groussin, L. Jorda, S. Rodionov, A. T. Auger, N. Thomas, Y. Brouet,
O. Poch, E. Kührt, M. Knapmeyer, F. Preusker, F. Scholten, J. Knollenberg, S. Hviid,
and P. Hartogh. Thermal fracturing on comets. Applications to 67P/Churyumov-
Gerasimenko. Astronomy and Astrophysics, 610:A76, March 2018.
20[13] C. Matonti, N. Attree, O. Groussin, L. Jorda, S. Viseur, S. F. Hviid, S. Bouley,
D. Nébouy, A. T. Auger, P. L. Lamy, H. Sierks, G. Naletto, R. Rodrigo, D. Koschny,
B. Davidsson, M. A. Barucci, J. L. Bertaux, I. Bertini, D. Bodewits, G. Cremonese,
V. Da Deppo, S. Debei, M. De Cecco, J. Deller, S. Fornasier, M. Fulle, P. J. Gutiérrez,
C. Güttler, W. H. Ip, H. U. Keller, L. M. Lara, F. La Forgia, M. Lazzarin, A. Luc-
chetti, J. J. Lopez Moreno, F. Marzari, M. Massironi, S. Mottola, N. Oklay, M. Pajola,
L. Penasa, F. Preusker, H. Rickman, F. Scholten, X. Shi, I. Toth, C. Tubiana, and
J. B. Vincent. Bilobate comet morphology and internal structure controlled by shear
deformation. Nature Geoscience, 12(3):157–162, February 2019.
[14] M. El Maarry, N. Thomas, A. Gracia Berná, R. Marschall, A. Auger, O. Groussin,
S. Mottola, M. Pajola, M. Massironi, S. Marchi, S. Höfner, F. Preusker, F. Scholten,
L. Jorda, E. Kührt, H. Keller, H. Sierks, M. A’Hearn, C. Barbieri, M. Barucci,
J. Bertaux, I. Bertini, G. Cremonese, V. Da Deppo, B. Davidsson, S. Debei,
M. De Cecco, J. Deller, C. Güttler, S. Fornasier, M. Fulle, P. Gutierrez, M. Hofmann,
S. Hviid, W. Ip, J. Knollenberg, D. Koschny, G. Kovacs, J. Kramm, M. Küppers,
P. Lamy, L. Lara, M. Lazzarin, M. J. Lopez, F. Marzari, H. Michalik, G. Naletto,
N. Oklay, A. Pommerol, H. Rickman, R. Rodrigo, C. Tubiana, and J. Vincent. Frac-
tures on comet 67p/churyumov-gerasimenko observed by rosetta/osiris. Geophysical
Research Letters, 42(13):5170–5178, 2015.
[15] A. J. Dombard, O. S. Barnouin, L. M. Prockter, and P. C. Thomas. Boulders and
ponds on the asteroid 433 eros. Icarus, 210(2):713 – 721, 2010. ISSN 0019-1035. doi:
https://doi.org/10.1016/j.icarus.2010.07.006. URL http://www.sciencedirect.com/
science/article/pii/S0019103510002782.
[16] D. S. Lauretta, D. N. DellaGiustina, C. A. Bennett, K. J. Becker, O. S. Barnouin,
W. F. Bottke, C. Y. Drouet d’Aubigny, J. P. Dworkin, J. P. Emery, V. E. Hamilton,
C. W. Hergenrother, M. R. M. Izawa, B. Rizk, K. J. Walsh, C. W. V. Wolner, O.-R.
Team, H. C. Connolly, B. E. Clark, H. Campins, T. L. Becker, W. V. Boynton, C. Y. D.
d’Aubigny, H. L. Enos, D. R. Golish, E. S. Howell, S. S. Balram-Knutson, M. C. Nolan,
H. L. Roper, P. H. Smith, D. J. Scheeres, and H. H. Kaplan. The unexpected surface
of asteroid (101955) Bennu. Nature, 568(7):55–60, March 2019.
[17] K. J. Walsh, E. R. Jawin, R. L. Ballouz, O. S. Barnouin, E. B. Bierhaus, H. C. Connolly,
J. L. Molaro, T. J. McCoy, M. Delbo, C. M. Hartzell, M. Pajola, S. R. Schwartz,
D. Trang, E. Asphaug, K. J. Becker, C. B. Beddingfield, C. A. Bennett, W. F. Bottke,
K. N. Burke, B. C. Clark, M. G. Daly, D. N. DellaGiustina, J. P. Dworkin, C. M. Elder,
D. R. Golish, A. R. Hildebrand, R. Malhotra, J. Marshall, P. Michel, M. C. Nolan,
M. E. Perry, B. Rizk, A. Ryan, S. A. Sandford, D. J. Scheeres, H. C. M. Susorney,
F. Thuillet, D. S. Lauretta, and O.-R. Team. Craters, boulders and regolith of (101955)
Bennu indicative of an old and dynamic surface. Nature Geoscience, 12(4):242–246,
March 2019.
[18] D. N. DellaGiustina, J. P. Emery, D. R. Golish, B. Rozitis, C. A. Bennett, K. N.
Burke, R. L. Ballouz, K. J. Becker, P. R. Christensen, C. Y. Drouet d’Aubigny, V. E.
21Hamilton, D. C. Reuter, B. Rizk, A. A. Simon, E. Asphaug, J. L. Bandfield, O. S.
Barnouin, M. A. Barucci, E. B. Bierhaus, R. P. Binzel, W. F. Bottke, N. E. Bowles,
H. Campins, B. C. Clark, B. E. Clark, H. C. Connolly, M. G. Daly, J. D. Leon, M. Delbo,
J. D. P. Deshapriya, C. M. Elder, S. Fornasier, C. W. Hergenrother, E. S. Howell, E. R.
Jawin, H. H. Kaplan, T. R. Kareta, L. Le Corre, J. Y. Li, J. Licandro, L. F. Lim,
P. Michel, J. Molaro, M. C. Nolan, M. Pajola, M. Popescu, J. L. R. Garcia, A. Ryan,
S. R. Schwartz, N. Shultz, M. A. Siegler, P. H. Smith, E. Tatsumi, C. A. Thomas, K. J.
Walsh, C. W. V. Wolner, X. D. Zou, D. S. Lauretta, and O.-R. Team. Properties of
rubble-pile asteroid (101955) Bennu from OSIRIS-REx imaging and thermal analysis.
Nature Astronomy, 3:341–351, March 2019.
[19] J. L. Molaro, K. J. Walsh, E. R. Jawin, R. L. Ballouz, C. A. Bennett, D. N. DellaG-
iustina, D. R. Golish, C. Drouet d’Aubigny, B. Rizk, S. R. Schwartz, R. D. Hanna, S. J.
Martel, M. Pajola, H. Campins, A. J. Ryan, W. F. Bottke, and D. S. Lauretta. In situ
evidence of thermally induced rock breakdown widespread on Bennu’s surface. Nature
Communications, 11(1):2913–11, June 2020.
[20] M. Delbo, G. Libourel, J. Wilkerson, N. Murdoch, P. Michel, K. T. Ramesh, C. Ganino,
C. Verati, and S. Marchi. Thermal fatigue as the origin of regolith on small asteroids.
Nature, 508(7):233–236, April 2014.
[21] K. Hall. Evidence for freeze-thaw events and their implications for rock weathering in
northern Canada. Earth Surface Processes and Landforms, 29:43–57, January 2004.
[22] D. T. Griggs. The Factor of Fatigue in Rock Exfoliation. The Journal of Geology, 44
(7):783–796, November 1936.
[23] J. L. Molaro, S. Byrne, and L. J. L. Thermally induced stresses in boulders on airless
body surfaces, and implications for rock breakdown. Icarus, 294:247–261, September
2017.
[24] J. L. Molaro, S. Byrne, and S. A. Langer. Grain-scale thermoelastic stresses and spa-
tiotemporal temperature gradients on airless bodies, implications for rock breakdown.
Journal of Geophysical Research: Planets, 120(2):255–277, February 2015.
[25] B. Ravaji, V. Ali-Lagoa, M. Delbo, and J. W. Wilkerson. Unraveling the Mechanics of
Thermal Stress Weathering: Rate-Effects, Size-Effects, and Scaling Laws. Journal of
Geophysical Research: Planets, 124(1):3304–3328, December 2019.
[26] C. El Mir, K. T. Ramesh, and M. Delbo. The efficiency of thermal fatigue in regolith
generation on small airless bodies. Icarus, 333:356–370, November 2019.
[27] K. Hazeli, C. El Mir, S. Papanikolaou, M. Delbo, and K. T. Ramesh. The origins of
Asteroidal rock disaggregation: Interplay of thermal fatigue and microstructure. Icarus,
304:172–182, April 2018.
[28] B. K. Atkinson. Subcritical crack growth in geological materials. Journal of Geophysical
Research: Solid Earth, 89(B):4077–4114, June 1984.
22[29] A. J. Dombard, O. S. Barnouin, L. M. Prockter, and P. C. Thomas. Boulders and ponds
on the Asteroid 433 Eros. Icarus, 210(2):713–721, December 2010.
[30] B. Liang, J. Cuadra, K. Hazeli, and S. Soghrati. Stress field analysis in a stony
meteorite under thermal fatigue and mechanical loadings. Icarus, 335:113381, 2020.
ISSN 0019-1035. doi: https://doi.org/10.1016/j.icarus.2019.07.015. URL http://www.
sciencedirect.com/science/article/pii/S0019103519301484.
[31] H. Yano, T. Kubota, H. Miyamoto, T. Okada, D. Scheeres, Y. Takagi, K. Yoshida,
M. Abe, S. Abe, O. Barnouin-Jha, A. Fujiwara, S. Hasegawa, T. Hashimoto, M. Ishiguro,
M. Kato, J. Kawaguchi, T. Mukai, J. Saito, S. Sasaki, and M. Yoshikawa. Touchdown
of the hayabusa spacecraft at the muses sea on itokawa. Science, 312(5778):1350–1353,
2006.
[32] J. Veverka, P. C. Thomas, M. Robinson, S. Murchie, C. Chapman, M. Bell, A. Harch,
W. J. Merline, J. F. Bell, B. Bussey, B. Carcich, A. Cheng, B. Clark, D. Domingue,
D. Dunham, R. Farquhar, M. J. Gaffey, E. Hawkins, N. Izenberg, J. Joseph, R. Kirk,
H. Li, P. Lucey, M. Malin, L. McFadden, J. K. Miller, W. M. Owen, C. Peterson,
L. Prockter, J. Warren, D. Wellnitz, B. G. Williams, and D. K. Yeomans. Imaging of
small-scale features on 433 eros from near: Evidence for a complex regolith. Science,
292(5516):484–488, 2001.
[33] N. Murdoch, P. Sánchez, S. R. Schwartz, and H. Miyamoto. Asteroid Surface Geo-
physics. in Asteroids IV (P. Michel, et al. eds.) University of Arizona Press, Tucson.,
pages 767–792, 2015.
[34] J. L. Molaro, C. W. Hergenrother, S. R. Chesley, K. J. Walsh, R. D. Hanna, C. W.
Haberle, S. R. Schwartz, R. L. Ballouz, W. F. Bottke, H. J. Campins, and D. S. Lauretta.
Thermal Fatigue as a Driving Mechanism for Activity on Asteroid Bennu. Journal of
Geophysical Research: Planets, 125(8):e06325, August 2020.
[35] D. S. Lauretta, C. W. Hergenrother, S. R. Chesley, J. M. Leonard, J. Y. Pelgrift, C. D.
Adam, M. Al Asad, P. G. Antreasian, R. L. Ballouz, K. J. Becker, C. A. Bennett,
B. J. Bos, W. F. Bottke, M. Brozovic, H. Campins, H. C. Connolly, M. G. Daly, A. B.
Davis, J. de León, D. N. DellaGiustina, C. Y. Drouet d’Aubigny, J. P. Dworkin, J. P.
Emery, D. Farnocchia, D. P. Glavin, D. R. Golish, C. M. Hartzell, R. A. Jacobson,
E. R. Jawin, P. Jenniskens, J. N. Kidd, E. J. Lessac-Chenen, J. Y. Li, G. Libourel,
J. Licandro, A. J. Liounis, C. K. Maleszewski, C. Manzoni, B. May, L. K. McCarthy,
J. W. McMahon, P. Michel, J. L. Molaro, M. C. Moreau, D. S. Nelson, W. M. Owen,
B. Rizk, H. L. Roper, B. Rozitis, E. M. Sahr, D. J. Scheeres, J. A. Seabrook, S. H.
Selznick, Y. Takahashi, F. Thuillet, P. Tricarico, D. Vokrouhlický, and C. W. V. Wolner.
Episodes of particle ejection from the surface of the active asteroid (101955) Bennu.
Science, 366(6), December 2019.
[36] V. Alı́-Lagoa, M. Delbo’, and G. Libourel. Rapid temperature changes and the early
activity on comet 67p/churyumov-gerasimenko. The Astrophysical Journal Letters, 810
(2):L22, 2015.
23You can also read